Evolutionary dynamics of cancer in response to targeted combination therapy
- Harvard University, United States
- Institute of Science and Technology Austria, Austria
- Emmanuel College, United States
- Edinburgh University, United Kingdom
- Harvard College, United States
- Memorial Sloan-Kettering Cancer Center, United States
- Johns Hopkins University School of Medicine; The Sidney Kimmel Comprehensive Cancer Center at Johns Hopkins, United States
- Johns Hopkins Kimmel Cancer Center, United States
Figures
Figure 1
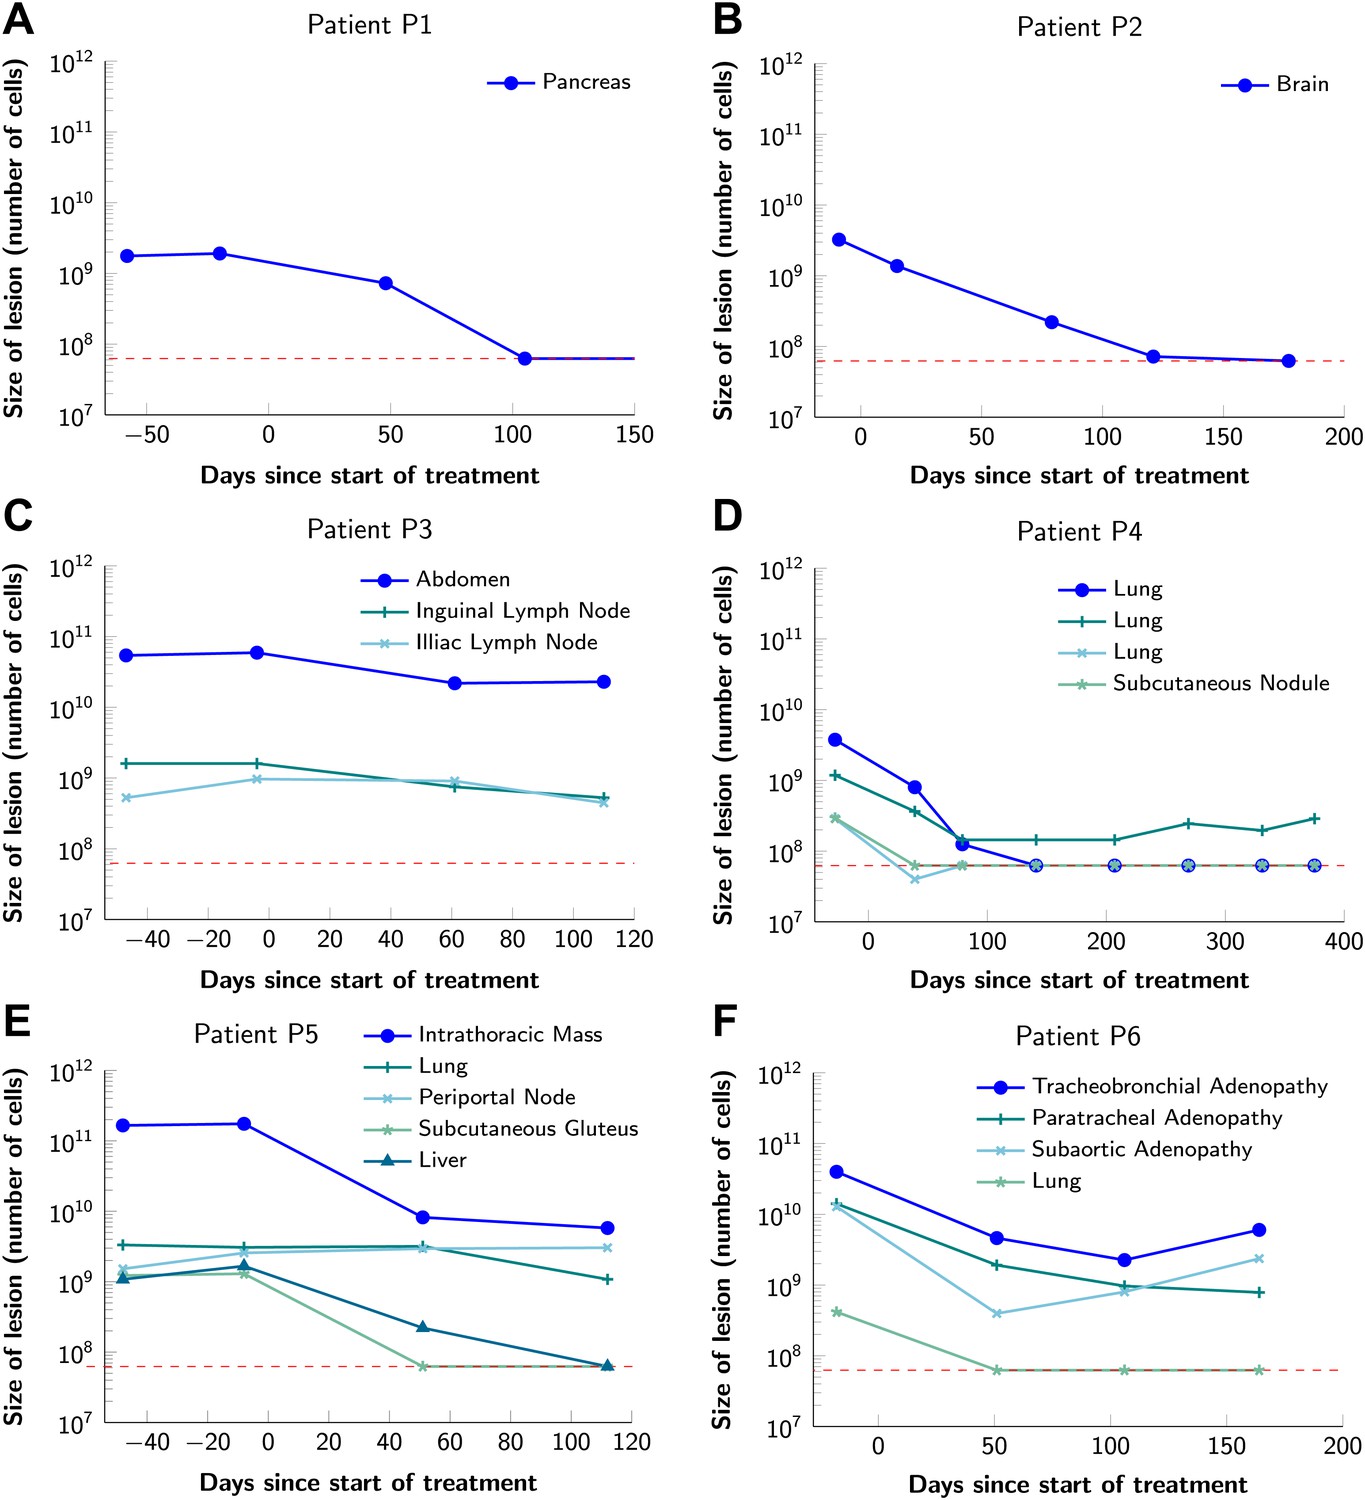
Variability in treatment response to monotherapy among six patients.
Patients were treated with the BRAF inhibitor vemurafenib. Patients P1 and P2 achieved a complete response. Patient P3 had stable disease. Patients P4, P5, and P6 had partial responses. The minimal detection size (indicated by discontinuous red line) was assumed to be ≈63 × 106 cells.
-
Figure 1—source data 1
Response to vemurafenib.
- https://doi.org/10.7554/eLife.00747.004
Figure 2
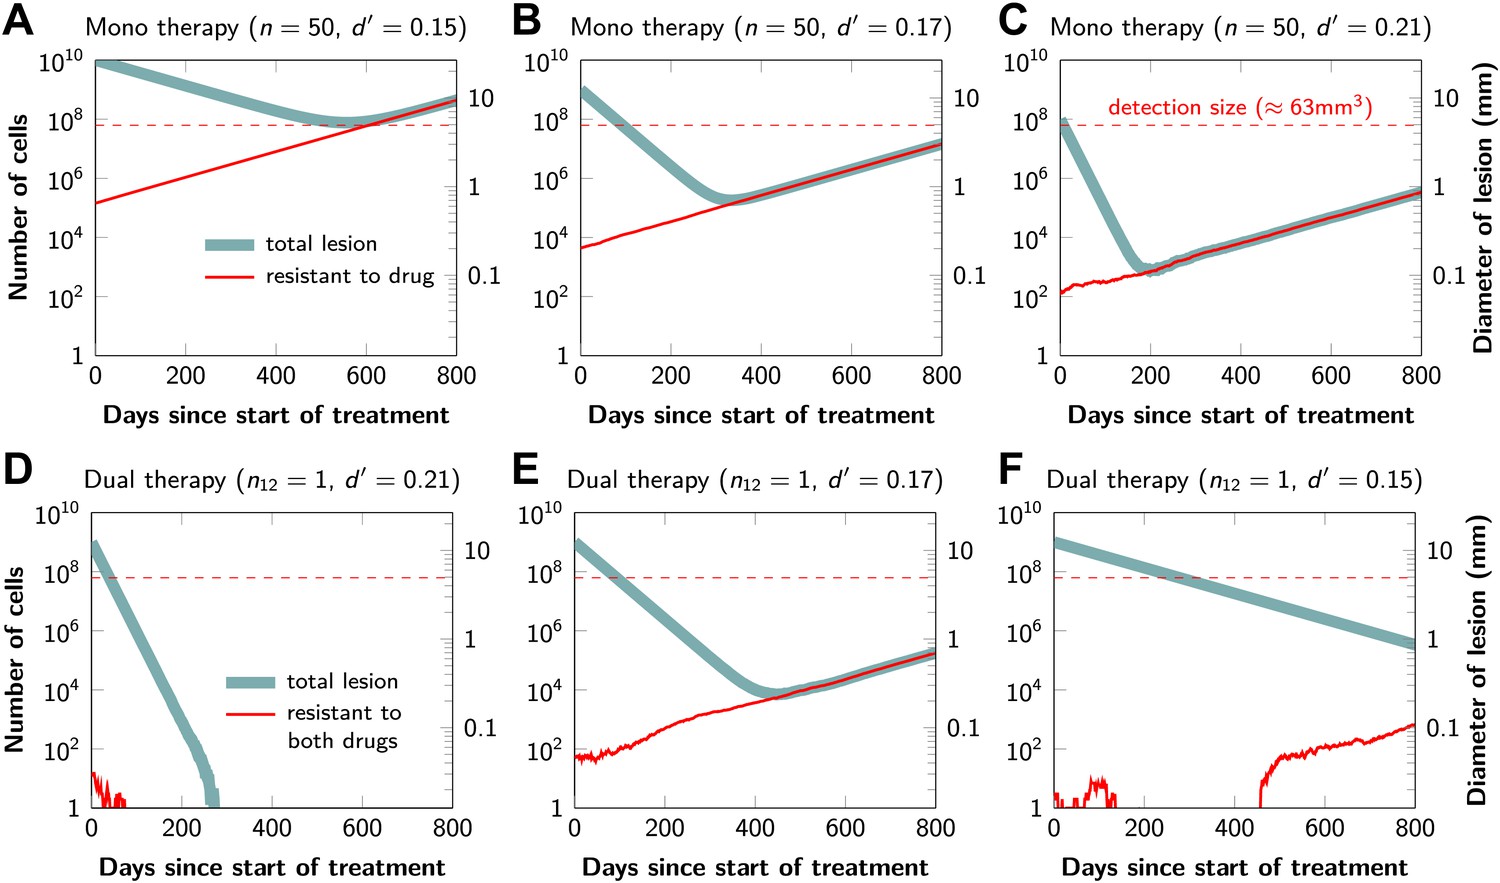
Tumor response to mono and dual therapy.
The tumor grows exponentially until a certain detection size, M, is reached, at which point treatment is initiated. The number of point mutations that could in principle confer resistance to monotherapy is n = 50. For dual therapy, the number of point mutations that could confer resistance to drugs 1 and 2 separately is given by n1 = 50 and n2 = 50. The number of point mutations that could confer resistance to both drugs simultaneously is given by n12. The point mutation rate was assumed to be u = 10−9 and the rate of cell division b = 0.14 per day and is unaffected by treatment. The rate of cell death before treatment is d = 0.13 per day; it is increased to d’ for sensitive cells during treatment. (A)–(C) For clinically detectable sizes (M = 1010, 109, 108, depending on the location of the tumors and the detection methods used), monotherapy leads to a temporary shrinkage of the tumor but is always followed by tumor regrowth. (D) Due to stochastic fluctuations the few resistant cells present at the start of treatment go extinct and the lesion is eradicated. (E) Treatment leads to a temporary shrinkage of the tumor followed by regrowth. (F) The tumor decreases slowly in response to dual therapy, but resistant cells eventually evolve and cause treatment failure.
Figure 3

Probability of tumor eradication for two-drug combination therapy.
A single mutation conferring cross-resistance to both drugs (n12 = 1) can prohibit any hope for a successful dual therapy. Solid curves show analytical results for dual therapy and dashed curve shows analytical results for a typical monotherapy, both are calculated using equation (1). Markers (square, triangle, circle, diamond) indicate simulation results (averages of 106 runs). Parameter values: birth rate b = 0.14, death rate d = 0.13, death rate for sensitive cells during treatment d’ = 0.17, point mutation rate u = 10−9.
Figure 4
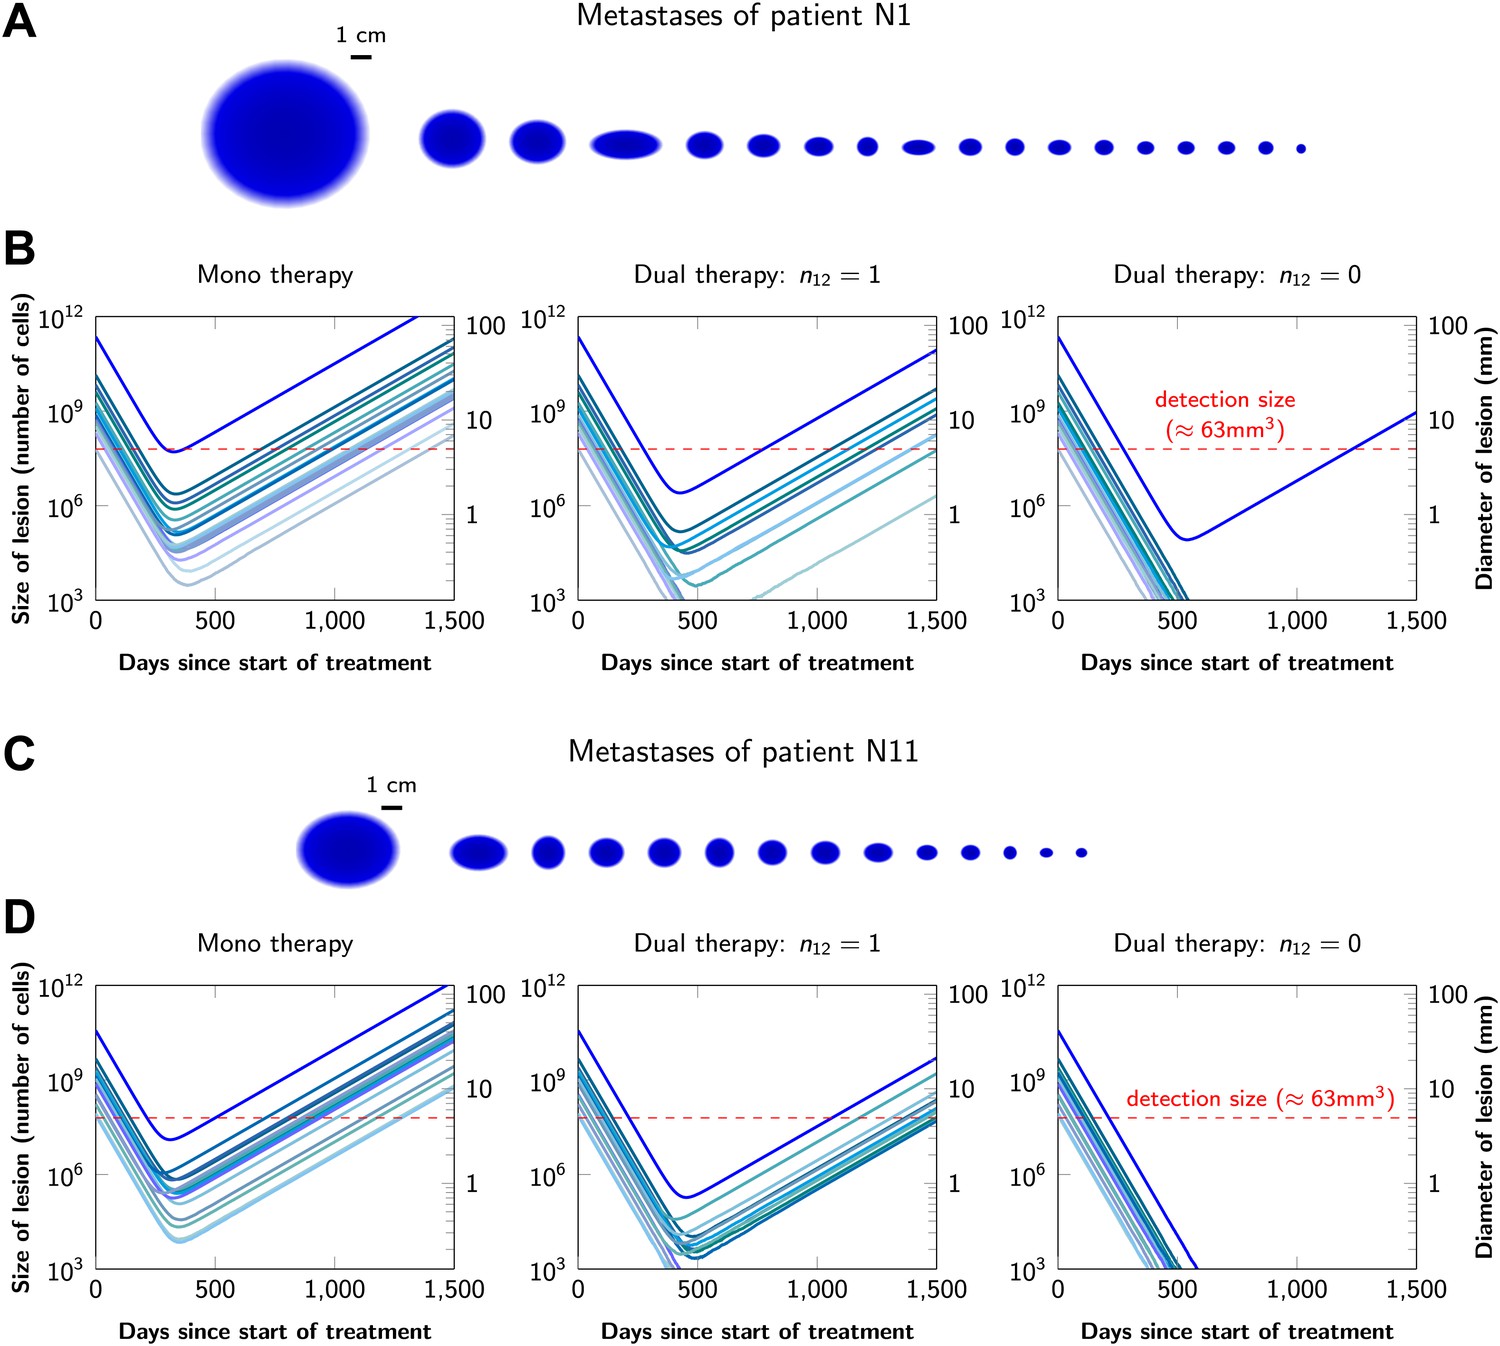
Treatment response dynamics to monotherapy and dual therapy in two patients.
(A) Depiction of all 18 detectable metastases in patient N1, who had a particularly heavy tumor burden (scale 1:4). (B) Simulated treatment of patient N1, comparing monotherapy with n = 50 resistance mutations and dual therapy with n1 = n2 = 50 resistance mutations to the individual drugs and one (n12 = 1) or no (n12 = 0) cross-resistance mutations to both drugs. (C) Depiction of all 14 detectable metastases in patient N11, who had a more typical tumor burden (scale 1:4). (D) Simulated treatment of patient N11. Parameter values for simulations in (B) and (D): birth rate b = 0.14; death rate d = 0.13; death rate for sensitive cells during treatment d′ = 0.17; point mutation rate u = 10−9.
Figure 5 with 1 supplement
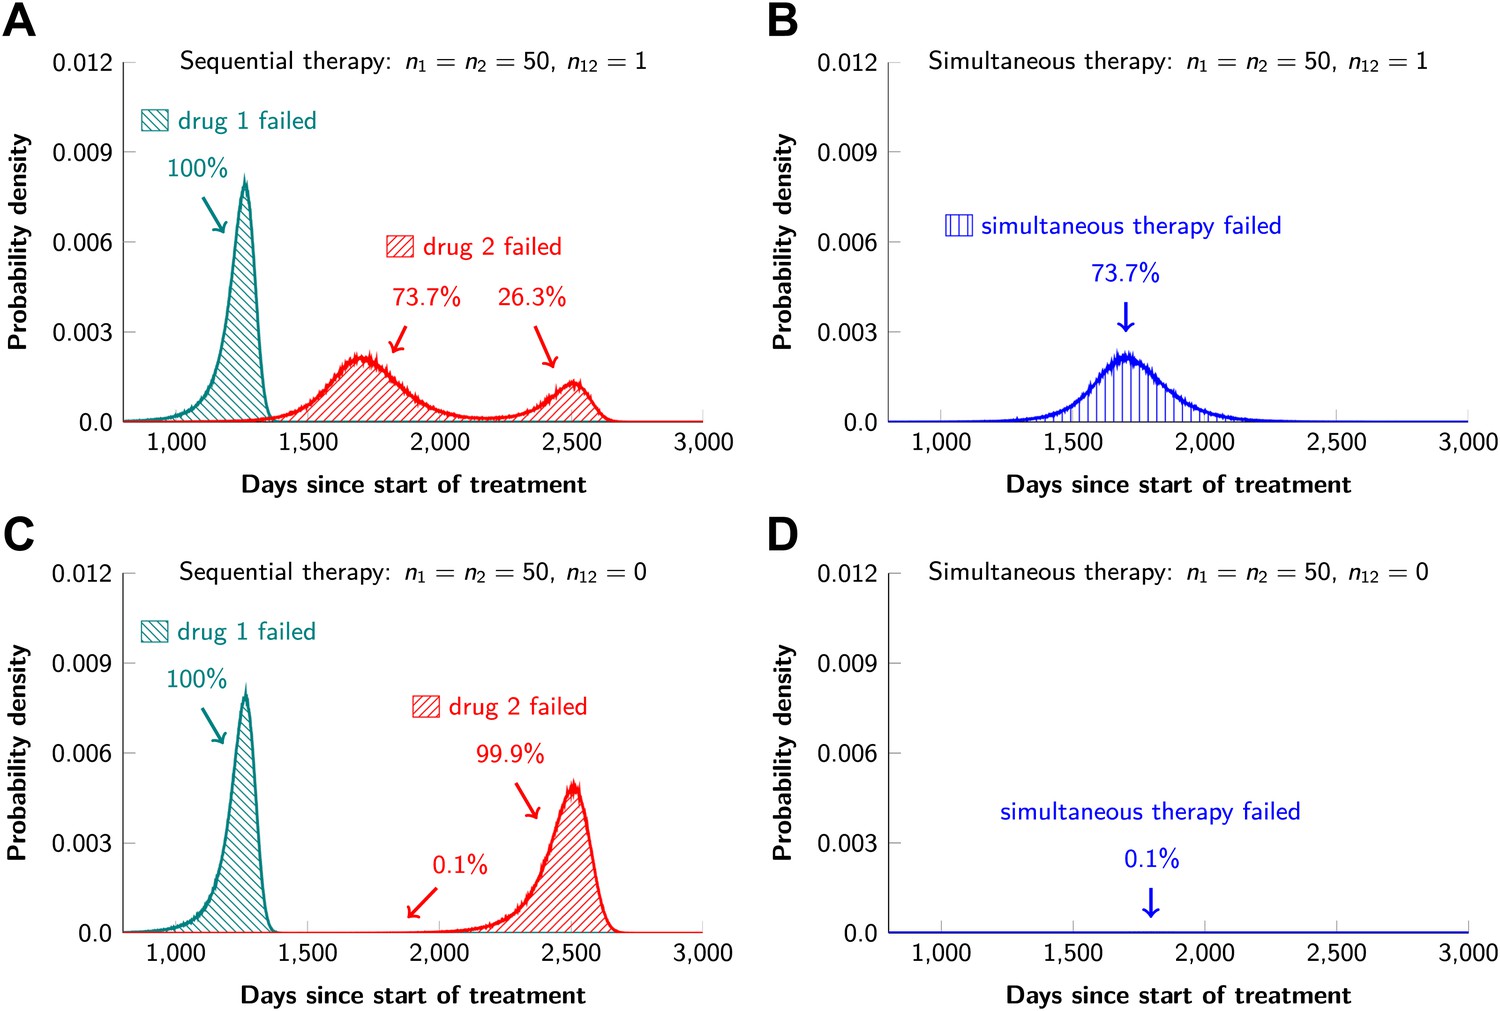
Sequential vs simultaneous therapy with two drugs.
(A) If there is even a single mutation that confers cross-resistance to both drugs (n12 = 1), then sequential therapy will fail in all cases. In 73.7% of the cases, this failure is due to the exponential growth of fully resistant cells that were present at the start of treatment. In the remaining 26.3% of cases, the failure is due to resistance mutations that developed during therapy with the first drug. (B) With simultaneous therapy, 26.3% of patients can be cured under the same circumstances. In the remaining patients (73.7%), cross-resistant mutations existed prior to the therapy and their expansive growth will ensure treatment failure whether treatment is simultaneous or sequential (see Figure 5—figure supplement 1 for further details). (C) and (D) If the two drugs have no resistance mutations in common (n12 = 0), then simultaneous therapy is successful with a probability of 99.9% while sequential therapy still fails in all cases.
Figure 5—figure supplement 1
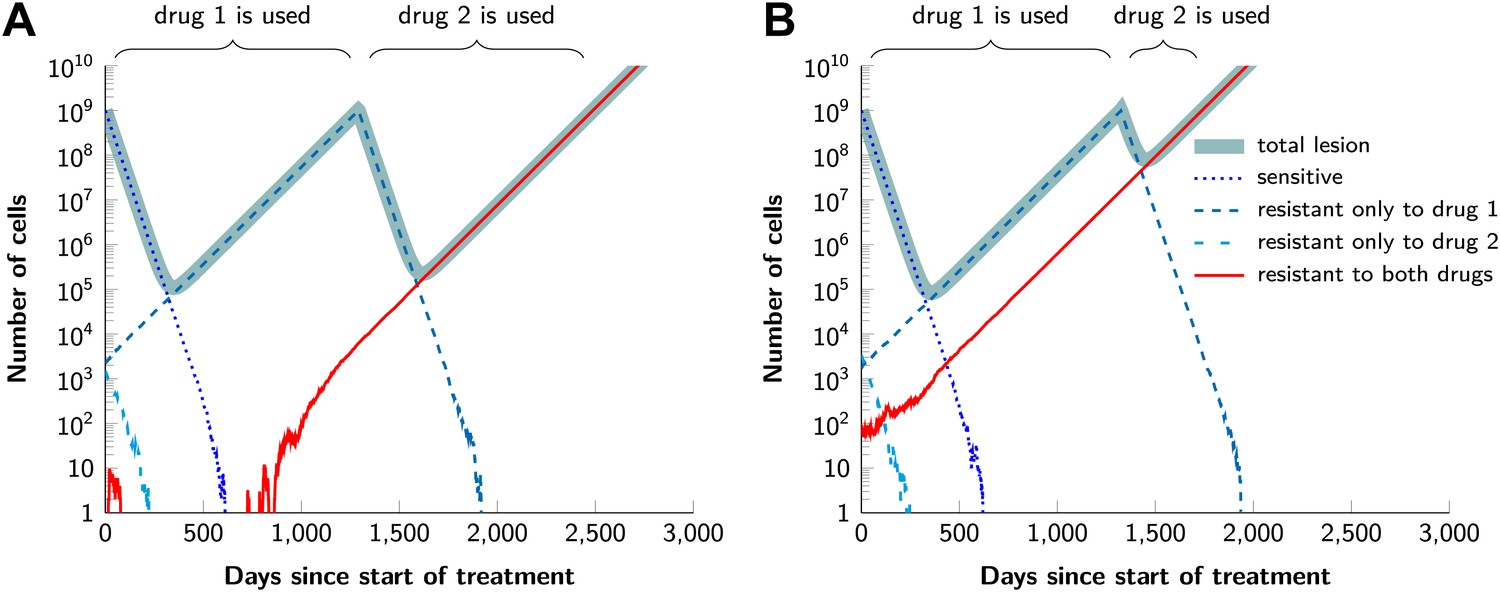
Examples for the evolution of resistance during sequential therapy.
Two drugs are available for treatment where n1 = 50 and n2 = 50 point mutations confer resistance to each drug individually and one mutation confers resistance to both drugs simultaneously (n12 = 1). (A) A typical example of a tumor relapsing in the second wave of panel (A) in Figure 5. The few fully resistant cells go extinct due to stochastic fluctuations at the start of treatment. The cells resistant only to drug 1 produce cross-resistant cells during the treatment with the first drug. The cells resistant to both drugs received sequentially two mutations. (B) A typical example of a tumor relapsing in the first wave of panel (A) in Figure 5. The fully resistant cells are already present at the start of treatment. These cells received the cross-resistance mutation and are therefore immediately resistant to both drugs. The exponential growth of these fully resistant cells cause the relapse; their growth is unaffected by whether treatment is simultaneous or sequential. Parameter values: birth rate b = 0.14, death rate d = 0.13, death rate for sensitive cells during treatment d' = 0.17, point mutation rate u = 10−9, detection size of tumor (for start of treatment and relapse) M = N = 109 cells.
Tables
Table 1
Probability of treatment failure for combination therapy in patients
| Patient | Primary tumor type | Number of metastases | Total tumor burden (number of cells) | Probability of treatment failure | ||
|---|---|---|---|---|---|---|
| Monotherapy | Dual therapy: n12 = 1 | Dual therapy: n12 = 0 | ||||
| N1 | Pancreas | 18 | 2.6 × 10¹¹ | 1 | 1 | 0.283 |
| N2 | Colon | 25 | 2.3 × 10¹¹ | 1 | 1 | 0.26 |
| N3 | Melanoma | 26 | 1.7 × 10¹¹ | 1 | 1 | 0.203 |
| N4 | Melanoma | 30 | 1.4 × 10¹¹ | 1 | 1 | 0.172 |
| N5 | Colon | 21 | 1.0 × 10¹¹ | 1 | 1 | 0.128 |
| N6 | Melanoma | 8 | 9.8 × 10¹⁰ | 1 | 1 | 0.12 |
| N7 | Colon | 25 | 9.1 × 10¹⁰ | 1 | 1 | 0.112 |
| N8 | Pancreas | 8 | 7.4 × 10¹⁰ | 1 | 1 | 0.092 |
| N9 | Pancreas | 23 | 6.4 × 10¹⁰ | 1 | 1 | 0.08 |
| N10 | Pancreas | 5 | 5.5 × 10¹⁰ | 1 | 1 | 0.069 |
| N11 | Colon | 14 | 5.4 × 10¹⁰ | 1 | 1 | 0.068 |
| N12 | Rectal | 23 | 4.8 × 10¹⁰ | 1 | 1 | 0.061 |
| N13 | Melanoma | 9 | 4.1 × 10¹⁰ | 1 | 1 | 0.052 |
| N14 | Pancreas | 13 | 4.1 × 10¹⁰ | 1 | 1 | 0.051 |
| N15 | Pancreas | 8 | 3.3 × 10¹⁰ | 1 | 1 | 0.042 |
| N16 | Melanoma | 7 | 2.2 × 10¹⁰ | 1 | 1 | 0.028 |
| N17 | Melanoma | 10 | 2.1 × 10¹⁰ | 1 | 1 | 0.027 |
| N18 | Colon | 4 | 2.0 × 10¹⁰ | 1 | 1 | 0.026 |
| N19 | Melanoma | 9 | 1.8 × 10¹⁰ | 1 | 1 | 0.023 |
| N20 | Colon | 3 | 1.6 × 10⁹ | 1 | 0.881 | 0.002 |
| N21 | Melanoma | 21 | 1.3 × 10⁹ | 1 | 0.828 | 0.002 |
| N22 | Pancreas | 1 | 8.5 × 10⁸ | 1 | 0.677 | 0.001 |
-
For monotherapy, we assume that 50 point mutations (n = 50) can in principle confer resistance to the drug. With dual therapy, we assume that 50 point mutations can in principle confer resistance to each drug individually (n1 = n2 = 50). Two scenarios are modeled: in the first, there is one mutation that can in principle confer resistance to both drugs (i.e., cross-resistance, n12 = 1). In the other case, there are no possible mutations that can confer resistance to both drugs (n12 = 0). Parameter values: birth rate, b = 0.14, death rate, d = 0.13, death rate for sensitive cells during treatment, d′ = 0.17, point mutation rate u = 10−9.
-
Colon: colonic adenocarcinoma; Rectal: rectal adenocarcinoma; Pancreas: pancreatic ductal adenocarcinoma.
Table 2
Simulation results for the probability of treatment failure when resistance is costly
| Dual therapy: | Number of cells | Birth rate | Probability of treatment failure | ||||
|---|---|---|---|---|---|---|---|
| n1 = n2 | n12 | c = 0% | c = 1% | c = 5% | c = 10% | ||
| 50 | 0 | 109 | 0.14 | 0.0 | 0.0 | 0.0 | 0.0 |
| 50 | 0 | 109 | 1 | 0.01 | 0.01 | 0.01 | 0.0 |
| 50 | 1 | 109 | 0.14 | 0.74 | 0.73 | 0.72 | 0.7 |
| 50 | 1 | 109 | 1 | 0.74 | 0.74 | 0.72 | 0.7 |
| 50 | 0 | 1011 | 0.14 | 0.12 | 0.11 | 0.08 | 0.06 |
| 50 | 0 | 1011 | 1 | 0.53 | 0.51 | 0.42 | 0.32 |
| 50 | 1 | 1011 | 0.14 | 1.0 | 1.0 | 1.0 | 1.0 |
| 50 | 1 | 1011 | 1 | 1.0 | 1.0 | 1.0 | 1.0 |
-
Each resistance mutation reduces the net growth rate by a factor c via a decrease of the birth rate b. Parameter values are death rate, d = b − 0.01, death rate for sensitive cells during treatment, d’ = b + 0.03, point mutation rate, u = 10−9. The simulation results are averages over 106 runs per parameter combination.
Additional files
-
Supplementary file 1
Mathematical proofs.
- https://doi.org/10.7554/eLife.00747.012
-
Supplementary file 2
Lesion sizes of patients who failed conventional treatments.
- https://doi.org/10.7554/eLife.00747.013
-
Supplementary file 3
Probability of combination therapy failure in patients.
- https://doi.org/10.7554/eLife.00747.014
Download links
A two-part list of links to download the article, or parts of the article, in various formats.
Downloads (link to download the article as PDF)
Open citations (links to open the citations from this article in various online reference manager services)
Cite this article (links to download the citations from this article in formats compatible with various reference manager tools)
Evolutionary dynamics of cancer in response to targeted combination therapy
eLife 2:e00747.
https://doi.org/10.7554/eLife.00747


