Tissue-resident natural killer (NK) cells are cell lineages distinct from thymic and conventional splenic NK cells
- Washington University School of Medicine, United States
- National Institute of Allergy and Infectious Diseases, National Institutes of Health, United States
- The Johns Hopkins University School of Medicine, United States
- University of Science and Technology China, China
- Hefei National Laboratory for Physical Sciences at the Microscale, China
- Howard Hughes Medical Institute, Washington University School of Medicine, United States
Figures
Figure 1
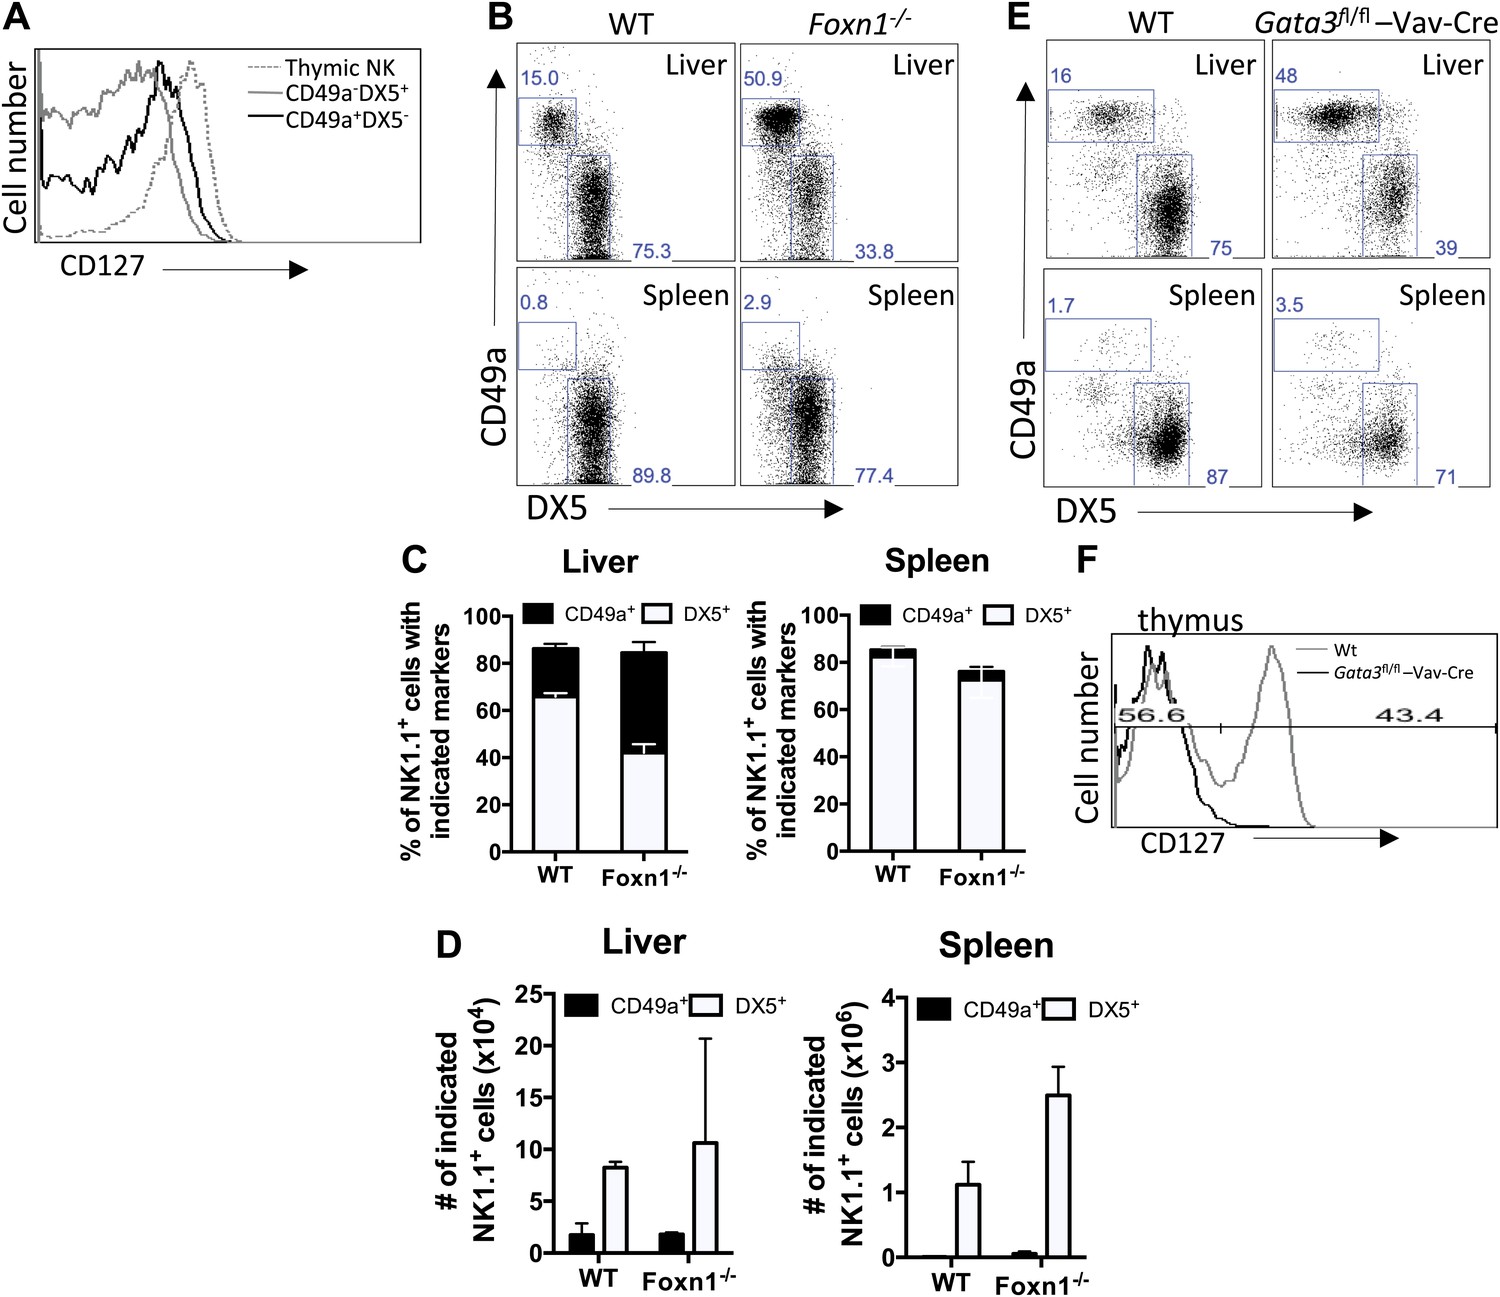
CD49a+ DX5− trNK cells in the liver are distinct from the CD127+ thymic NK cells.
(A) CD127 is poorly expressed on liver trNK cells. Thymi and livers were isolated from WT C57BL/6NCr mice, stained, and flow cytometry was performed. The histogram displays the expression level of CD127 on thymic NK cells and CD49a+DX5− and CD49a−DX5+ NK cells in the liver. Gated on live CD3−CD19−NK1.1+ cells. (B–D) Liver trNK cells are present in nude mice. Spleens and livers were isolated from WT C57BL/6NCr and Foxn1−/− mice, stained, and flow cytometry performed. The dot plots (B) were gated on live CD3−CD19−NK1.1+ cells and display the percentage expressing CD49a and DX5 in each mouse strain in the liver and spleen, as indicated. Stacked bar graphs represent the percentage (C) and total number (D) of CD3−CD19−NK1.1+ cells that express CD49a and DX5 in the liver and spleen of the WT and Foxn1−/− mice. Experiments were performed three independent times. (E) Liver trNK cells are present in GATA-3 conditional-deficient mice. Spleens and livers were isolated from WT and Gata3fl/fl-Vav-Cre mice, stained, and flow cytometry was performed. The dot plots were gated on live CD3−CD19−NK1.1+ cells and display the percentage expressing CD49a and DX5 in each mouse strain in the liver (top panels) and the spleen (bottom panels). Dot plots represent one of two independent experiments performed. (F) Thymic NK cells are absent in Gata3fl/fl-Vav-Cre mice. Cells from the thymi of WT and Gata3fl/fl-Vav-Cre mice were isolated, stained, and flow cytometry performed. The histogram displays the expression level of CD127 on thymic NK cells gated on live CD3−CD19−NK1.1+ cells. Histogram represents one of two independent experiments performed.
Figure 2 with 2 supplements

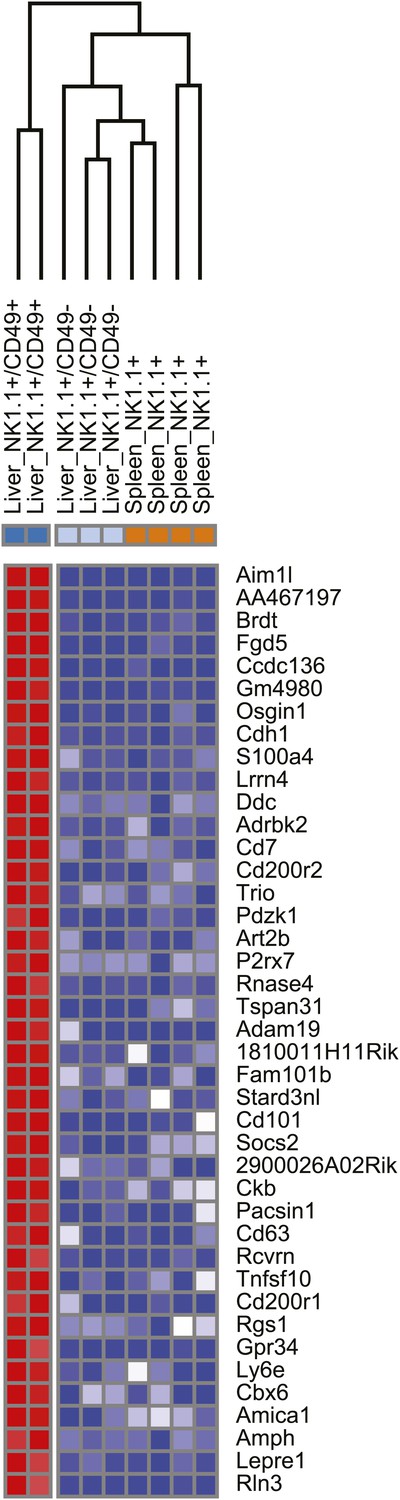
Distinct lineages of NK cells suggested by RNA-seq analysis.
(A) Heat map showing cluster analysis of the entire gene set between the liver trNK cells and the cNK cells from the liver and spleen. We obtained expression profiles from sorted CD49a+DX5− NK cells in the liver and CD49a−DX5+ cNK cells in the liver and spleen using the same small input RNA-seq approach. (For a heat map of a smaller number of genes highly expressed in liver trNK cells, see Figure 2—figure supplement 1.) (B) The trNK cells in liver display an ‘immature’ phenotype by flow cytometry. Cells from the liver and spleen were isolated, stained, and flow cytometry was performed. Dot plots were gated on live CD3−CD19−NK1.1+ cells and percentages in each dot plot represent the percentages of the subpopulations, CD49a+DX5− cells in the liver and CD49a−DX5+ in the liver and spleen, that express CD11b and CD27. Dot plot profiles are representative of at least three experiments. (C) Liver trNK CD49a+DX5- cells express TRAIL. Spleens and livers were isolated from WT C57BL/6NCr mice, stained, and flow cytometry was performed. The histogram was gated on live CD3−CD19−NK1.1+ cells and displays the expression level of TRAIL on CD49a+DX5− liver trNK cells and CD49a−DX5+ cNK cells in the liver and spleen. (D) Expression of genes specific to DX5– population of BM cells in DX5− liver NK cells and DX5+ liver and spleen cNK cells shows non-specific pattern. Shown are ∼200 genes most highly expressed in DX5− BM NK cells as compared to DX5+ BM NK cells (genes shown in Supplementary file 1). Approximately half of the DX5– BM NK cell-specific genes are upregulated in the liver CD49a+DX5– NK cells and the other half is upregulated in the CD49a−DX5+ BM NK cells. Gene set enrichment analysis also shows non-significant relationship between BM DX5− cells and CD49a+ NK cells (Figure 2—figure supplement 2).
Figure 2—figure supplement 1
Heat map showing the top differentially expressed genes between the liver trNK cells and the cNK cells from the liver and spleen.
https://doi.org/10.7554/eLife.01659.005
Figure 2—figure supplement 2
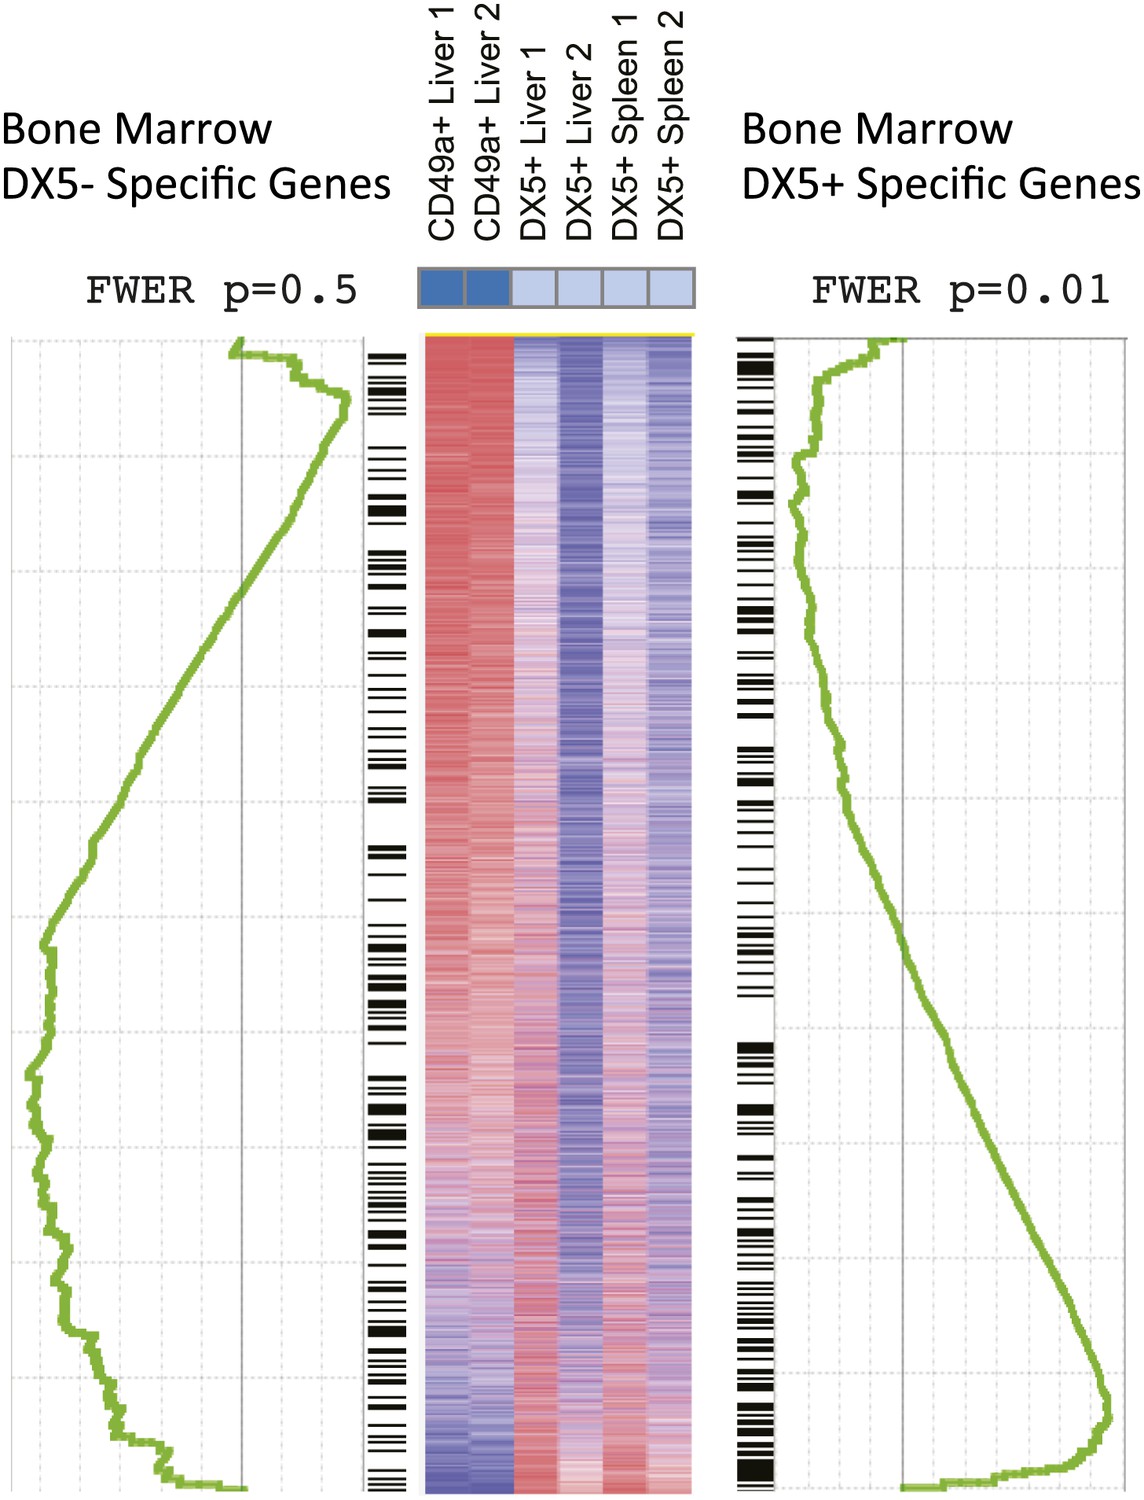
Gene set enrichment analysis (GSEA) indicates relationships between BM NK cell and cNK cells in liver and spleen.
GSEA comparing transcriptional profiles of liver trNK cells and cNK cells from the liver and spleen against signature genes for DX5+ or DX5- BM NK cells (black ladder). The heat map is ordered by degree of differential expression between these two subsets. Enrichment curves computed by GSEA are shown in green. Genes expressed in cNK cells from the liver and spleen show statistically significant similarities with genes expressed in the DX5+ BM NK cells (p = 0.01), while DX5− BM NK cells do not show statistically significant similarities with the liver trNK cells (p = 0.5).
Figure 3
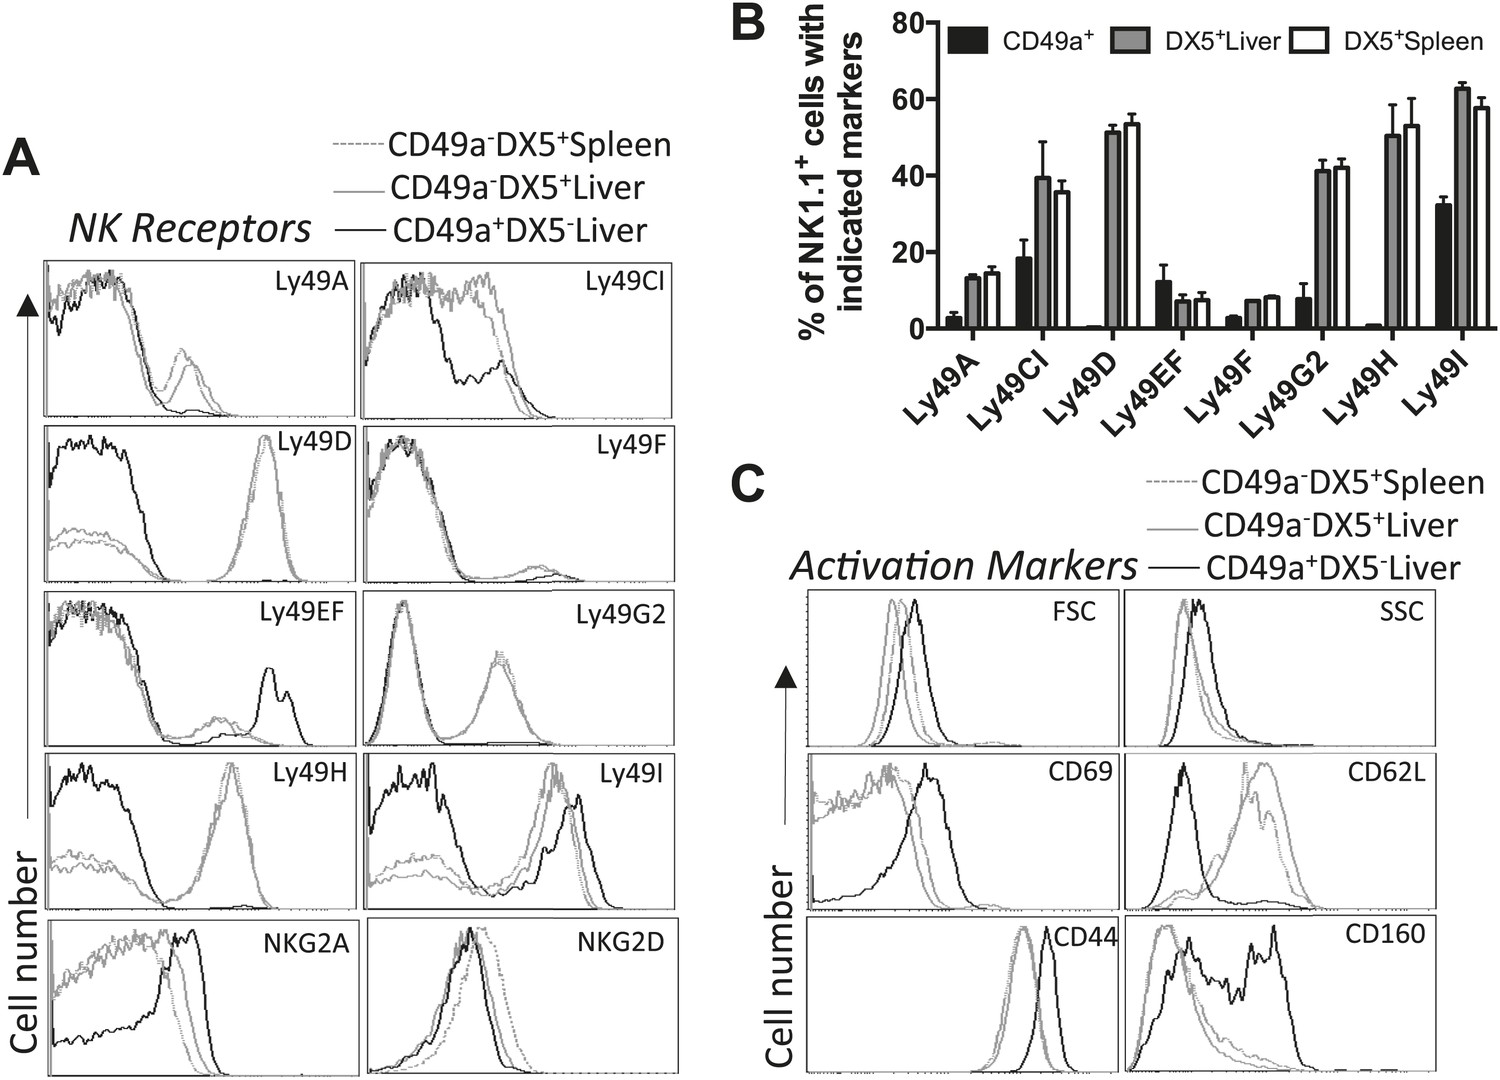
Liver trNK cells are phenotypically distinct from cNK cells.
(A and B) Differential expression of NK cell receptors on liver trNK and splenic and liver cNK cells. Spleens and livers were isolated from WT C57BL/6NCr mice, stained, and flow cytometry performed. The histograms were gated on live CD3−CD19−NK1.1+ cells and display the expression level of NK receptors on CD49a+DX5- liver trNK cells and CD49a−DX5+ cNK cells in the liver and spleen (A). A summary bar graph of the percentage of CD49a+DX5− liver trNK cells and CD49a−DX5+ cNK cells in the liver and spleen that express the various NK receptors (B). (C) The liver trNK cells display an activated phenotype. Spleens and livers were isolated from WT C57BL/6NCr mice, stained, and flow cytometry performed. The histograms were gated on live CD3−CD19−NK1.1+ cells and display the expression level of activation markers that are expressed on CD49a+DX5− liver trNK cells and CD49a−DX5+ cNK cells in the liver and spleen.
Figure 4
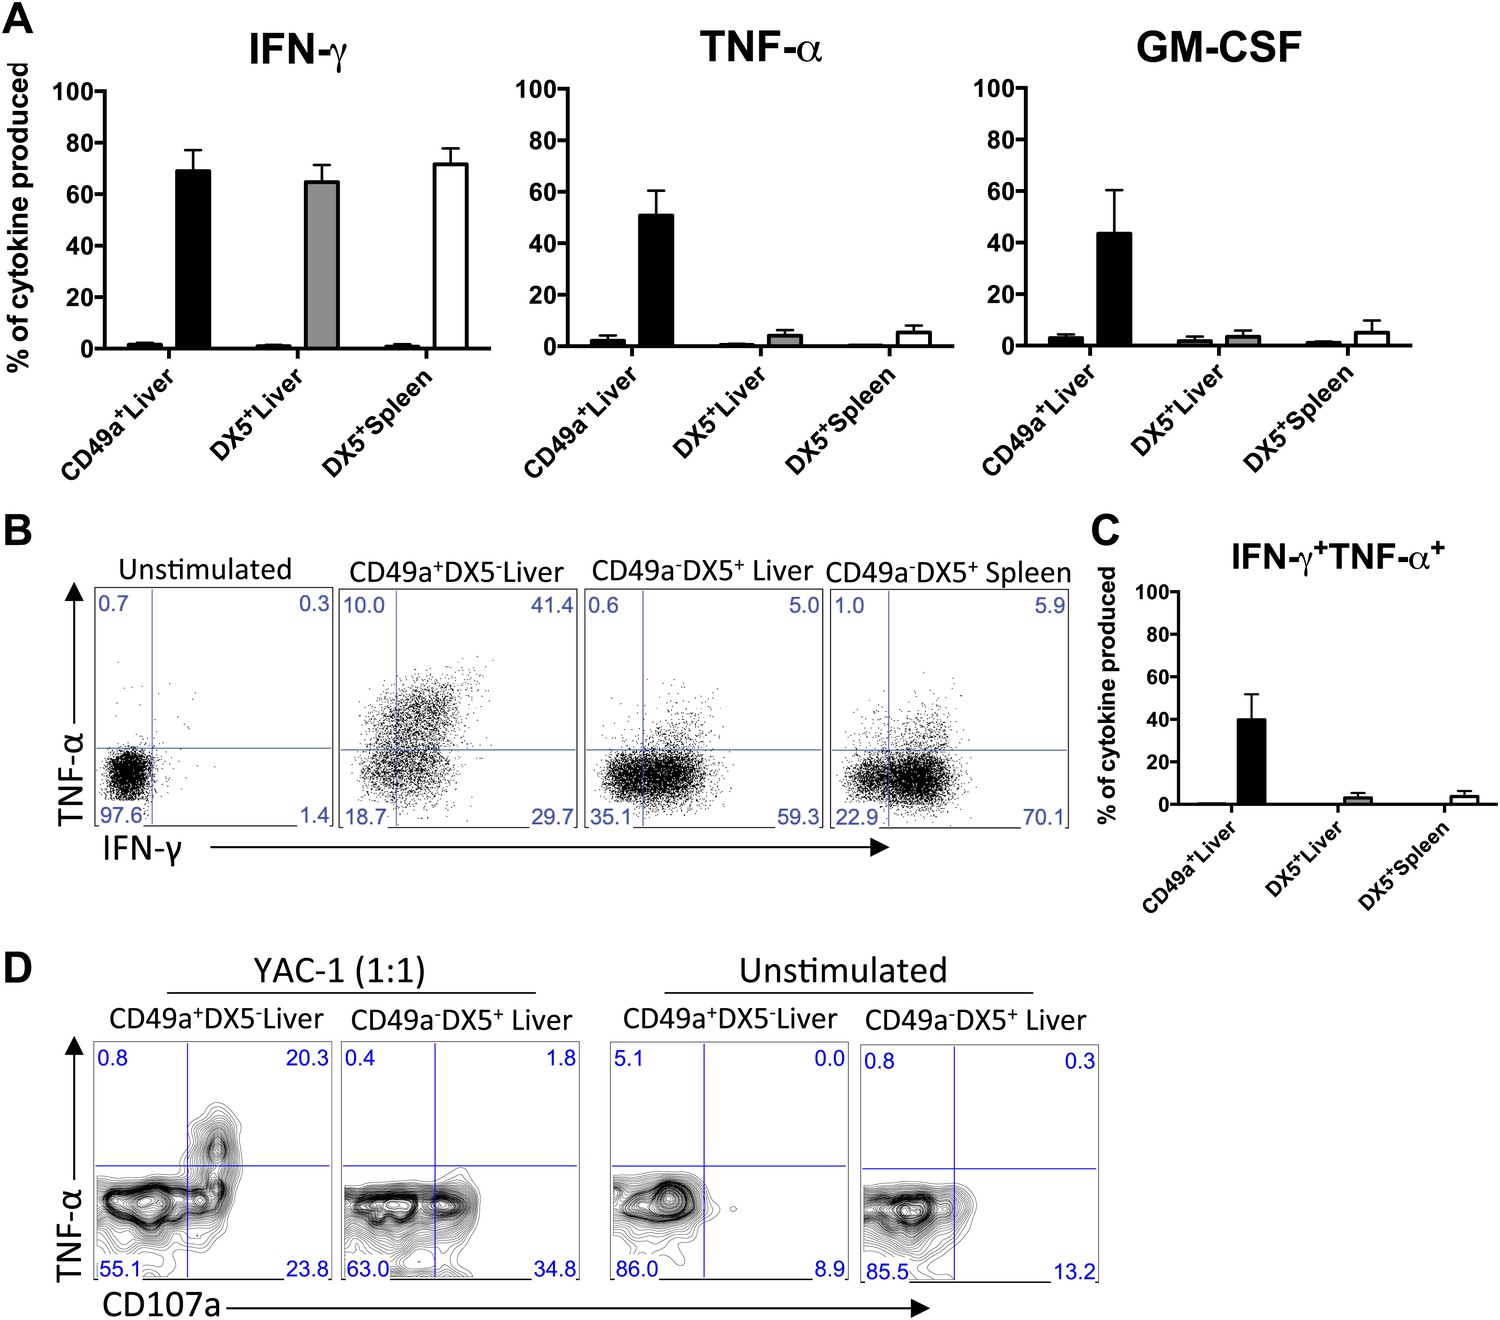
CD49a + DX5- trNK cells of the liver have a unique cytokine profile.
(A) The liver trNK cells differentially express cytokines when activated. Spleens and livers were isolated from WT C57BL/6NCr mice stimulated with PMA/ionomycin for 4 hr, stained, and IFNγ, TNFα, and GM-CSF cytokine production was analyzed by flow cytometry. The cells were gated on live CD3−CD19−NK1.1+ and the graphs represent the percentage of indicated cytokine produced by CD49a+DX5− liver trNK cells and CD49a−DX5+ cNK cells in the liver and spleen 4 hr post stimulation. (B and C) The liver trNK cells produce both IFNγ and TNFα when stimulated. Shown are dot plots of cells prepared and stimulated as in A. Each dot plot (B) was gated on live CD3−CD19−NK1.1+ cells and further gated on CD49a+DX5- liver trNK cells and CD49a−DX5+ cNK cells in the liver and spleen. Cells were co-stained for IFNγ and TNFα and the percentage produced of each cytokine is presented in each quadrant. Bar graphs (C) indicate the percentage of IFNγ and TNFα-double producers shown in B. (D) The liver trNK cells degranulate and produce TNFα upon stimulation with YAC-1 targets. Liver lymphocytes were co-cultured at a 1:1 ratio with YAC-1 target cells for 6 hr. The cells were stained for the indicated markers and flow cytometry performed. The dot plots were gated on live CD3−CD19−NK1.1+ CD49a+DX5− liver trNK cells or CD3−CD19−NK1.1+ CD49a−DX5+ cNK cells in the liver for CD107a degranulation and TNFα production.
Figure 5
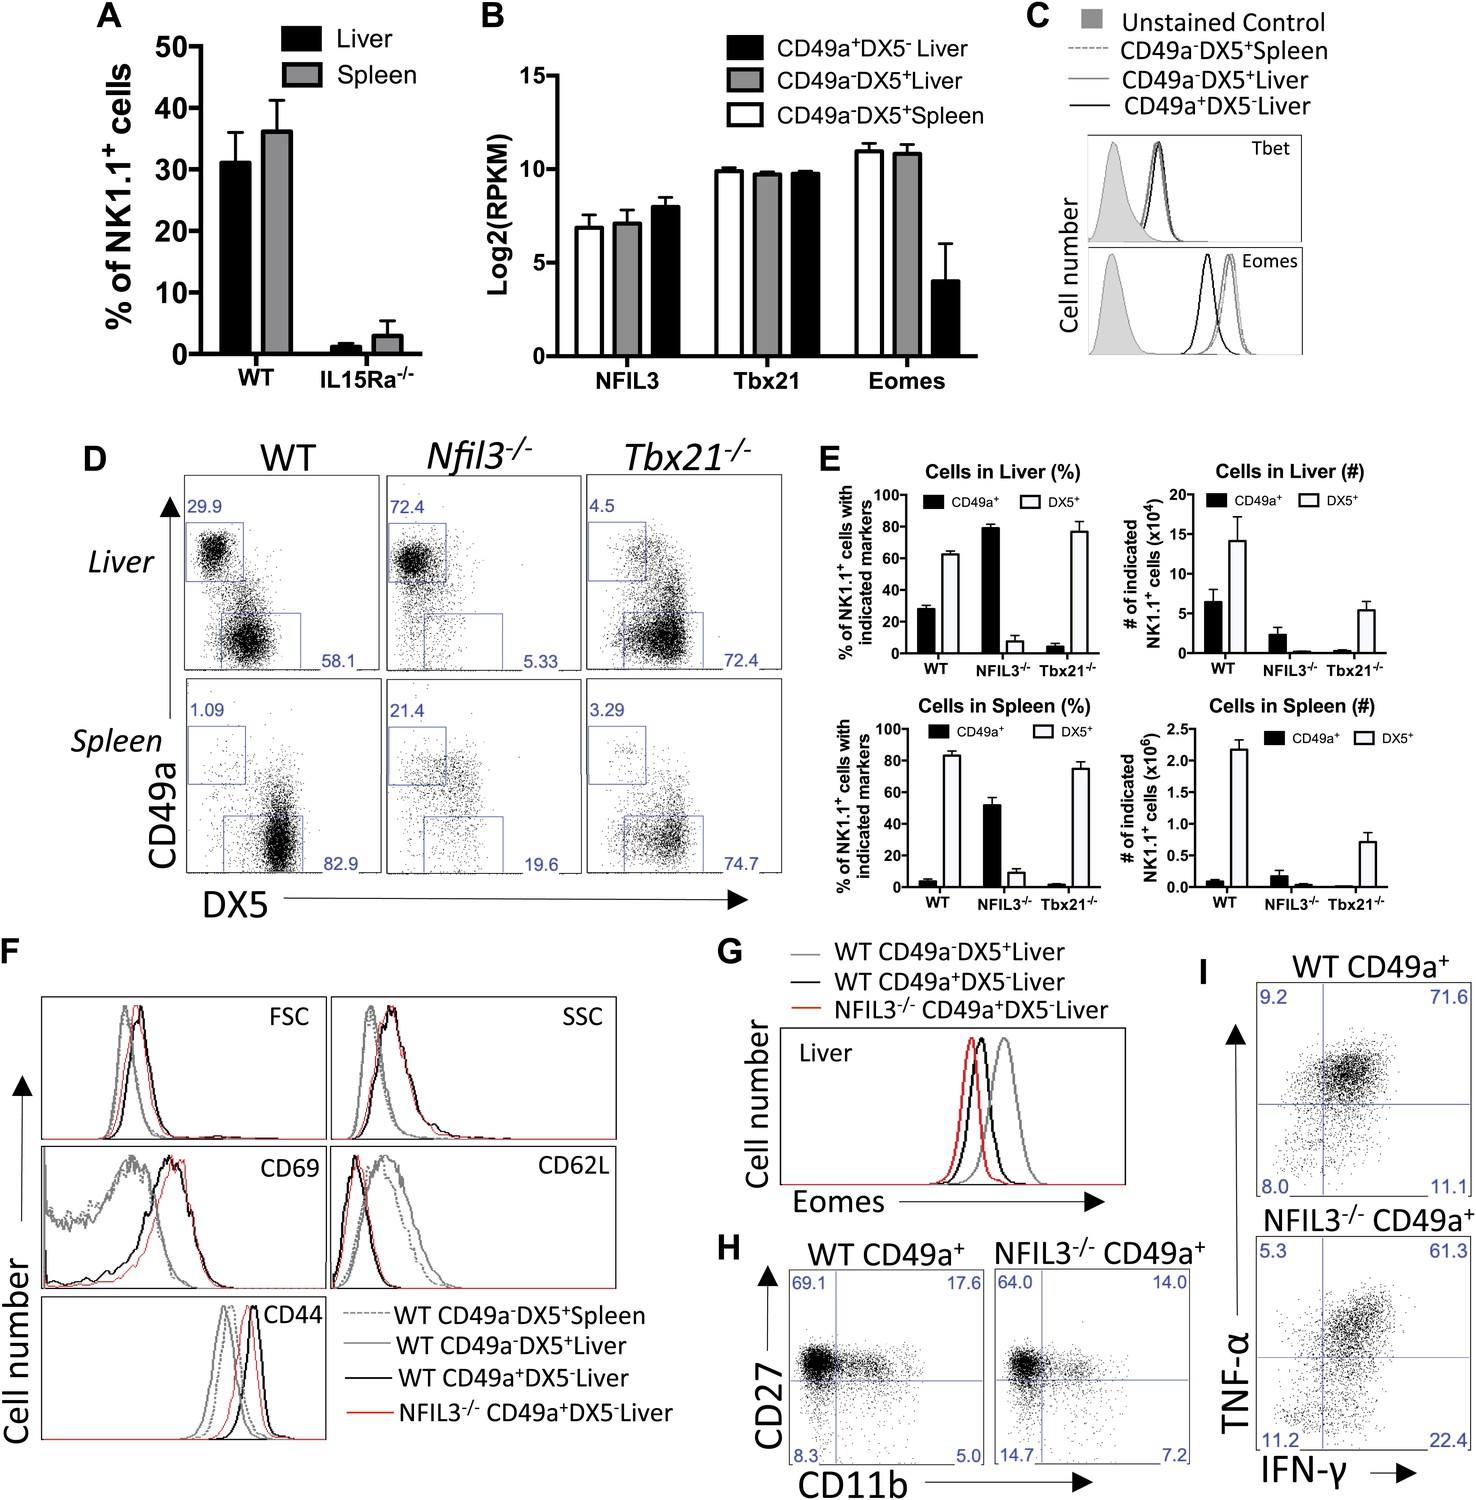
Liver trNK cells have different transcription factor requirements than cNK cells.
(A) All liver NK cells require IL-15Rα. Spleens and livers were isolated from WT mice and Il15ra−/− mice, stained, and flow cytometry performed. The bar graph displays the percentage of CD3−CD19−NK1.1+ cells in the liver and spleen of each strain of mice. (B) Eomes transcripts are expressed at lower levels in liver trNK cells. Spleens and livers were isolated from Rag1−/− mice and NK1.1+ cells sorted for CD49a+DX5− liver trNK and liver and spleen CD49a−DX5+ cNK cells. RNA-seq was performed on the sorted populations and the expression levels of indicated transcription factors plotted. RPKM = reads per kilobase per million mapped reads. Normalization of read counts by length of transcripts allowed comparison of expression levels of different genes. One of two independent experiments. (C) Eomes protein expression is decreased in liver trNK cells. Spleens and livers were isolated from Rag1−/− mice, stained, and flow cytometry performed for indicated transcription factors. The histograms were gated on live CD3−CD19−NK1.1+ cells and display the expression level of transcription factors expressed in CD49a+DX5− liver trNK cells and CD49a−DX5+ cNK cells in the liver and spleen. Histogram plots are representative of three independent experiments. (D and E) The liver trNK cells are present in NFIL3-deficient mice but absent in Tbx21 (Tbet)-deficient mice. Spleens and livers were isolated from WT, Nfil3−/−, and Tbx21−/− mice, stained, and flow cytometry performed. Representative dot plots (D) were gated on live CD3−CD19−NK1.1+ and display the expression level of CD49a and DX5 in the liver (top panels) and the spleen (bottom panels). Bar graphs (E) display the percentages (left column) and total NK cell number (right column) of CD3−CD19−NK1.1+ cells that express CD49a and DX5 in the liver and spleen of WT, Nfil3−/−, and Tbx21−/− mice. (F) The Nfil3−/− liver trNK cells display an activated phenotype, like liver trNK cells in WT mice. Spleens and livers were isolated from WT C57BL/6NCr and Nfil3−/− mice, stained, and flow cytometry was performed. The histograms were gated on live CD3−CD19−NK1.1+ cells and display the expression level of activation markers expressed on CD49a+DX5− liver trNK cells and CD49a−DX5+ cNK cells in the liver and spleen in WT compared to the trNK cells from the Nfil3−/− mice. (G) Nfil3−/− liver trNK CD49a+DX5− cells do not express Eomesodermin. Livers were isolated from WT C57BL/6NCr and Nfil3−/− mice, stained, and flow cytometry was performed. The histogram was gated on live CD3−CD19−NK1.1+ cells and displays the expression level of Eomes on WT and Nfil3−/− CD49a+DX5− liver trNK cells and CD49a−DX5+ cNK cells in the liver. (H) The Nfil3−/− trNK cells in liver display an ‘immature’ phenotype by flow cytometry, similar to trNK cells in WT mice. Cells from the liver were isolated, stained, and flow cytometry was performed. Dot plots were gated on live CD3−CD19−NK1.1+ cells and numbers in each dot plot represent the percentages of the subpopulations, that is, liver CD49a+DX5- cells and CD49a−DX5+ that express CD11b and CD27. Dot plot profiles are representative of two experiments. (I) Stimulated Nfil3−/− liver trNK cells produce cytokines similar to WT liver trNK cells. Livers were isolated from WT C57BL/6NCr and Nfil3−/− mice stimulated with PMA/ionomycin for 4 hr, and cells were co-stained for IFNγ and TNFα and analyzed by flow cytometry. The graphs were gated on live CD3−CD19−NK1.1+ cells and represent the percentage of cytokine+ (or cytokine−) cells among the CD49a+DX5− liver trNK cells from WT and Nfil3−/− mice, as indicated. Dot plot profiles are representative of two experiments.
Figure 6
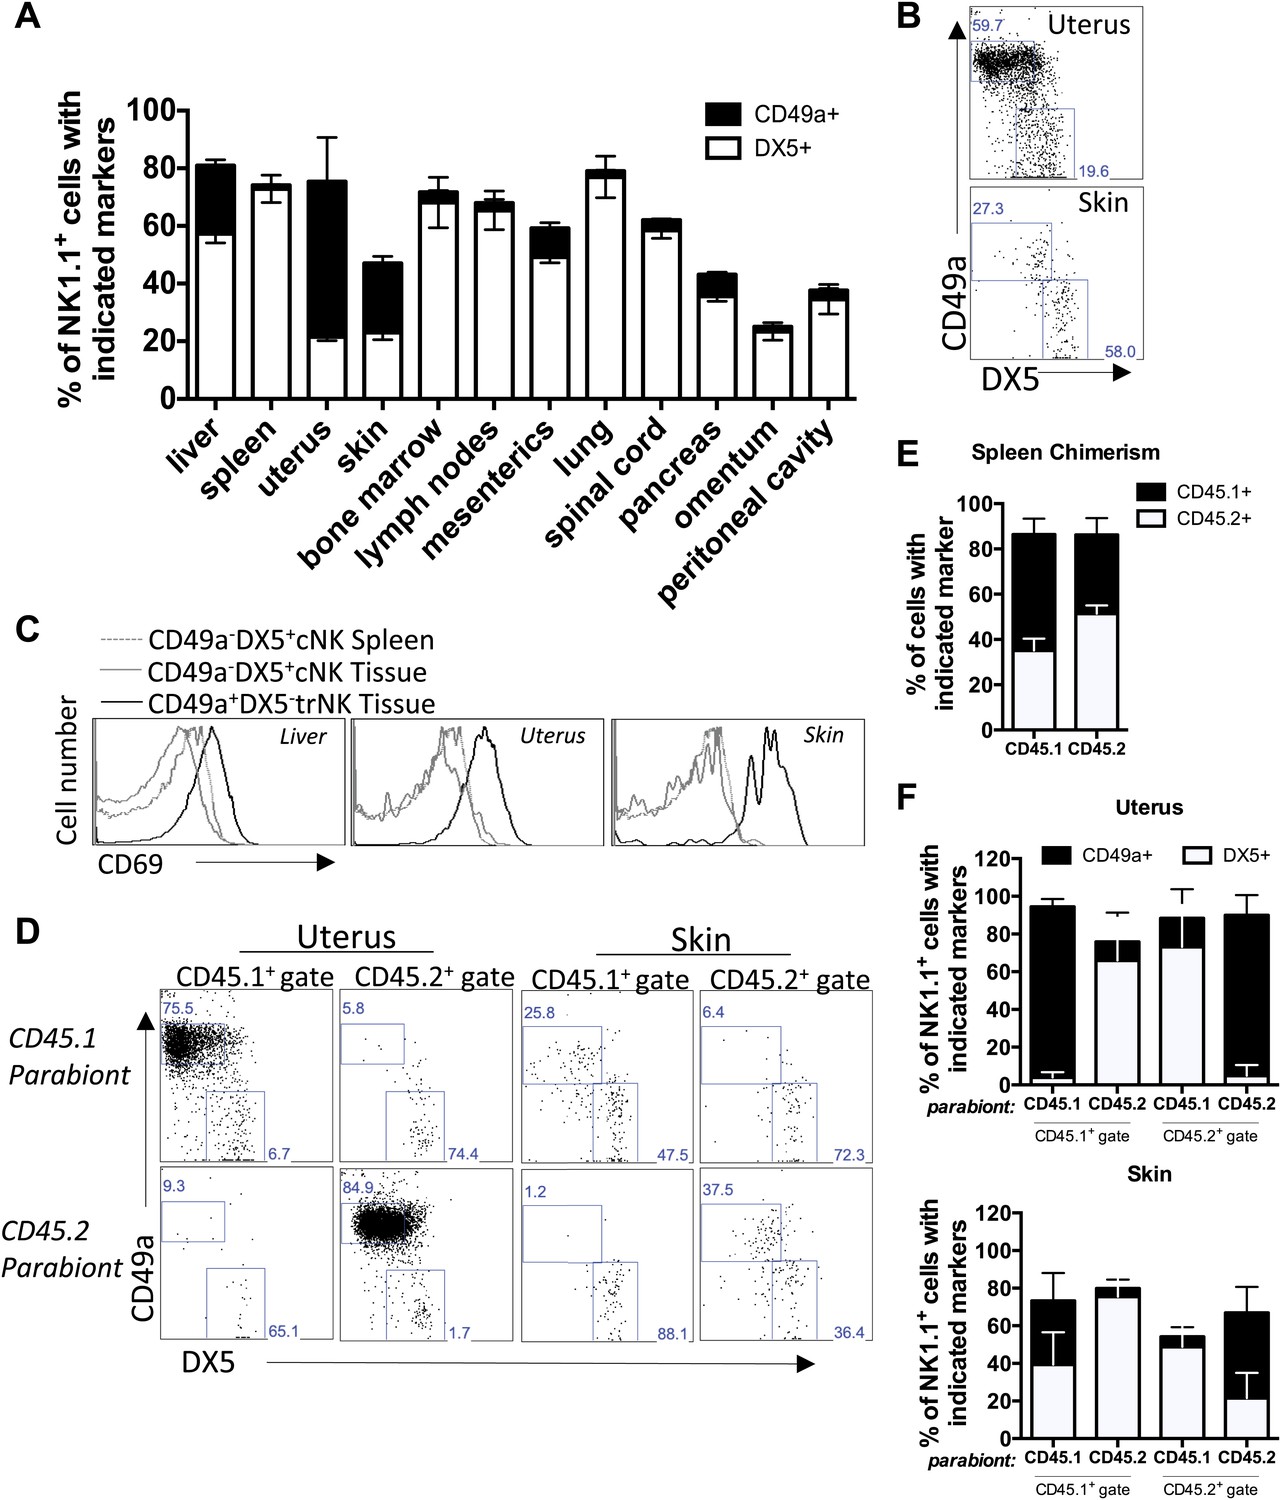
Tissue-resident NK cells in other organs.
(A) CD49a+DX5− NK cells are present in liver, skin, and uterus. Various organs were isolated from WT C57BL/6NCr mice, stained, and flow cytometry performed. The stacked bar graph represents the percentage of live CD3−CD19−NK1.1+ cells that either express CD49a or DX5 in the indicated organs. (B) CD49a expression on skin and uterine trNK cells. The dot plot displays cells that were isolated from the uterus and skin of WT C57BL/6NCr mice. The dot plots were gated on live CD3−CD19−NK1.1+ cells and the percentage of cells expressing CD49a and DX5 are shown. (C) CD49a+DX5– NK cells in liver, skin, and uterus express higher levels of CD69. Spleen, liver, uterus, and skin were isolated from WT C57BL/6NCr mice, stained, and flow cytometry performed. The histograms were gated on live CD3−CD19−NK1.1+ cells and display the expression level of CD69 on CD49a+DX5− trNK cells and CD49a−DX5+ cNK cells in the spleen, and indicated tissues. (D and F) CD49a+DX5– NK cells in uterus and skin are tissue-resident as revealed by parabiotic mice. The uterus (left two panels) and skin (right two panels) were isolated from day 14 parabiosed mice. (E) Chimerism in the spleen. The spleen was analyzed for the degree of chimerism by analyzing the percentage of gated live CD45.1 and CD45.2 cells in each parabiont on day 14-post parabiosis surgery. These data correspond to data shown in Figure 6D,F. (F) Each parabiont was analyzed for its host and migratory cells using the congenic markers CD45.1 and CD45.2. The cells were further gated on live CD3−CD19−NK1.1+ cells and the percentages of cells expressing CD49a and DX5 are shown in the representative dot plots (D). Stacked bar graphs (F) show the percentages of cells expressing CD49a and DX5, the gated populations in (D). The experiment was performed two independent times with four parabiosed animals in each experiment (total of 8 pairs).
Figure 7
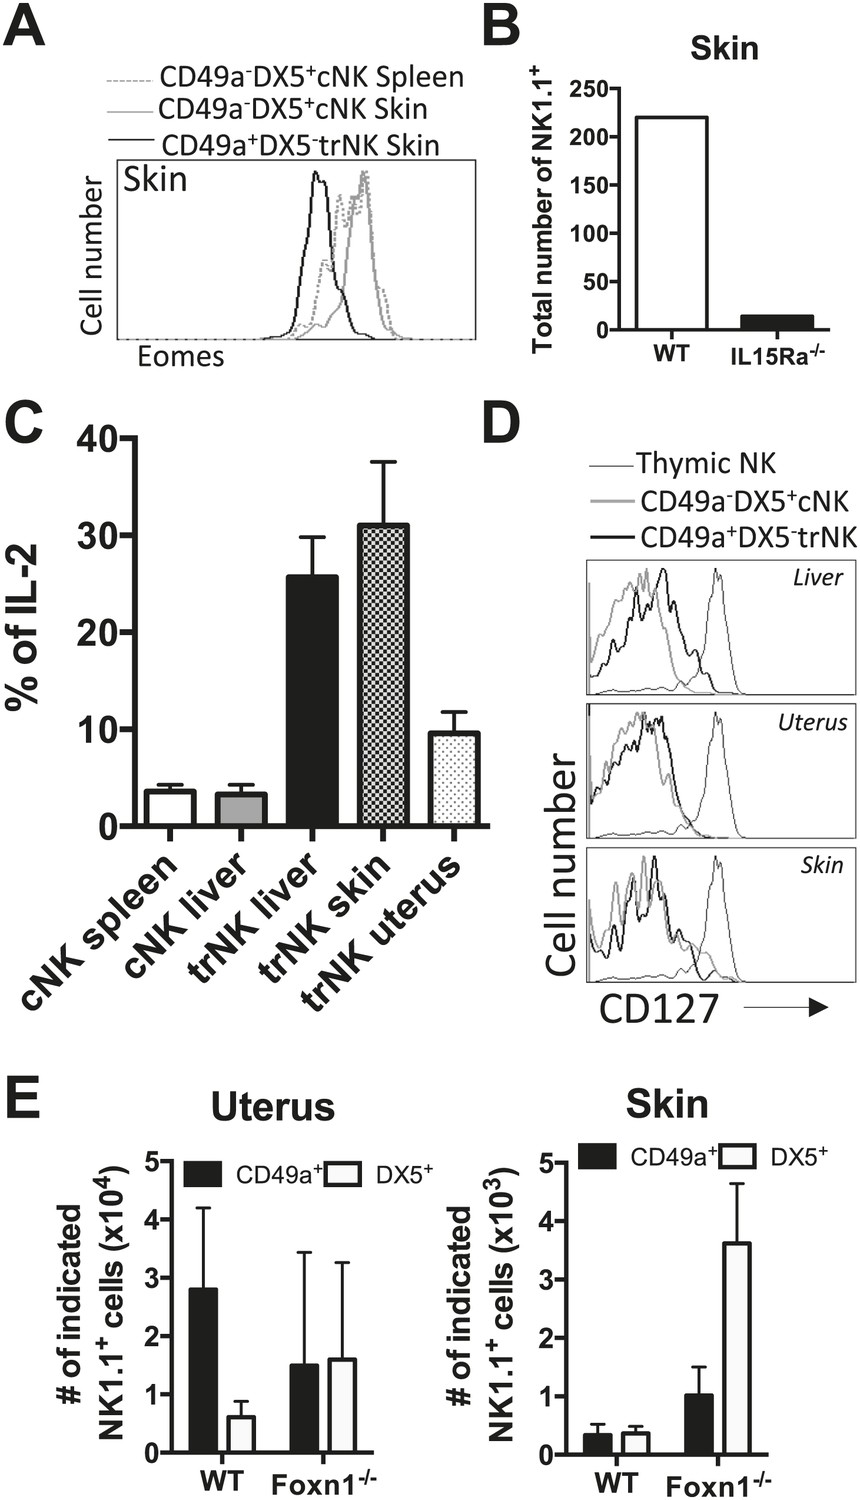
trNK cells in the liver resemble trNK cells in the skin and not the uterus, and all develop independent of a thymus.
(A) Eomes is poorly expressed in skin trNK cells. Skin was isolated from WT C57BL/6NCr mice, stained, and flow cytometry performed. The histogram was gated on live CD3−CD19−NK1.1+ cells and displays the expression level of Eomes on CD49a+DX5− skin trNK cells and CD49a−DX5+ cNK cells in the skin and spleen. (B) Skin trNK cells are absent in IL-15Rα-deficient mice. Skin was isolated from WT mice and Il15ra−/− mice, stained, and flow cytometry performed. The bar graph displays the number of events captured in the CD3−CD19−NK1.1+ gate. (C) CD49a+DX5− trNK cells of the liver and skin produce IL-2. Spleen, liver, uterus and skin were isolated from WT C57BL/6NCr mice stimulated with PMA/ionomycin for 4 hr, stained, and IL-2 production was analyzed by intracellular staining and flow cytometry. To obtain the percentage of IL-2+ cells in each population, the graphs were derived from gated live CD3−CD19−NK1.1+ cells and represent the percentage of IL2+ cells among the CD49a−DX5+ cNK cells in the liver and spleen and the CD49a+DX5− liver, uterus and skin trNK cells. (D) Tissue-resident CD49a+DX5− cells in the liver, uterus and skin do not express CD127. Thymus, liver, uterus and skin were isolated from WT C57BL/6NCr mice, stained, and flow cytometry was performed. The histograms are from gated live CD3−CD19−NK1.1+ cells and display the expression levels of CD127 on CD49a+DX5− liver, uterus and skin trNK cells and CD49a−DX5+ cNK cells in the liver, uterus and skin and NK1.1+ thymic NK cells. (E) Tissue-resident CD49a+DX5− cells in the liver, uterus and skin develop independent of a thymus .The uterus and skin were isolated from WT and Foxn1−/− mice, stained, and flow cytometry was performed. Bar graphs display the total number of CD3−CD19−NK1.1+ cells that express CD49a and DX5 in the uterus and skin of WT and Foxn1−/− mice. Experiments were performed three independent times.
Figure 8
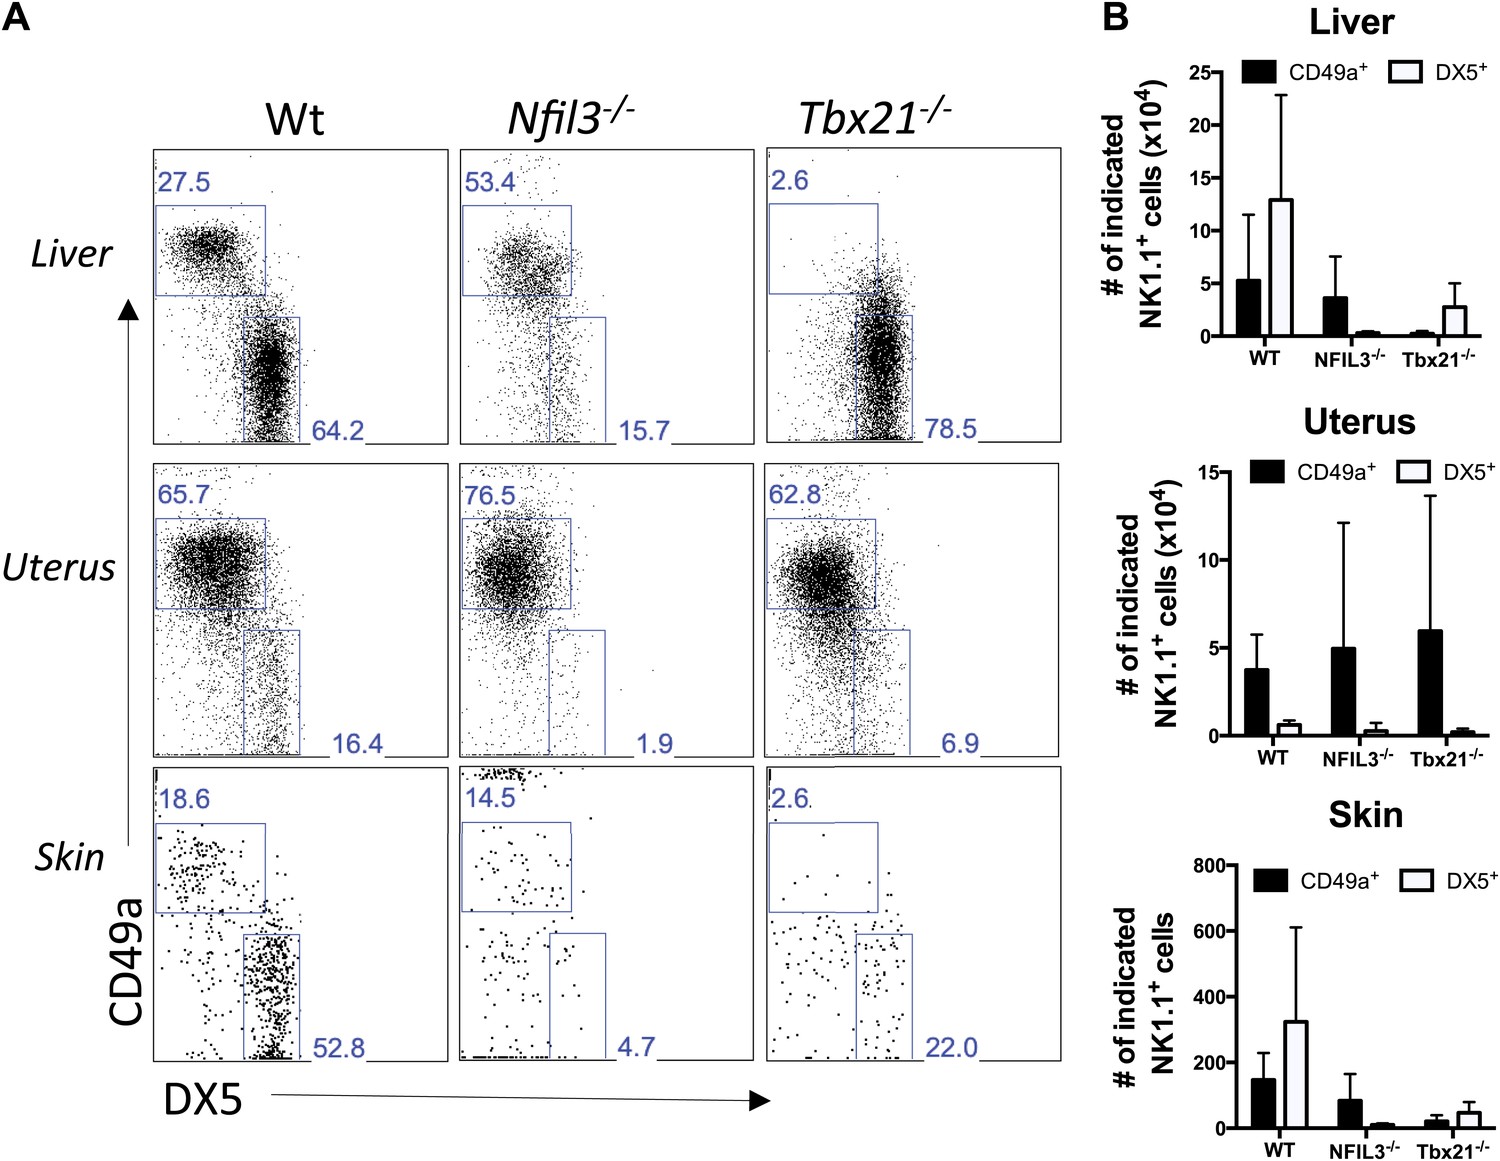
Liver, uterus, and skin trNK cells have different requirements for NFIL3 and Tbet (Tbx21).
(A) The liver, uterus and skin were isolated from WT, Nfil3−/−, and Tbx21−/− mice, stained, and flow cytometry performed. Representative dot plots were gated on live CD3−CD19−NK1.1+ cells and display the expression level of CD49a and DX5 in the liver (top panels) and the uterus (middle panels) and skin (bottom panels). Percentages indicate the gated populations. Bar graphs (B) display the total number of CD3−CD19−NK1.1+ cells that express CD49a and DX5 in the liver, uterus and skin of WT, Nfil3−/−, and Tbx21−/− mice. Experiments were performed five independent times.
Additional files
-
Supplementary file 1
Bone marrow DX5− NK cell signature genes. These genes were used in the expression analysis shown in Figure 2D.
- https://doi.org/10.7554/eLife.01659.013
Download links
A two-part list of links to download the article, or parts of the article, in various formats.
Downloads (link to download the article as PDF)
Open citations (links to open the citations from this article in various online reference manager services)
Cite this article (links to download the citations from this article in formats compatible with various reference manager tools)
Tissue-resident natural killer (NK) cells are cell lineages distinct from thymic and conventional splenic NK cells
eLife 3:e01659.
https://doi.org/10.7554/eLife.01659


