Abscisic acid dynamics in roots detected with genetically encoded FRET sensors
- Carnegie Institution for Science, United States
- Universität Heidelberg, Germany
Figures
Figure 1 with 1 supplement
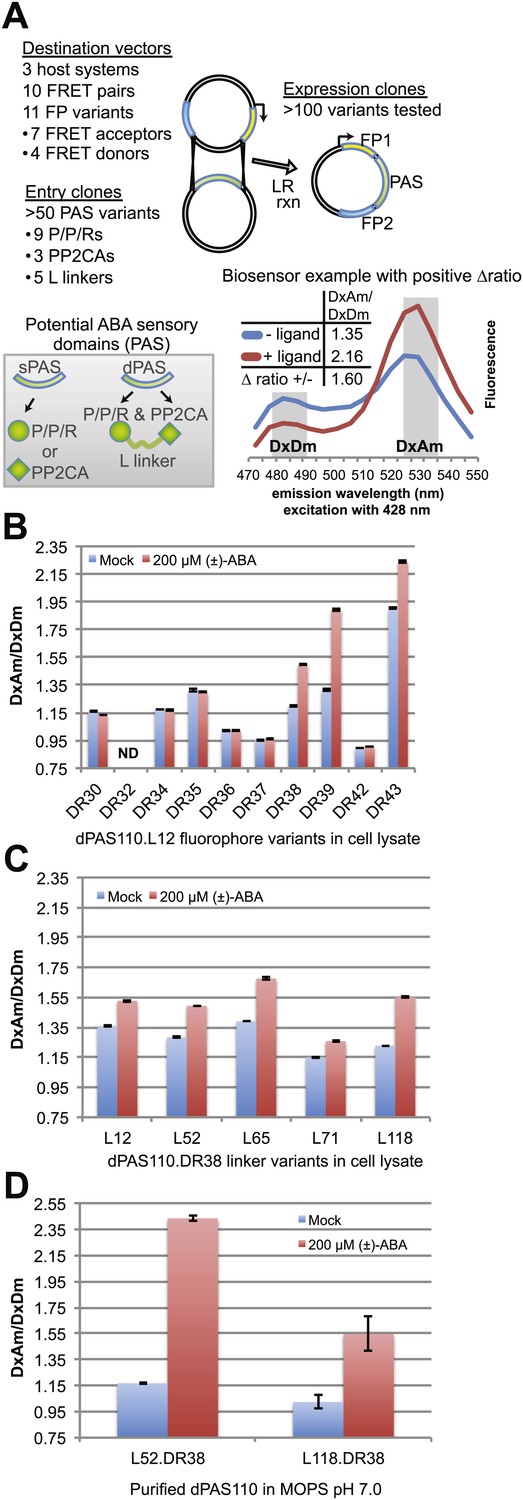
ABA responses of potential FRET sensors expressed in yeast and tested in yeast cell lysates or as purified proteins.
(A) Diagram of cloning strategy based on pDR FLIP Destination vectors encoding FRET fluorescent protein pairs and PAS Entry clones encoding sPAS or dPAS ABA sensory domains. Also shown is an example of fluorescence emission curves without and with ligand for a sensor [ABACUS1-80µ, see below] with a positive ratio change (Δ DxDm/DxAm) of 1.6. (B) One linker variant (L12) of one dPAS (110) combined with nine fluorescent protein pairs. (C) Five linker variants of one dPAS combined with one fluorescent protein pair. (D) Two linker variants of one dPAS combined with one fluorescent protein pair tested as purified proteins. DxAm/DxDm = acceptor emission with donor excitation over donor emission with donor excitation. dPAS = double putative ABA sensory domain.
Figure 1—figure supplement 1
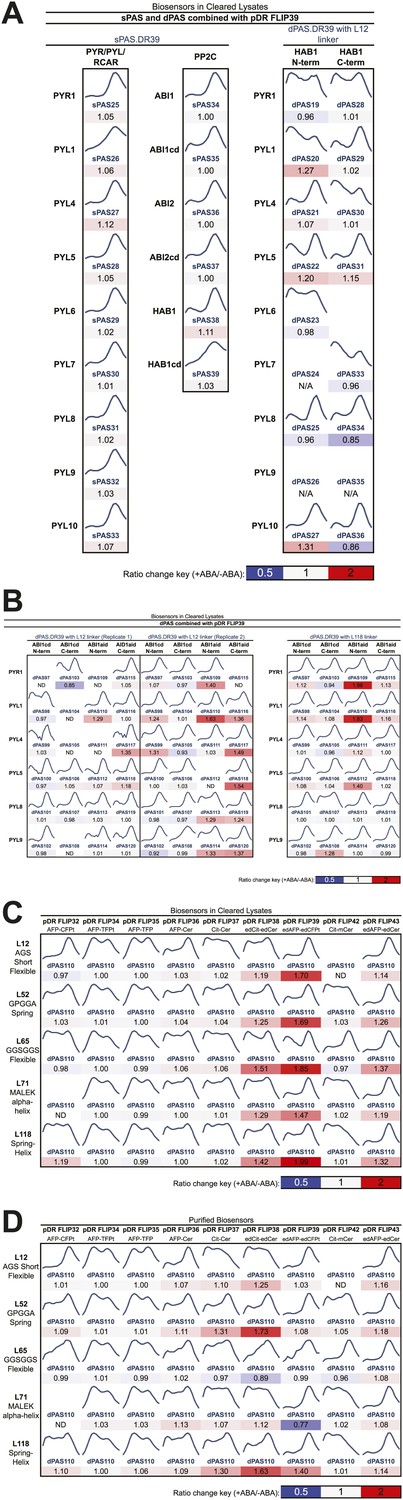
Fluorescence emission curves and ABA response of potential FRET sensors expressed in yeast and tested in yeast cell lysates or as purified proteins (excitation wavelength = 428 nm).
(A) Sensor designs with single Potential ABA Sensory domains (sPAS) and double Potential ABA Sensory domains (dPAS) combined with one fluorophore pair (from pDR FLIP39). (B) dPAS sensor designs using ABI1 truncations and two linker variants combined with one fluorophore pair (from pDR FLIP39). Five linker variants of one dPAS combined with nine fluorophore pair variants tested in cell lysates (C) or as purified proteins (D). Ratio change = treated DxAm/DxDm/mock DxAm/DxDm.
Figure 2
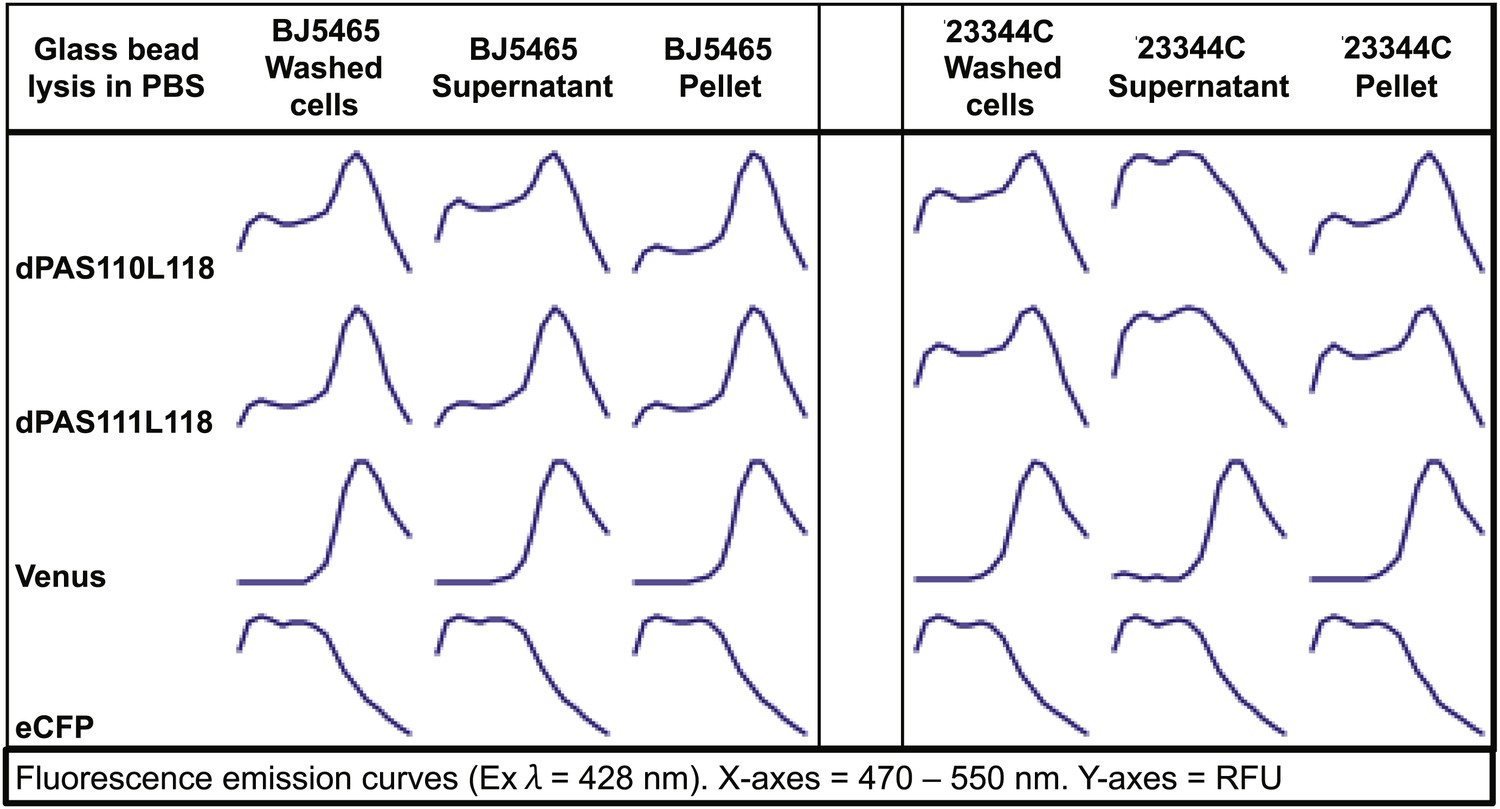
Fluorescence emission spectra of two sensors and individual fluorescent proteins expressed in yeast strain 23344C and protease deficient yeast strain BJ5465 (excitation wavelength = 428 nm).
Proteins were analyzed in washed cells and in the supernatant or pellet of cell lysates.
Figure 3

ABACUS1 design and fluorescence response to ABA and related compounds.
(A) Hypothetical model of ABACUS1 bound to ABA. The structure shown for dPAS110 is derived from a crystal structure of ABA bound to PYL1 and ABI1 (PDB: 3JRQ) (Miyazono et al., 2009), and the structure shown for FRET donor enhanced dimer Cerulean (edCerulean) and FRET acceptor enhanced dimer Citrine (edCitrine) are derived from a crystal structure of Aequorea victoria GFP (PDB:1EMA) (Ormö et al., 1996). The structures are visualized using MacPyMol cartoon representation except for the ABA interacting tryptophan 300 of ABI1, which is shown in line representation and (+)–abscisic acid (yellow, ABA), which is shown in stick representation. The N-termini are colored blue and C-termini are colored red. The linkers are represented as hypothetical cartoon models not derived from known structures. The expected distance between the C-terminus of ABI1aid and the N-terminus of PYL1 (linked by L52 in ABACUS1) and the C-terminus of PYL1 and the N-terminus of ABI1aid (linked to fluorescent proteins), is shown in angstroms. The overall domain order of ABACUS1 is N-terminus–edCitrine–attB1–ABI1aid–L52–PYL1–attB2–edCerulean–C-terminus. ABACUS1-2µ fluorescence emission at shown wavelengths in response to (±)-ABA or xanthine (B), other phytohormones (C), glucose and various salts (D), pyrabactin (E). Excitation wavelength = 428 nm. Delta ratio (ΔR) = treatment DxAm/DxDm/mock DxAm/DxDm. (F) Titration curve for ABACUS1-2µ in response to equivalent concentrations of (+)-ABA supplied alone or as part of a racemic mixture with (−)-ABA.
Figure 4
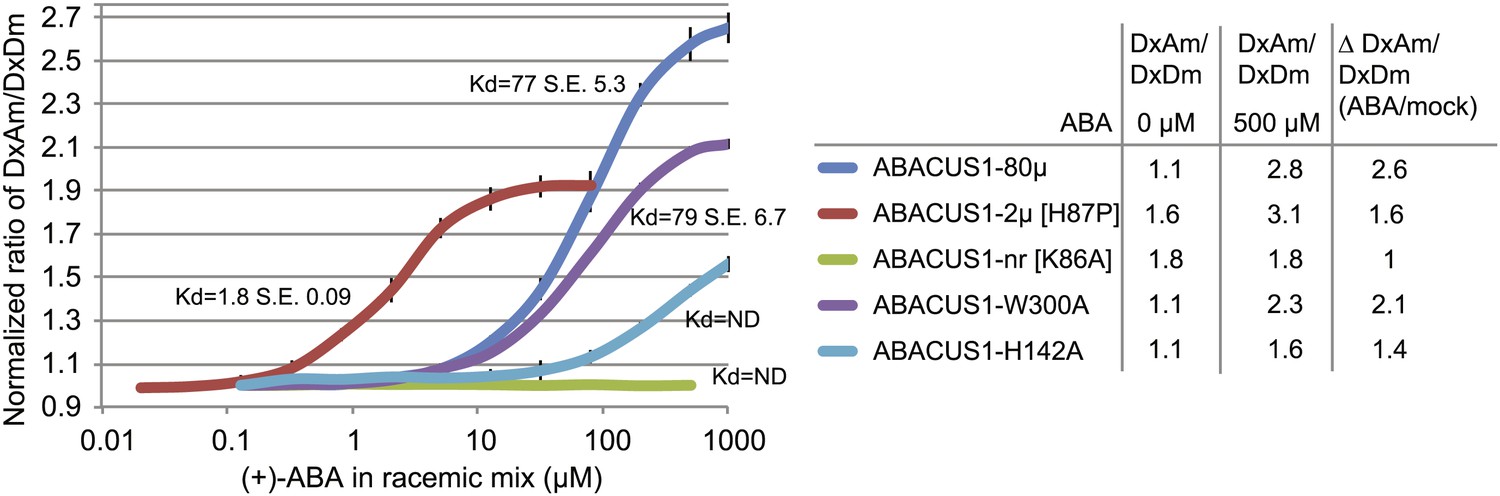
ABA response titration curves for wild-type ABACUS1 (ABACUS1-80µ) and four different point mutants.
DxAm/DxDm values for purified sensor samples plus ABA were normalized to corresponding mock treated samples. Kd values were determined using Prism software (GraphPad) and are calculated based on the (+)-ABA concentration since ABACUS1 is stereospecific to (+)-ABA (Figure 3F).
Figure 5
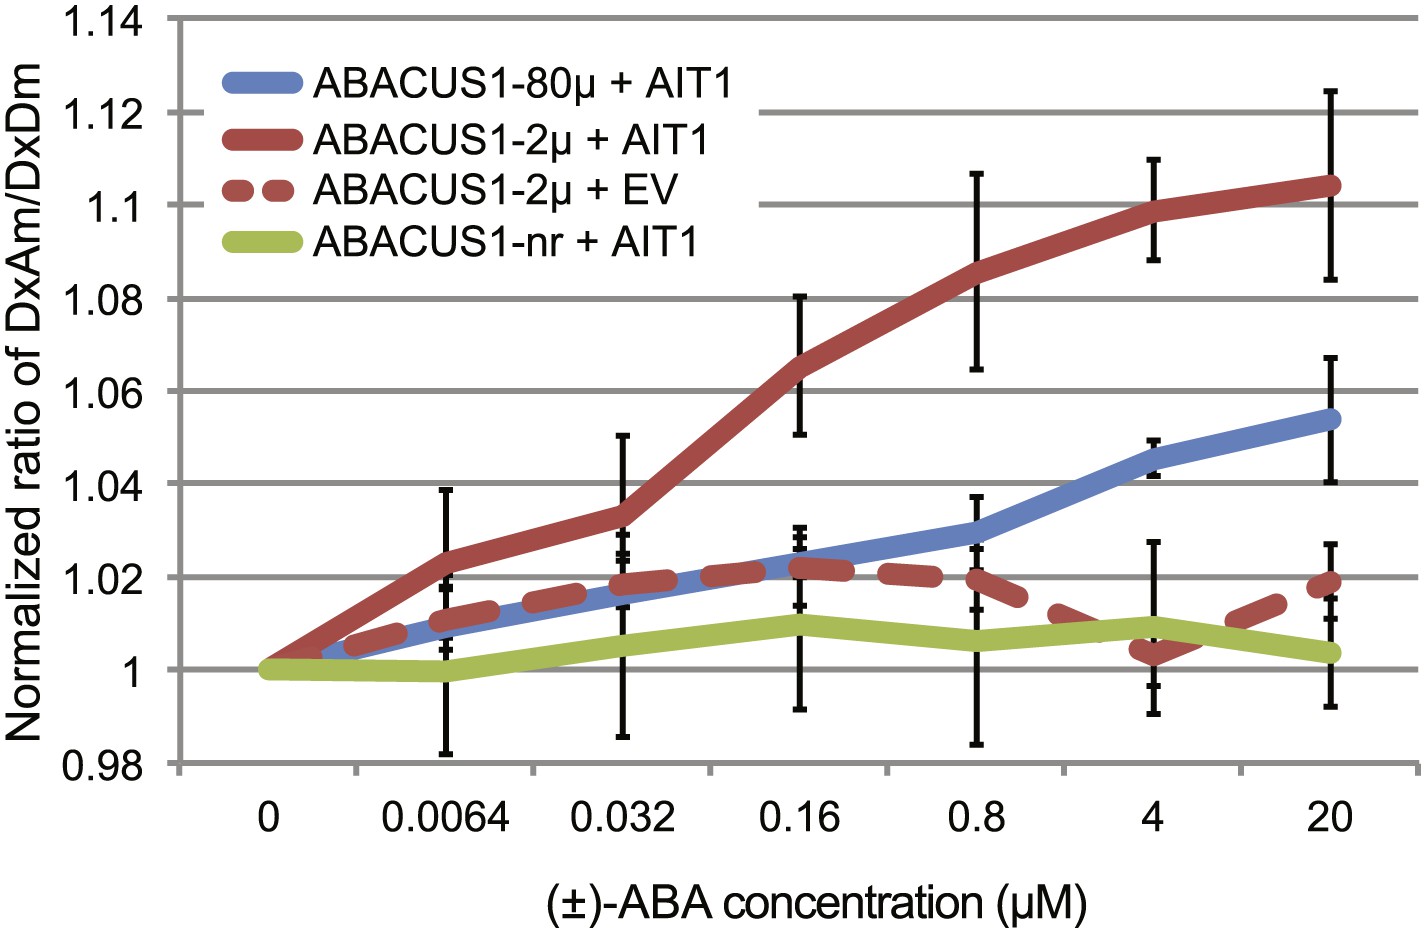
ABA import by AIT1/NRT1.2 in protease deficient yeast expressing ABACUS1 variants.
ABA was added to yeast cells suspended in 20 mM MES buffer (pH4.7) and ABACUS1 fluorescence was measured after 5 min. DxAm/DxDm values for yeast samples plus ABA were normalized to corresponding mock treated samples. EV = empty vector control. Because ABACUS1 is stereospecific for (+)-ABA the effective ABA concentration available for sensing is ½ the (±)-ABA concentration.
Figure 6 with 1 supplement

Expression pattern and ABA responses of ABACUS1 in Arabidopsis roots.
(A) Expression pattern and cytosolic localization of ABACUS1-2µ fluorescence (AxAm) in root cells in the root tip (left), in the elongation zone (center), and in the differentiation zone (right). (B) ABA titrations of ABACUS1 in roots. Traces show ratio (DxAm/DxDm) changes of ABACUS1-2µ, ABACUS1-80µ and ABACUS1-nr roots in response to six 15-min pulses with increasing concentration of (±)-ABA. (±)-ABA pulses were raised in 5 × increments, from 0.2 µM to 625 µM. Inset shows the ABACUS1-2µ root at time zero with the region used for measurements outlined in yellow. ABA pulses are shown as grey areas and all ratios were normalized to time point 0. (C) Spatial distribution of ABA mediated responses. Ratio images showing pattern of ABACUS1-2µ in response to six (±)-ABA pulses as described above. Right: look up table used for false coloring of ratio images. Because ABACUS1 is stereospecific for (+)-ABA the effective ABA concentration available for sensing is ½ the (±)-ABA concentration.
Figure 6—figure supplement 1
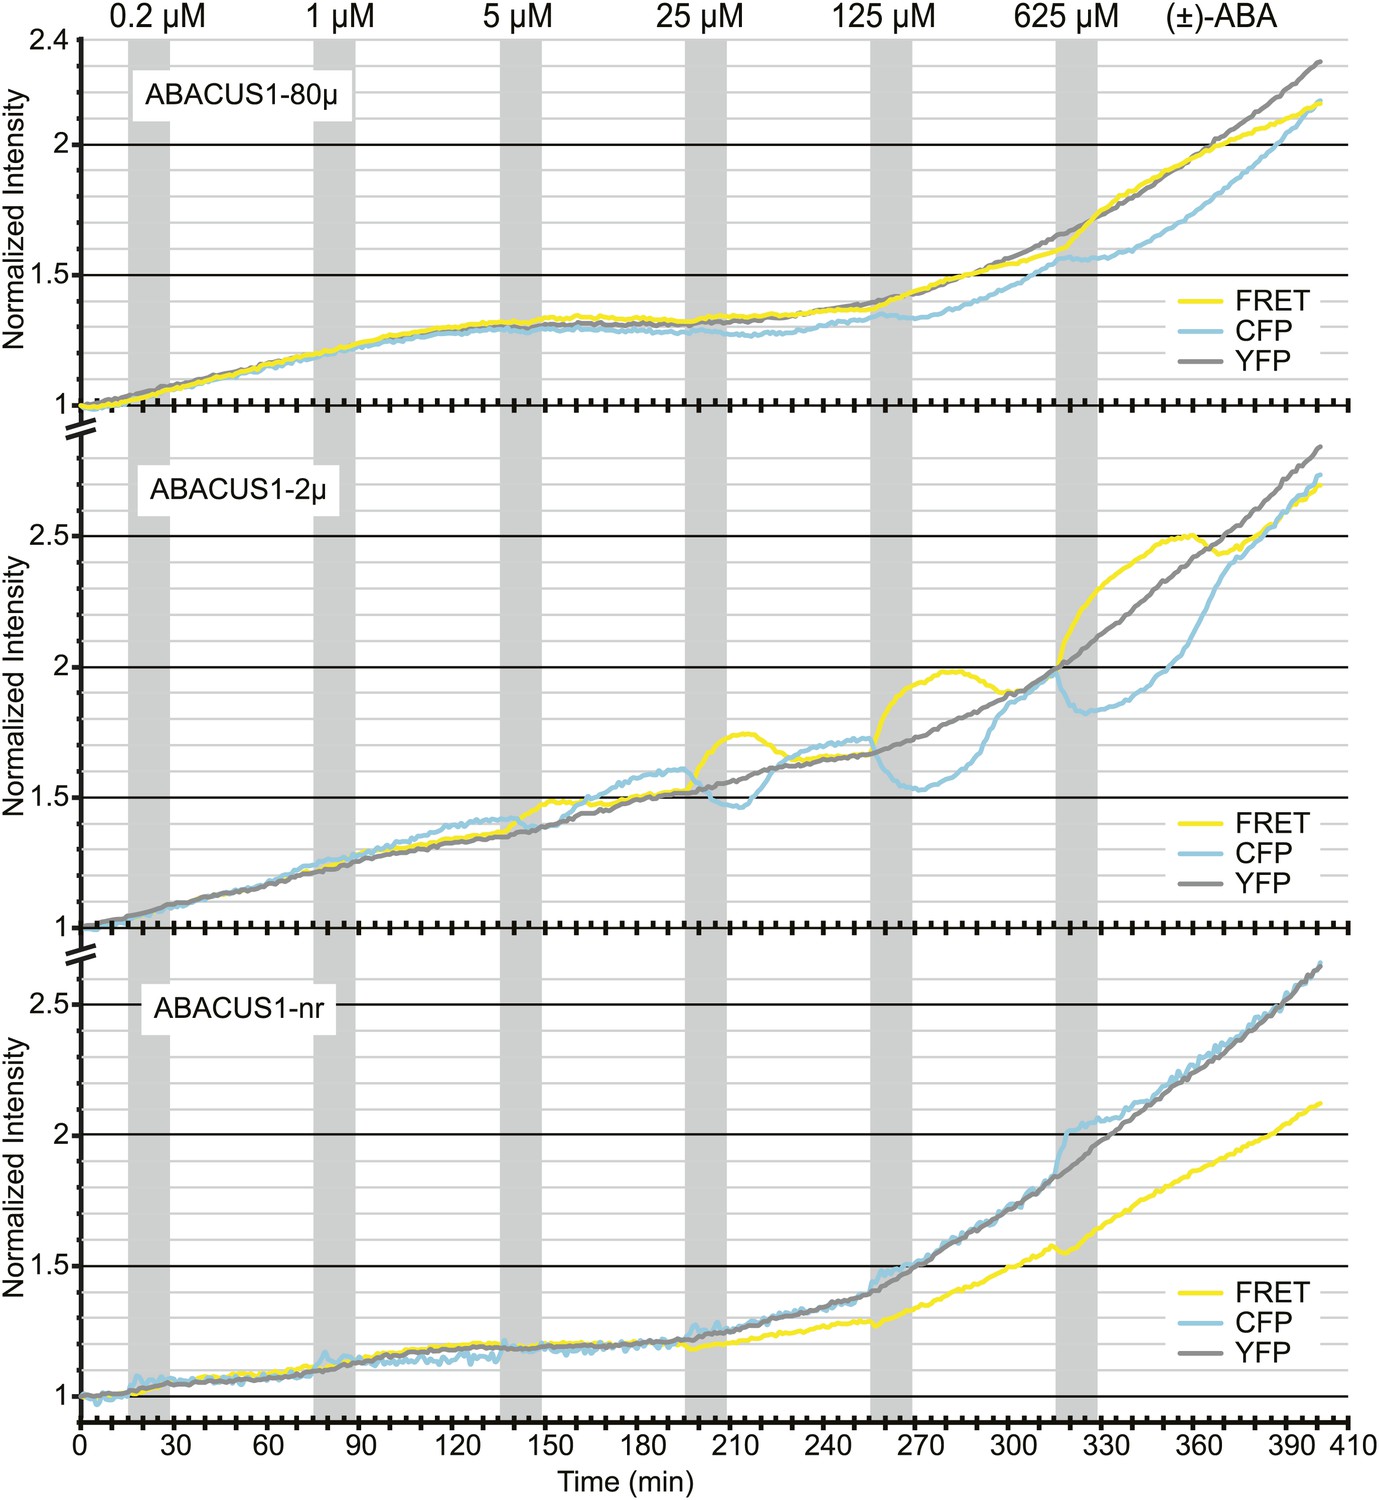
ABA titrations of ABACUS1 roots from Figure 6B.
Traces show FRET (DxAm), CFP (DxDm), and YFP (AxAm) fluorescence intensities of ABACUS1-2µ, ABACUS1-80µ and ABACUS1-nr roots in response to six 15-min pulses with increasing concentration of (±)-ABA. (±)-ABA pulses were raised in 5 × increments, from 0.2 µM to 625 µM. (±)-ABA pulses are shown as grey areas and all ratios were normalized to time point 0. Because ABACUS1 is stereospecific for (+)-ABA the effective ABA concentration available for sensing is ½ the (±)-ABA concentration.
Figure 7 with 1 supplement

ABA responses and plant growth of ABACUS1 plant lines (homozygous, T3 generation).
(A) Fluorescence response of ABACUS1 in roots to 5 µM (±)-ABA. All lines were imaged simultaneously while growing in the same RootChip16. Because ABACUS1 is stereospecific for (+)-ABA, the effective ABA concentration available for sensing is ½ the (±)-ABA concentration. (B) 3 week old ABACUS1 plant lines (homozygous T3) grown on soil in a long day light chamber. (C) Primary root growth of vertically grown Arabidopsis seedlings 4 days after transfer to ½ × MS agar medium plates and plates supplemented with 100 mM NaCl, 200 mM sorbitol or 20 µM (±)-ABA. Values are normalized to mock treated roots and are presented as means and standard deviations of ∼15 roots. (D) Seed germination rate of Arabidopsis seeds sown on ½ × MS agar medium plates supplemented with 2 µM (±)-ABA. Germination percentage is presented as mean and standard error of the mean of three independent experiments of 100–200 seeds each. (E) Primary root growth of vertically grown Arabidopsis seedlings 4 days after transfer to ½ × MS agar medium plates with increasing concentrations of (±)-ABA. Root lengths are presented as means and standard deviations of ∼15 roots.
Figure 7—figure supplement 1

Expression and Plant growth of ABACUS1 plant lines (homozygous T3 generation).
(A) Top: 10 day old seedlings grown vertically on ½ × MS medium agar plates. Bottom: Fluorescence image of the same seedlings. (B) 3 week old ABACUS1 plant lines (homozygous T3) grown on soil in a long day light chamber.
Figure 8
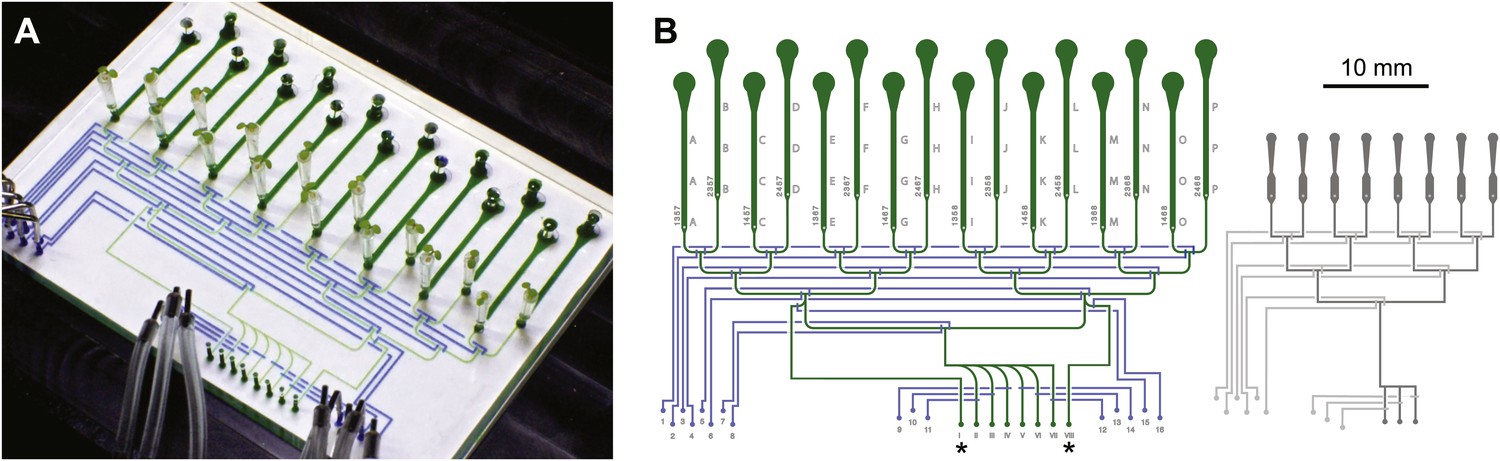
Architecture of the RootChip16.
(A) Photograph of the RootChip16 with control layer microchannels and micromechanical valves stained in blue, flow layer with observation chambers in green, and 5-days old seedlings growing on medium-filled, cut pipette tips. (B) The device design accommodates 16 individual roots in 14 mm long observation chambers and features 6 solution inlets that address all chambers plus 2 inlets (asterisks) that allow perfusion of each half of the chip with two different solutions. To aid quick identification of chip features during imaging, labels are embossed as part of the control layer and visible under the microscope. Chambers are labeled with letters A–P and inlets are labeled with roman (solution inlets) or arabic numbers (valve microchannels). On the left of each chamber the combination of valves is visible that is required to direct the flow to the respective chamber. Right: for comparison, the RootChip design is drawn to scale.
Figure 9
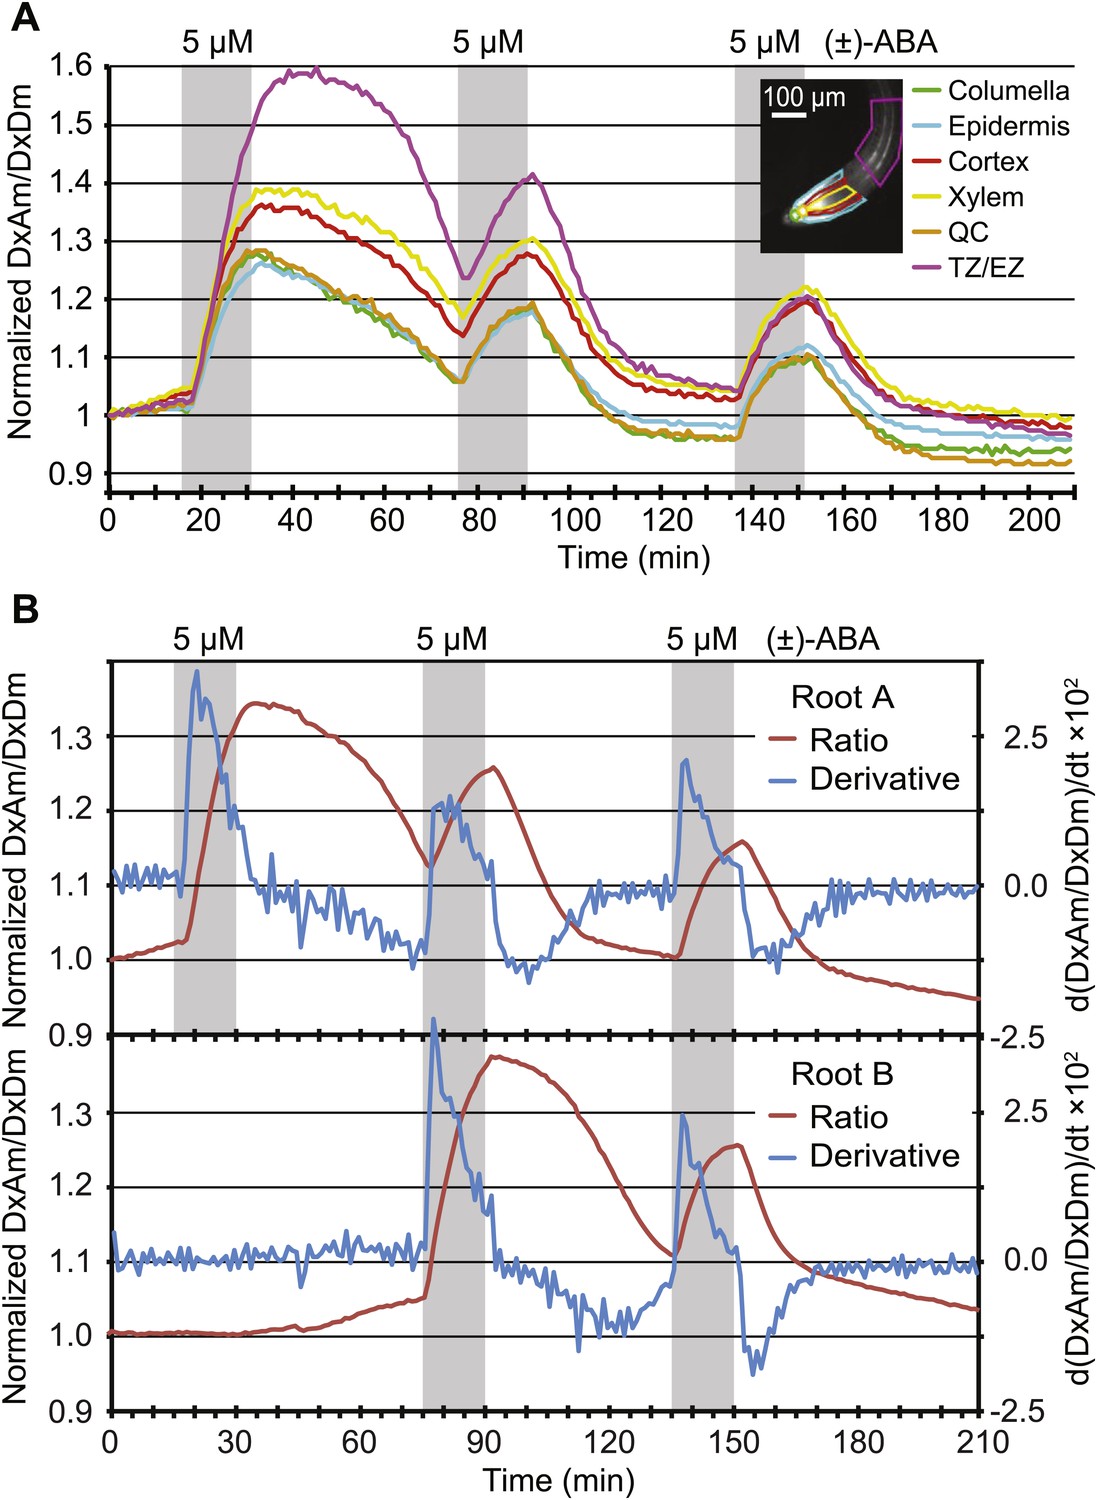
Dynamics of ABA uptake and elimination in roots as measured by ABACUS1-2µ.
(A) Spatial differences in the dynamics of ABA response. Traces showing ratio (DxAm/DxDm) changes in different root zones of an ABACUS1-2µ expressing root in response to three 15-min pulses of 5 µM (±)-ABA. The insert shows the root at time 0 with the regions used for the different zones outlined in the respective colors. (B) Temporal differences in ABA response dynamics. Red traces show ratio (DxAm/DxDm) changes of two ABACUS1-2µ roots from an experiment where roots were exposed to either three (Root A, upper) or two (Root B, lower) consecutive pulses of 5 µM (±)-ABA. The blue lines show the derivative of the respective traces (d[DxAm/DxDm]/dt) to aid in interpreting the dynamics of uptake and elimination. For all traces, (±)-ABA pulses are shown as grey areas and all ratios were normalized to time point 0. Because ABACUS1 is stereospecific for (+)-ABA, the effective ABA concentration available for sensing is ½ the (±)-ABA concentration.
Figure 10

Pattern of ribosome-associated transcripts for AIT1 and ABCG40 transporter genes.
Data are derived from microarray studies of RNA bound to polysomes (http://efp.ucr.edu/) (Mustroph et al., 2009). Cell-type-specific expression is based on coexpression with any of the six genes whose promoters were used for driving the ribosomal affinity tag: pGL.2 for trichomes, pCER5 for epidermis, pRBCS for mesophyll, pSULTR2.2 for bundle sheath, pSUC2 for companion cells and pKAT1 for guard cells. While the cell-specificity of the pSUC2 promoter is unambiguous in companion cells with leakage into the sieve elements (Truernit and Sauer, 1995), bundle sheath expression of pSULT2.2 is not as well documented (Takahashi et al., 2000). Further analysis is required, therefore the representation in this figures as taken from http://efp.ucr.edu/ may not accurately reflect the cell type specificity. The expression levels are color-coded with yellow indicating low levels of expression and red corresponding to high levels of expression.
Figure 11
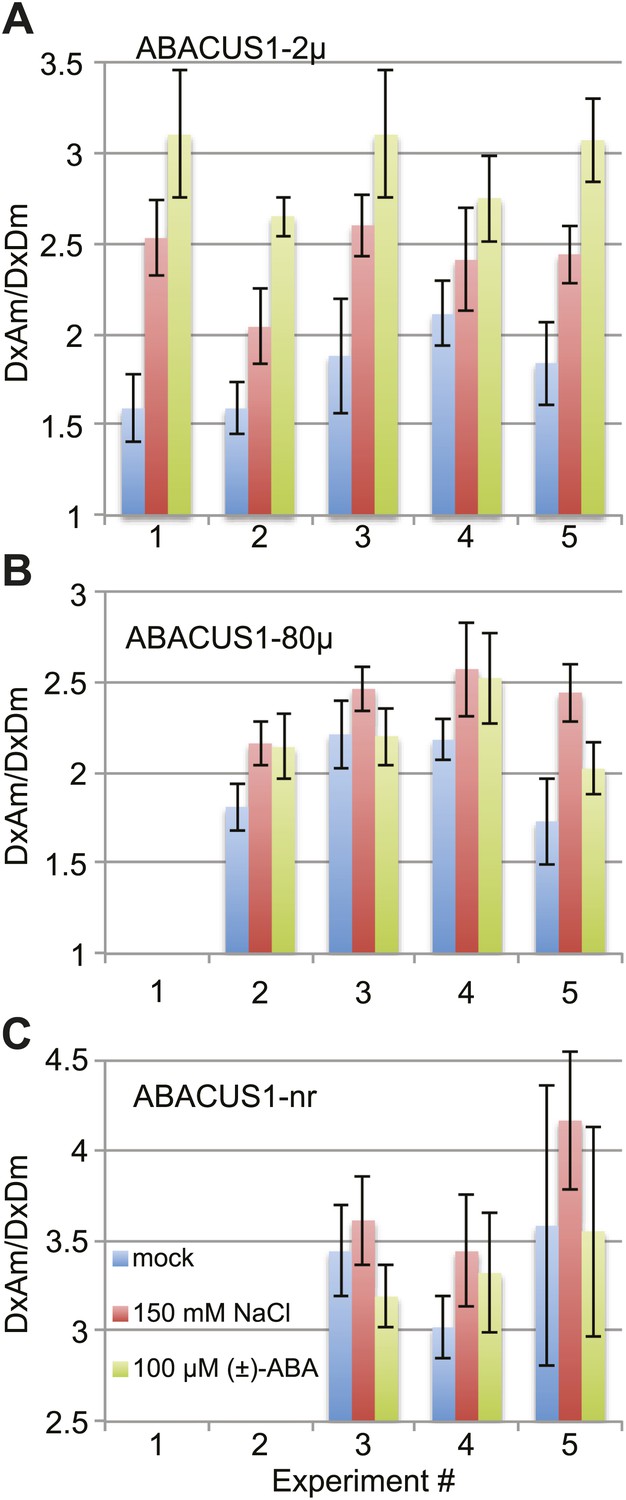
ABACUS1 response to salt and ABA treatment of detached leaves.
DxAm/DxDm ratios for Arabidopsis leaves after 24 hr of suspension of the petiole in ¼ × MS medium or the same medium supplemented with 150 mM NaCl or 100 µM (±)-ABA. Average ratio are shown for (A) ABACUS1-2µ (B) ABACUS1-80µ and (C) ABACUS1-nr leaves. Because ABACUS1 is stereospecific for (+)-ABA the effective ABA concentration available for sensing is ½ the (±)-ABA concentration.
Figure 12
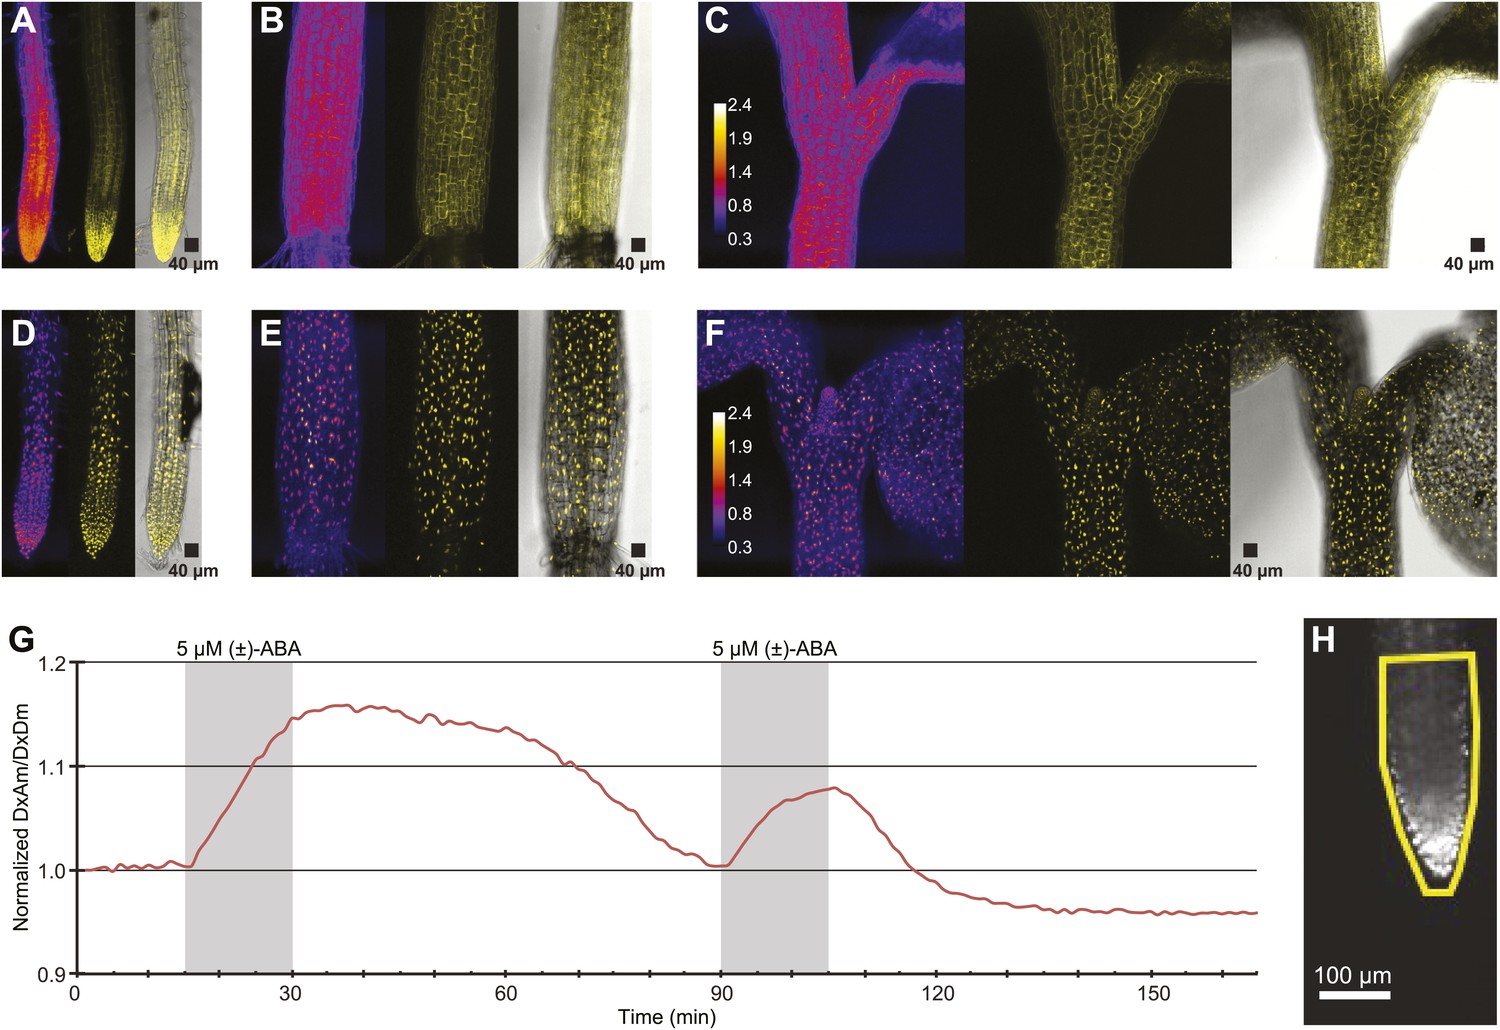
ABA response of nuclear localized ABACUS.
(A–F) Confocal scanning microscopy images of the roots (A and D), hypocotyl (B and E) and region around the shoot apical meristem (C and F) of seedlings expressing either the cytosolic (A–C) or the nuclear localized (D–E) version of the ABACUS1-2µ sensor. From left to right the images in each panel show (Left) ratios (DxDm/DxAm, calculated as the sum of DxDm divided by the sum of DxAm in order to minimize artifacts due to pixel to pixel noise in z-direction), (Middle) maximum projections of the YFP signal and (Right) a bright field image of the middle plane in the z-stack with the maximum projected YFP signal overlaid. The calibration bar in ratio images (C and F) shows the look up table used for all ratio images. The scale bar in the bright field image with overlaid YFP shows a 40 µm × 40 µm square. (G) Trace showing ratio (DxAm/DxDm) of the root tip of a seedling expressing the nuclear localized ABACUS1-2µ sensor in response to ABA. The grey areas indicate two 15-min pulses of 5 µM (±)-ABA and the ratio is normalized to the time point 0. (H) The root imaged for the trace showed in (G) with the ROI used for measuring outlined in yellow and a scale bar showing the distance of 100 µm. Because ABACUS1 is stereospecific for (+)-ABA, the effective ABA concentration available for sensing is half the (±)-ABA concentration.
Videos
Video 1
The video shows an ABACUS1-2µ Arabidopsis root, growing in a RootChip16, exposed to pulses of increasing concentrations of ABA.
The RATIO and YFP videos show the root throughout the experiment whereas the central charts show the average ratio (in magenta) and intensity (in yellow) of three regions (ROIs shown as overlaid on the root). The RATIO video (left) shows the ratio (DxAm/DxDm) using the color-code shown in the calibration bar on the leftmost side. The YFP video (right) shows acceptor emission intensities upon acceptor excitation (AxAm). Grey areas in the charts indicate ABA pulses of increasing concentrations (0.1–312.5 µM (+)-ABA, in 5x increments and supplied as racemic mix). The red vertical line shows position of current time in the charts. Scale bar corresponds to 100 µm and the counter in the lower left corner shows time elapsed in minutes.
Tables
Table 1
Guide to sensor component variants used for screening (for details see Supplementary file 1).
| Destination vector N-term | Gateway site | dPAS Entry clone | Gateway site | Destination vector C-term | |||
|---|---|---|---|---|---|---|---|
| pDR FLIP | FRET acceptor | N-term Linker | dPAS N-term | dPAS Linker | dPAS C-term | C-term Linker | FRET donor |
| 30 | Aphrodite.t9 | attB1 invariant | HAB1 · ABI1aid · ABI1cd · PYR1 · PYL1 · PYL4 · PYL5 · PYL6 · PYL7 · PYL8 · PYL9 · PYL10 | L12 Flexible · L52 Spring · L65 Flexible · L71 α-helix · L118 Spring & α-helix | HAB1 · ABI1aid · ABI1cd · PYR1 · PYL1 · PYL4 · PYL5 · PYL6 · PYL7 · PYL8 · PYL9 · PYL10 | attB2 invariant | mCerulean |
| 32 | Aphrodite.t9 | t7.eCFP.t9 | |||||
| 34 | Aphrodite.t9 | t7.TFP.t9 | |||||
| 35 | Aphrodite.t9 | mTFP.t9 | |||||
| 36 | Aphrodite.t9 | Cerulean | |||||
| 37 | Citrine | Cerulean | |||||
| 38 | edCitrine | edCerulean | |||||
| 39 | edAphrodite.t9 | t7.ed.eCFP.t9 | |||||
| 42 | Citrine | mCerulean | |||||
| 43 | edAphrodite.t9 | edCerulean | |||||
-
Abbreviations: t7, t9: 7 or 9 amino acid terminal truncations; aid: ABA interaction domain; cd: catalytic domain; ed, m: enhanced dimerization or monomeric variant
Additional files
-
Supplementary file 1
Details for pFLIP Destination vectors, PAS Entry clones, L linkers, primers, and ABACUS plant lines.
- https://doi.org/10.7554/eLife.01741.020
Download links
A two-part list of links to download the article, or parts of the article, in various formats.
Downloads (link to download the article as PDF)
Open citations (links to open the citations from this article in various online reference manager services)
Cite this article (links to download the citations from this article in formats compatible with various reference manager tools)
Abscisic acid dynamics in roots detected with genetically encoded FRET sensors
eLife 3:e01741.
https://doi.org/10.7554/eLife.01741


