Auditory synapses to song premotor neurons are gated off during vocalization in zebra finches
- Duke University Medical Center, United States
- Duke University, United States
Figures
Figure 1 with 3 supplements
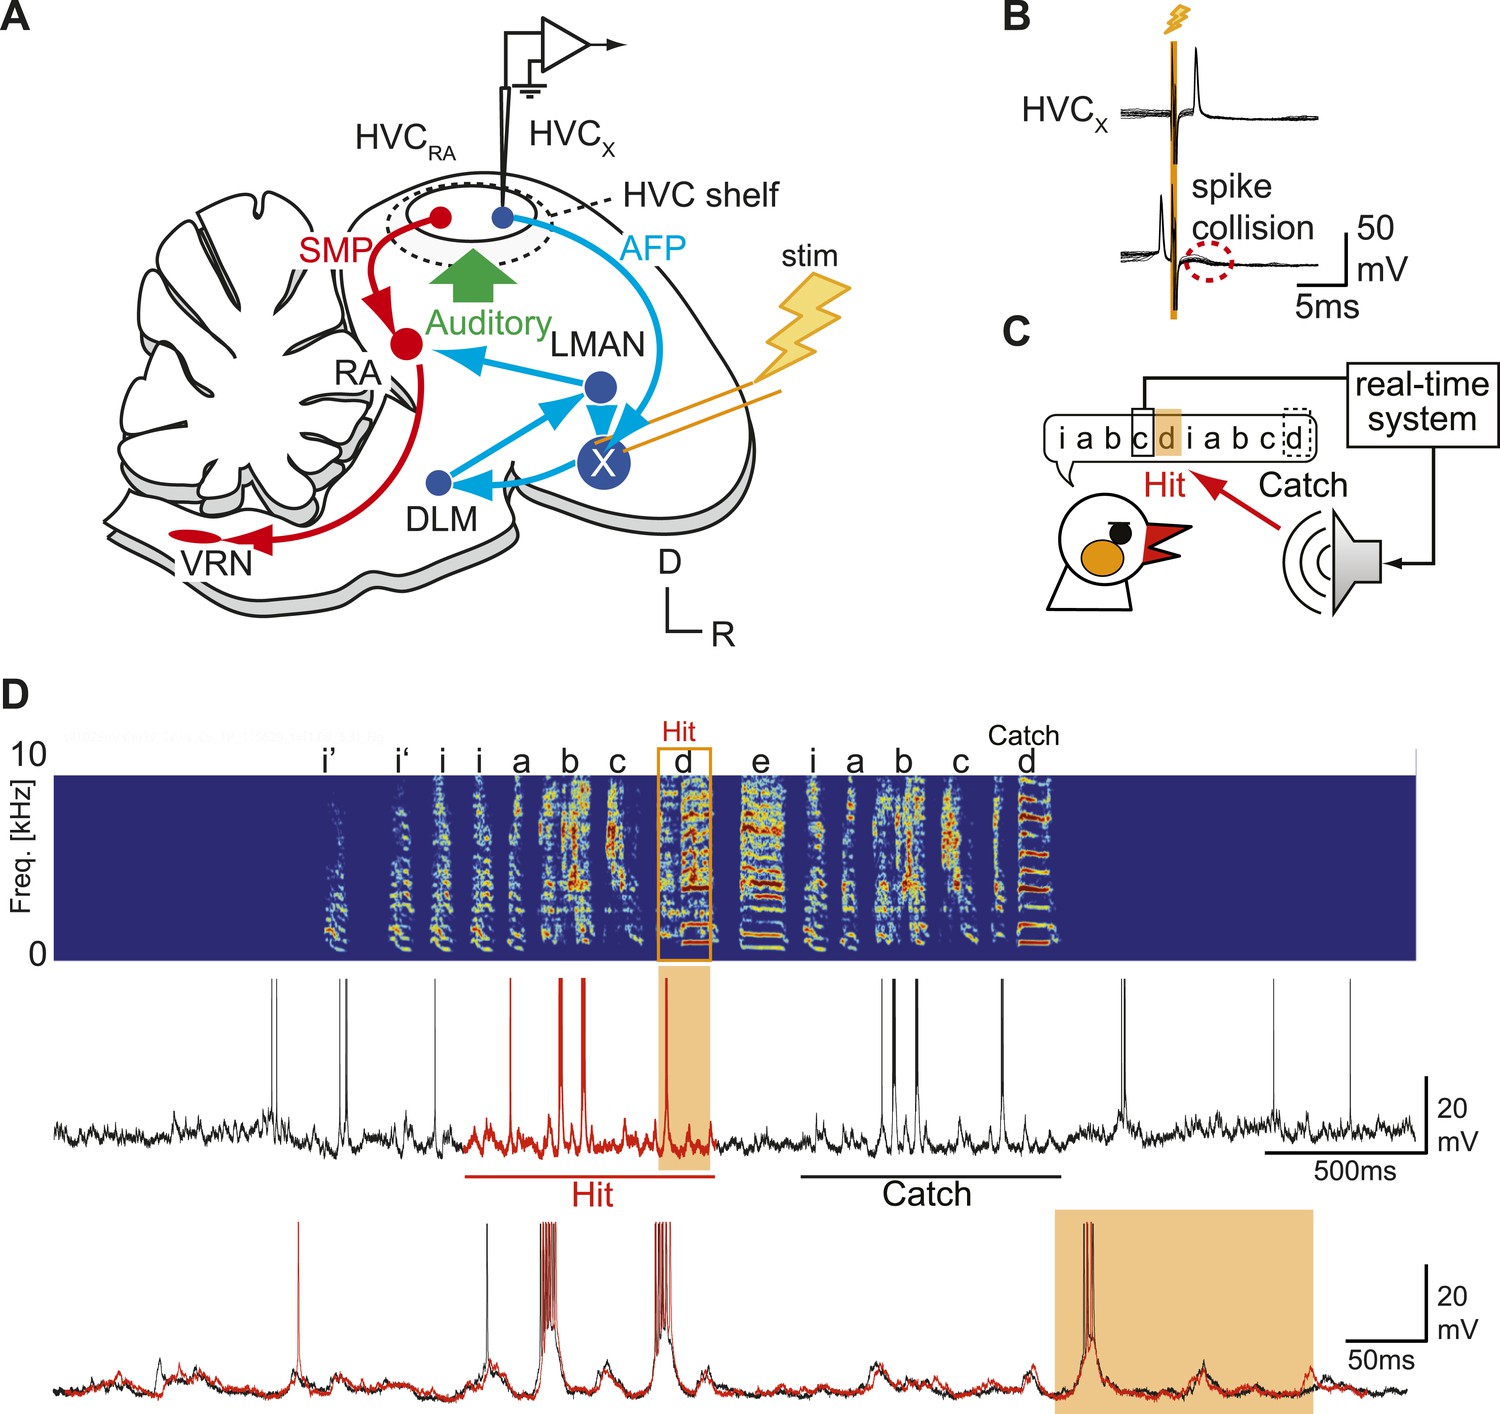
Sharp intracellular recordings from sensorimotor neurons in singing birds.
(A) Schematic illustrates the configuration of the in vivo intracellular recording methods used to measure subthreshold activity of HVCX neurons. Abbreviations: AFP, anterior forebrain pathway (light blue); SMP, song motor pathway (red); RA, robust nucleus of arcopallium; DLM, dorsolateral division of the medial thalamus; LMAN, lateral magno-cellular nucleus of the anterior nidopallium; VRN, brain stem vocal respiratory network, which includes the tracheosyringeal portion of the hypoglossal motor nucleus (nXIIts) and the respiratory premotor neurons located in the rostral ventrolateral medulla (RVL); R, rostral; D, dorsal. (B) Antidromic identification of HVCX neurons was achieved by electrically stimulating Area X combined with spike collision tests. (C) The experimental design used to generate distorted auditory feedback (DAF). Shortly (∼8 to 10 ms) after detecting that the bird sang the target syllable, a recorded version of the target syllable or a noise burst was played to the bird through a speaker (hit); DAF was suppressed on randomly chosen trials (catch). (D) Examples of HVCX intracellular membrane potential recordings during hit and catch conditions. Top: sonogram. Middle: simultaneously recorded HVCX neuron membrane potential. Bottom: expanded view of membrane potential traces aligned to the onset of the entire motif (iabcd), which was sung twice in this bout. The timing of DAF is shown in boxed and shaded regions.
Figure 1—figure supplement 1
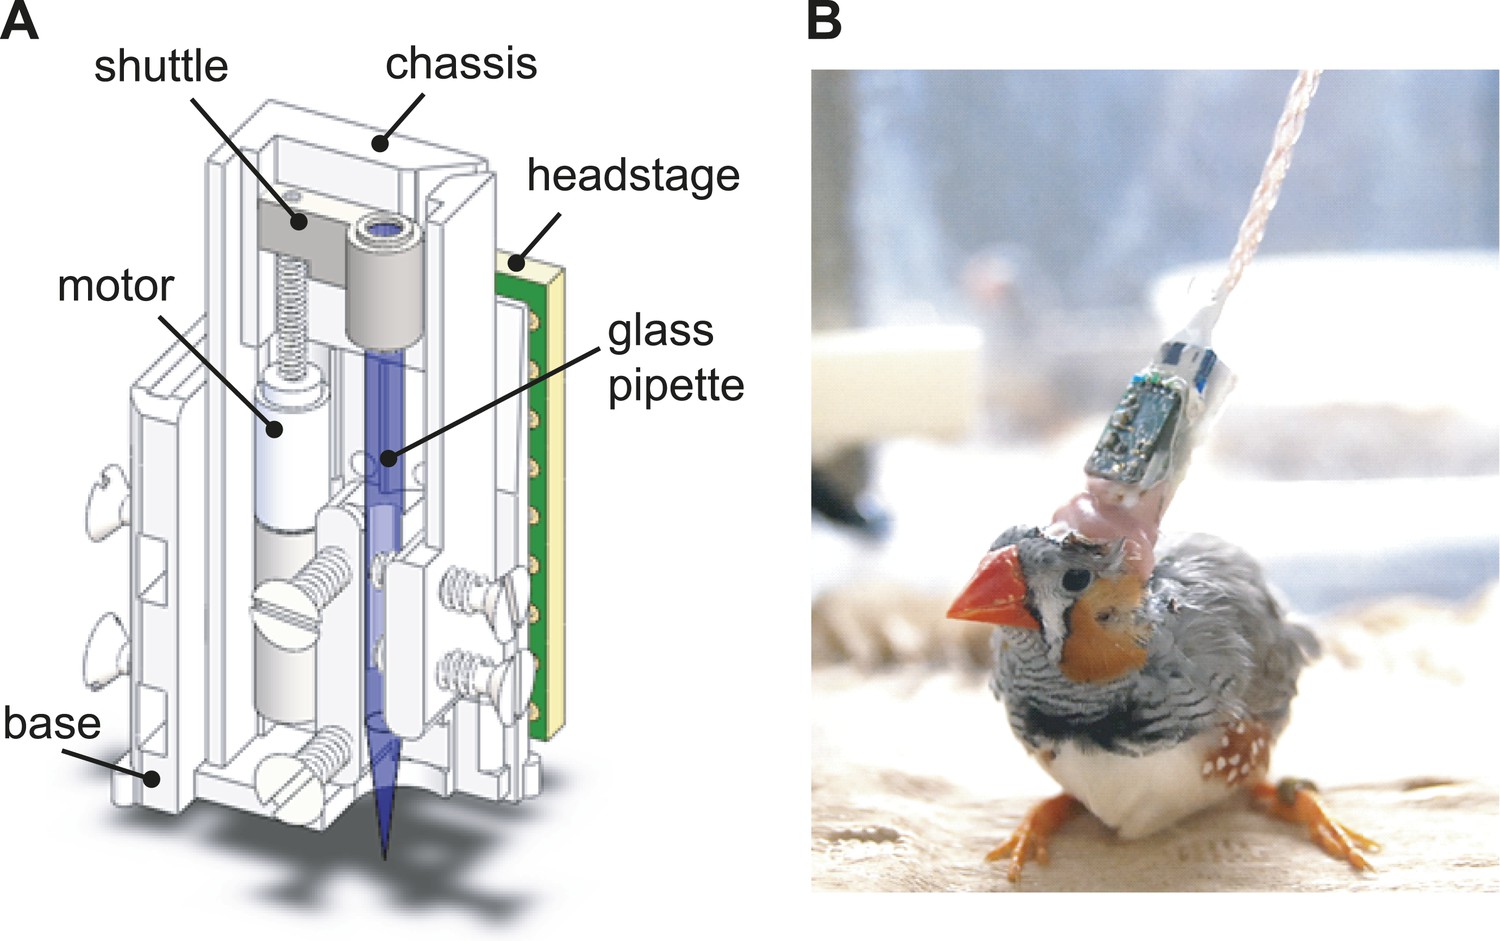
The design of the integrated intracellular microdrive used in these experiments.
(A) Schematic diagram of sharp intracellular microdrive, based on a Microdrive design developed by Michale Fee. (B) A male zebra finch with a microdrive implanted over HVC.
Figure 1—figure supplement 2
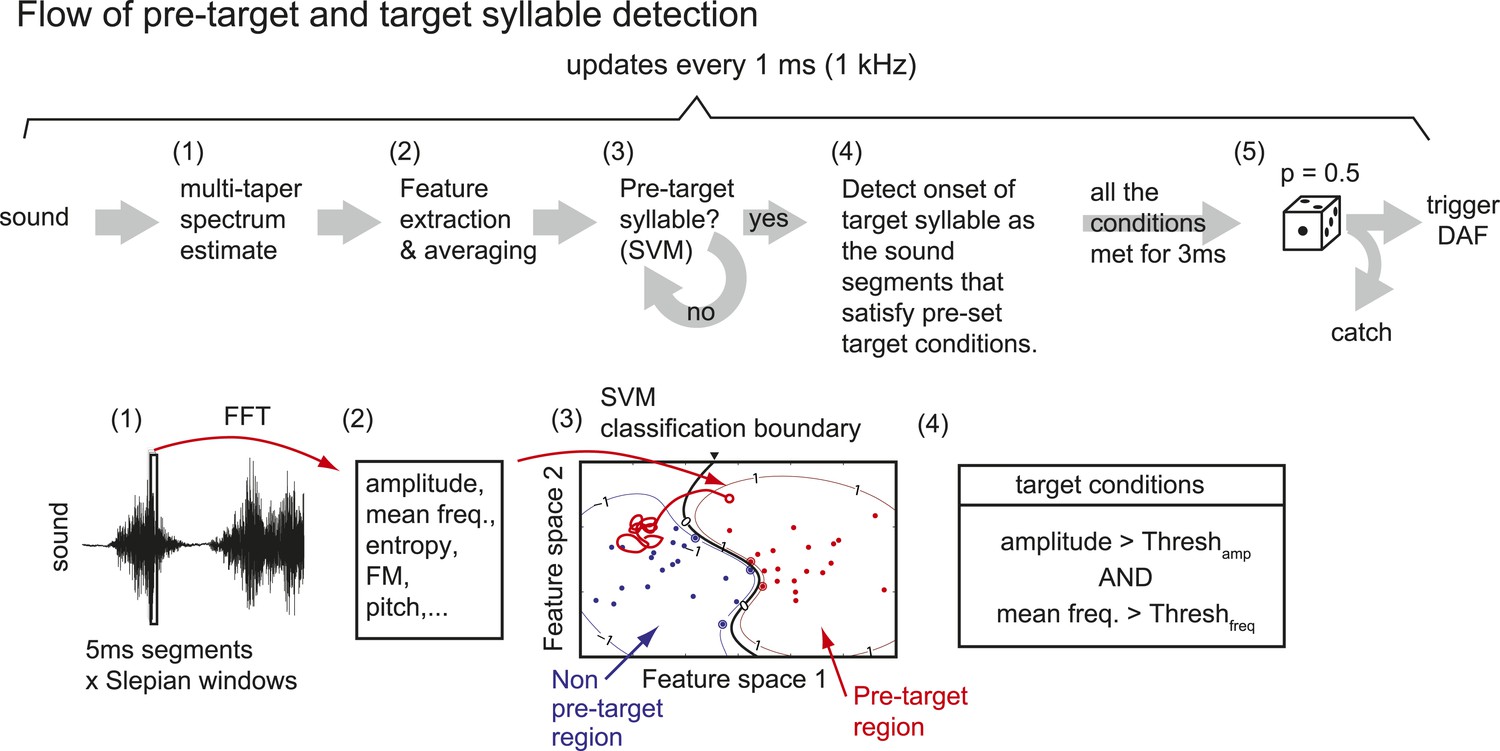
Flow of pre-target and target syllable detection.
(1) First, a multi-taper estimate of spectrum density (Mitra and Pesaran, 1999; Thomson, 1982) of the most recent sound segment (5 ms duration) is calculated. We used the first two Slepian sequences (calculated by dpss function in MATLAB) with NW parameter = 4. (2) Features including sound amplitude, mean frequency, Wiener entropy, frequency modulation (FM), and pitch are calculated. A sound event is detected as a continuous sound chunk during which sound amplitude is higher than a threshold (set to ∼10 times from the baseline noise level). (3) At the end of each sound event, mean and variance of spectral features during the sound event are calculated to identify the pre-target syllable, using a support vector machine (SVM) algorithm. Only two dimensions from the test samples are shown. (4) Once the pre-target syllable is detected, the program starts to detect the onset of target syllables defined as the sound segments that satisfy pre-set conditions for at least 3 ms. If all the conditions are not satisfied for a fixed duration (∼100 ms), the program stops detecting the target syllable and starts to look for the pre-target syllable. (5) When the onset of the target syllable is detected, DAF is either executed immediately or suppressed with some probability (usually set to p=0.5).
Figure 1—figure supplement 3

Contingent DAF drives adaptive changes in spectral features of the target syllable.
When spectral features of a syllable meet certain criteria, white noise is played to the bird. This type of contingent DAF protocol is known to induce adaptive changes in the spectral features of song (Andalman and Fee, 2009; Warren et al., 2011). The criteria used here to trigger DAF were (1) sound amplitude ∼1–5 dB above baseline and (2) a mean frequency above or below a certain threshold (orange regions in [C and D]). This frequency threshold was iteratively adjusted to induce vocal changes in the birds. (A and B) Examples of target syllables (syllable b) that did not receive DAF (A) and that received DAF (B; denoted as b’). (C) Distribution of target syllable frequency as a function of number of syllable renditions (black dots, 10 ms window measured from target onset; red line is running average of syllable frequency). (D) Mean ± SD of the target syllable frequency on each day. The mean frequency of the target syllable shifted significantly after several days of contingent DAF in both upward (day1–4) and downward (day 5–9) directions (t-test, day 1 vs day 4, day 4 vs day 7, day 7 vs day 9, p<10−33). Here, the mean frequency threshold was set to <5000 Hz (days 1–4, escape in upward shift), >5800 Hz (days 5–7, escape in downward shift), and >5400 Hz (days 8 and 9, escape in downward shift).
Figure 2
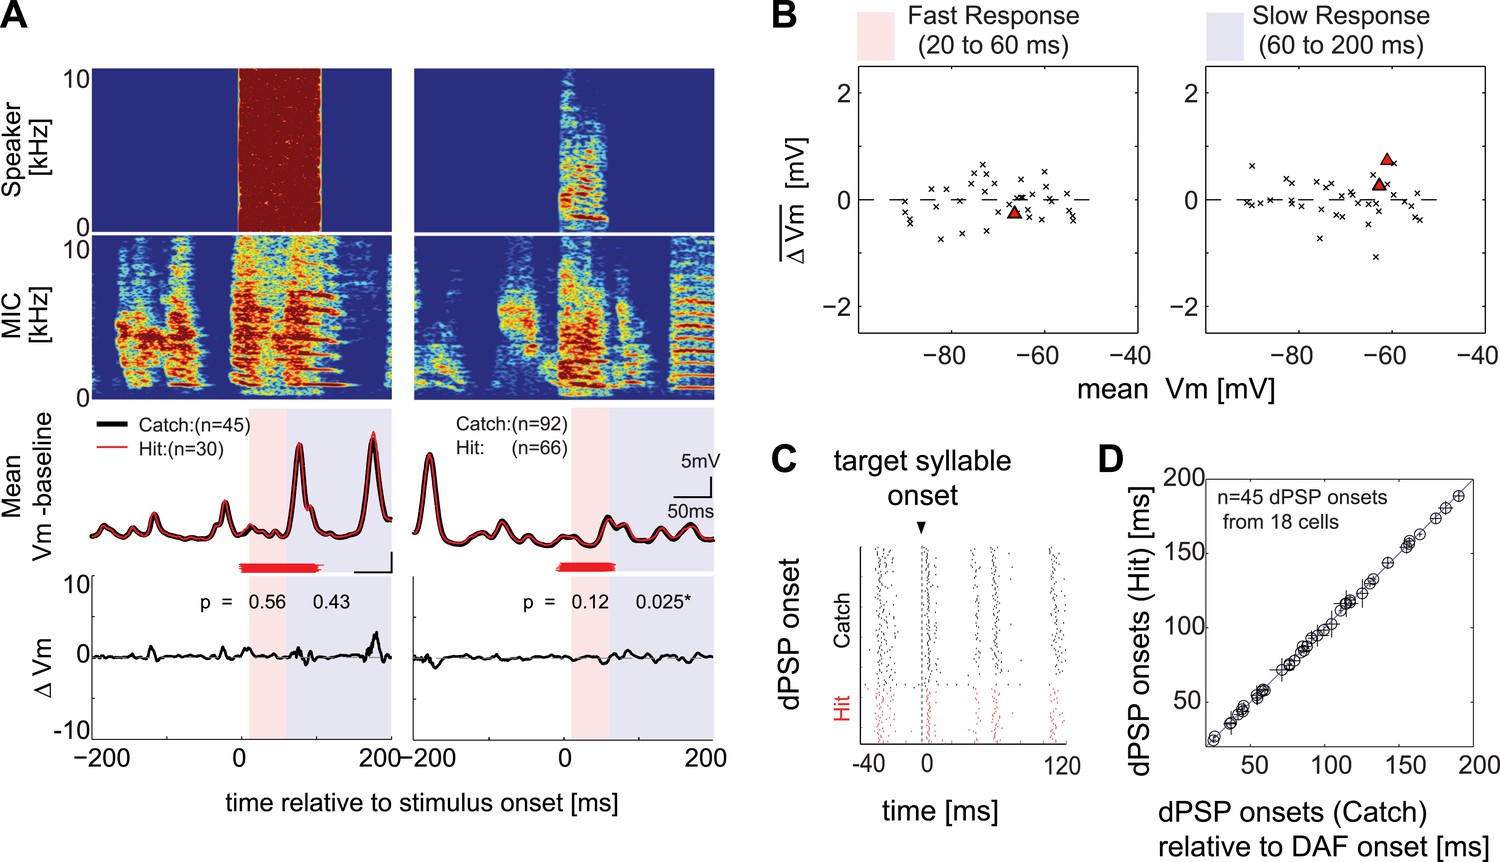
Synapses onto HVCX neurons do not convey auditory feedback signals during singing.
(A) Each row represents (from top to bottom) the speaker output (Speaker), microphone input (MIC), trial-averaged membrane potential activity in hit (red) and catch (black) trials relative to the baseline (defined as −200 to 0 ms before DAF onset), and the difference in membrane potential between hit and catch conditions (ΔVm). Two examples of HVCX singing-related subthreshold activity are shown. Two time ranges are set to bracket DAF onset and offset (fast: 20–60 ms, red-shaded region covers the fastest synaptic latency of HVC in response to auditory stimuli [Lei and Mooney, 2010]; slow: 60–200 ms, purple shaded region covers the remainder of the DAF period). Red horizontal lines indicate the timing of the DAF stimulus presented during each electrophysiological recording. Data are aligned to the onset of the target syllable, and time zero is set to the mean DAF onset. (B) Population analysis of time-averaged ΔVm in fast and slow response windows showed no significant changes in response to DAF (n = 38 comparisons made from n = 34 cells; four cells were analyzed at both resting and at hyperpolarized membrane potentials. Individual cell-based analysis revealed that all except two cells showed non-significant changes; triangles [p<0.05], crosses [p≥0.05, paired t-test]). (C) Examples of dPSP onset timings aligned to target syllable onset obtained from a single cell. (D) Onset timings of dPSPs measured in catch vs hit trials were indistinguishable (n = 45 dPSPs [1–4 dPSP onsets per cell] from 18 cells; see ‘Materials and methods’ for more information about dPSP onset detection and clustering methods used for peak detection; mean p=0.52, min p=0.06, t-test).
Figure 3 with 1 supplement
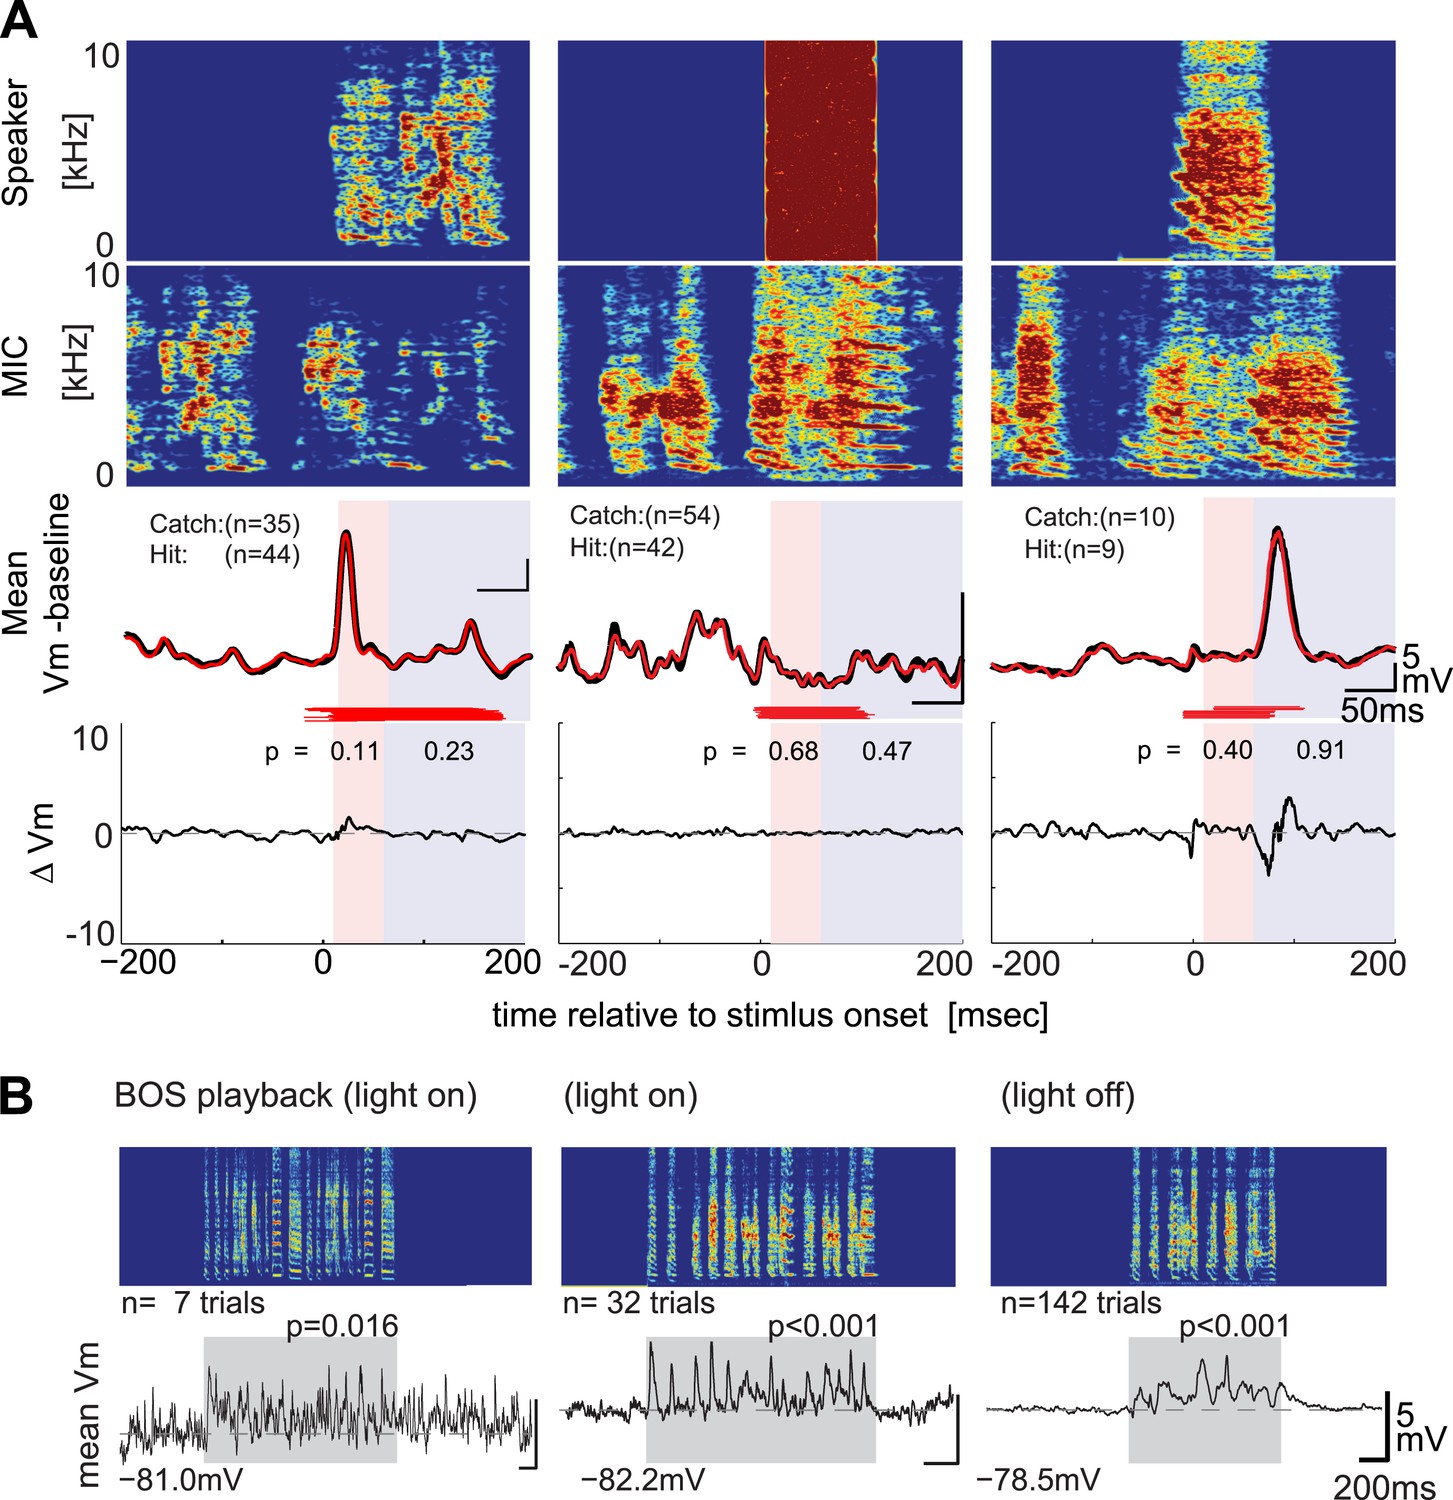
DAF-insensitive HVCX cells can respond to auditory stimuli in non-singing states.
(A) Examples of trial-averaged singing-related subthreshold activity of DAF-insensitive cells in hit and catch conditions, following the same scheme shown in Figure 2A. (B) Examples of averaged subthreshold responses to BOS playback in the cells shown in (A) in day (light on) or night (light off) conditions. The significance of the BOS-evoked auditory response measured in non-singing states was determined either by the difference in the mean (Mann–Whitney U-test) or standard deviations (Ansari–Bradley test, a non-parametric test of variance) of the membrane potential fluctuations during the stimulus period and a pre-stimulus baseline period.
Figure 3—figure supplement 1
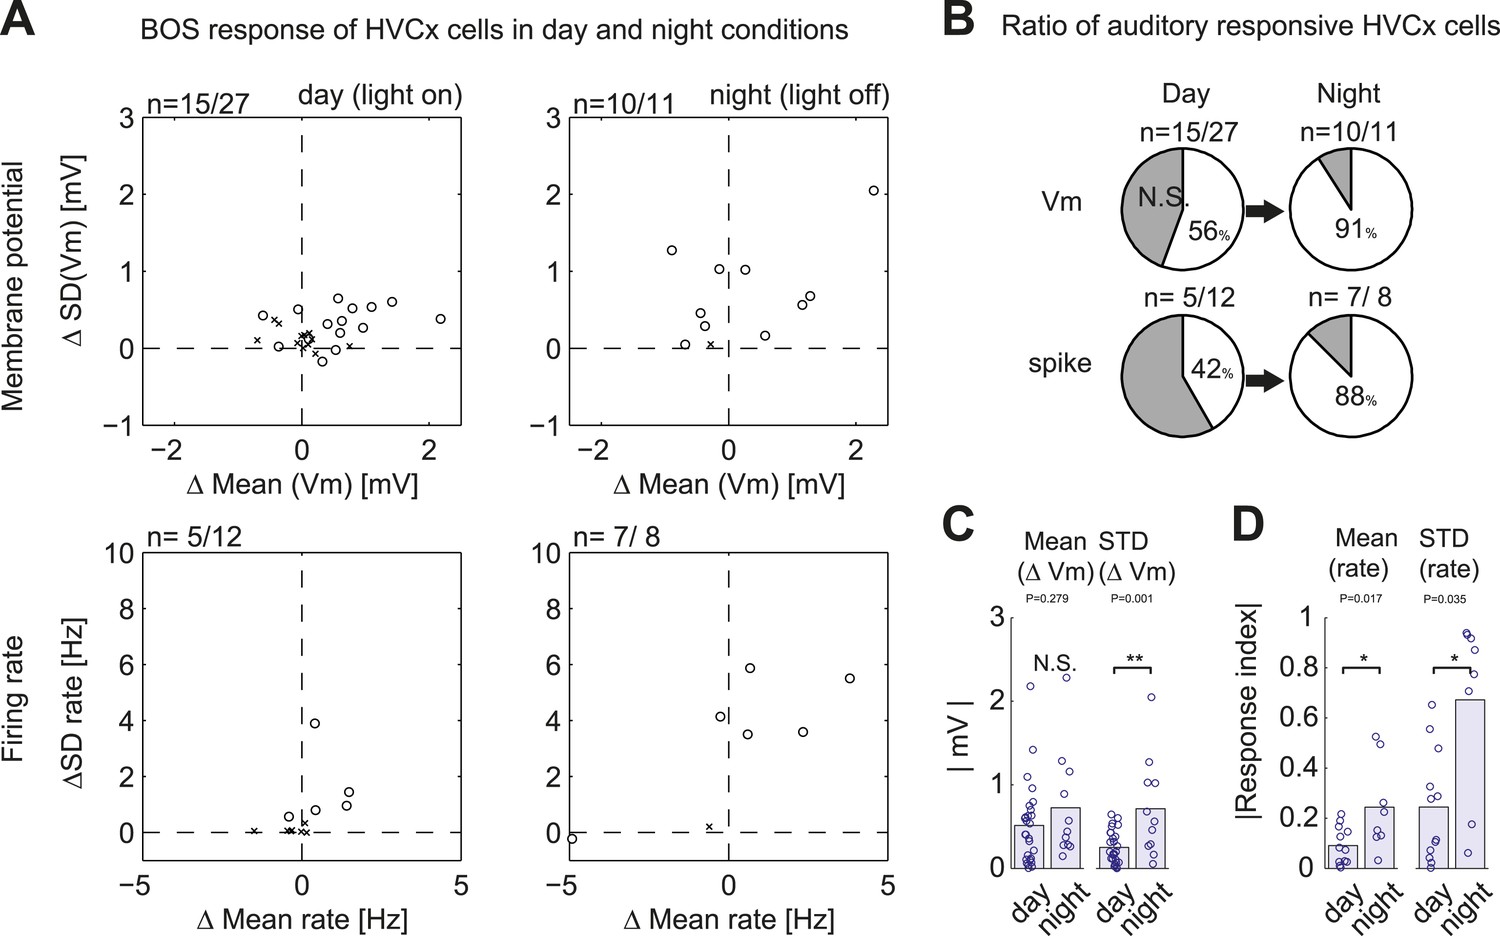
Summary of auditory responses of HVCx cells in non-singing states.
(A) Plots of subthreshold (Vm, top row) and suprathreshold (bottom row) responses to BOS playback measured by the mean and standard deviations (SDs). N = 30 HVCX cells in total. Significance level of auditory responses are tested using either the Mann–Whitney U-test (p<0.05 using ranksum function in MATLAB) or the Ansari–Bradley test (non-parametric test of variance, p<0.05, applied only when there is no significant difference in mean. Using ansaribradley function in MATLAB.) Circles, significant cells; Crosses, non-significant cells. (B) Summary of auditory responsive cells in day and night time. Subthreshold responses: 56% in day (15/27), 91% in night (10/11). Suprathreshold responses: 42% (5/12) in day, 88% (7/8) in night. (C and D) Bar plots showing the increased strength of subthreshold (C) and suprathreshold (D) responses to BOS playback during day and night-time recordings.
Figure 4

Auditory-vocal mirror neurons in zebra finches.
(A) Examples of singing and auditory-related membrane potential activity of two HVCX cells aligned to each bird’s motif. Initially weak but significant auditory responses during the day (black) become robust during the night (blue) and precisely mirror the cell’s singing-related activity (red). The cell at the top is the same cell shown in Figure 3 (A) right, which lacked DAF sensitivity. (B) Emergence of robust BOS-evoked subthreshold activity as the night progresses. Top: BOS responses near the day–night boundary (same cell shown in Figure 4A, top). Baseline-subtracted membrane potential responses aligned to the BOS playback (top panel) and shown in the order of the recording time. Bottom: normalized voltage trace of the cell’s BOS evoked activity at day (black), night (blue) and singing-related activity (red). (C) The same cell’s action potential response to BOS playback, plotted in the same scheme used in (B). 1–2 hr after nightfall, strong BOS-evoked action potential activity was detected that closely mirrored the singing-related activity recorded from this same cell 4–5 hr earlier, during the daytime. (D) Similarity of a cell’s subthreshold activity during singing and hearing the same motif in the day or night measured by the correlation coefficient (C.C.) of averaged membrane potential records reveals enhanced similarity of singing-related and BOS-evoked activity later in the night (≥30 min after light off). Data are only from auditory-responsive cells in which we also collected singing data (singing vs hearing data during the day: n = 7, C.C. = 0.076 ± 0.041 (SEM); Early night, < 30 min after light off: n = 7, C.C. = 0.077 ± 0.061; Late night, ≥ 30 min after light off: n = 4, C.C. = 0.302 ± 0.105. Mann–Whitney U-test, p=0.04 compared to day).
Figure 5 with 1 supplement

Synapses onto HVC shelf neurons convey DAF signals during singing.
(A) Examples of trial-averaged subthreshold activity patterns of DAF-sensitive HVC shelf cells in hit and catch conditions, following the same scheme as Figure 2A. Exposure to DAF significantly increased subthreshold depolarizations during singing. (B) An HVC shelf cell that showed a significant suprathreshold response to DAF, following the same scheme shown in Figure 2A except for the addition of a spike-rastergram in the second row. (C) Time-averaged ΔVm in fast and slow response windows (n = 9 cells, triangles [p<0.05], crosses [p≥0.05, paired t-test]). (D) DAF sensitivity plot for HVC shelf neurons and HVCX cells. Nearly half of the HVC shelf neurons showed DAF sensitivity. The minimum p-values of time-averaged ΔVm either in fast or slow time window are plotted, Mann–Whitney U-test.
Figure 5—figure supplement 1
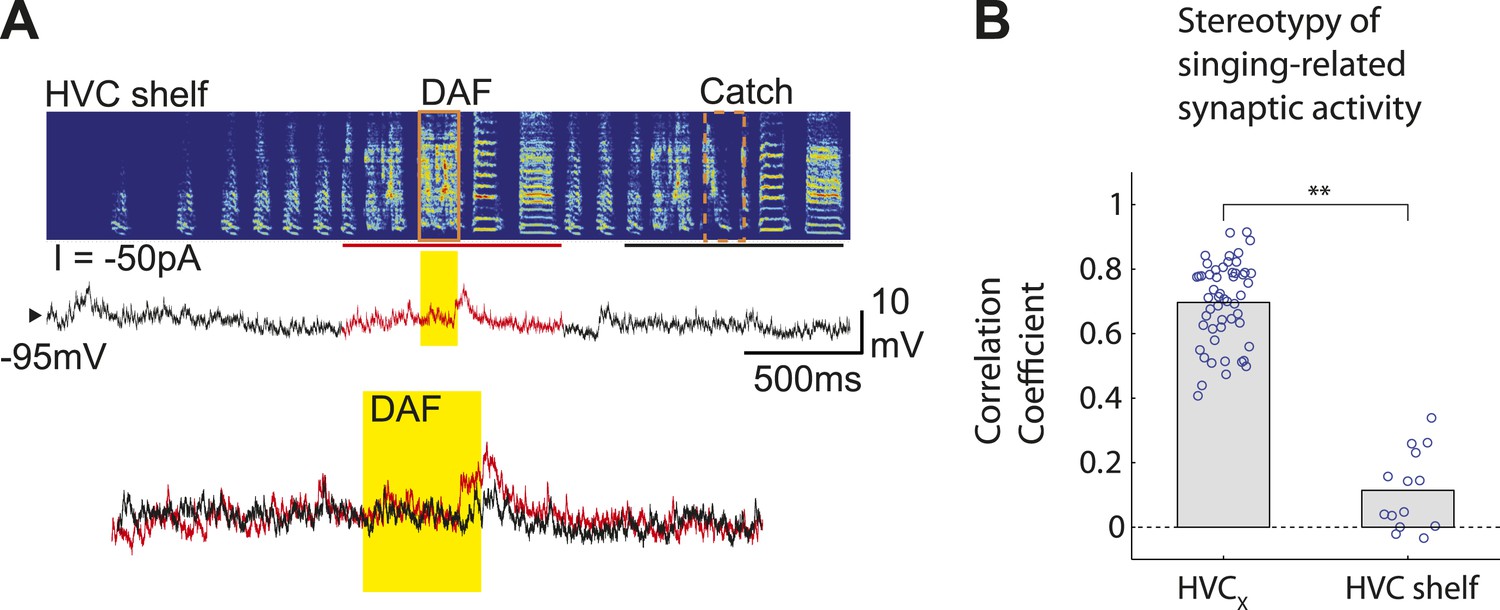
HVC shelf cells show subthreshold DAF sensitivity.
(A) An example of intracellular membrane potential recordings from an HVC shelf neuron during DAF hit and catch conditions, following the same scheme as Figure 1D. Scale bars, 500 ms × 10 mV. (B). Correlation Coefficient (C.C.) of membrane potential traces of individual HVCX and HVC shelf cells recorded while birds sang many renditions of the same motif. No time warping is applied to the data. Mann–Whitney U-test, p<10−7.
Figure 6

Synaptic inputs onto HVCX cells encode future syllable onsets.
(A) An example of a stereotyped syllable sequence, with syllables underlined by orange bars. (B) Pseudo-color representation of the membrane potential patterns relative to baseline while the bird sang many repetitions of the syllable sequence shown in (A). Black dots; syllable onsets. Data are aligned to a specific syllable and sorted from long to short motifs, which reflect natural variations in zebra finch song tempo. (C) Same data shown in (B), but dPSP onsets are shown by black dots, and the timing of individual syllables is represented by the orange regions. (D) Syllable onset- and offset-triggered average of dPSP onset rate (n = 53 HVCX cells). (E) Example spectrograms from catch and ‘hit-and-truncated’ songs. (F) Trial-averaged subthreshold activity during hit-and-truncated songs showed a clear deviation from activity during catch trials. (G) Cumulative histogram of syllable onset timings relative to DAF onset in hit trials including delayed syllables (red dashed line), hit trials without delayed syllables (red solid line), and catch trials (black line). (H) Examples of trial-averaged subthreshold activity reveal that delayed motor output drives changes in the subthreshold activity (compare black and red dashed lines). After removing hit trials with delayed syllables, the subthreshold activity in hit and catch conditions is nearly identical (black vs red solid lines).
Figure 7
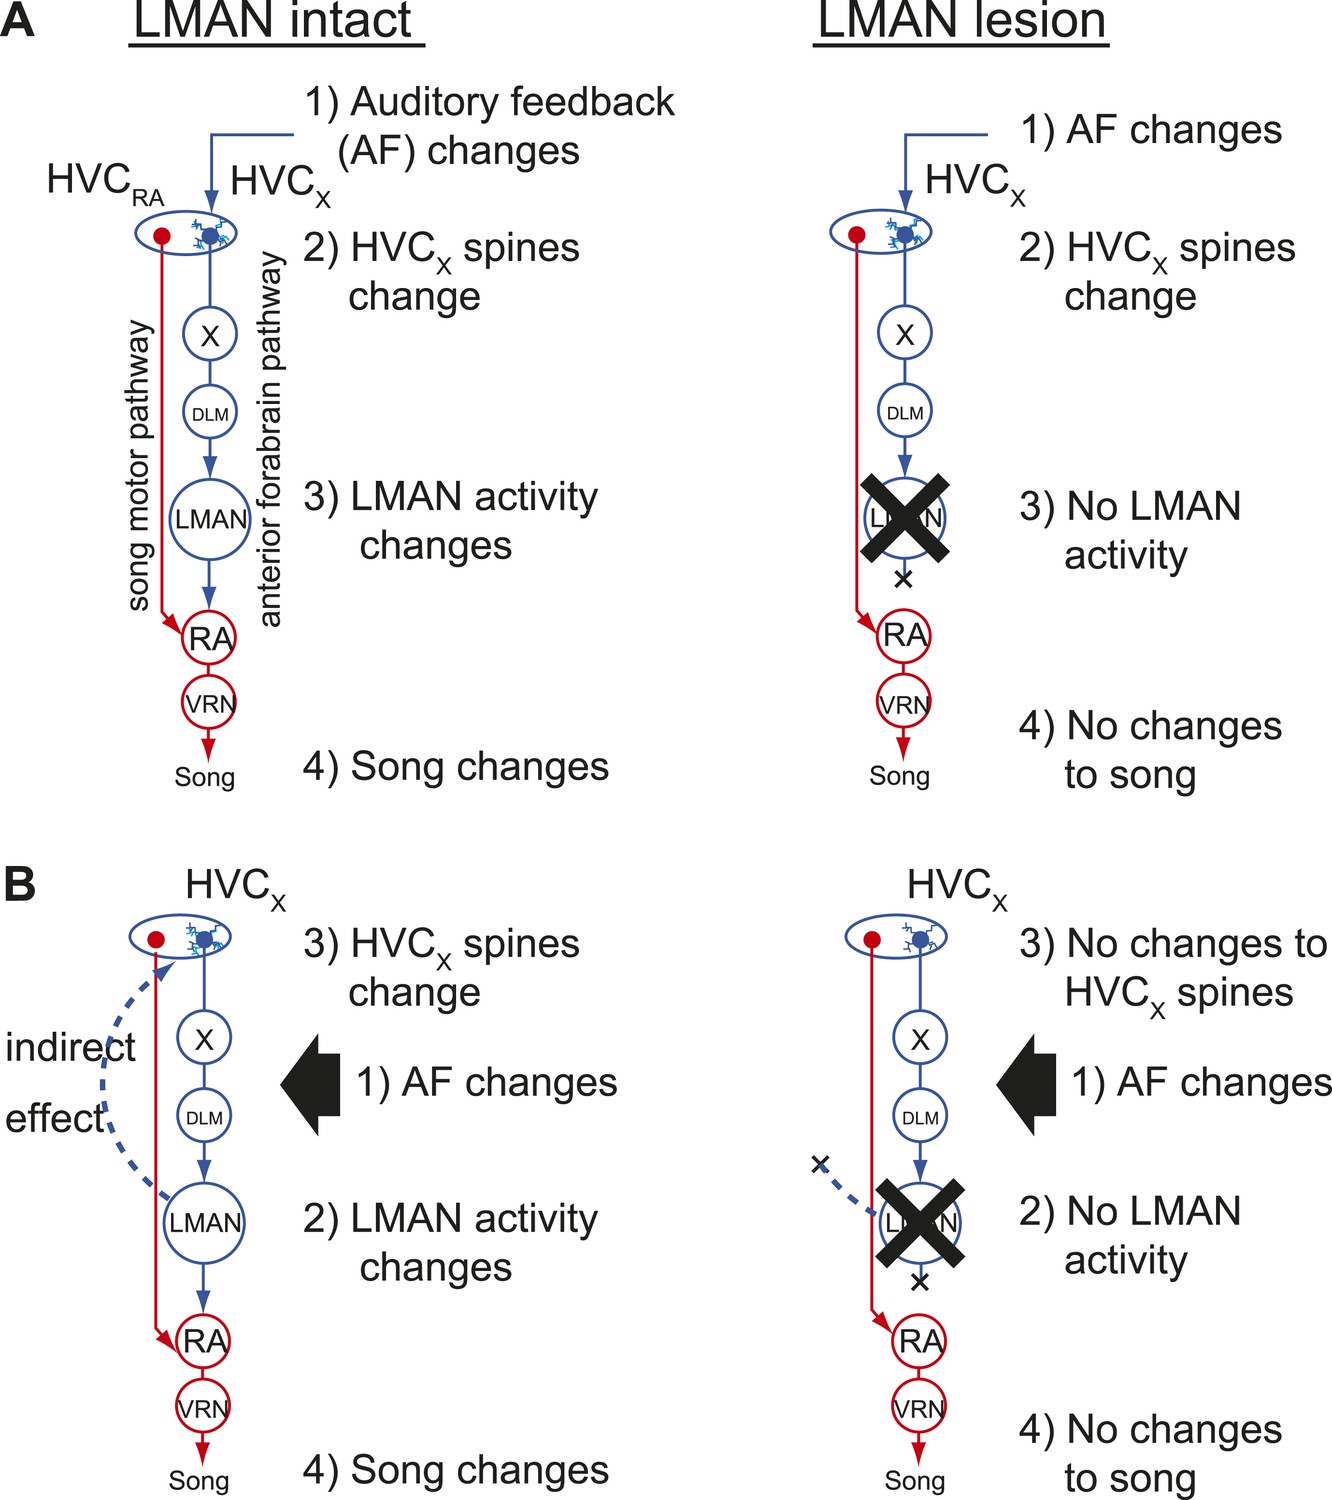
Two models of auditory feedback-dependent vocal and HVC dendritic plasticity.
(A) A model where deafening triggers slow changes to HVCX spines, subsequently altering AFP activity, which in turn drives vocal plasticity. In this model, LMAN lesions prevent deafening-induced song degradation but will not prevent deafening-induced changes to HVCX spines. (B) A model where deafening acts through LMAN to trigger song plasticity and also to drive changes to HVCX spines. In this model, LMAN lesions will prevent both deafening-induced song degradation and deafening-induced changes to HVCX spines.
Figure 8

LMAN lesions prevent decreases in spine size and spine stability in HVCX neurons following deafening.
(A) Upper left: schematic illustrates surgical manipulations for in vivo imaging experiments. Lower left: quantification of deafening-induced changes to syllable entropy and EV at 3 days post-deafening in LMAN intact (black) and LMAN lesion (red) birds (only syllables that underwent significant degradation by 3 days post-deafening are shown; song degradation analyzed in a total of 6 LMAN lesion birds (3 used for imaging) and 19 LMAN intact birds (13 used for imaging in Tschida and Mooney, 2012); entropy: 14 syllables from 10 LMAN intact birds, 5 syllables from 5 LMAN lesion birds; EV: 12 syllables from 9 LMAN intact birds, 8 syllables from 4 LMAN intact birds). Right: representative songs before and after deafening from LMAN lesion and LMAN intact birds. Deafened birds that received LMAN lesions still undergo subtle but significant song degradation. (B) Representative in vivo, two-photon images of HVCX neurons showing changes in spine size between 2 and 3 days post-deafening in deafened birds with or without LMAN lesions. LMAN lesions prevent the decrease in the size of HVCX spines that normally follows deafening (size index <1 in LMAN intact birds). Scale bars, 5 µm. (C) Spine size index (left) and spine stability (right) is significantly higher in deafened birds with LMAN lesions. Quantification of spine size (left) and stability (right) in HVCX neurons from deafened birds with (red) and without (black) LMAN lesions (LMAN intact data were previously reported in Tschida and Mooney (2012), except the values reported here have not been normalized to baseline, pre-deafening measurements). Time bins with significant differences between intact and LMAN lesion groups are indicated with asterisks (p<0.05).
© 2012, Elsevier Inc., All Rights Reserved. Figure 8, part (B) (images of HVCX dendrites from LMAN intact bird) is reprinted with permission from Figure 1B in Tschida and Mooney, 2012.
Figure 9
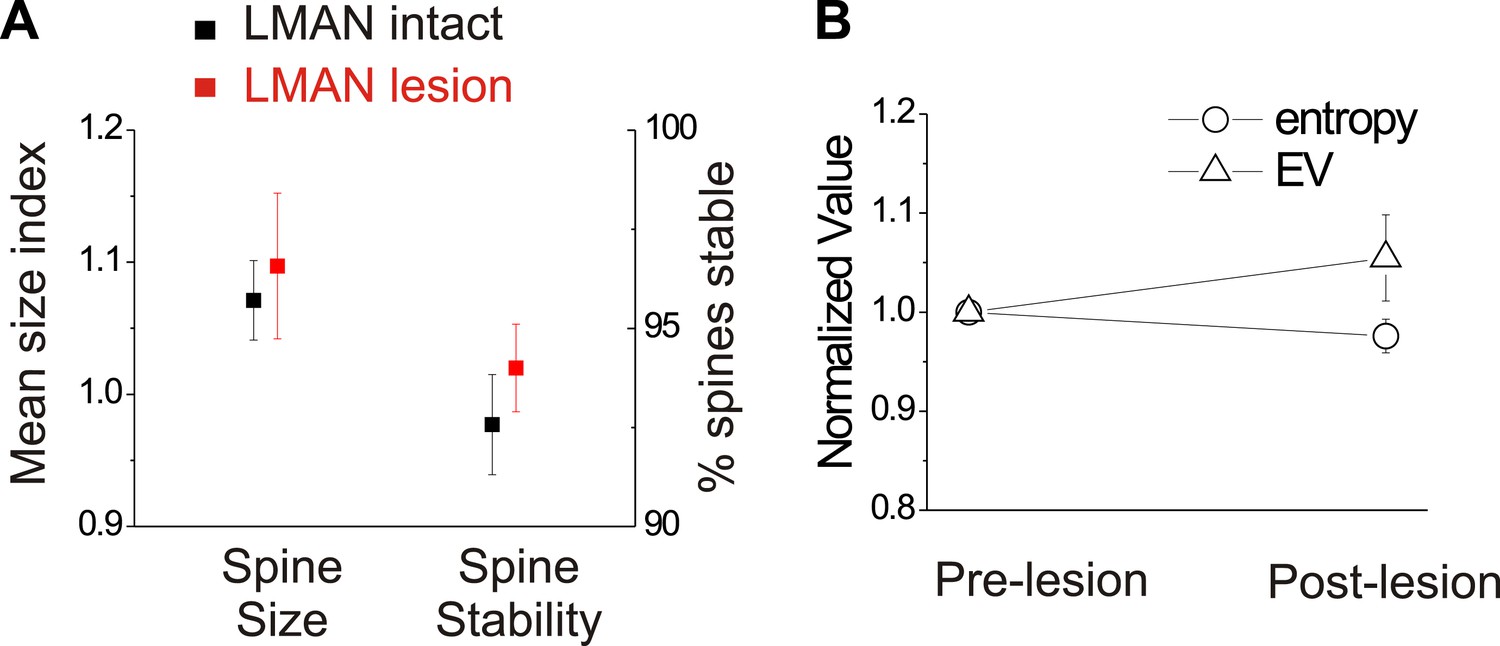
In birds with normal hearing, LMAN lesions do not significantly affect HVCX spine dynamics or spectral features of song.
(A) LMAN lesions affect neither spine size index nor spine stability in HVCX neurons (p=0.62 for size, p=0.61 for stability; LMAN intact data were previously reported in Tschida and Mooney, 2012). (B) LMAN lesions do not affect mean syllable entropy or EV (pre-lesion songs compared to songs from 4 to 5 days post-lesion; 25 syllables from 6 birds, p=0.09 for difference in mean entropy, p=0.25 for mean EV.
Videos
Video 1
Sharp intracellular current clamp recording made in an identified HVCX neuron from a freely behaving and singing male zebra finch.
Left; microphone (blue), membrane potential (green), and speaker output (red) updated at 1 Hz. Right; simultaneously monitored image recorded through a webcam in the recording chamber. In this movie, sound is recorded through the webcam. The whole movie is played in normal speed (x1). Injection current was changed from negative (−0.67 nA), to zero current (0 nA).
Download links
A two-part list of links to download the article, or parts of the article, in various formats.
Downloads (link to download the article as PDF)
Open citations (links to open the citations from this article in various online reference manager services)
Cite this article (links to download the citations from this article in formats compatible with various reference manager tools)
Auditory synapses to song premotor neurons are gated off during vocalization in zebra finches
eLife 3:e01833.
https://doi.org/10.7554/eLife.01833


