A gene horizontally transferred from bacteria protects arthropods from host plant cyanide poisoning
- Ghent University, Belgium
- University of Western Ontario, Canada
- Instituto de Ciencias de la Vid y el Vino, Spain
- Centre National de la Recherche Scientifique and Université de Nice Sophia Antipolis, France
- University of Amsterdam, Netherlands
Figures
Figure 1
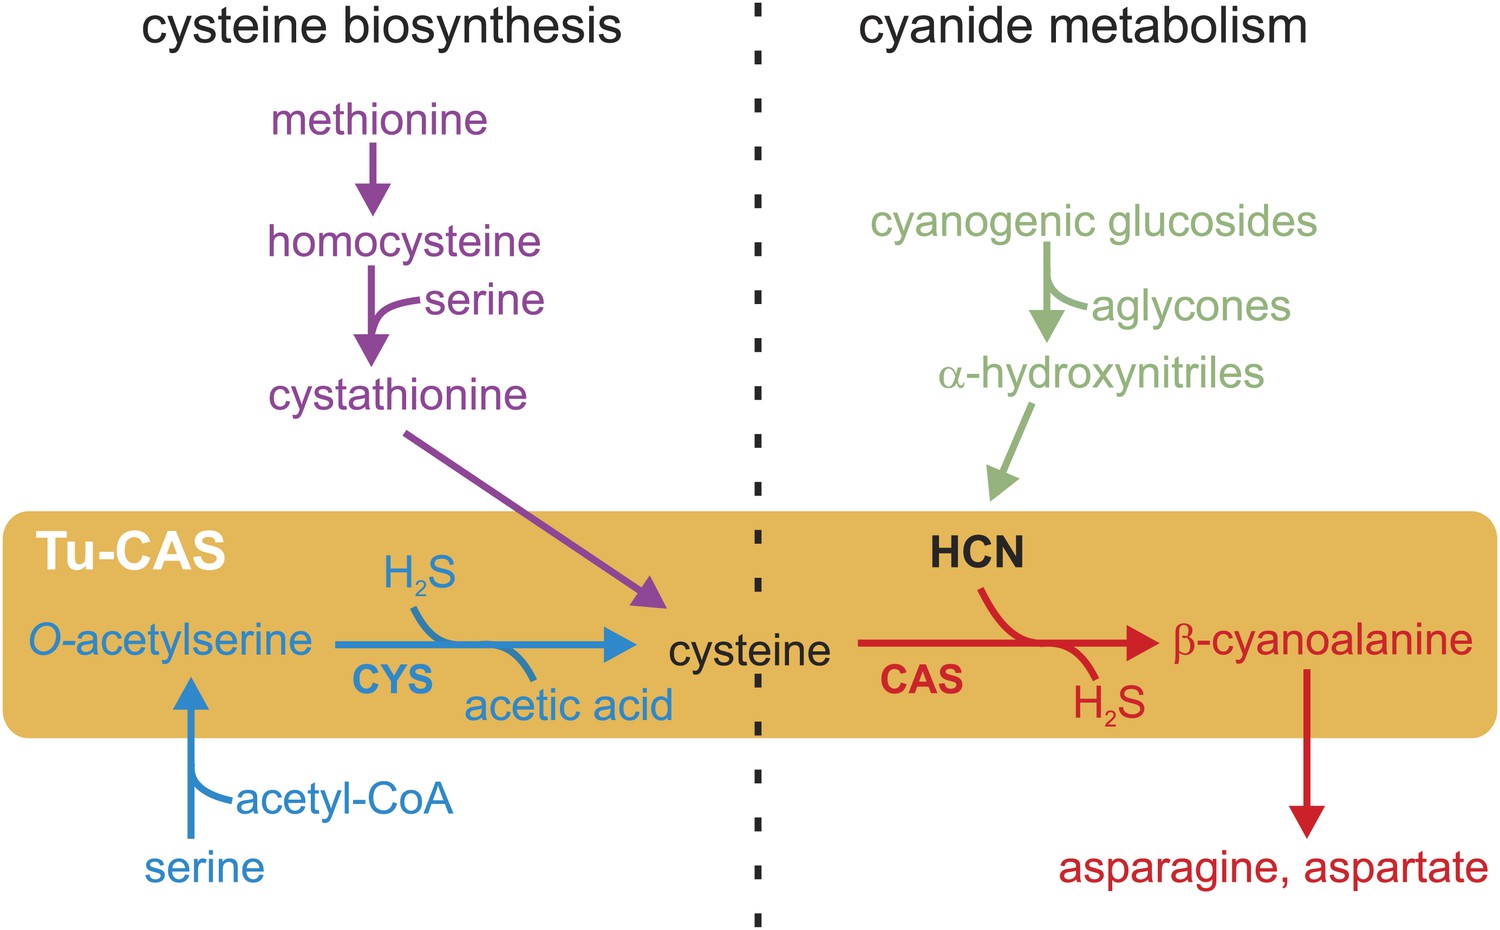
Schematic overview of the cysteine biosynthesis pathway in Metazoa (purple) and Plants/Bacteria (blue), the release of HCN during plant cyanogenesis (green) and the main HCN detoxification pathway in arthropods (red).
The two reactions catalyzed by the gene product of the Tu-CAS gene are marked by an orange background and are indicated by CYS and CAS. CAS detoxifies cyanide by incorporation into cysteine forming β-cyanoalanine, which can be further metabolized by nitrilases. CYS catalyzes the second step of the cysteine synthesis pathway in bacteria and plants, after serine is converted to O-acetylserine.
Figure 2 with 1 supplement
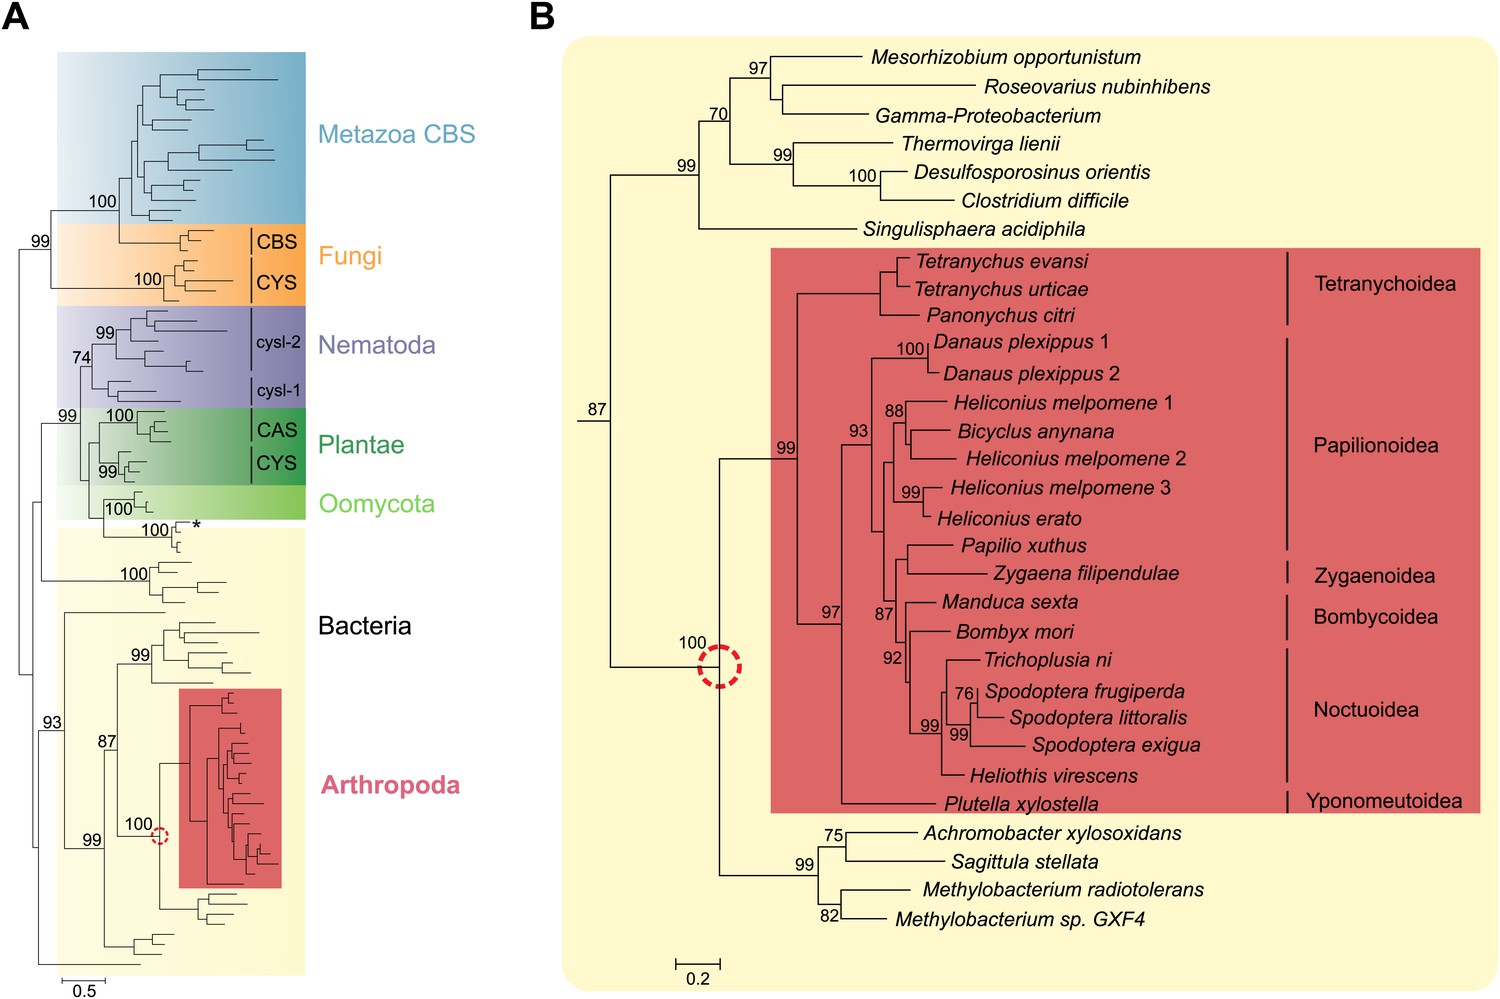
Panel A: Phylogenetic analysis of β-substituted alanine synthases, showing arthropod sequences nested within bacterial cysteine synthases.
The fungal CYS, metazoan and fungal CBS as well as the plant, oomycete and nematode CYS and CAS sequences are marked with a different color. The two branches of nematode sequences, marked as cysl-1 and cysl-2, include the sequences coded by the two genes previously characterized in C. elegans (Budde and Roth, 2011). The CYS and CAS groups within Plantae represent plant protein sequences with CYS and CAS activity, respectively (Yamaguchi et al., 2000). The asterisk represents a CYS sequence of the mealybug P. citri acquired by horizontal gene transfer from its endosymbiont (Husnik et al., 2013). Panel B: Detailed view of the bacterial CYS sequences showing the embedded sequences of tetranychid mites and Lepidoptera. In both panels support values of only important nodes are shown. The scale bar represents 0.5 and 0.2 substitutions per site in panel A and panel B, respectively.
Figure 2—figure supplement 1

MUSCLE alignment of cysteine synthases and β-cyanoalanine synthases discussed in this study.
Residue numbering is shown for the G. max CAS sequence (Yi et al., 2012). The five residues forming an active site loop are marked by asterisks. The amino acid and pyridoxal-5′-phosphate binding sites are indicated by a green and a blue background respectively, while the Schiff base Lys is indicated by a red background (Bonner et al., 2005; Yi et al., 2012). The unique 9 amino acid insertion seen in arthropod enzymes and their closest bacterial homologues is highlighted in orange. The three residues that convert G. max CYS into CAS by creating a triple mutant (Yi et al., 2012) are shown in red.
Figure 3
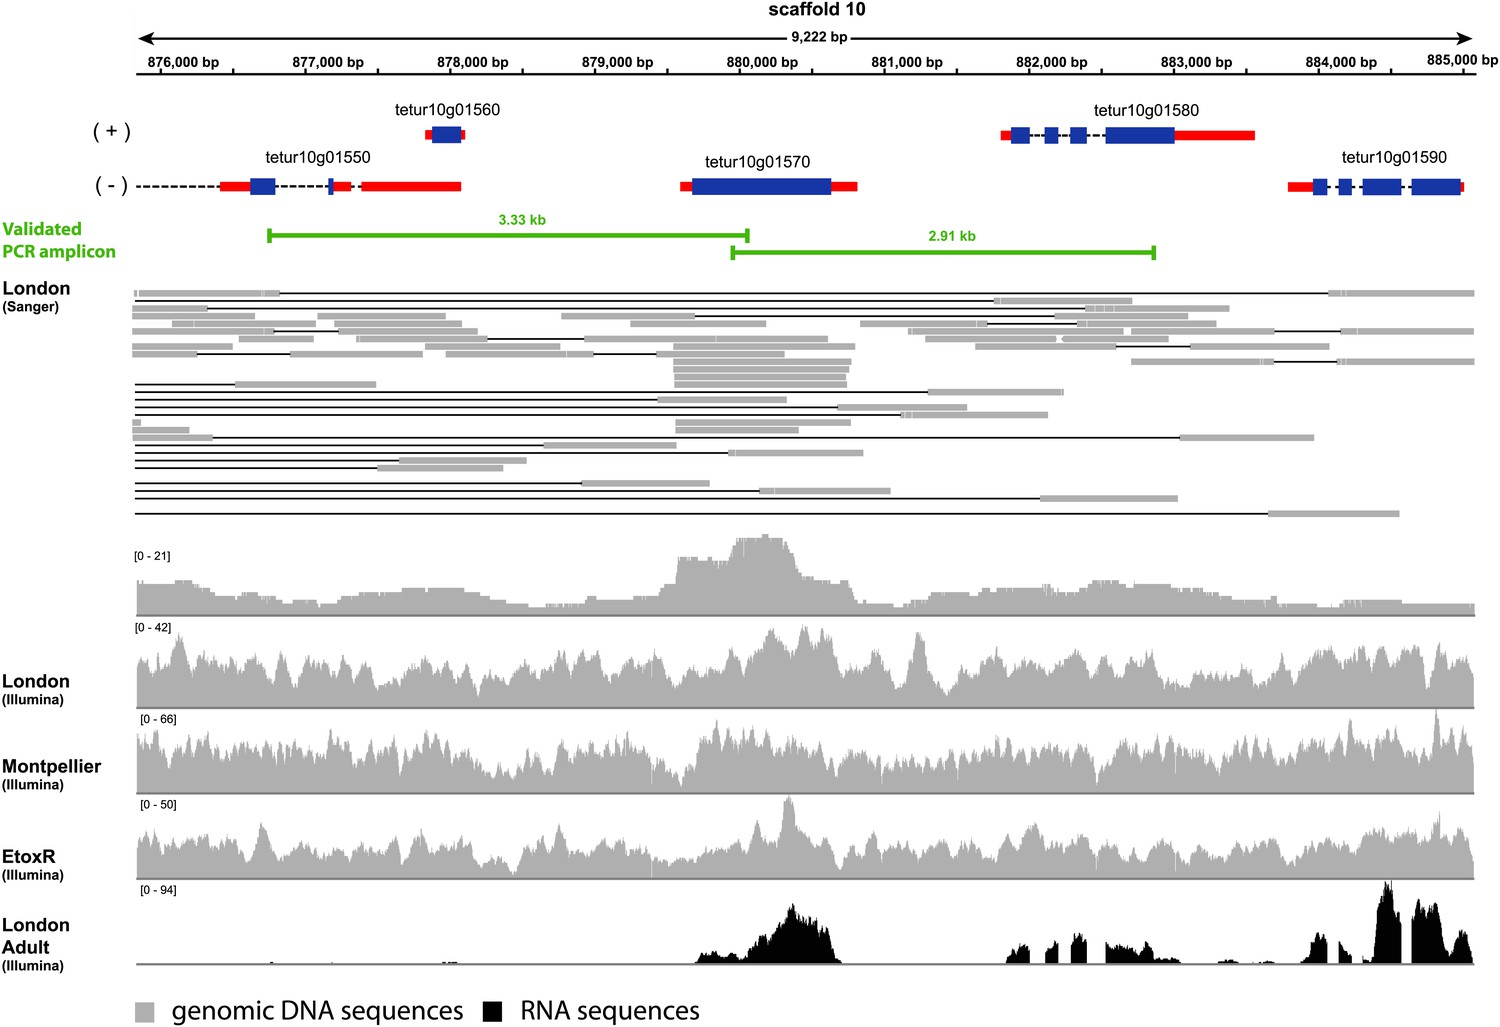
Coverage plot of Tu-CAS (tetur10g01570) and its surrounding region in the genome of T. urticae.
Gene models of Tu-CAS and its neighboring genes are depicted as follows: blue and red rectangles represent coding sequences and untranslated regions, respectively, while introns are shown as dashed lines. (+) and (−) represent the forward and reverse strand, respectively. Underneath the gene models, indicated in green, are the length and position of amplicons obtained by PCR (Figure 4). Next, an alignment of paired-end Sanger reads (and corresponding coverage plot) with the T. urticae genome of the London strain is displayed. Paired-end Sanger reads for which both reads are mapped in or extend nearby the indicated region are denoted by thin lines to show pair connections (shown are all paired-end Sanger reads that were produced from 2.5, 8.5, and 35.5 kb libraries used for assembly of the T. urticae genome [Grbic et al., 2011]). The Sanger reads coverage plot is followed by coverage plots of Illumina-reads from genomic DNA sequencing of the Montpellier and EtoxR strain of T. urticae (Grbic et al., 2011; Van Leeuwen et al., 2012). The coverage plot at the bottom shows Illumina RNA-seq read coverage produced from adult T. urticae polyA selected RNA (Grbic et al., 2011). Numbers between brackets represent the sequence depth.
Figure 4 with 1 supplement
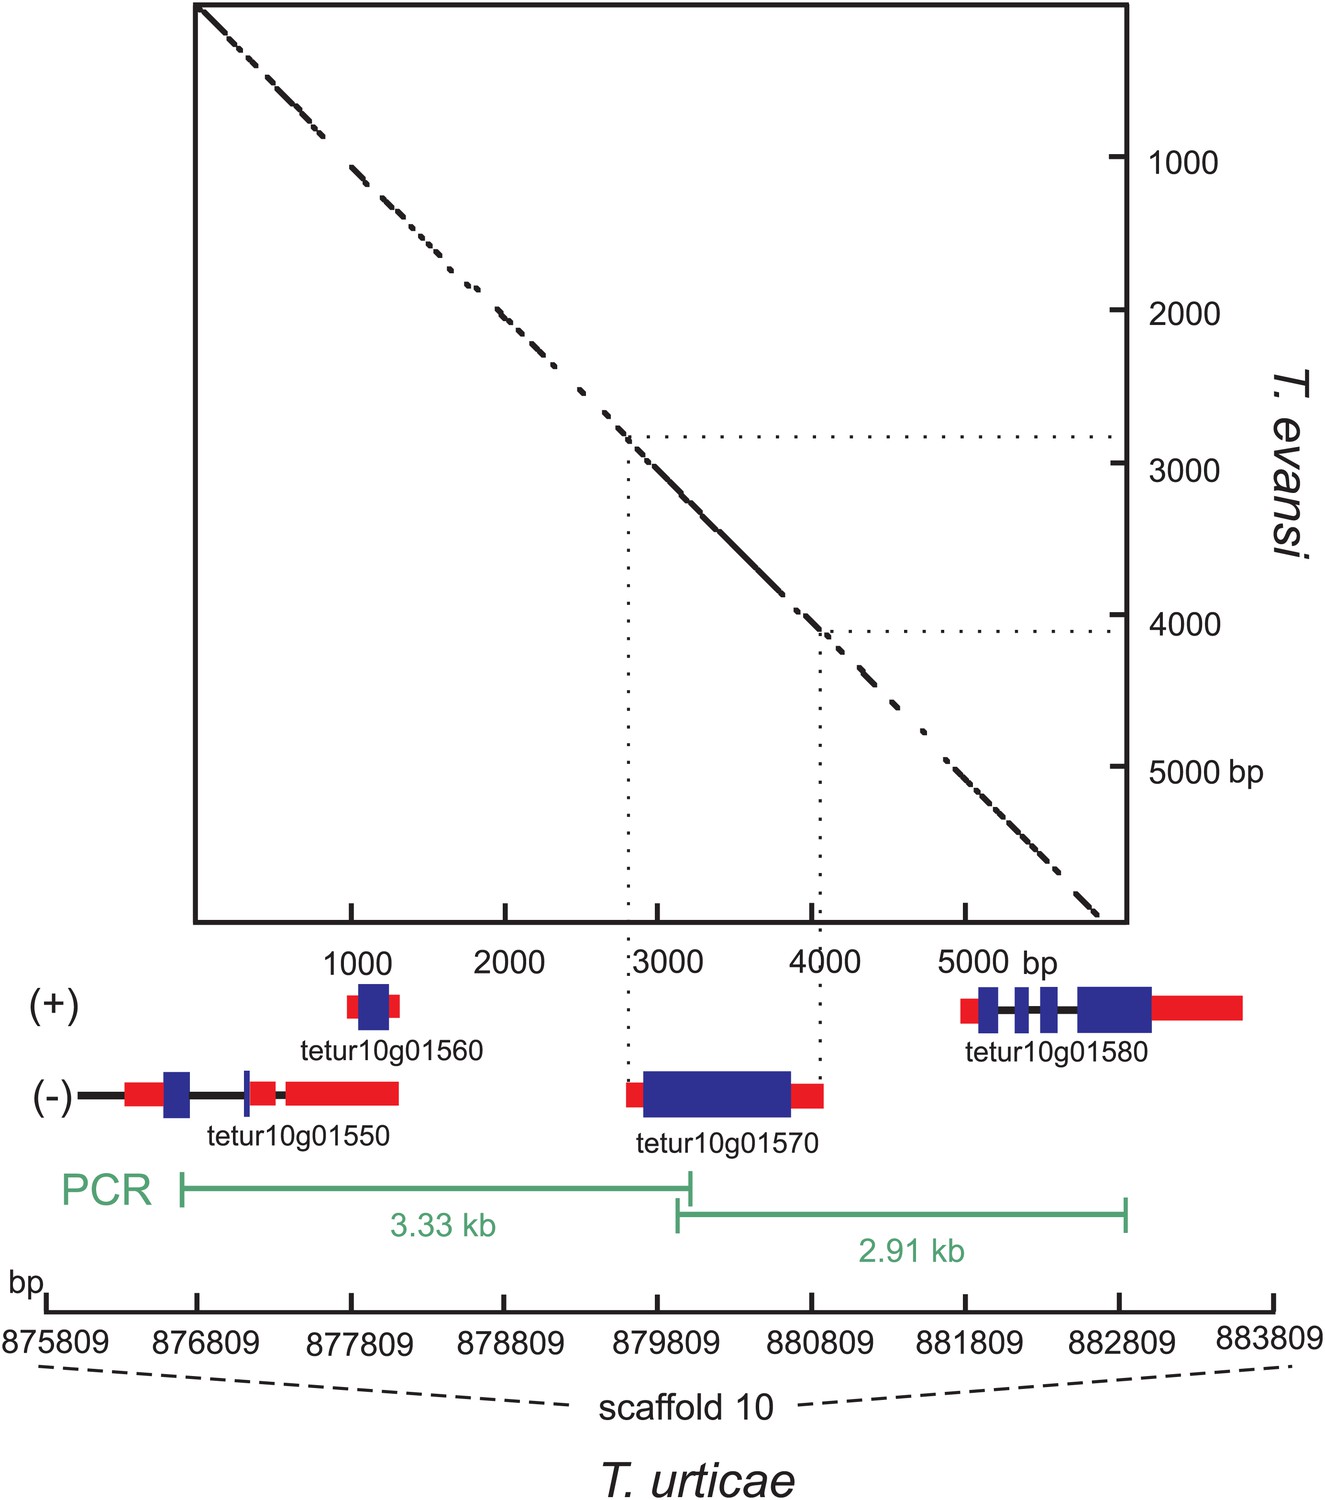
Nucleotide dot plot of the PCR amplified genomic region bracketing T. urticae and T. evansi CAS with adjacent intron-containing eukaryotic genes.
The dot-plot was constructed with 95% identity in a 21 bp window, with the T. evansi and the T. urticae amplified region on the y- and x-axis, respectively. From the T. urticae region, the gene models and their genomic positions on the 10th scaffold are specified below the x-axis. The (+) and (−) signs represent the forward and reverse strand, respectively. Blue and black bars indicate exons and introns respectively, while the untranslated regions are depicted as red bars.
Figure 4—figure supplement 1
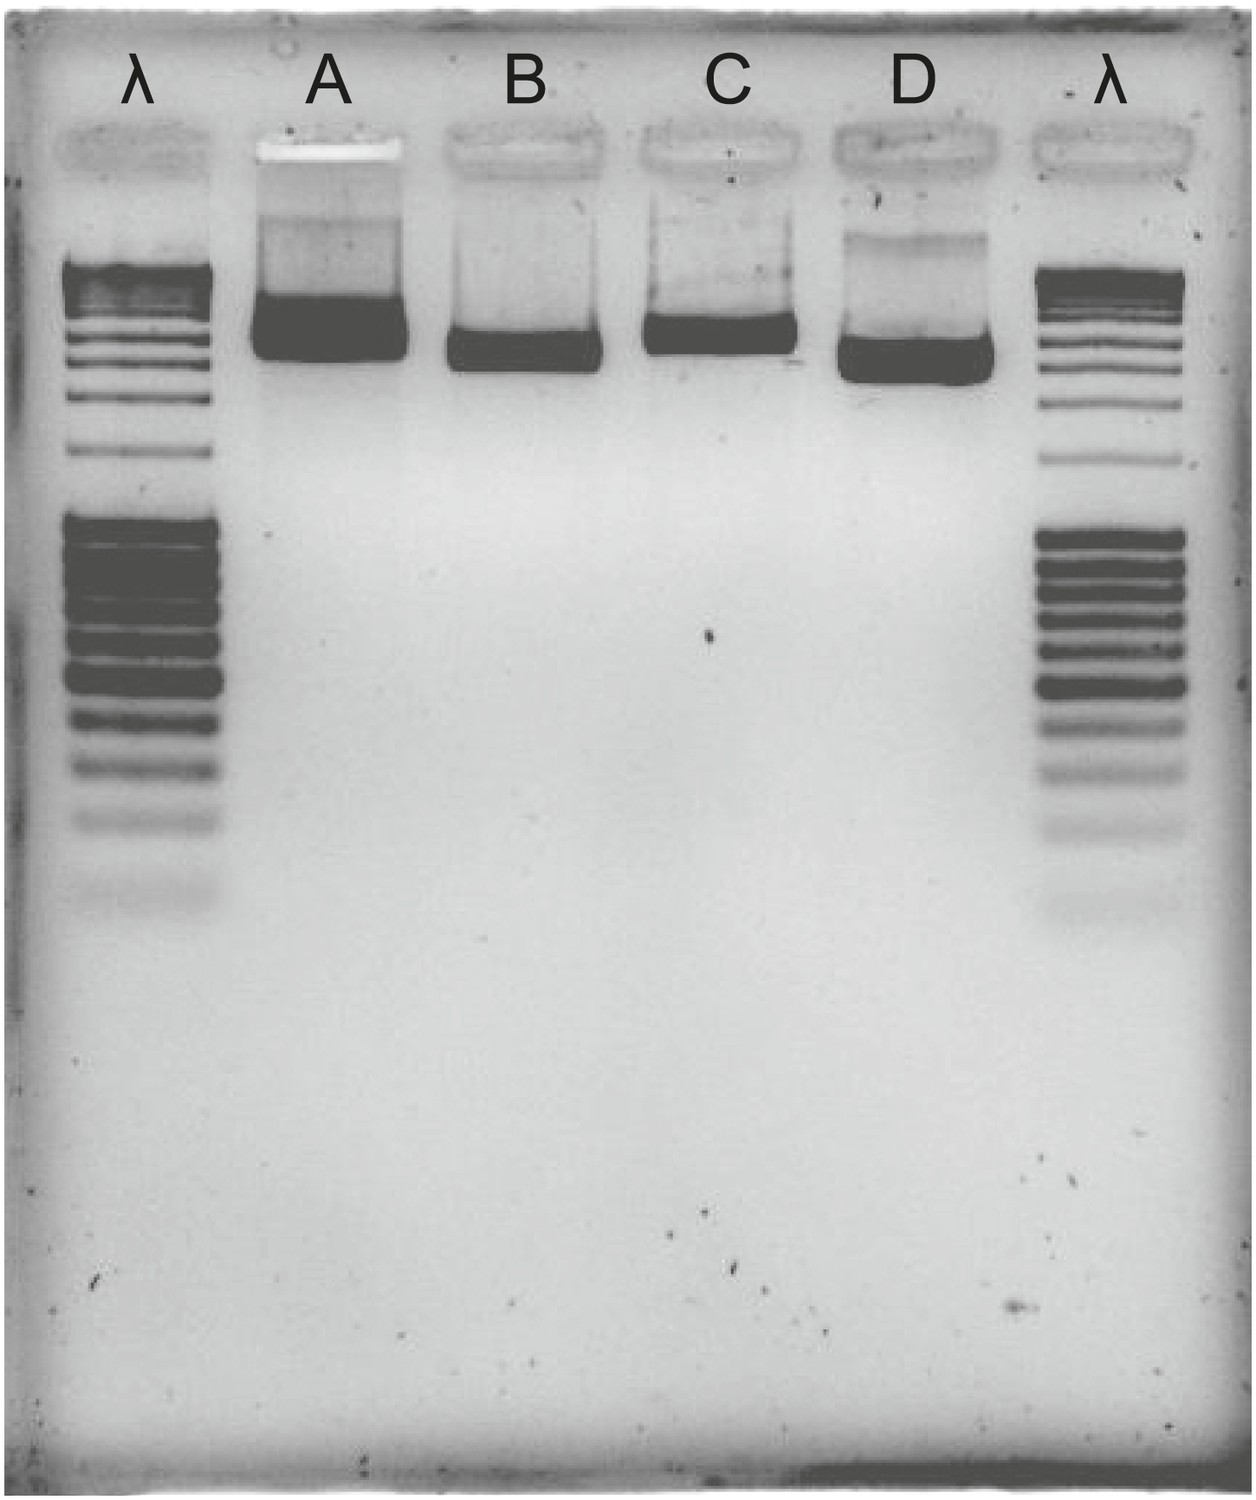
Agarose gel of PCR products, bracketing CAS with adjacent eukaryotic genes in T. urticae and T. evansi.
λ: lambda DNA, digested with Pstl; A: tetur10g01550—tetur10g01570 fragment in T. urticae; B: tetur10g01570—tetur10g01580 fragment in T. urticae; C; tetur10g01550—tetur10g01570 fragment in T. evansi; D: tetur10g01570—tetur10g01580 fragment in T. evansi. Primers used for the amplification of the fragments are listed in Supplementary file 4.
Figure 5
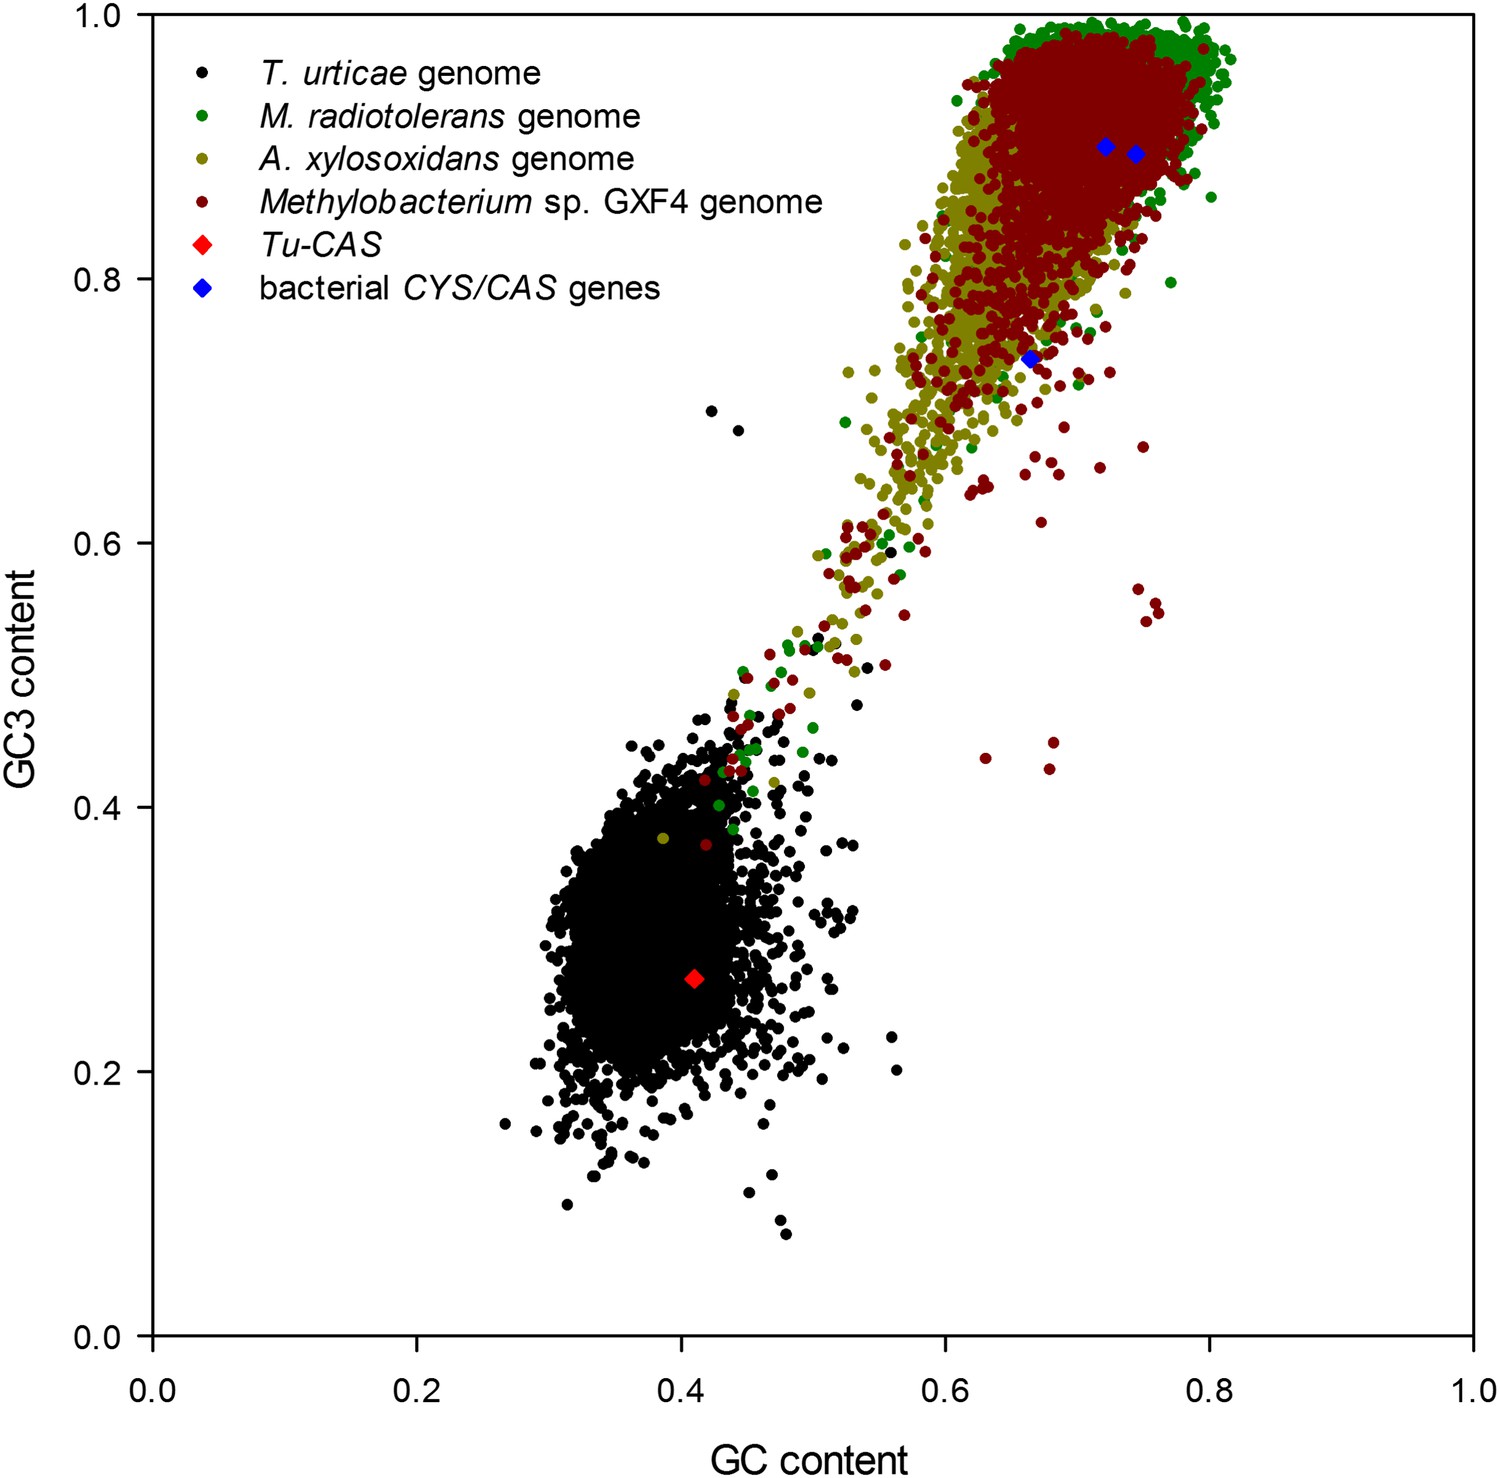
Graph showing the GC/GC3 gene contents of T. urticae and putative bacterial donor species.
The GC/GC3 contents of the T. urticae genome and the three annotated bacterial genomes of bacteria residing in the sister clade closest to the apparent monophyletic arthropod clade (Figure 2) are shown. The GC/GC3 content of the specific CYS/CAS gene of each organism (T. urticae in red, bacteria in blue) is highlighted.
Figure 6
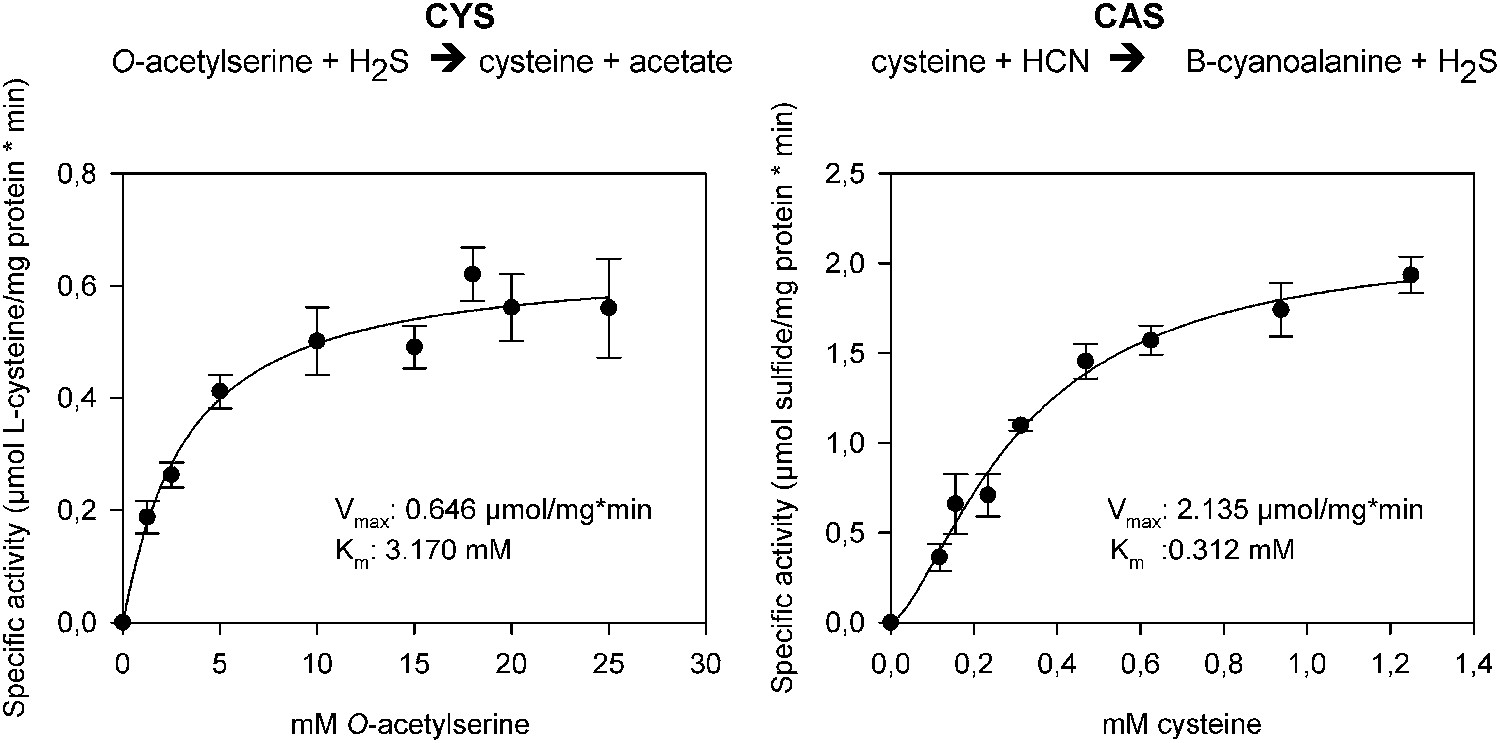
The two reactions catalyzed by recombinant Tu-CAS (cysteine synthase, CYS and β-cyanoalanine synthase, CAS), showing the kinetic plots and calculated Vmax and Km values.
https://doi.org/10.7554/eLife.02365.010
Figure 7
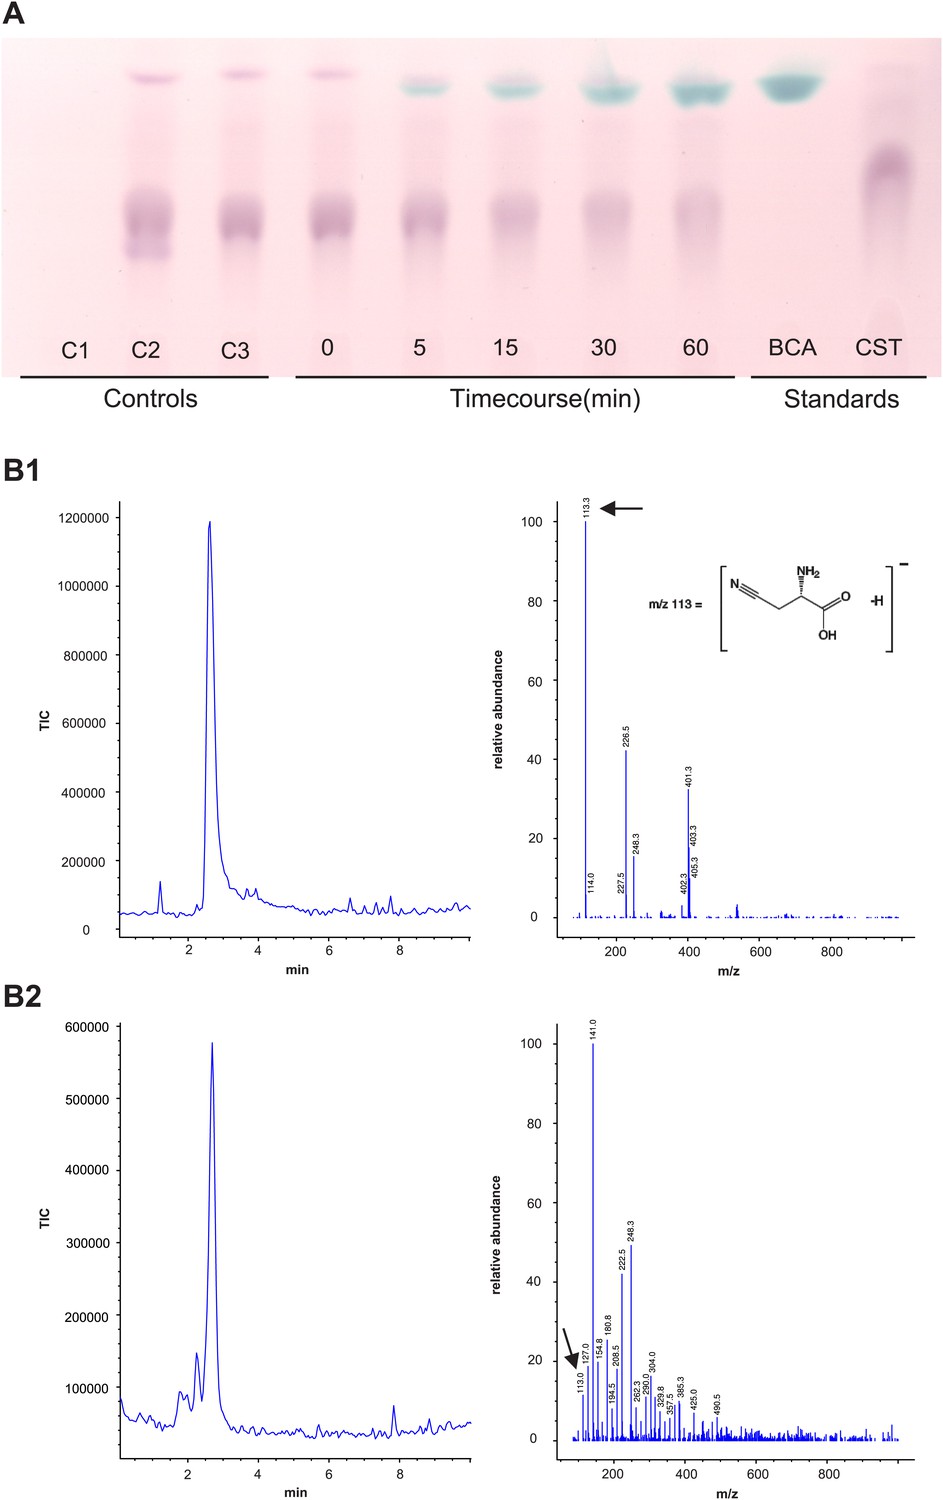
Panel A: Formation and accumulation of β-cyanoalanine by recombinant Tu-CAS as visualized by TLC analysis.
Controls; C1: no cysteine control, C2: no cyanide control, C3: no enzyme control. Time course 0–60 min after adding 3.75 µg of recombinant Tu-CAS. Standards; BCA: 5 µg β-cyanoalanine, CST: 5 µg cysteine. Panel B: LC-MS identification of β-cyanoalanine as a reaction product of Tu-CAS. The enzymatically produced β-cyanoalanine was scraped from silica plates after TLC separation of reaction mixtures, and was analyzed by LC-MS. β-cyanoalanine was identified in the reaction mixture on the basis of a similar elution time on LC and the characteristic ion of m/z = 113 which is [M-H]- as compared to the standard. (The base peak in panel B2 at m/z = 141 is a contaminant from the silica gel [2SiO +2H2O + OH−].) B1: total ion current (TIC) chromatogram and mass spectrum of the β-cyanoalanine standard, B2: TIC chromatogram and mass spectrum of Tu-CAS reaction mixture after separation on TLC.
Tables
Table 1
Specificity constants for the two activities of CYS-like enzymes (cysteine synthase, CYS and β-cyanoalanine synthase, CAS)
| CAS reaction | CYS reaction | CAS/CYS | |||||
|---|---|---|---|---|---|---|---|
| Activity (s−1) | Km (mM) | Specificity constant (mM−1. s−1) | Activity (s−1) | Km (mM) | Specificity constant (mM−1. s−1) | Ratio of specificity constants | |
| Tetranychus urticae CAS | 2.135* | 0.312 | 6.84† | 0.646* | 3.17 | 0.203† | 33.7 |
| Arabidopsis thaliana CAS | 2.66 | 0.14 | 19 | 2.0 | 8.03 | 0.250 | 76 |
| Glycine max CAS | 38.9 | 0.81 | 48 | 1.82 | 8.87 | 0.205 | 234 |
| Glycine max CYS | 0.21 | 0.30 | 0.7 | 57.5 | 3.6 | 15.97 | 0.044 |
| Corynebacterium glutamaticum CYS | n.d | n.d | – | 435* | 7 | 62† | – |
| Lactobacillus casei CYS | n.d | n.d | – | 89* | 0.6 | 148† | – |
-
n.d.: not determined.
-
*
data as Vmax in µmol.min−1mg−1.
-
†
data as Vmax/Km in µmol.min−1mg−1mM−1. CAS activity was measured with cysteine as substrate while CYS activity was measured with O-acetylserine as substrate. Data for the plants A. thaliana and G. max were obtained in Yamaguchi et al. (2000) and Yi et al. (2012), respectively, while data for the bacteria C. glutamaticum and L. casei were retrieved from Wada et al. (2004) and Bogicevic et al. (2012), respectively.
Additional files
-
Supplementary file 1
Differentially expressed genes in the London-CYANO strain compared to the London strain.
- https://doi.org/10.7554/eLife.02365.013
-
Supplementary file 2
Genome portals of arthropods consulted in order to retrieve potential homologues of Tu-CAS in addition to NCBI nr/nt databases.
- https://doi.org/10.7554/eLife.02365.014
-
Supplementary file 3
List of the pyridoxal-5′-phosphate-dependent protein sequences used in phylogenetic tree construction.
- https://doi.org/10.7554/eLife.02365.015
-
Supplementary file 4
List of primers used in PCR in T. urticae and T. evansi.
- https://doi.org/10.7554/eLife.02365.016
-
Supplementary file 5
Coding sequences of Tu-CAS.
- https://doi.org/10.7554/eLife.02365.017
Download links
A two-part list of links to download the article, or parts of the article, in various formats.
Downloads (link to download the article as PDF)
Open citations (links to open the citations from this article in various online reference manager services)
Cite this article (links to download the citations from this article in formats compatible with various reference manager tools)
A gene horizontally transferred from bacteria protects arthropods from host plant cyanide poisoning
eLife 3:e02365.
https://doi.org/10.7554/eLife.02365


