Adipocyte ALK7 links nutrient overload to catecholamine resistance in obesity
- Karolinska Institutet, Sweden
- National University of Singapore, Singapore
- Howard Hughes Medical Institute, University of California, San Francisco, United States
Figures
Figure 1 with 3 supplements
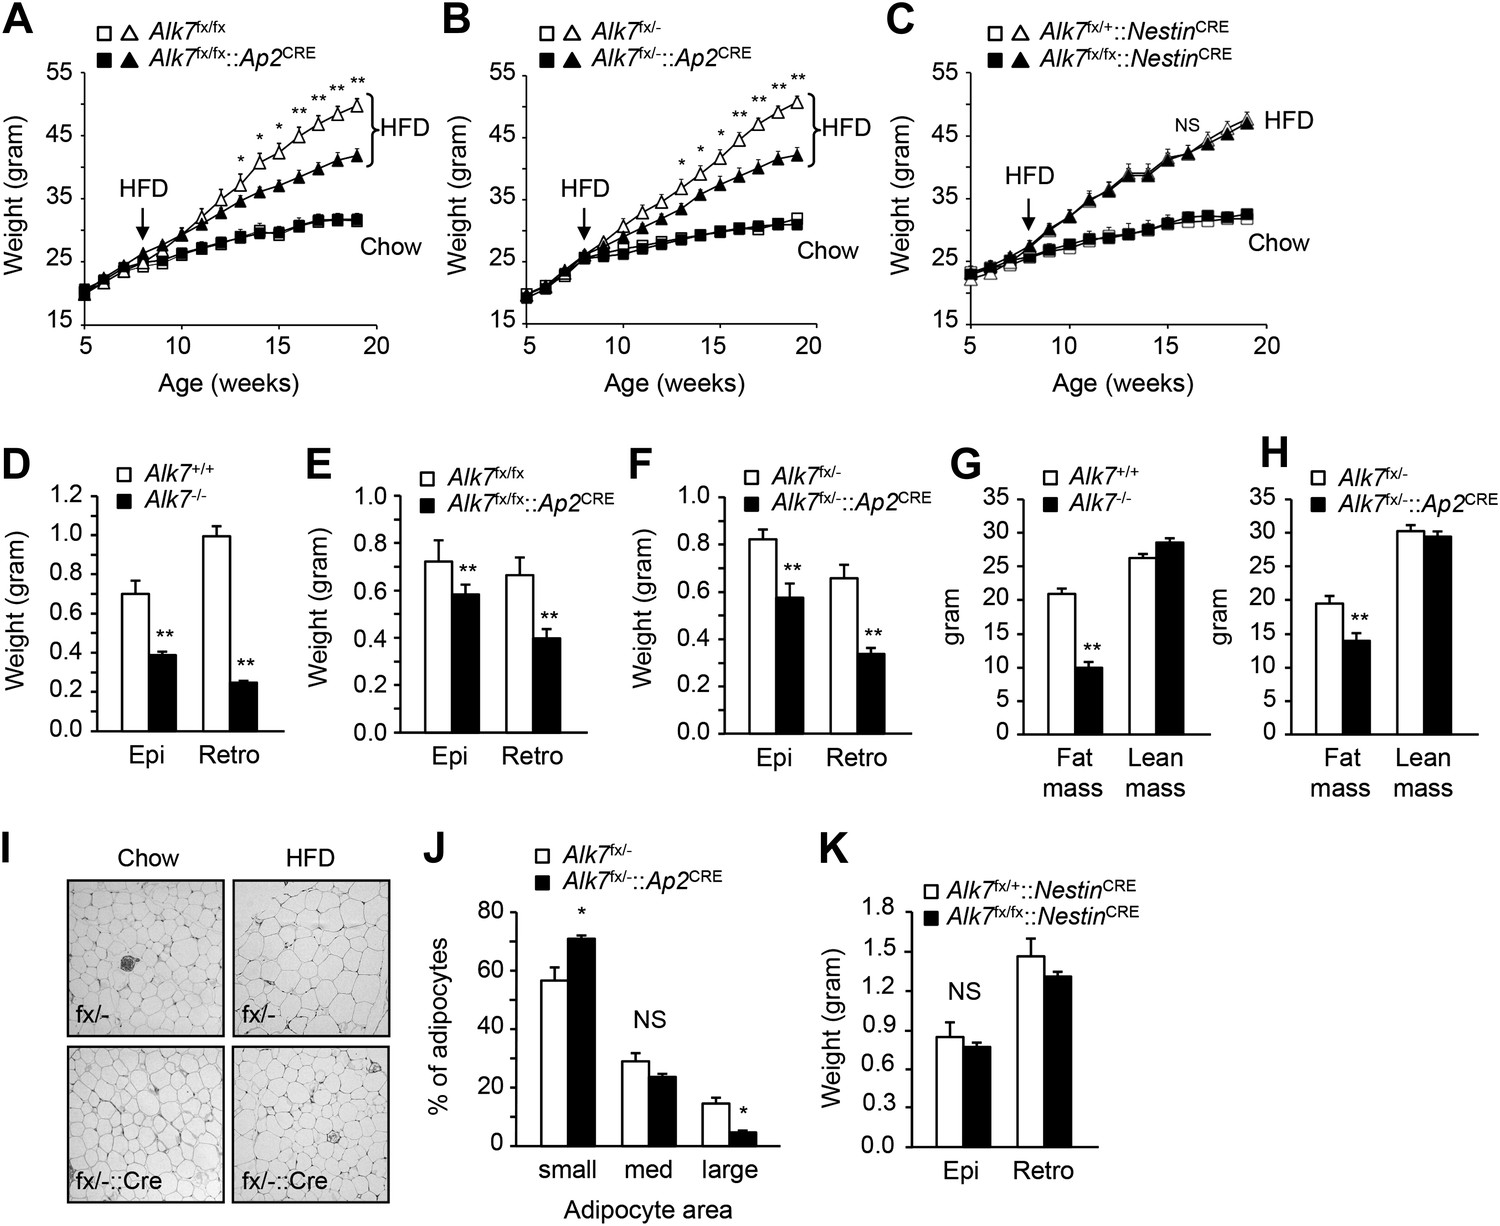
Conditional deletion of ALK7 in adipose tissue attenuates weight gain and fat deposition under a high fat diet.
(A–C) Weight gain under chow (squares) and a high fat diet (HFD, triangles) in fat-specific Alk7fx/fx::Ap2CRE (A) and Alk7fx/−::Ap2CRE (B), and brain-specific Alk7fx/fx::NestinCRE (C) knock-out mice (solid symbols) compared to control mice (open symbols). Arrows denote the first week of HFD. N = 8 mice per group in all cases, except N = 6 in (C) on a chow diet. (D–F) Weights of epididymal (Epi) and retroperitoneal (Retro) fat depots in global Alk7−/− (D) and fat-specific Alk7fx/fx::Ap2CRE (E) and Alk7fx/−::Ap2CRE (F) knock-out mice after 16 weeks on HFD. N = 6 mice per group. (G and H) Fat and lean mass assessed by magnetic resonance imaging (MRI) in global Alk7−/− (G) and fat-specific Alk7fx/−::Ap2CRE (H) knock-out mice after 16 weeks on HFD. N = 8 mice per group in (G), N = 5 in (H). (I and J) Adipocyte cell size in fat-specific Alk7fx/−::Ap2CRE knock-out mice and Alk7fx/− controls after chow or HFD as visualized by hematoxylin-eosin staining in tissue sections of epididymal adipose tissue (I). Quantitative analysis is shown in (J). Small, 400–5000 μm2; Med, 5000–10,000 μm2; Large, 10,000–60,000 μm2. N = 4 mice per group (four sections per mouse). (K) Weights of epididymal (Epi) and retroperitoneal (Retro) fat depots in brain-specific Alk7fx/fx::NestinCRE knock-out mice after 16 weeks on HFD. N = 6 mice per group. *p < 0.05; **p < 0.01; NS, non-significant (mutant vs control). All error bars show mean ± SEM.
Figure 1—figure supplement 1
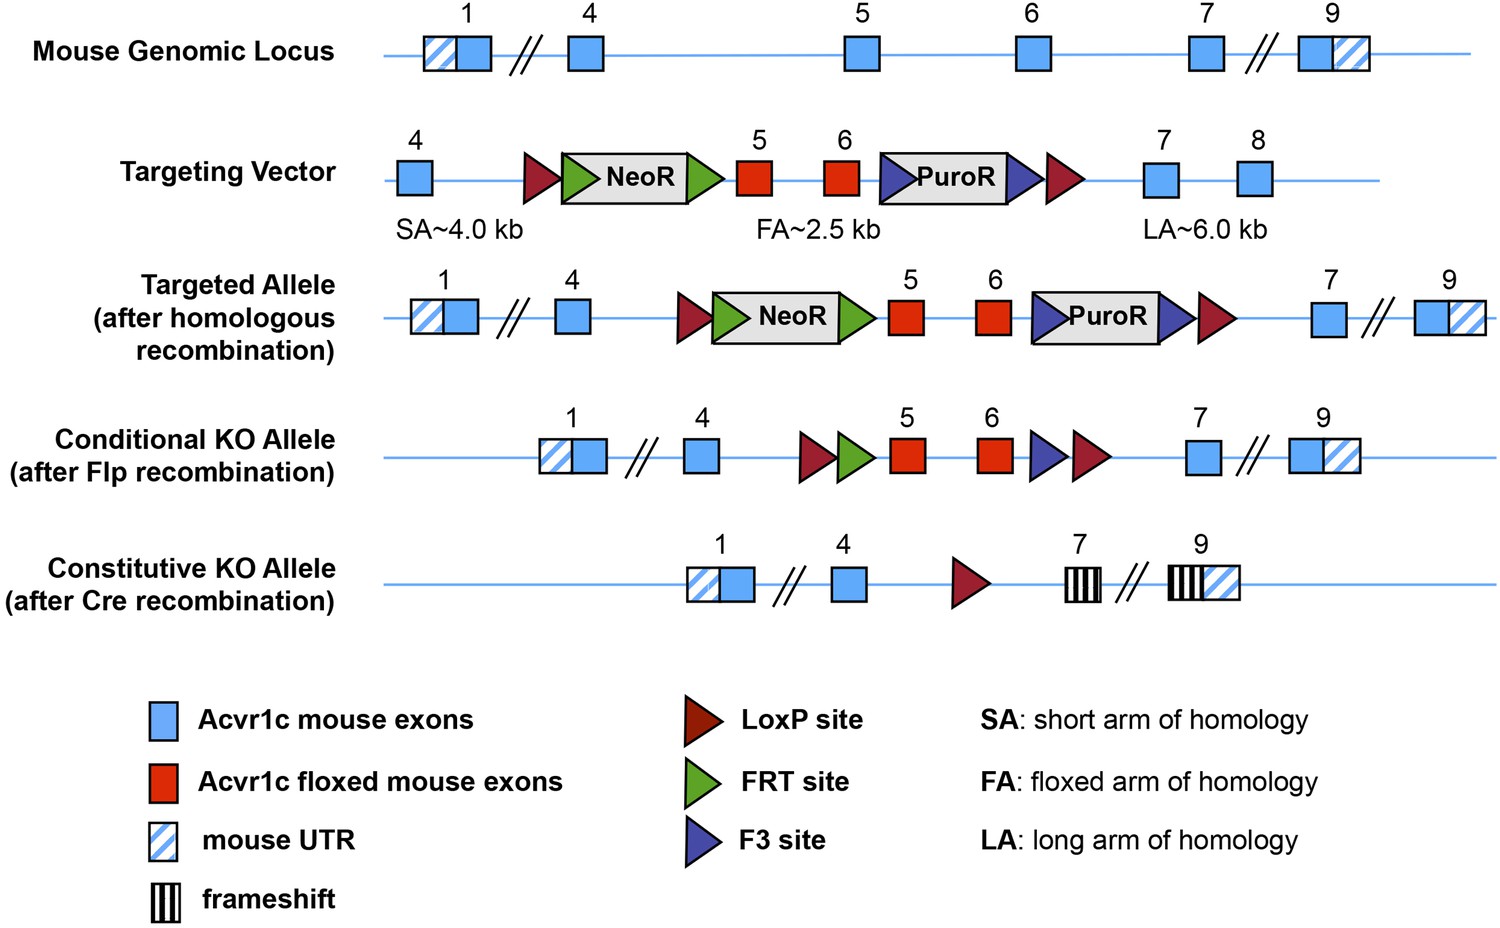
Generation of a conditional allele of the mouse Acvr1c gene encoding ALK7.
CRE-mediated recombination deletes exons 5 and 6, encoding the ALK7 kinase domain, which is essential for signaling, and introduces an in-frame stop codon after exon 4.
Figure 1—figure supplement 2
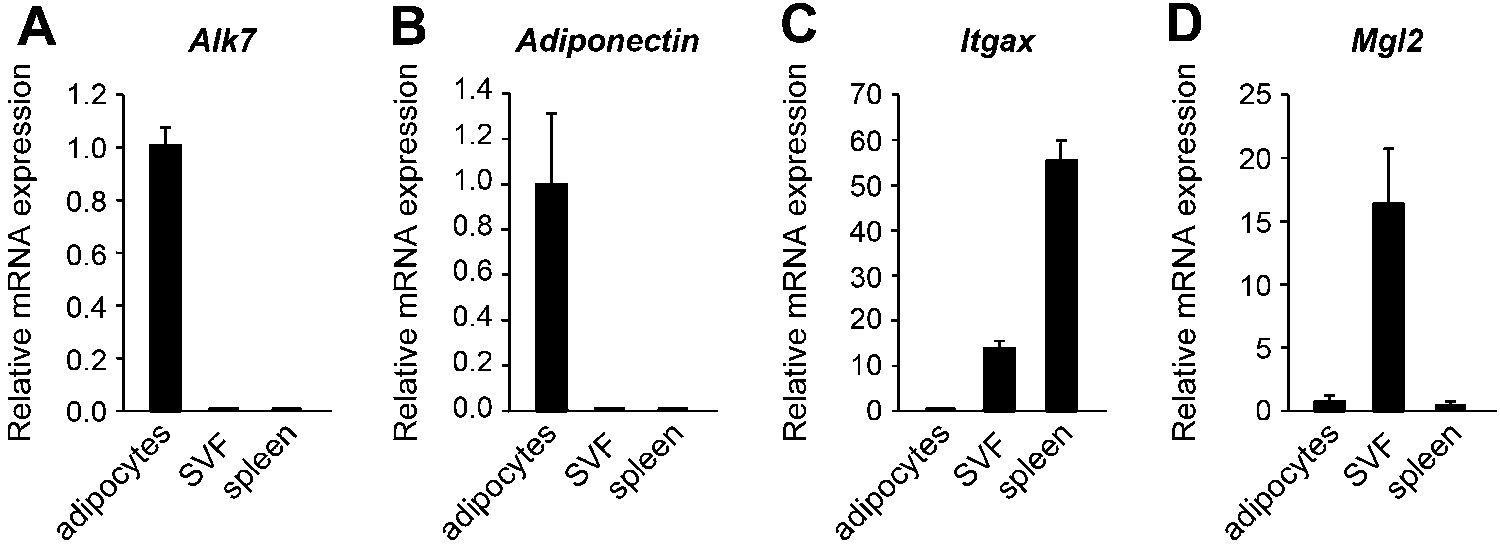
Alk7 expression in adipocytes, but not in adipose tissue macrophages.
(A–C) Relative levels of Alk7 (A), adipocyte marker Adiponectin (B), and macrophage markers Itgax (C) and Mgl2 (D) mRNA in adipocytes, adipose tissue stromal-vascular fraction (SVF), and spleen assessed by Q-PCR. In each case, results were normalized to adipocyte levels. N = 6 mice per group. All error bars show mean ± SEM.
Figure 1—figure supplement 3
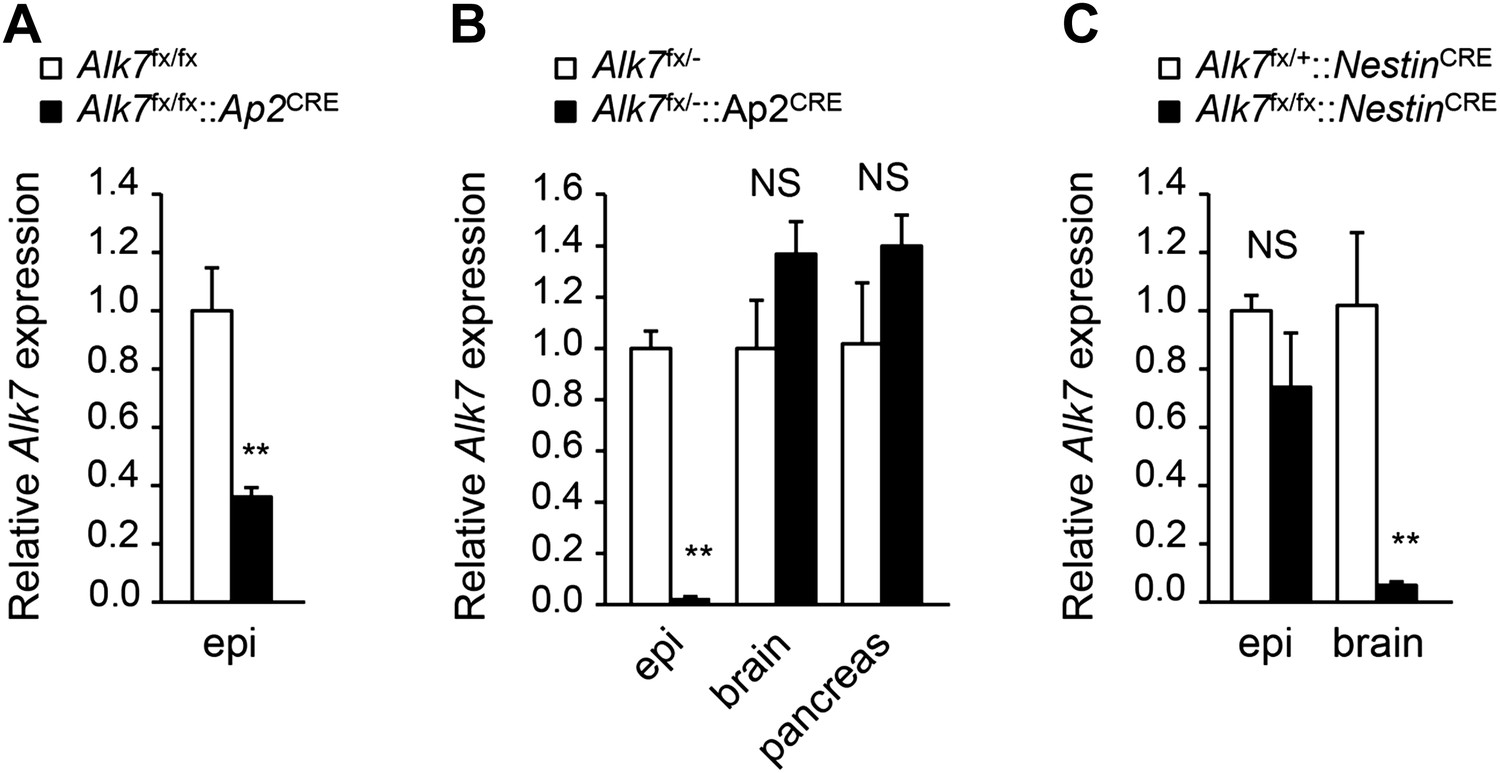
Alk7 expression in conditional knock-out mice.
(A–C) Relative levels of Alk7 mRNA expression assessed by Q-PCR in epididymal fat (epi), brain, and pancreas in fat-specific Alk7fx/fx::Ap2CRE (A) and Alk7fx/−::Ap2CRE (B), and brain-specific Alk7fx/fx::NestinCRE (C) conditional knock-out mice. N = 5 mice per group in (A), N = 4 in (B) and (C). **p < 0.01; NS, non-significant (mutant vs control). All error bars show mean ± SEM.
Figure 2
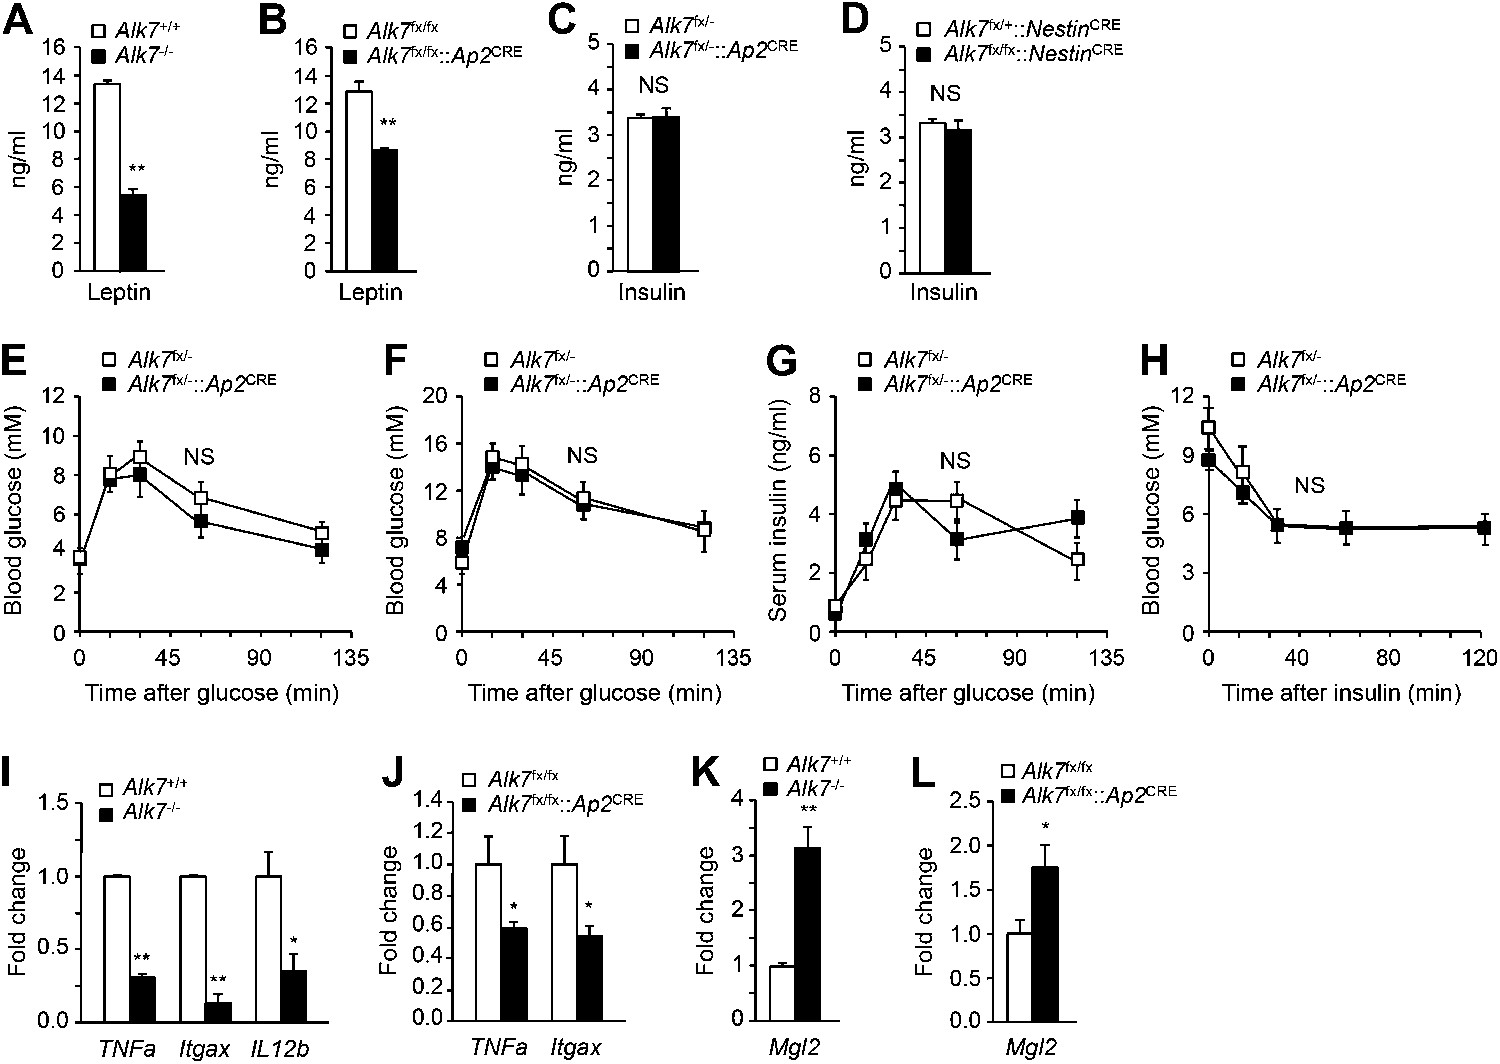
Reduced serum leptin levels and adipose tissue inflammation but normal glucose and insulin metabolism in global and fat-specific Alk7 knock-out mice.
(A and B) Serum levels of leptin in global Alk7−/− (A) and fat-specific Alk7fx/fx::Ap2CRE (B) knock-out mice after 16 weeks on a high fat diet (HFD). N = 6 mice per group. (C and D) Serum levels of insulin in fat-specific Alk7fx/−::Ap2CRE (C) and brain-specific Alk7fx/fx::NestinCRE (D) knock-out mice after 16 weeks on HFD. N = 6 mice per group. (E and F) Blood glucose levels after glucose injection in 4-month-old Alk7fx/−::Ap2CRE mice and controls after chow (E) or a high fat diet (F). Mice had been starved overnight prior to glucose injection. N = 5 mice per group. (G) Serum insulin levels after glucose injection in 4-month-old Alk7fx/−::Ap2CRE mice and controls kept on a chow diet. Mice had been starved overnight prior to glucose injection. N = 5 mice per group. (H) Blood glucose levels after insulin injection in 4-month-old Alk7fx/−::Ap2CRE mice and controls kept on a chow diet. Mice had been starved for 3 hr prior to insulin injection. N = 5 mice per group. (I–L) Relative mRNA expression levels of M1 macrophage markers TNF1a, Itgax, and IL12b (I and J) and the M2 macrophage marker Mgl2 (K and L) assessed by quantitative PCR in epididymal adipose tissue of global Alk7−/− (I and K) and fat-specific Alk7fx/fx::Ap2CRE (J and L) knock-out mice after 16 weeks on HFD. N = 6 mice per group. *p < 0.05; **p < 0.01; NS, non-significant (mutant vs control). All error bars show mean ± SEM.
Figure 3 with 1 supplement
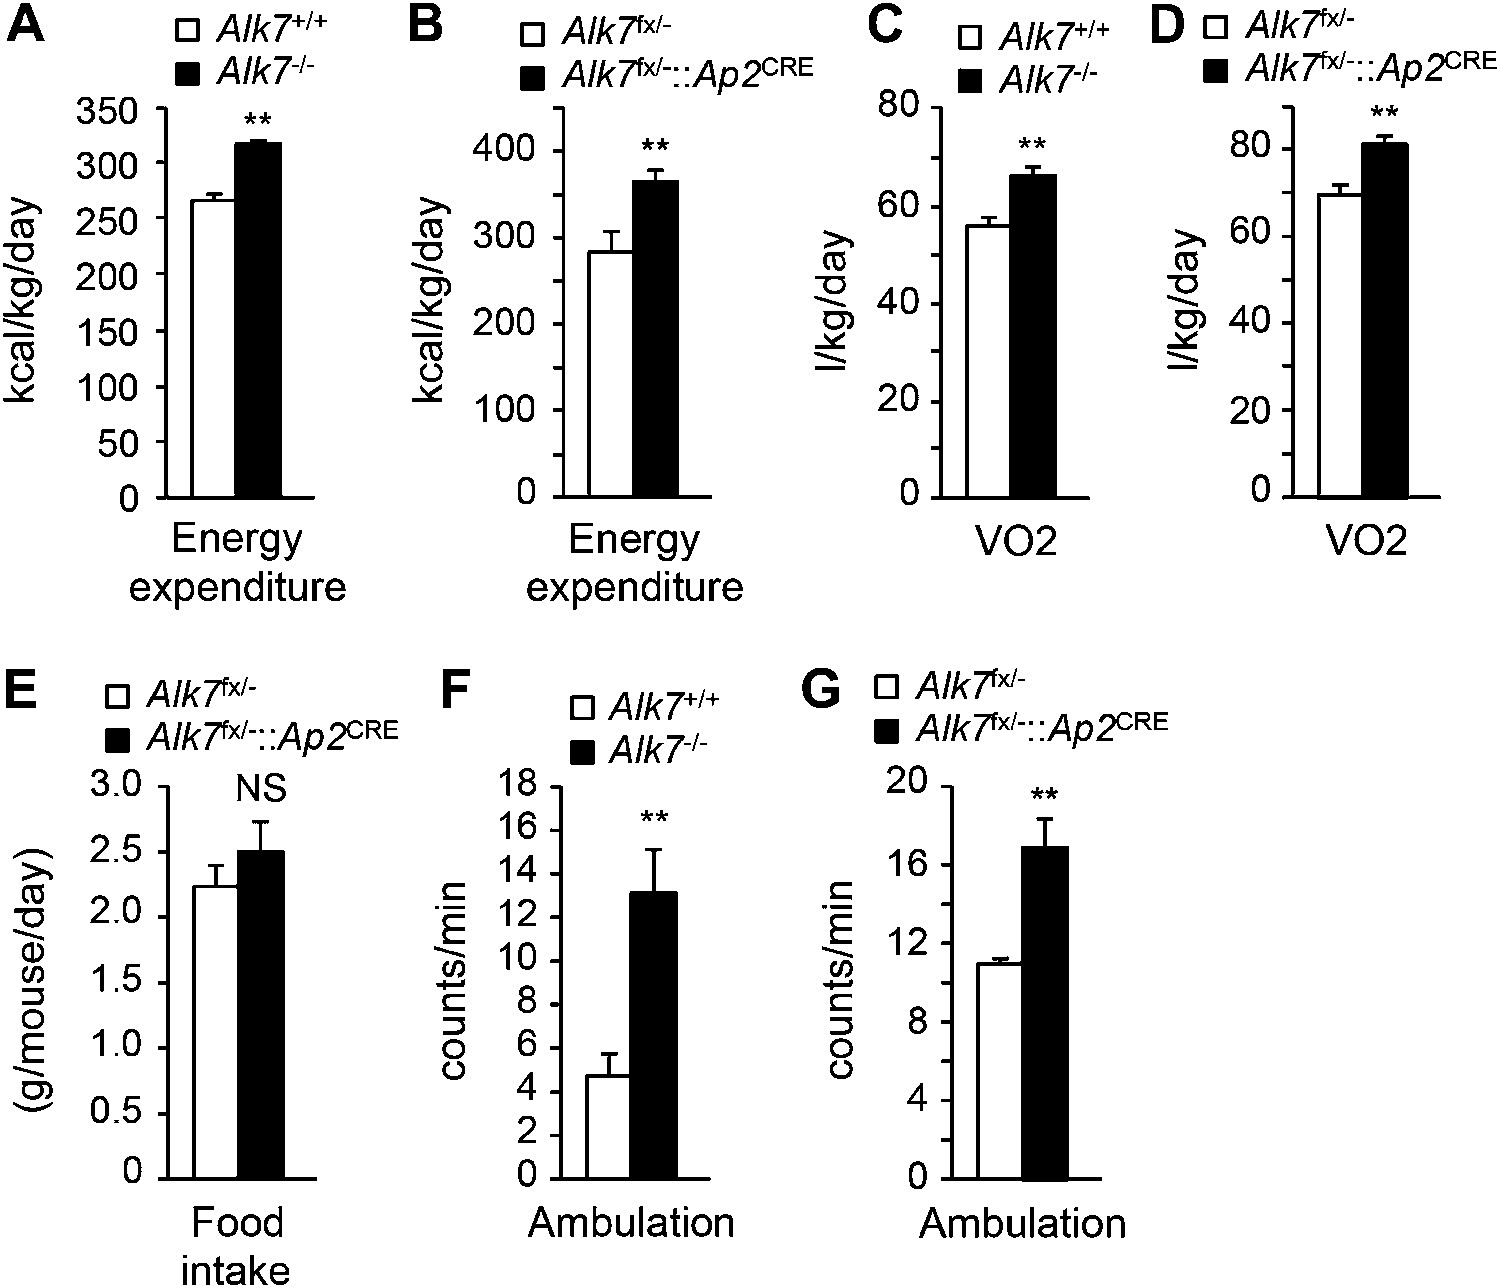
Increased energy expenditure and oxygen consumption in global and fat-specific Alk7 knock-out mice on a high fat diet.
(A and B) Energy expenditure assessed by calorimetric measurements in global Alk7−/− (A) and fat-specific Alk7fx/−::Ap2CRE (B) knock-out mice after 16 weeks on a high fat diet (HFD). N = 8 mice per group in (A), N = 6 in (B). (C and D) Oxygen consumption assessed by calorimetric measurements in global Alk7−/− (C) and fat-specific Alk7fx/−::Ap2CRE (D) knock-out mice after 16 weeks on HFD. N = 8 mice per group in (C), N = 6 in (D). (E) Daily food intake in fat-specific Alk7fx/−::Ap2CRE knock-out mice during 16 weeks on HFD. N = 6 mice per group. (F and G) Physical activity assessed as ambulation in global Alk7−/− (F) and fat-specific Alk7fx/−::Ap2CRE (G) knock-out mice after 16 weeks on HFD. N = 8 mice per group in (F), N = 6 in (G). *p < 0.05; **p < 0.01; NS, non-significant (mutant vs control). All error bars show mean ± SEM.
Figure 3—figure supplement 1
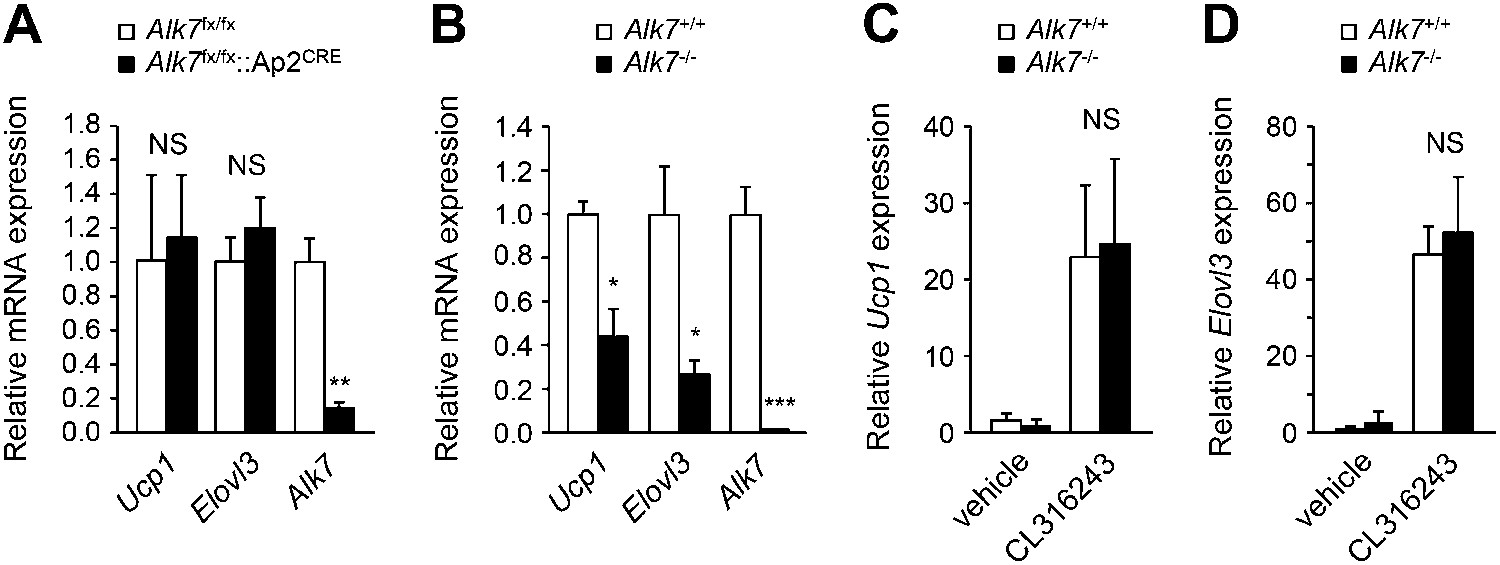
Alk7 deletion does not result in enhanced 'browning' of subcutanous adipose tissue.
(A and B) Relative mRNA expression of brown adipose tissue (BAT) markers Ucp1 and Elovl3 in subcutaneous adipose tissue of Alk7fx/fx::Ap2CRE fat-specific knock-out mice (A), global Alk7 knock-out mice (B), and corresponding controls. N = 4 mice per group in (A), N = 5 in (B). (C and D) Relative mRNA expression of brown adipose tissue (BAT) markers Ucp1 (C) and Elovl3 (D) in subcutaneous adipose tissue of wild type and global Alk7 knock-out mice following injection of the β3-AR-specific agonist CL316243 or vehicle as indicated. N = 4 mice per group. *p < 0.05; **p < 0.01; ***p < 0.001; NS, non-significant (mutant vs control). All error bars show mean ± SEM.
Figure 4
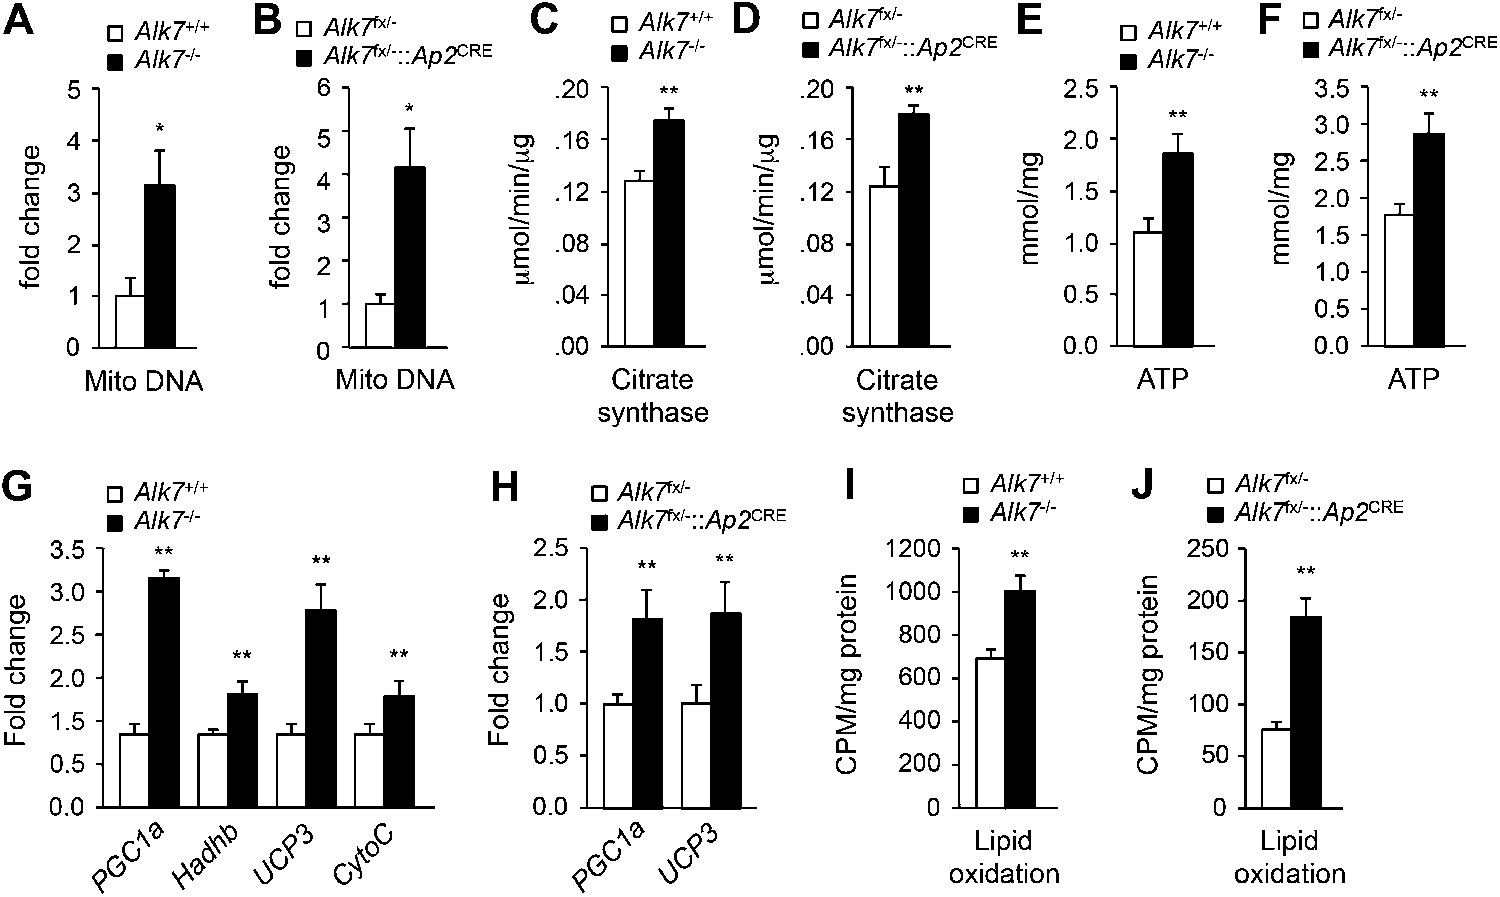
Elevated adipose tissue mitochondrial biogenesis and activity in fat-specific Alk7 knock-out mice on a high fat diet.
(A–F) Mitochondrial biogenesis assessed by measurements of mitochondrial (mito) DNA content (A and B), citrate synthase activity (C and D), and ATP content (E and F) in epididymal adipose tissue of global Alk7−/− (A, C, E) and fat-specific Alk7fx/−::Ap2CRE (B, D, F) knock-out mice after 16 weeks on a high fat diet (HFD). N = 8 mice per group in all cases. (G and H) Relative mRNA expression of markers of mitochondrial biogenesis and function PGC1a, Hadhb, UCP3, and cytochrome C assessed by quantitative PCR (Q-PCR) in epididymal adipose tissue of global Alk7−/− (G) and fat-specific Alk7fx/−::Ap2CRE (H) knock-out mice after 16 weeks on HFD. N = 6 mice per group in all cases. (I and J) Lipid oxidation in epididymal adipose tissue of global Alk7−/− (I) and fat-specific Alk7fx/−::Ap2CRE (J) knock-out mice. N = 3 mice per group in all cases. *p < 0.05; **p < 0.01; NS, non-significant (mutant vs control). All error bars show mean ± SEM.
Figure 5 with 1 supplement
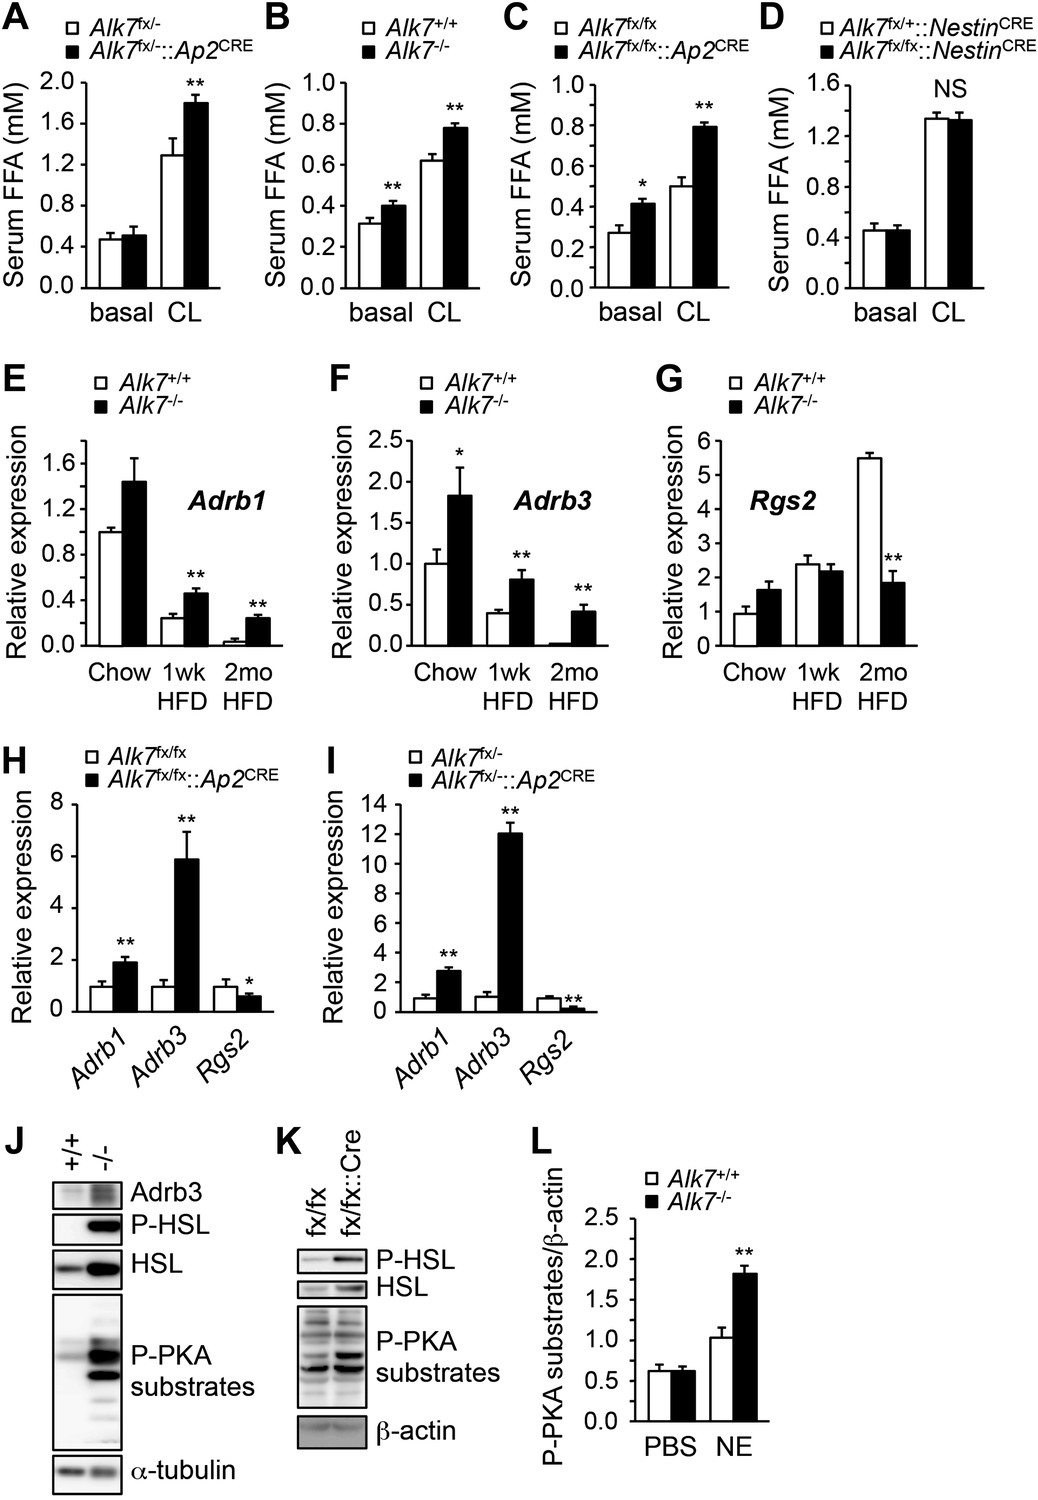
Enhanced catecholamine sensitivity and β-adrenergic signaling in adipose tissue of global and fat-specific Alk7 knock-out mice on a high-fat diet.
(A) Basal and CL316243 (CL)-stimulated serum free fatty acids (FFA) in fat-specific Alk7fx/−::Ap2CRE knock-out mice on a chow diet. N = 6 mice per group. (B–D) Basal and CL316243-stimulated lipolysis in global Alk7−/− (B), fat-specific Alk7fx/fx::Ap2CRE (C), and brain-specific Alk7fx/fx::NestinCRE (D) knock-out mice after 16 weeks on a high fat diet (HFD). N = 6 mice per group. (E–G) Relative mRNA expression of Adrb1 (E), Adrb3 (F), and Rgs2 (G) assessed by Q-PCR in epididymal adipose tissue of global Alk7−/− knock-out mice on chow and after 1 week (wk) or 2 months (mo) on HFD. N = 6 mice per group. (H and I) Relative mRNA expression of Adrb1, Adrb3, and Rgs2 assessed by Q-PCR in epididymal adipose tissue of fat-specific Alk7fx/fx::Ap2CRE (H) and Alk7fx/−::Ap2CRE (I) knock-out mice after 16 weeks on HFD. N = 6 mice per group. (J and K) Levels of Adrb3, phospho-HSL, total HSL, and phosphorylated PKA substrates assessed by Western blotting in epididymal adipose tissue of global Alk7−/− (J) and fat-specific Alk7fx/fx::Ap2CRE (K) knock-out mice after 16 weeks on HFD. The results shown are representative of four biological replicates. (L) Levels of phosphorylated PKA substrates were assessed by Western blotting in epididymal adipose tissue from 2-month-old global Alk7−/− knock-out mice on a chow diet following injection of norepinephrine (NE) or vehicle (PBS). Results show the levels of phosphorylated PKA substrates quantified by image analysis after normalization to β-actin. N = 3 mice per group. *p < 0.05; **p < 0.01; NS, non-significant (mutant vs control). All error bars show mean ± SEM.
Figure 5—figure supplement 1
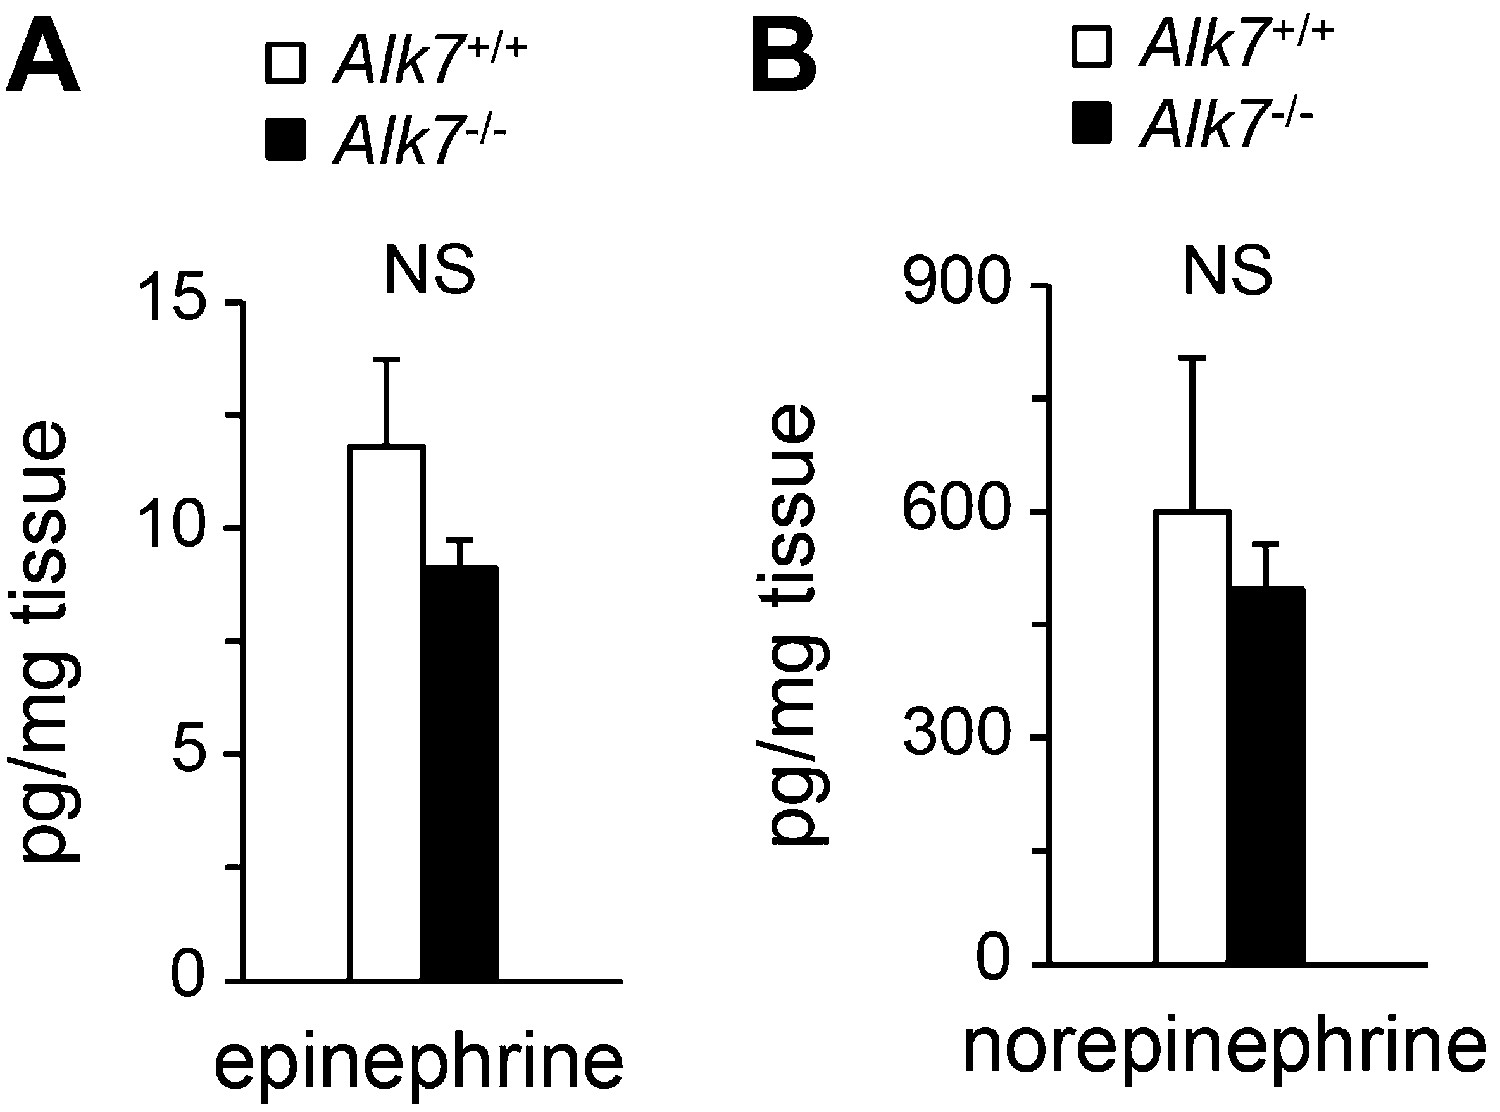
Epinephrine and norepinephrine levels in adipose tissue of Alk7 knock-out mice after 16 weeks on a high fat diet.
Levels of epinephrine (A) and norepinephrine (B) in epididymal fat of Alk7−/− mice and wild type controls following 16 weeks on a high fat diet. N = 6 mice per group. NS, non-significant. All error bars show mean ± SEM.
Figure 6 with 1 supplement
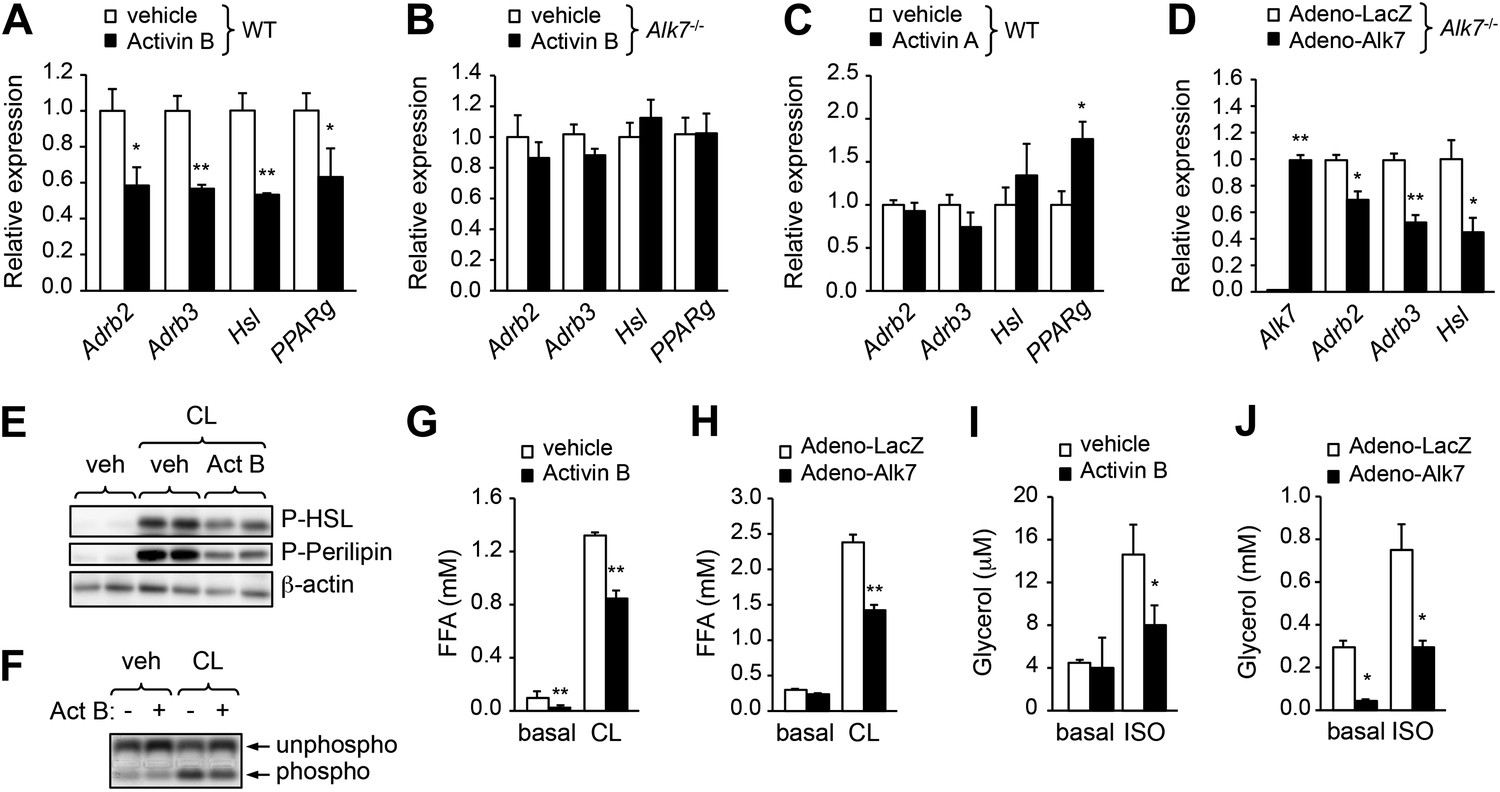
ALK7 signaling negatively regulates catecholamine sensitivity and β-adrenergic signaling in mouse and human adipocytes.
(A) Relative mRNA expression of Adrb2, Adrb3, Hsl, and PPARg assessed by Q-PCR in adipocytes derived from wild type (WT) mouse embryonic fibroblasts (MEFs) following stimulation with activin B. N = 4 wells per condition. (B) Relative mRNA expression of Adrb2, Adbr3, PPARg, and Hsl assessed by Q-PCR in adipocytes derived from Alk7 knock-out MEFs after stimulation with activin B. N = 4 wells per condition. (C) Relative mRNA expression of Adrb2, Adbr3, PPARg, and Hsl assessed by Q-PCR in adipocytes derived from WT MEFs following stimulation with activin A. N = 4 wells per condition. (D) Relative mRNA expression of Alk7, Adrb2, Adrb3, and Hsl assessed by Q-PCR in adipocytes derived from WT MEFs following adenovirus-mediated ALK7 overexpression. N = 4 wells per condition. (E) Levels of phospho-HSL and phospho-perilipin assessed by Western blotting in MEF-derived adipocytes after stimulation with β3-AR-specific agonist CL316243 (CL) or vehicle (veh) in the presence or absence of activin B (Act B). Independent biological duplicates are shown. (F) Assay of PKA activity in lysates of MEF-derived adipocytes after stimulation with β3-AR-specific agonist CL316243 (CL) or vehicle (veh) in the presence or absence of activin B (Act B). Independent biological duplicates are shown. (G and H) Basal and CL316243-stimulated lipolysis in MEF-derived adipocytes following stimulation with activin B (G) or adenovirus-mediated ALK7 overexpression (H). FFA: free fatty acids. N = 4 wells per condition. (I and J) Basal and isoproterenol (ISO)-stimulated lipolysis in human adipocytes following stimulation with activin B (I) or adenovirus-mediated ALK7 overexpression (J). N = 4 wells per condition. *p < 0.05; **p < 0.01; NS, non-significant (activin treatment vs vehicle or Adeno-Alk7 vs Adeno-LacZ, as indicated). All error bars show mean ± SEM.
Figure 6—figure supplement 1
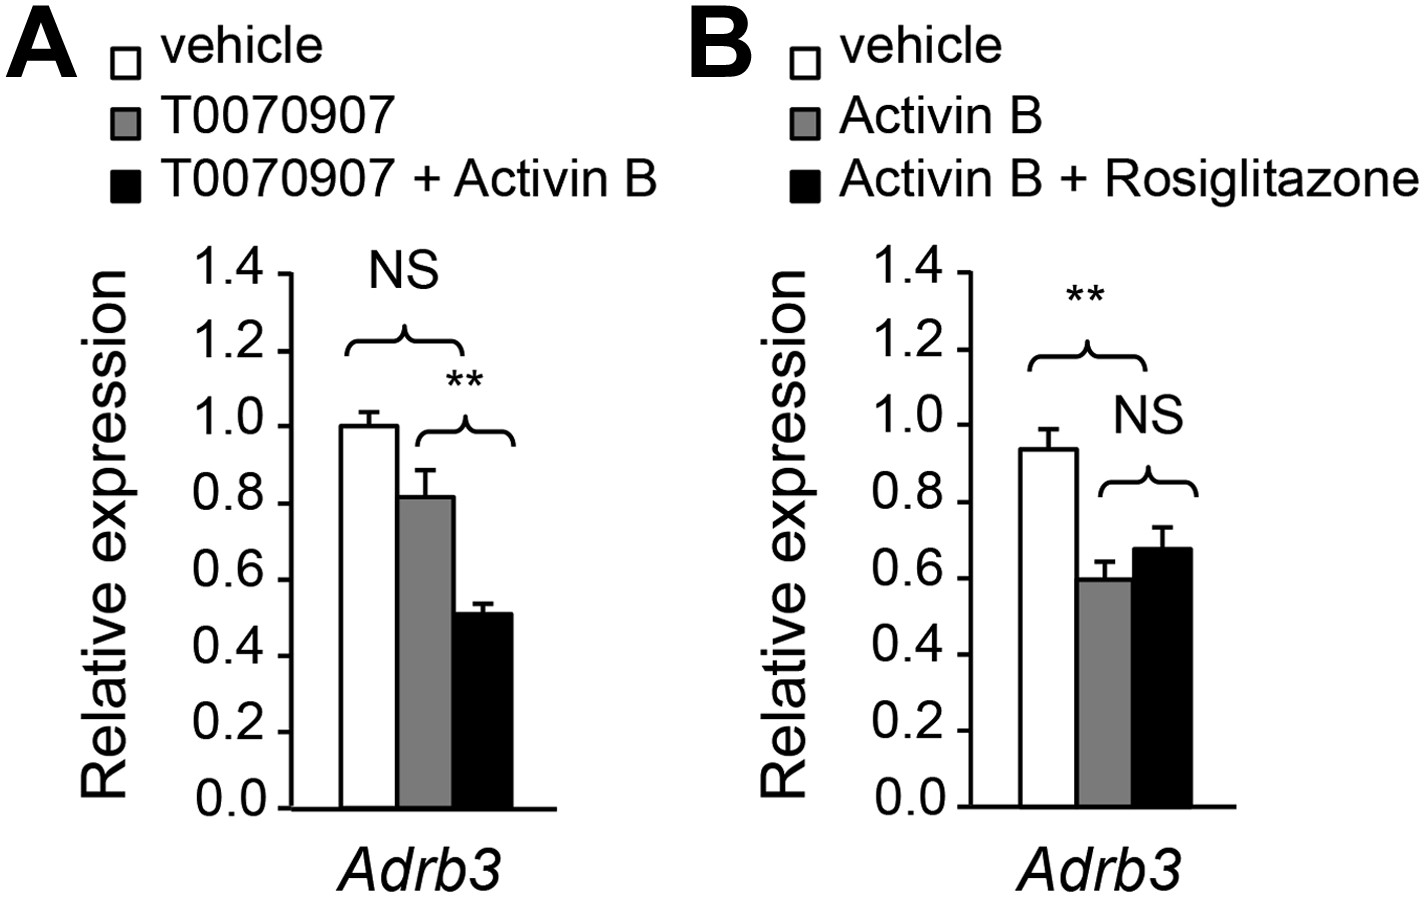
The effects of activin B on adipocyte Adrb mRNA expression are independent of PPARγ.
(A) Relative mRNA expression of Adrb3 assessed by Q-PCR in adipocytes derived from wild type (WT) mouse embryonic fibroblasts (MEFs) following stimulation with PPARγ antagonist T0070907 in the presence and absence of activin B. N = 4 wells per condition. (B) Relative mRNA expression of Adrb3 assessed by Q-PCR in adipocytes derived from WT MEFs following stimulation with activin B in the presence or absence of PPARγ agonist rosiglitazone. N = 4 wells per condition. **p < 0.01; NS, non-significant (activin B vs vehicle). All error bars show mean ± SEM.
Figure 7 with 2 supplements
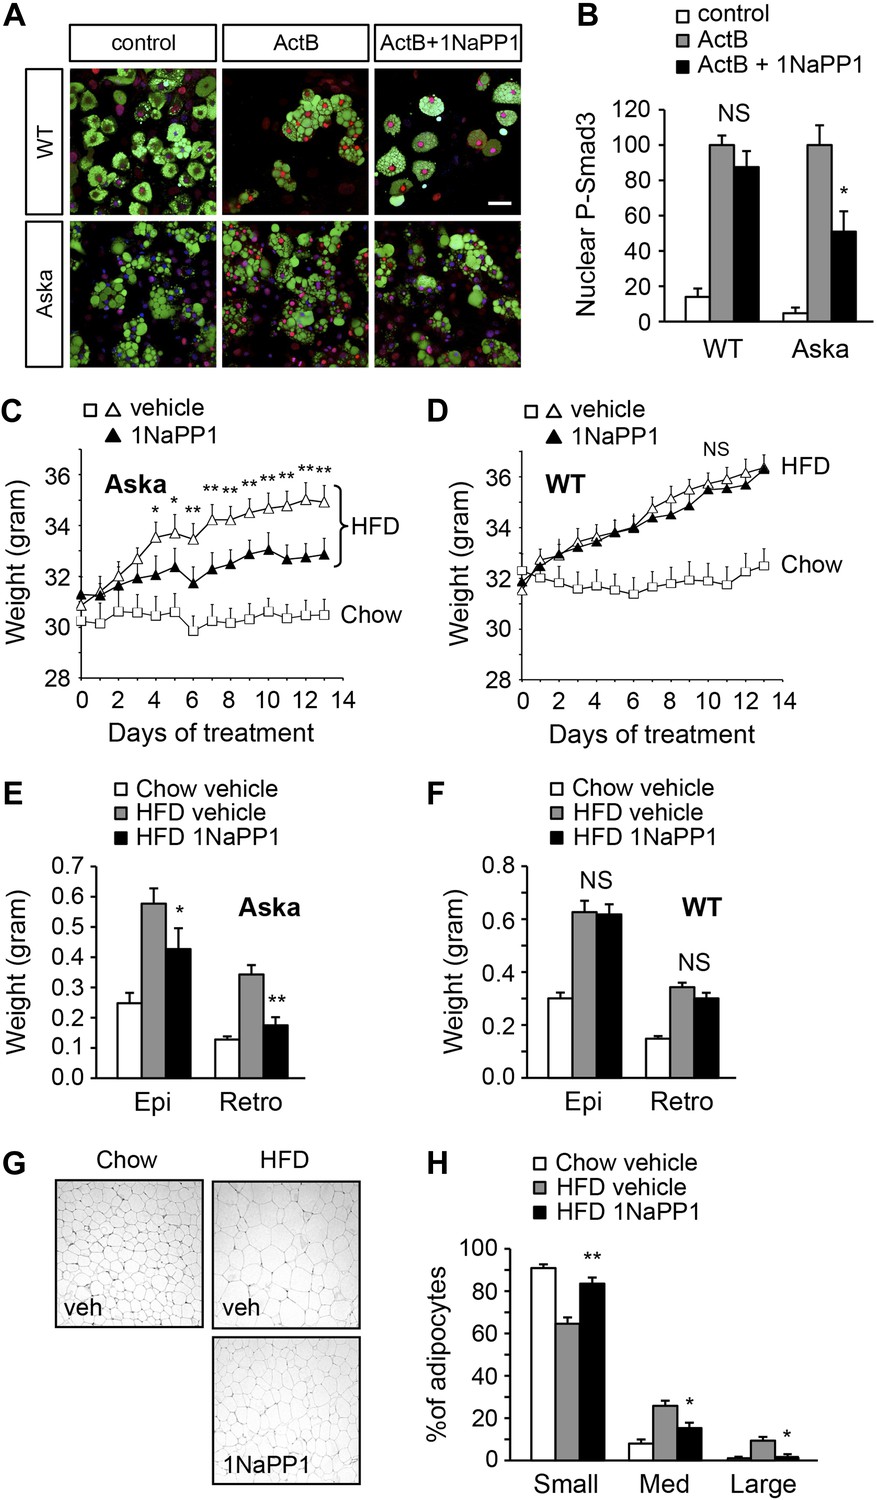
Acute inhibition of ALK7 signaling in adult mice through a chemical-genetic approach reduces diet-induced weight gain and fat accumulation.
(A and B) Activin B signaling was assessed by p-Smad3 nuclear translocation in mouse embryonic fibroblast (MEF)-derived adipocytes from wild type (WT) or Alk7ASKA (Aska) mice in the presence and absence of ATP competitive inhibitor 1NaPP1. Nuclear p-Smad3 (red) was specifically evaluated by immunohistochemistry in adipocytes, identified by BODIPY 493/503 staining (green). Representative photomicrographs are shown in (A). Scale bar, 50 μm. Quantitative analysis is shown in (B). N = 3 independent experiments each performed in triplicate. (C and D) Weight gain on chow (squares) and a high fat diet (HFD, triangles) in Alk7ASKA (C) and wild type (D) mice treated with 1NaPP1 (solid triangles) or vehicle (open squares and triangles). N = 6 mice per group in (C), N = 9 in (D). (E and F) Weights of epididymal (Epi) and retroperitoneal (Retro) fat depots in Alk7ASKA (E) and wild type (F) mice after chow (open bars) or 2 weeks on HFD treated with 1NaPP1 (black bars) or vehicle (gray bars). N = 6 mice per group in (E), N = 7 in (F). (G and H) Adipocyte cell size in Alk7ASKA mice after chow or HFD as visualized by hematoxylin-eosin staining in tissue sections of epididymal adipose tissue of Alk7ASKA mice after chow or 2 weeks on HFD treated with 1NaPP1 or vehicle (veh) (G). Quantitative analysis is shown in (H). Small, 400–5000 μm2; Med, 5000–10,000 μm2; Large, 10,000–20,000 μm2. N = 4 mice per group (four sections per mouse). *p < 0.05; **p < 0.01; NS, non-significant (1NaPP1 vs vehicle). All error bars show mean ± SEM.
Figure 7—figure supplement 1
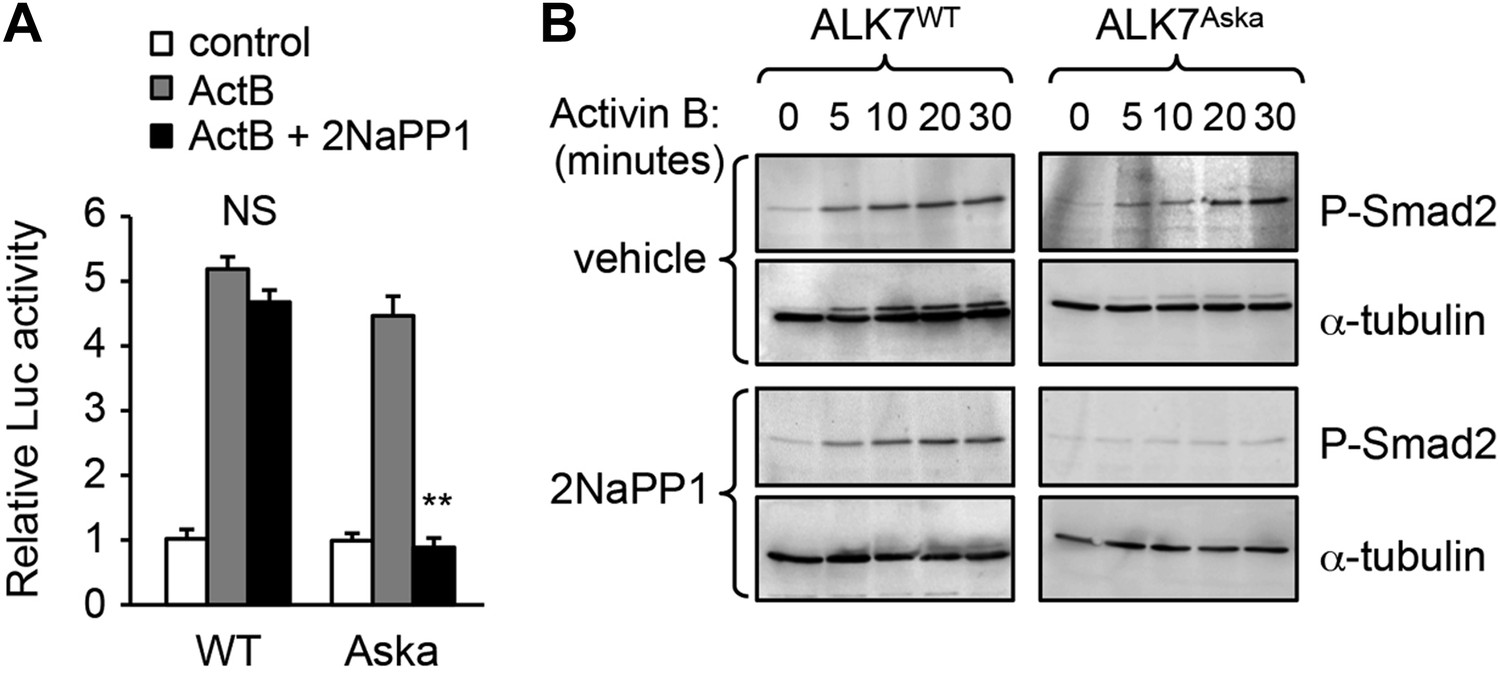
Validation of Alk7ASKA allele in transfected R4-2 cells.
(A and B) Luciferase reporter assay (A) and Smad-2 phosphorylation (B) in response to activin B in R4-2 cells reconstituted with Alk7WT or Alk7ASKA constructs in the presence or absence of 1 μM 2NaPP1 analogue. N = 3 wells per condition (A). Results shown in (B) are representative of two independent experiments. **p < 0.01; NS, non-significant (± 2NaPP1). Error bars show mean ± SEM.
Figure 7—figure supplement 2
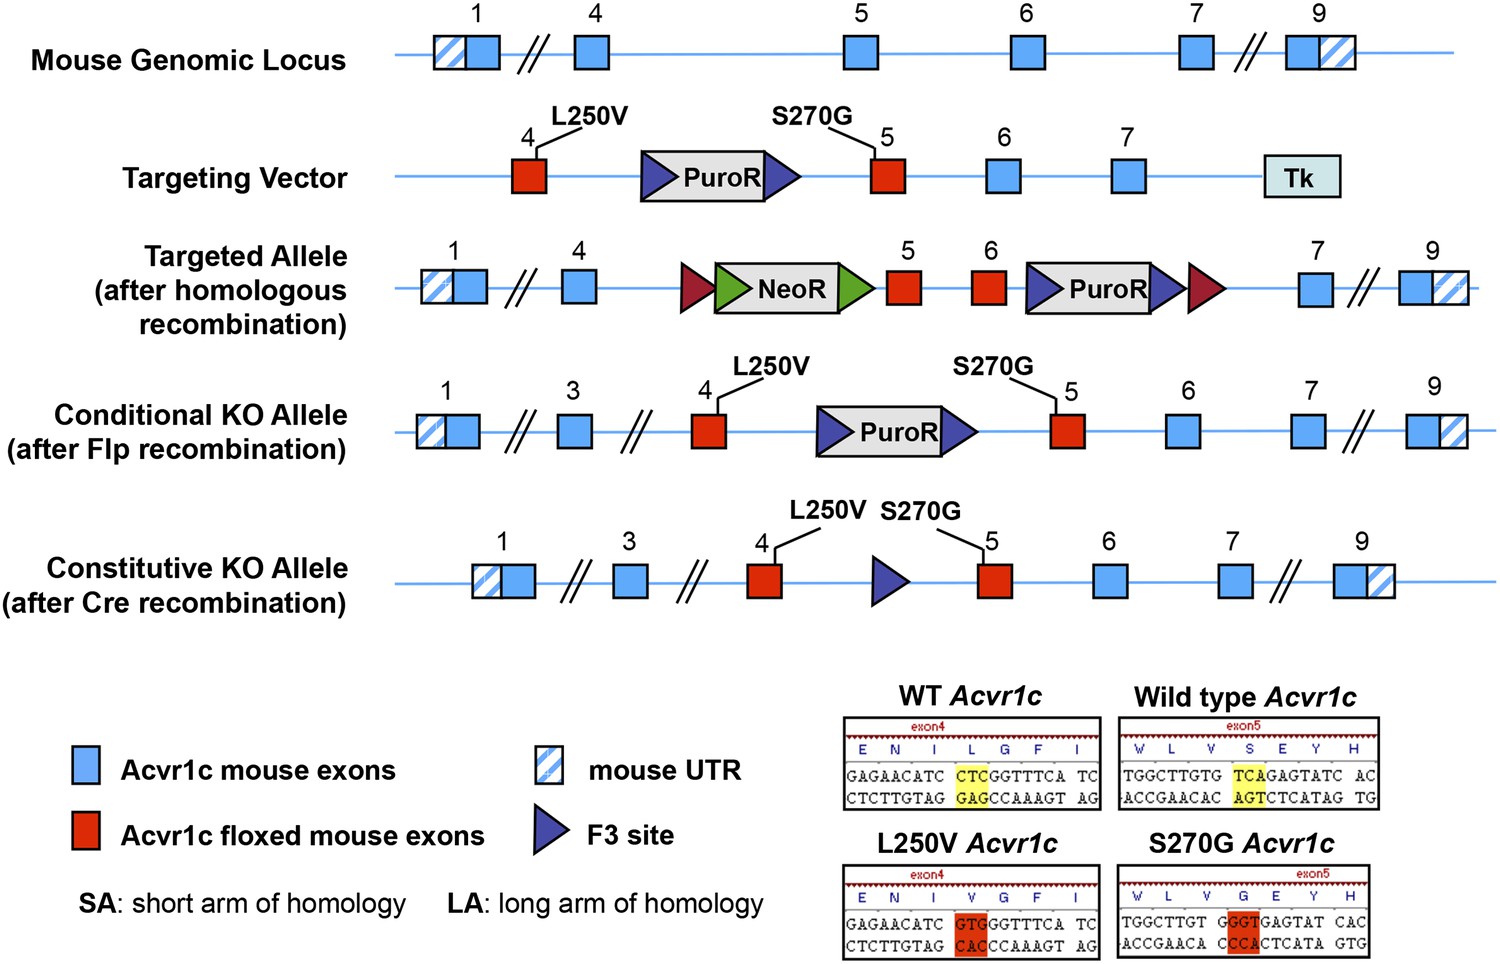
A chemical-genetic approach for acute inactivation of ALK7 in adult mice.
Gate-keeper residues Ser270 and Leu250 in the ATP-binding pocket of the ALK7 kinase were replaced into Gly and Val, respectively.
Figure 8
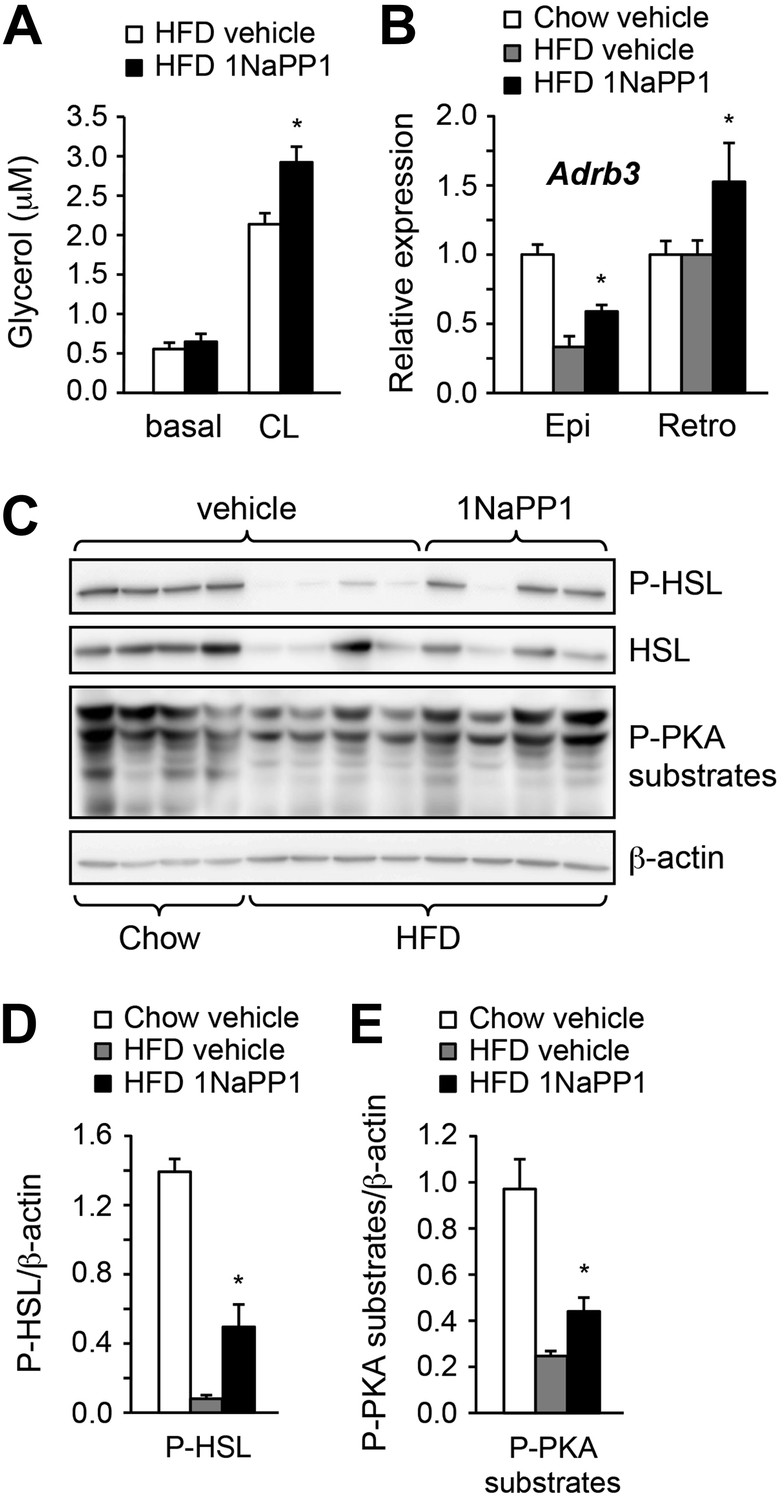
Acute inhibition of ALK7 signaling in adult mice reduces diet-induced catecholamine resistance.
(A) Basal and CL316243 (CL)-stimulated lipolysis in adipose tissue biopsies extracted from Alk7ASKA mice after 2 weeks on a high fat diet (HFD) treated with 1NaPP1 (solid bars) or vehicle (open bars). N = 6 mice per group. Epi, epididymal; Retro, retroperitoneal. (B) Relative mRNA expression levels of Adrb3 assessed by Q-PCR in epididymal (Epi) adipose tissue of Alk7ASKA mice after chow (open bars) or 2 weeks on HFD treated with 1NaPP1 (black bars) or vehicle (gray bars). N = 6 mice per group. (C–E) Levels of phospho-HSL (p-HSL) and phosphorylated PKA (P-PKA) substrates assessed by Western blotting in epididymal adipose tissue of Alk7ASKA mice after chow or 2 weeks on HFD treated with 1NaPP1 or vehicle. Histograms show quantification by image analysis of P-HSL levels (D) and levels of phosphorylated PKA substrates (E) normalized to β-actin levels. N = 4 mice per group. *p < 0.05; **p < 0.01; NS, non-significant (1NaPP1 vs vehicle). All error bars show mean ± SEM.
Additional files
-
Supplementary file 1
Primers for qPCR. Sequences of primers used for qPCR are given.
- https://doi.org/10.7554/eLife.03245.019
Download links
A two-part list of links to download the article, or parts of the article, in various formats.
Downloads (link to download the article as PDF)
Open citations (links to open the citations from this article in various online reference manager services)
Cite this article (links to download the citations from this article in formats compatible with various reference manager tools)
Adipocyte ALK7 links nutrient overload to catecholamine resistance in obesity
eLife 3:e03245.
https://doi.org/10.7554/eLife.03245


