Autophagy is a critical regulator of memory CD8+ T cell formation
- University of Oxford, John Radcliffe Hospital, United Kingdom
- University of Oxford, United Kingdom
Figures
Figure 1 with 2 supplements
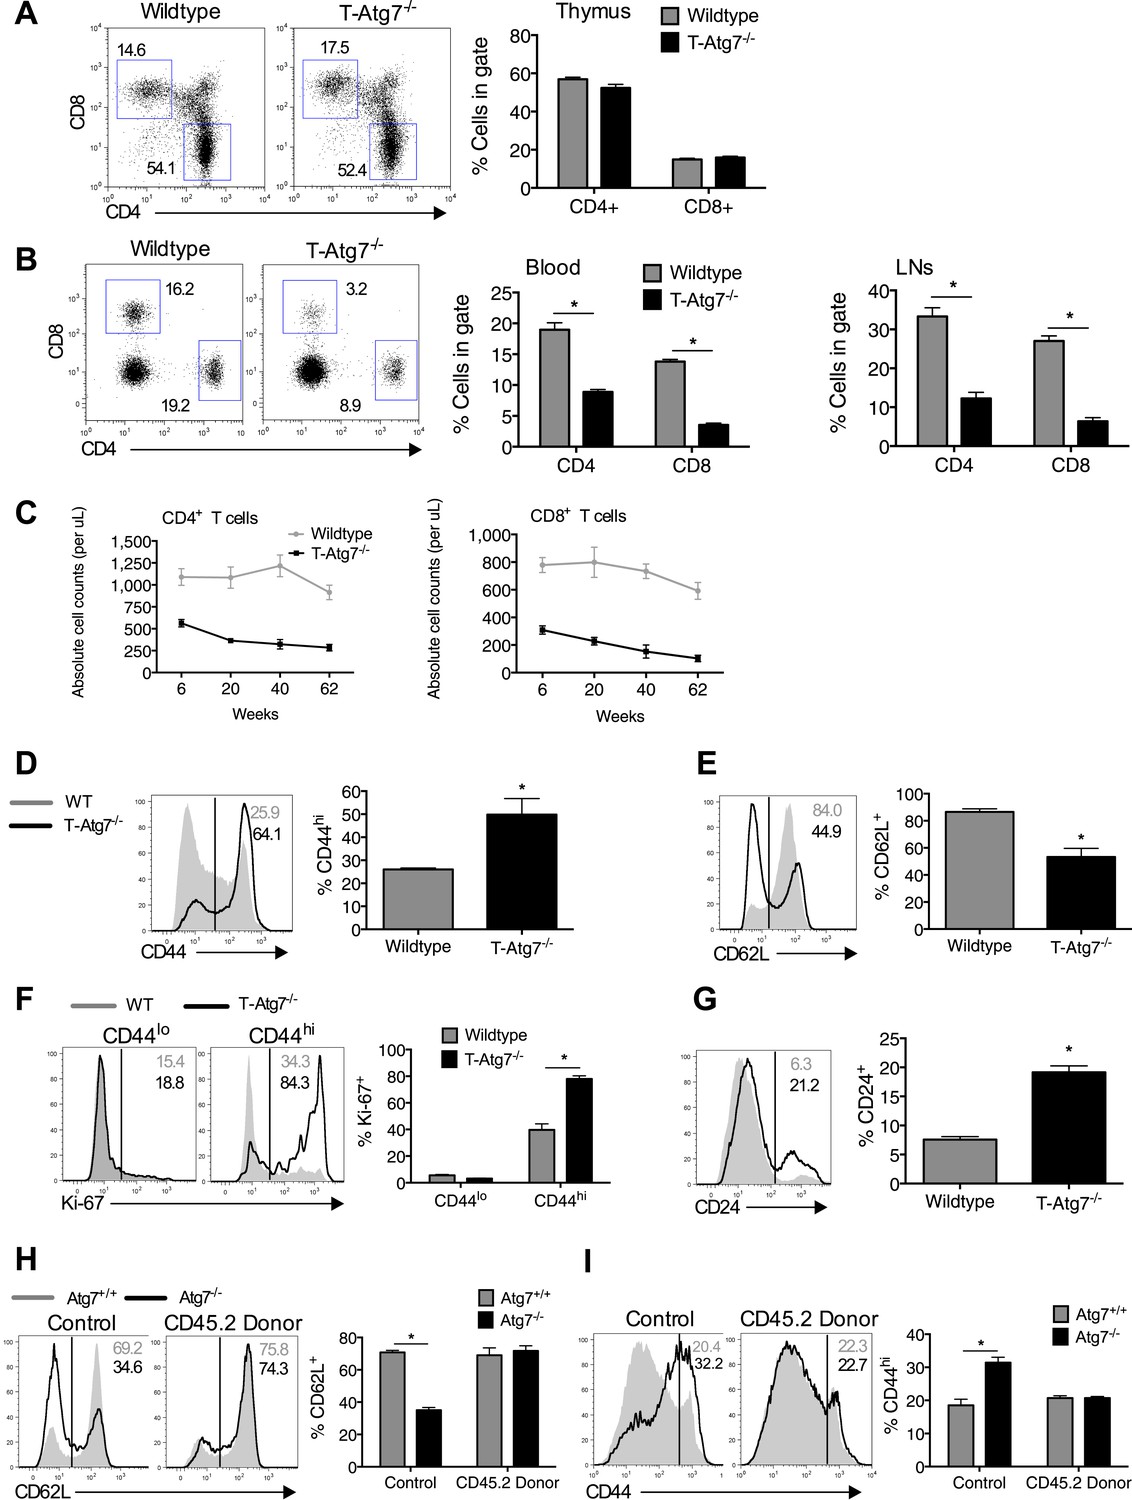
Lymphopenia induces homeostatic proliferation and an activated CD8+ T cell phenotype in T-Atg7−/− mice.
(A) Frequency of mature single positive CD4+ and CD8+ T cells in thymi of 6 week old mice (n = 4), representative FACS plot of three independent experiments. (B) Flow cytometric analysis of CD4+ and CD8+ T cell frequencies in blood and lymph nodes of T-Atg7−/− and wild-type mice (dot plots depict staining in blood). Quantitative analyses are representative of six independent experiments, *p < 0.05 (n = 4). (C) Absolute counts of CD4+ and CD8+ T cells in blood of T-Atg7−/− and WT mice over time (n = 4). (D) Percentage of CD44hi cells in the splenic CD8+ T cell compartment of T-Atg7−/− and WT mice. Bar graphs depict the frequency of gated cells (representative of seven independent experiments), *p < 0.05 (n = 4). (E) Percentage of splenic CD8+ T cells positive for CD62L in T-Atg7−/− and WT mice. Data are representative of three independent experiments, *p < 0.05, (n = 4). (F) Percentage of CD44lo and CD44hi CD8+ T cells expressing Ki-67 in the spleen of T-Atg7−/− and WT mice. Bar graphs are representative of three independent experiments, *p < 0.05 (n = 4). (G) Frequency of splenic CD8+ T cells expressing CD24 in T-Atg7−/− and WT mice. Bar graph is representative of two independent experiments, *p < 0.05 (n = 4). (H) Percentage of donor-derived CD62L+CD8+ T cells. Lethally irradiated CD45.1 hosts reconstituted with a 1:1 mix of T-Atg7−/− or WT BM (both CD45.2) with CD45.1 wild-type BM. Controls were WT and T-Atg7−/− mice; *p < 0.05 (n = 4). (I) Frequency of donor-derived CD45.2+ CD8+ T cells in the spleen that is CD44hi. Controls were normal WT and T-Atg7−/− mice, *p < 0.05 (n = 4). All values are mean ± s.e.m, and all statistical analyses are Mann–Whitney U-tests.
Figure 1—figure supplement 1
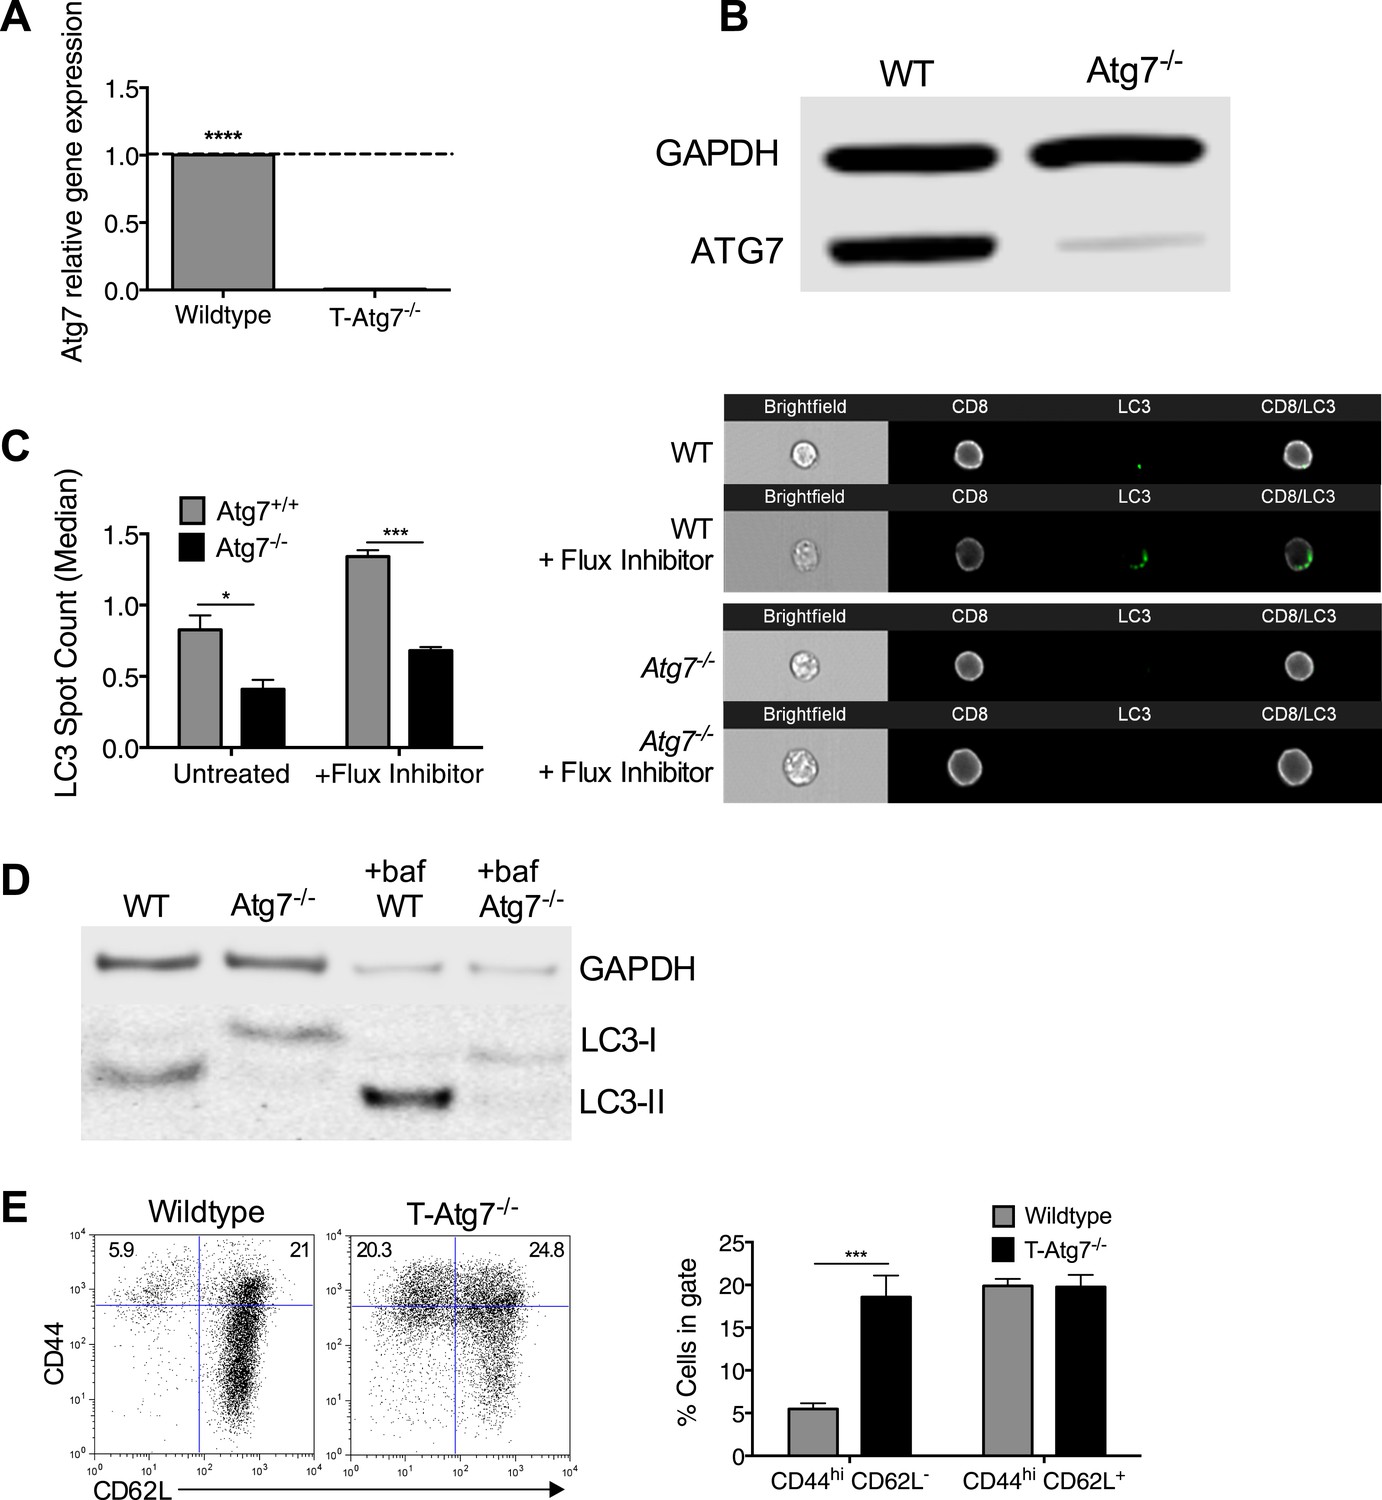
Atg7 is efficiently excised in CD8+ T cells from T-Atg7−/− mice resulting in loss of functional autophagy.
(A) Atg7 gene expression in Atg7+/+ and Atg7−/− T cells. T cells were isolated from the spleens of WT and T-Atg7−/− mice by flow cytometry. mRNA was extracted, and Atg7 gene expression was measured by q-PCR. Bar graph shows relative Atg7 expression in T cells from T-Atg7−/− mice compared to T cells from WT mice. ****p < 0.0001 by Student's t test. (B) Protein was purified from pooled MACS-sorted CD8+ T cells from WT and T-Atg7−/− mice and western blotted for ATG7. GAPDH was used as a loading control (n = 6 pooled mice). (C) LC3 Spot count in WT and Atg7−/− CD8+ T cells. Splenocytes from WT and T-Atg7−/− mice were untreated or treated for 2 hr with an autophagy flux inhibitor before staining for relevant cell surface markers and LC3-II. LC3 spot count was assessed using ImageStream software. Quantification is gated on CD8+ T cells. Right panel depicts example LC3 spot count images (×60 magnification). *p = 0.0132, ***p = 0.0002 as determined by Student t test (n = 4) (D) Autophagy flux in WT and Atg7−/− CD8+ T cells. Purified CD8+ T cells were untreated or treated with bafilomycin for 6 hr before whole protein extraction and western blot for LC3. (E) Percentage of CD44hi CD62L− and CD44hi CD62L+ cells in the splenic CD8+ T cell compartment of T-Atg7−/− and WT mice. Representative FACS plots of three independent experiments are shown, ***p = 0.0003 as determined by Mann–Whitney U-test (n = 9).
Figure 1—figure supplement 2
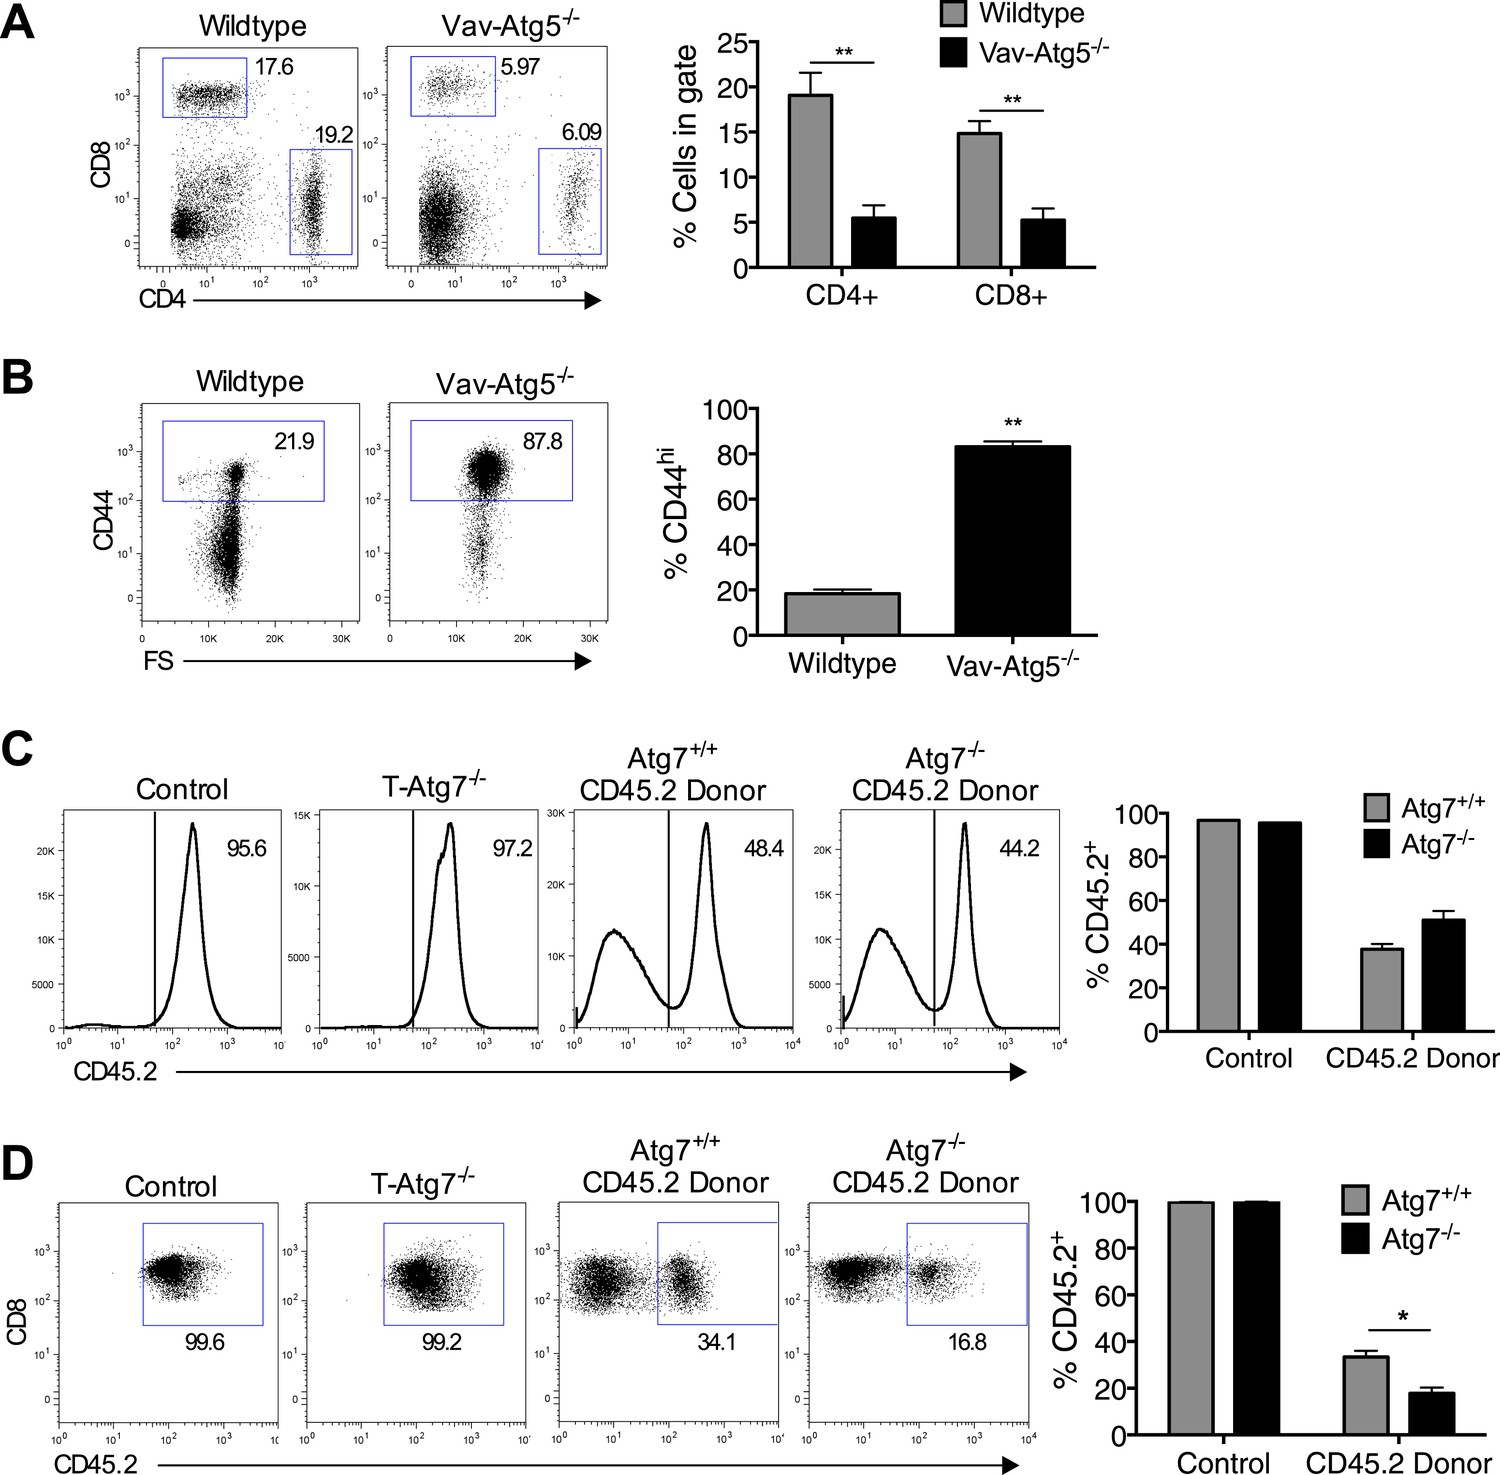
The T cell phenotype of Vav-Atg5−/− mice is similar to that of T-Atg7−/− mice and the survival defect of Atg7−/− CD8+ T cells is cell intrinsic.
(A) Flow cytometric analysis of CD4+ and CD8+ T cell frequencies in the spleen of WT and Vav-Atg5−/− mice. Quantitative analyses are representative of two independent experiments, **p < 0.01 (n = 5). (B) Frequency of CD44hi cells within the CD8+ T cell subset of WT and Vav-Atg5−/− mice. Data are representative of two independent experiments, **p < 0.01 (n = 5). (C) BM reconstitution in BM chimera mice. 9 weeks after marrow transplantation, the frequency of donor CD45.2 cells was assessed in the spleen by flow cytometry. Quantified is the frequency of splenocytes expressing CD45.2 in BM chimera mice and in normal WT and T-Atg7−/− mice that acted as controls. (D) Frequency of CD8+ T cells that are CD45.2 donor-derived in BM chimera mice. Example dot plots are gated on CD8+ T cells. Quantified is the frequency of CD8+ T cells that express CD45.2 in BM chimera and in normal WT and T-Atg7−/− mice that acted as controls. *p < 0.05 (n = 4). Data are mean ± s.e.m and all statistical analyses are Mann–Whitney U-tests.
Figure 2 with 1 supplement
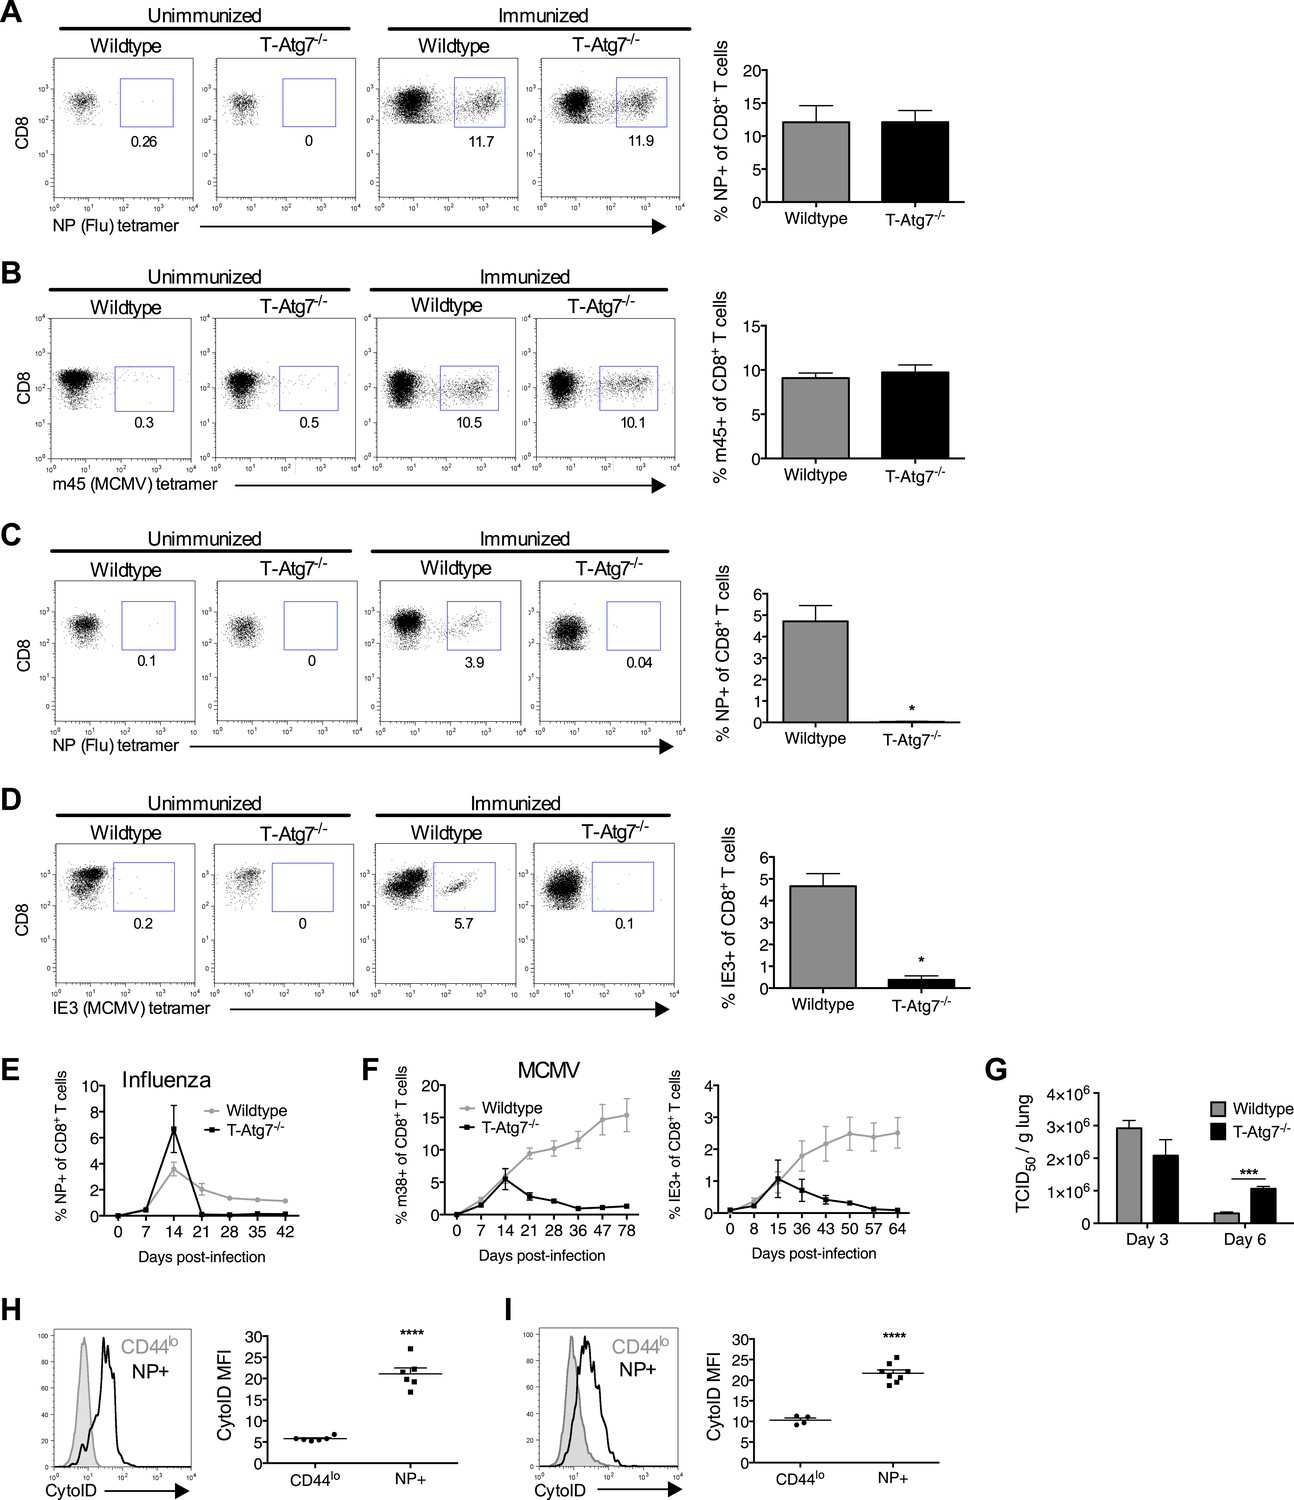
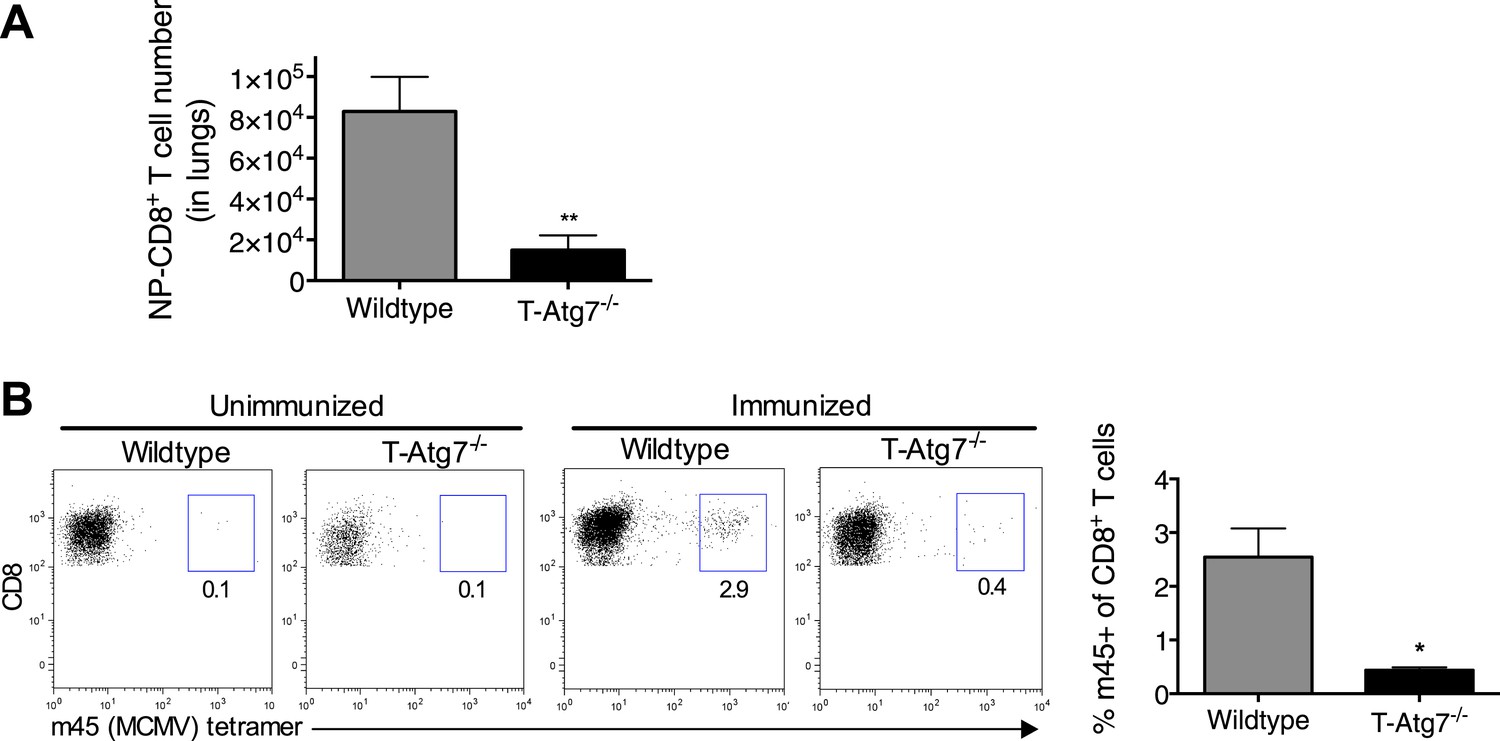
Normal effector CD8+ T cell responses to viral infection but defective memory CD8+ T cell formation in T-Atg7−/− mice.
(A) Effector CD8+ T cell response to influenza in WT and T-Atg7−/− mice. Mice were immunized intra-nasally with 0.00032 HAU PR8 influenza. On day 10, antigen-specific CD8+ T cells to nucleoprotein (NP) was assessed with tetramer in lungs. Dot plots show examples of tetramer staining gated on CD8+ T cells. Bar graph indicates percentage of CD8+ T cells specific for NP (n = 5–6) and is representative of three independent experiments. (B) Effector CD8+ T cell's response to MCMV in WT and T-Atg7−/− mice. CD8+ T cells from blood were stained with m45 tetramer on day 7 post-infection. Dot plots show m45-tetramer+ cells gated on CD8+ T cells. Bar graph indicates % CD8+ T cells specific for m45 (n = 4–5) and is representative of three independent experiments. (C) CD8+ Tmem response to influenza. WT and T-Atg7−/− mice immunized as in (A) and the antigen-specific CD8+ T cell response was assessed in lungs on day 50 by tetramer. *p < 0.05, by Mann–Whitney U-test (n = 4). Dot plots are gated on CD8+ T cells. Bar graph is representative of three independent experiments. (D) CD8+ Tmem's response to MCMV. Lung CD8+ T cells on day 65 post-infection were stained with IE3-tetramer. Dot plots are gated on CD8+ T cells. Quantitation depicts frequency of IE3 specific CD8+ T cells. *p < 0.05, by Mann–Whitney U-test (n = 4). Data are representative of two independent experiments. (E) CD8+ T cell kinetics to influenza infection. WT and T-Atg7−/− mice were immunized as in (A) and CD8+ T cell response tracked over time in blood by tetramer. Y-axis shows frequency of NP-specific CD8+ T cells. (F) CD8+ T cell kinetics to MCMV infection. CD8+ T cell response to epitopes m38 (left panel) and IE3 (right panel) were tracked over time in blood by tetramer in WT and T-Atg7−/− mice. Y-axis indicates the percentage of CD8+ T cells that are m38-specific. (G) Influenza virus titres. WT and T-Atg7−/− mice were culled at days 3 and 6 post-immunization with PR8, and lungs were collected and snap frozen in liquid nitrogen. Virus titres were determined using MDCK-SIAT1 cells. ***p = 0.0002 as determined by Student t-test (n = 4) (H) WT mice were immunized with PR8 influenza as in (A). CD8+ T cells from spleen were stained with CytoID at day 9 post-infection and assessed by flow cytometry. Histograms show examples of CD44lo CD8+ T cells from unimmunized mice (filled grey line) and in NP-specific CD8+ T cells from immunized mice (open black line). Quantification is by mean fluorescence intensity (MFI) of CytoID on gated indicated cell population and representative of two independent experiments. ****p < 0.0001 by Student t test (n = 6). (I) Autophagy levels by CytoID staining on CD8+ T cells from the lungs on day 9 post-infection as in (G). Histograms provide examples of CytoID staining, gated on CD8+ T cells in lungs of immunized mice (solid grey lines), and gated on NP-tetramer-specific CD8+ T cells from immunized mice (open black lines). Quantification is by mean fluorescence intensity (MFI) of CytoID on gated indicated cell population and representative of two independent experiments. ****p < 0.0001 by Student t test (n = 4–8). All values are mean ± s.e.m.
Figure 2—figure supplement 1
T-Atg7−/− mice fail to form memory CD8+ T cells to a conventional MCMV epitope.
(A) Effector CD8+ T cell absolute counts in WT and T-Atg7−/− mice. Quantification of the absolute number of CD8+ NP-tetramer+ T cells was determined in the lungs on day 10 of PR8 influenza infection. **p = 0.0084 by Student t test (n = 6–9). (B) Frequency of m45-specific CD8+ T cells in the liver of MCMV-immunized WT and T-Atg7−/− mice on day 100 post-infection. Dot plots are gated on CD8+ T cells; bar graphs depict the percentage of CD8+ T cells that are m45-tetramer+. All values are mean ± s.e.m.
Figure 3 with 1 supplement
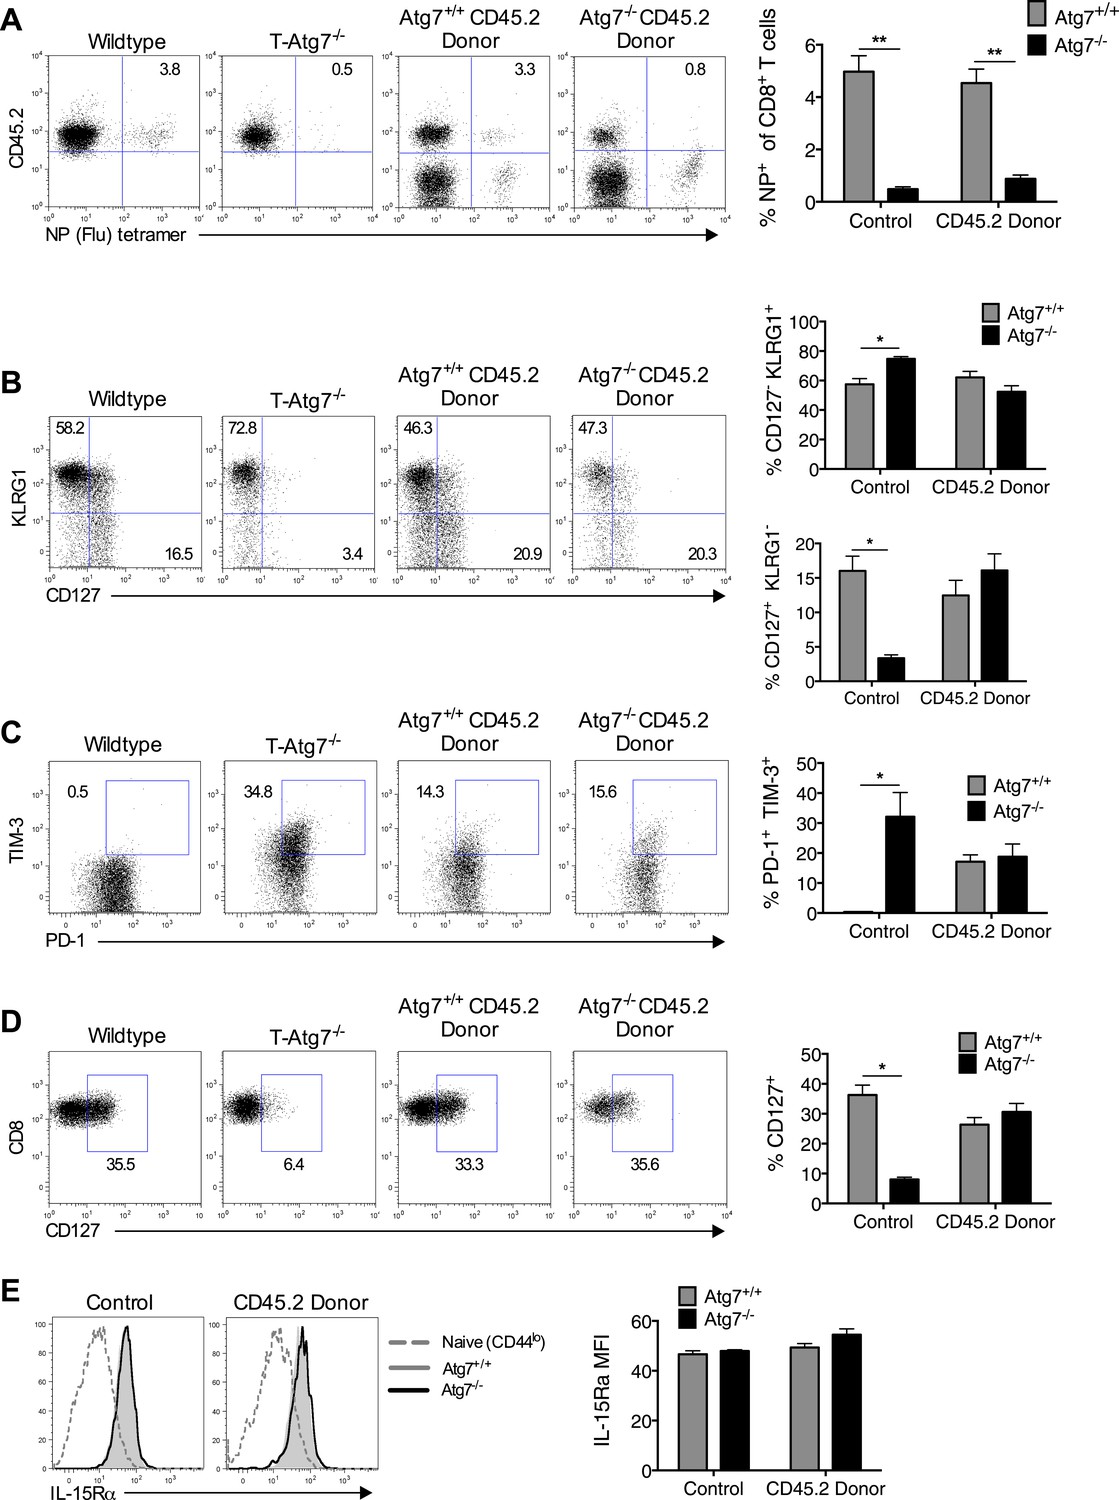
Loss of memory CD8+ T cell formation in the absence of Atg7 is not due to lymphopenia, poor CD4+ T cell help, exhaustion, or defective cytokine receptor expression.
(A) CD8+ Tmem response to influenza in mixed BM chimeras, generated as in Figure 1H. Mice were immunized with PR8 influenza, and the CD8+ Tmem response of the CD45.2 donor to NP was assessed in lungs by tetramer on day 40. Quantitation shows frequency of (donor) CD45.2+ CD8+ T cells that are NP-specific (n = 5–6). **p < 0.01, by Mann–Whitney U-test (n = 4–7). (B) SLEC and MPEC populations in the Atg7+/+ and Atg7−/− antigen-specific CD8+ T cell pool. Mixed BM chimera generated as in Figure 1H, were immunized with MCMV 8 weeks after transplantation. Dot plots show example of KLRG1 and CD127 expression on gated CD45.2+ m45-tetramer+ CD8+ T cells on day 10 post-infection. Upper bar graph depicts the % of CD45.2+ m45-tetramer+ CD8+ T cells that are CD127− KLRG1+ (SLECs). Lower bar graph shows the % of CD127+ KLRG1− (MPECs) in the same population. *p < 0.05, by Mann–Whitney U-test (n = 4–7). (C) Markers of exhaustion on Atg7−/− MCMV-specific CD8+ T cells on MCMV challenged BM chimera. Dot plots depict example of PD-1 and TIM-3 staining on gated CD45.2+ m45-tetramer+ CD8+ T cells. Bar graph quantifies the percentage of (donor) CD45.2+ m45-tetramer+ CD8+ T cells that are PD-1+ TIM-3+ at day 10 post-infection. *p < 0.05, by Mann–Whitney U-test (n = 4–7). (D) CD127 expression on Atg7−/− MCMV-specific CD8+ T cells in MCMV challenged BM chimeras. Examples of CD127 staining on gated CD45.2+ m45-tetramer+ CD8+ T cells from spleen on day 10 post-infection are shown. *p < 0.05, by Mann–Whitney U-test (n = 4–7). (E) IL-15Rα expression on splenic Atg7−/− MCMV-specific CD8+ T cells in MCMV challenged BM chimeras. Histograms depict IL-15Rα expression in CD44lo CD8+ T cells from unimmunized mice (grey dotted line), Atg7+/+ CD45.2+ m45-tetramer CD8+ T cells (grey filled line), and Atg7−/− CD45.2+ m45-tetramer CD8+ T cells (black line). The left histogram shows expression in control normal WT and T-Atg7−/− mice, the right histogram indicates staining in donor CD45.2+ cells from BM chimera mice. Quantified is IL-15Rα mean fluorescence intensity on gated CD45.2+ m45-tetramer CD8+ T cells (n = 4–7). All values are mean ± s.e.m.
Figure 3—figure supplement 1
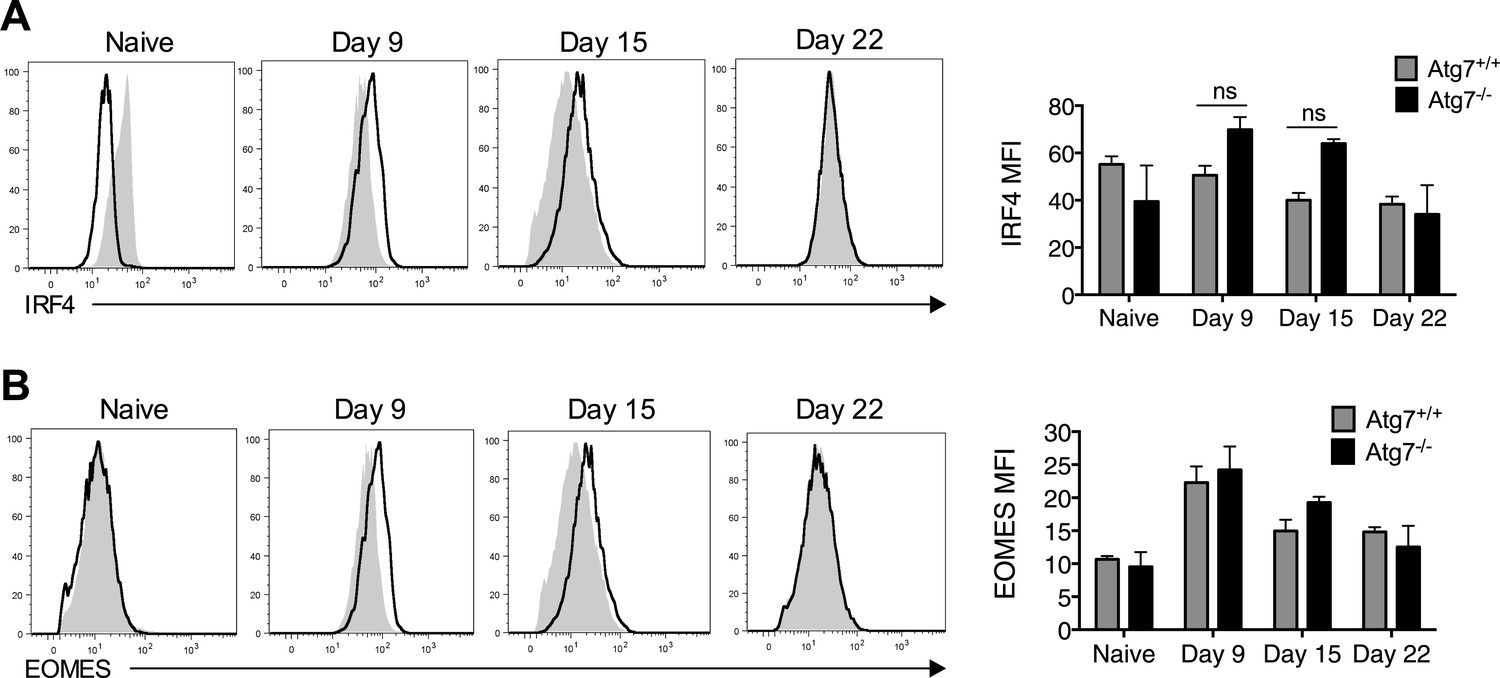
Failure of to form memory CD8+ T cells in T-Atg7−/− mice is not the result of defective IRF4 or EOMES expression.
(A) IRF4 expression in Atg7−/− and Atg7+/+ splenic m45-specific CD8+ T cells on day 9, 15, and 22 post-infection. As a control, IRF4 was also measured in CD44lo CD8+ T cells from unimmunized mice (naïve). Quantification shows IRF4 mean fluorescence intensity from gated m45-tetramer+ CD8+ T cells and CD44lo CD8+ T cells (naïve). Statistics—Student's t test (n = 4–5). (B) EOMES expression in Atg7−/− and Atg7+/+ antigen-specific CD8+ T cells. WT and T-Atg7−/− mice were immunized with MCMV and EOMES expression was measured in m45-specific CD8+ T cells on day 9, 15, and 22. As a control, EOMES was also measured in CD44lo CD8+ T cells from unimmunized mice (naïve). Quantification shows EOMES mean fluorescence intensity on gated m45-tetramer+ CD8+ T cells and CD44lo CD8+ T cells (naïve) (n = 4–5).
Figure 4 with 1 supplement
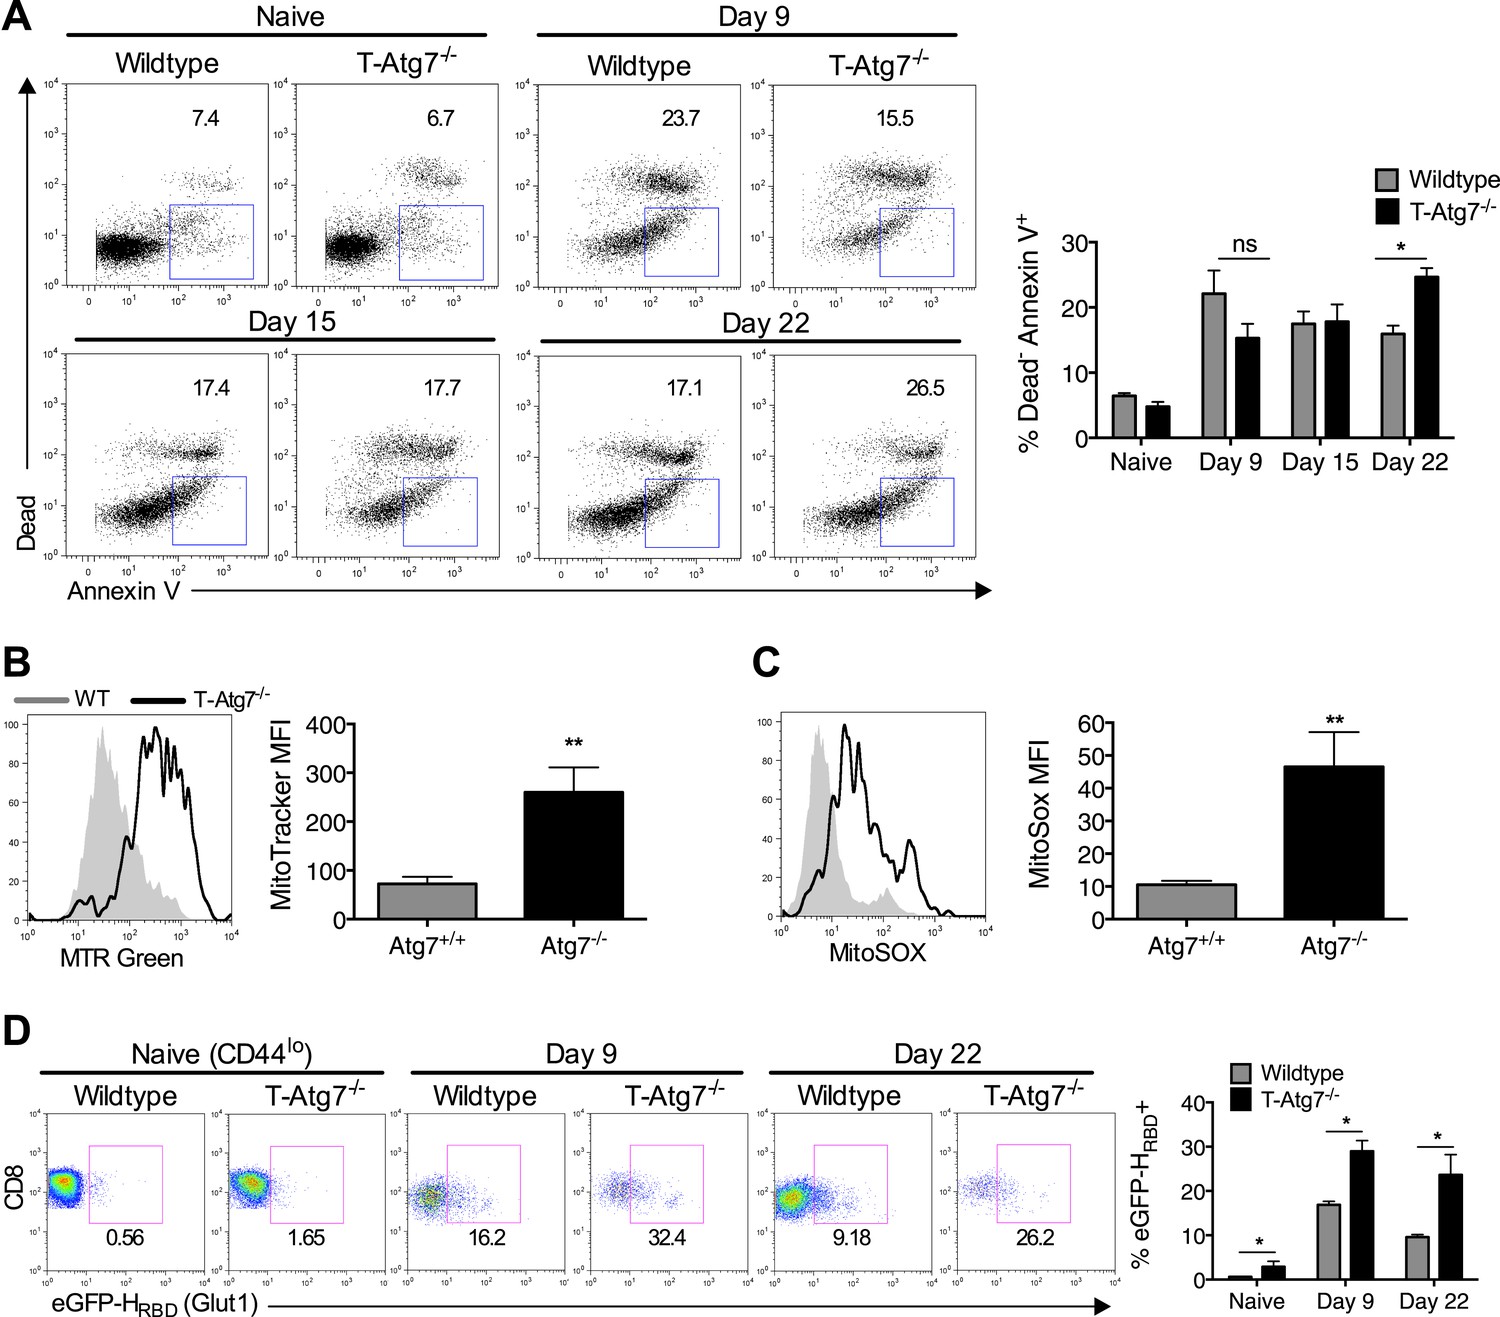
Atg7−/− memory CD8+ T cells show increased mitochondrial content, reactive oxygen species, apoptosis and fail to down-regulate GLUT-1.
(A) The spleens of unimmunized and MCMV-infected mice were stained with the apoptotic marker Annexin V and a dead cell dye that stains cells with disrupted membranes on the time points indicated. Apoptotic cells were defined as dead cell dye-negative Annexin V+. Dot plots are gated on either CD44lo CD8+ T cells (naïve) or m45-tetramer+ CD8+ T cells. *p < 0.05, by Mann–Whitney U-test (n = 4–5). (B) Mitochondrial volume by MitoTracker Green in Tetramer+ CD8+ T cells from WT and T-Atg7−/− mice. Spleens from MCMV-immunized mice were stained with MitoTracker Green on day 15 post-infection. Quantification depicts mean fluorescence intensity on m45-tetramer+ CD8+ T cells and is representative of three independent experiments. **p < 0.01, Student t test (n = 4–5). (C) Mitochondrial superoxide production in Tetramer+ CD8+ T cells by MitoSox. Spleens from MCMV-immunized WT and T-Atg7−/− mice were stained with MitoSox Red on day 15 post-infection and analyzed by flow cytometry. Bar graph depicts mean fluorescence intensity on m45-tetramer+ CD8+ T cells and is representative of three independent experiments. **p < 0.01, by Student t test (n = 4–5). (D) GLUT-1 expression. Tetramer+ CD8+ T cells from MCMV-immunized WT and T-Atg7−/− mice were stained with the GFP-tagged HTLV receptor binding domain (eGFP-HRBD), that binds GLUT-1, at the time points indicated. As a control, GLUT-1 was also measured on CD44lo CD8+ T cells from unimmunized mice (naïve). Bar graph shows the percentage of cells expressing GLUT-1. *p < 0.05, as determined by Mann–Whitney U-test (n = 4–5). All values are mean ± s.e.m.
Figure 4—figure supplement 1
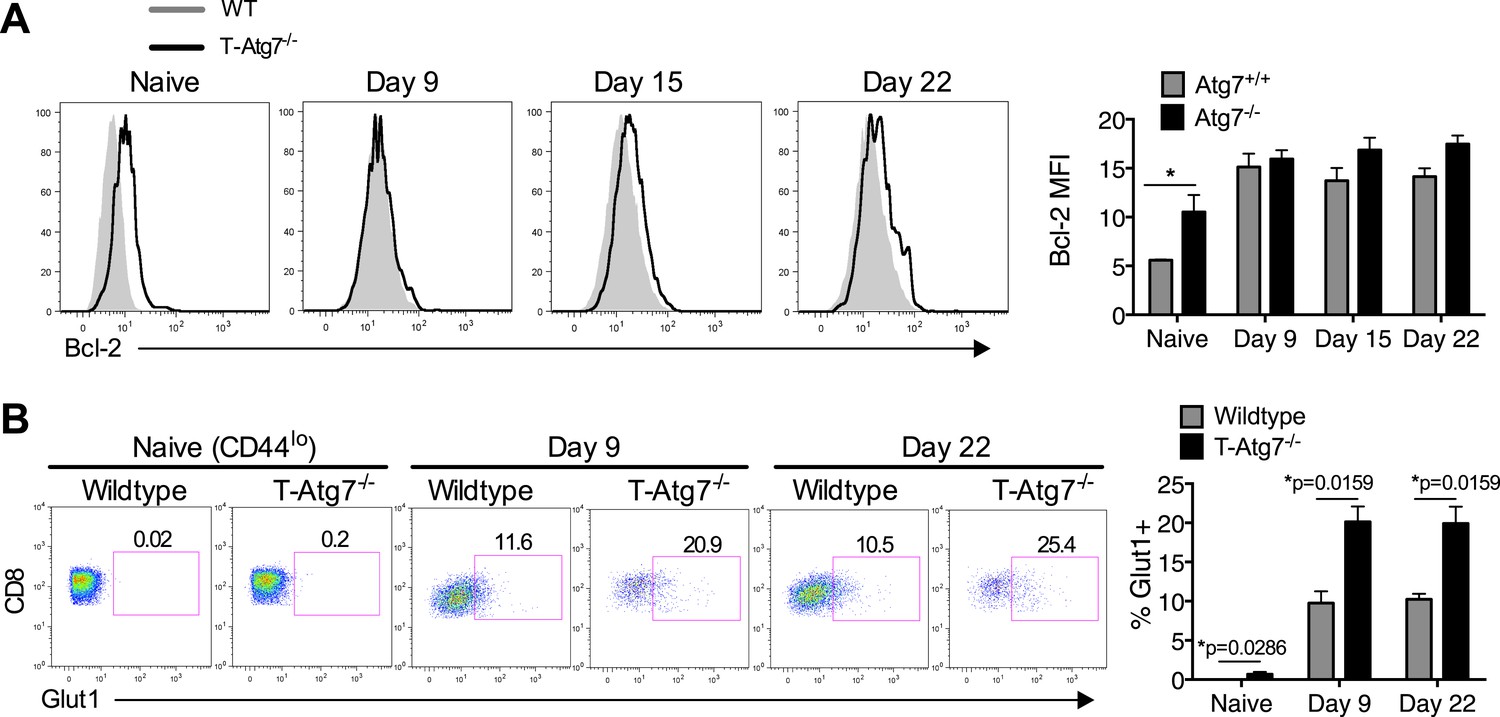
Normal Bcl-2 levels and altered GLUT-1 expression on antigen-specific Atg7−/− CD8+ T cells.
(A) MCMV-immunized WT and T-Atg7−/− mice were assessed for Bcl-2 expression in splenic m45-specific CD8+ T cells on day 9 and 22 post-infection. As a control, Bcl-2 was measured in CD44lo CD8+ T cells from unimmunized mice (naïve). Quantification shows Bcl-2 mean fluorescence intensity. Statistics—Student's t test (n = 4–5). (B) GLUT-1 antibody staining on day 9 and day 22 post-infection in MCMV-immunized WT and T-Atg7−/− mice. As a control, GLUT-1 was assessed in CD44lo CD8+ T cells from unimmunized mice (naïve). Bar graphs indicate the frequency of m45-tetramer+ CD8+ T cells and CD44lo CD8+ T cells (naïve) that express GLUT-1. Statistics—Mann Whitney U-test (n = 4–5).
Figure 5 with 1 supplement
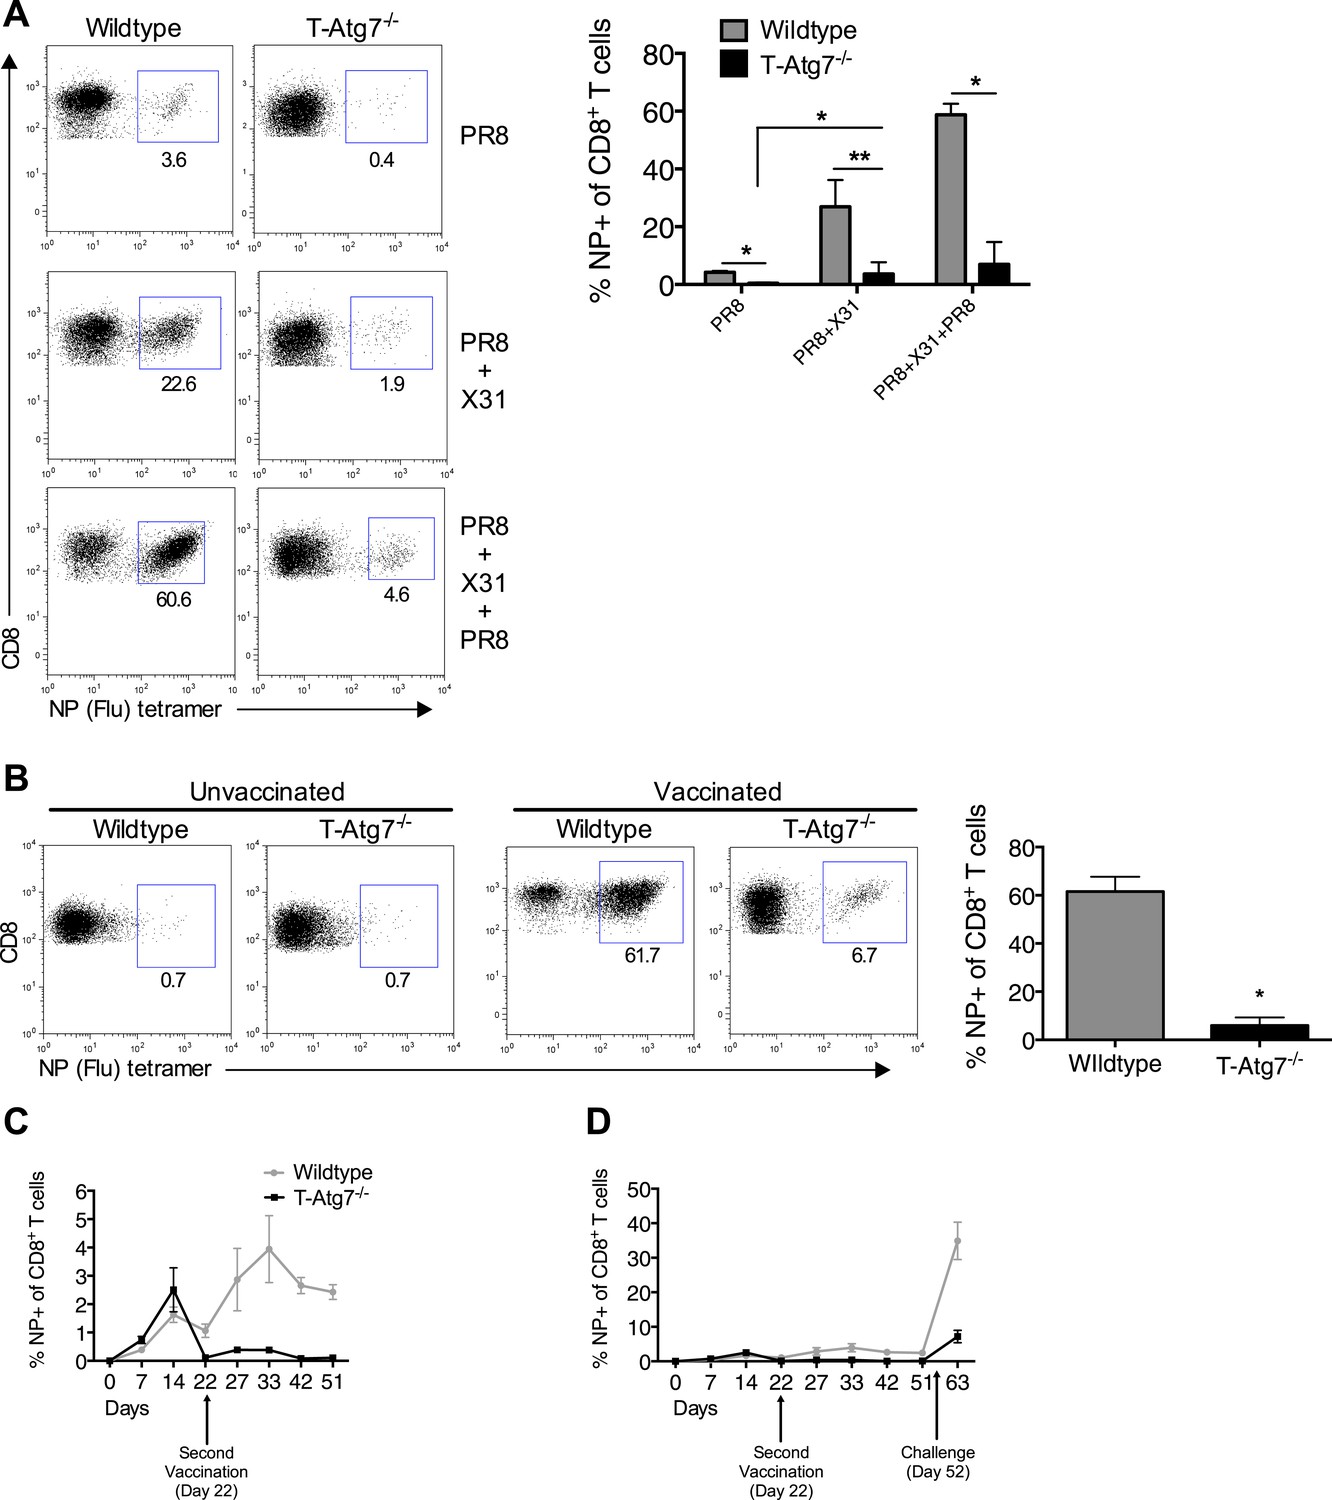
Atg7−/− memory CD8+ T cells mount a significantly reduced recall response to secondary immunization.
(A) Recall responses to influenza. Here, WT and T-Atg7−/− mice were split into three groups. In one, mice were immunized with 0.00032 HAU PR8 influenza and the NP-specific CD8+ T cell response was measured in lungs on day 24 (PR8, n = 4). In another group, mice were immunized with 0.00032 HAU PR8 influenza followed by 0.32 HAU X31 influenza challenge on day 24. The recall response to this challenge was measured on day 5 post–challenge using NP-specific tetramers (PR8+X31, n = 6). In the third group, mice were immunized with 0.00032 HAU PR8 influenza, followed by 0.32 HAU X31 on day 24, and 30 days later immunized for a third time with 32 HAU PR8. The recall response to this third infection was measured in the lungs on day 5 post–challenge by tetramer (PR8 + X31 + PR8, n = 4). Quantification shows frequency of CD8+ T cells that are NP-specific and are representative of two independent experiments. *p < 0.05, **p < 0.01, by Mann–Whitney U-test. (B) The Atg7−/− CD8+ T cell response to influenza vaccination. WT and T-Atg7−/− mice were vaccinated twice, 22 days apart with 32 HAU of the live attenuated H1N1 vaccine, S-Flu. 30 days after the last vaccination, mice were challenged with 32 HAU X31 influenza. The CD8+ T cell response to NP was measured in lungs on day 23 post–challenge by tetramer. As a control, unvaccinated mice were challenged with 32 HAU X31 and culled on day 4 due to weight loss and morbidity. Quantification indicates the percentage of CD8+ T cells in the lung that are specific for NP on day 23 post–challenge. Example dot plots are shown. Data are representative of two independent experiments. *p < 0.05 by Mann–Whitney U-test (n = 4–5). (C) Atg7−/− CD8+ T cell kinetics to influenza vaccination. WT and T-Atg7−/− mice were vaccinated with S-Flu twice, 22 days apart, and the CD8+ T cell response to NP was tracked over time in blood by tetramer (n = 4–6). (D) Atg7−/− CD8+ T cell kinetics to influenza vaccination and challenge. WT and T-Atg7−/− mice were vaccinated as described in (C). 30 days after the last vaccination, mice were challenged with 32 HAU X31 influenza. Using NP-specific tetramers, the CD8+ T cell response to the vaccine regime and the challenge was tracked in the blood over time (n = 4–6). All values are mean ± s.e.m.
Figure 5—figure supplement 1
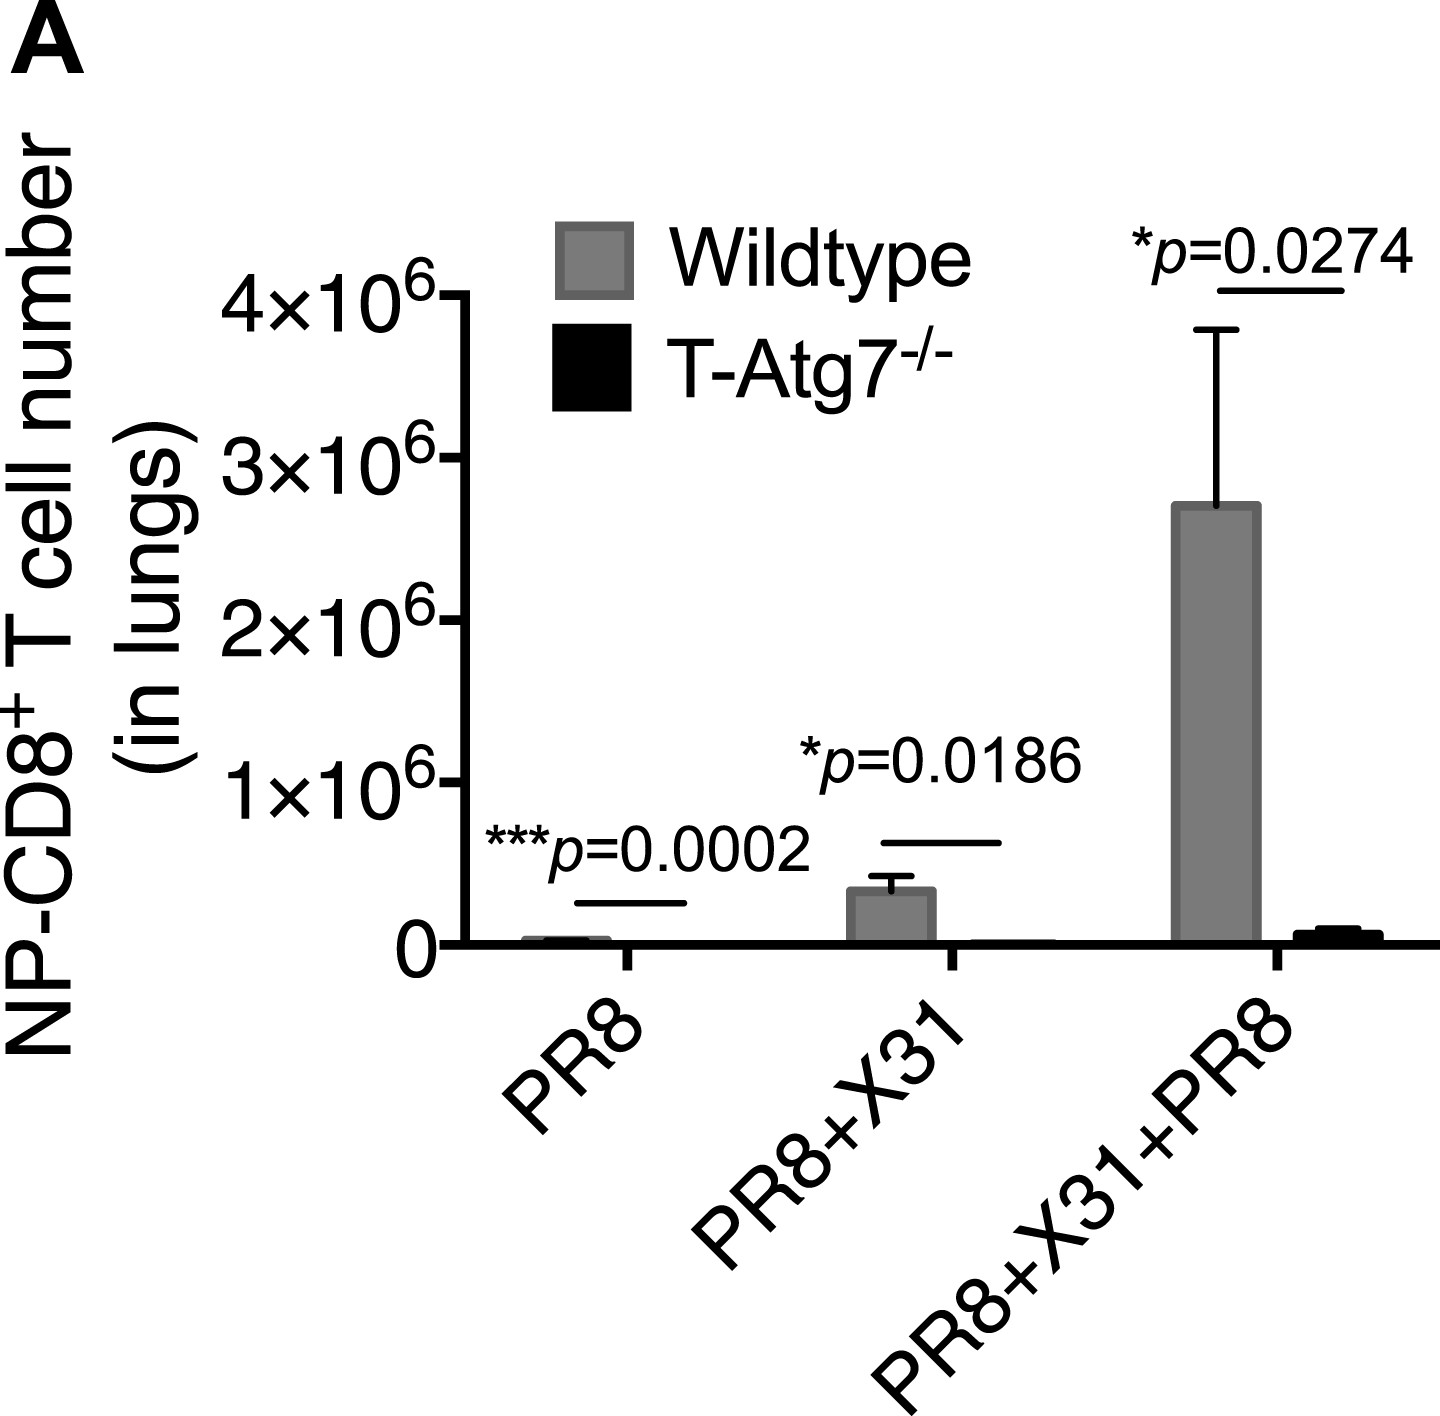
Atg7−/− CD8+ T cells fail to mount robust re-call responses to secondary infection.
(A) Recall CD8+ T cell responses in WT and T-Atg7−/− mice. Mice were immunized once with PR8 influenza (n = 4); twice with PR8+X31 influenza (n = 6); or three times with PR8 + X31 + PR8 (n = 4). Absolute counts of CD8+ NP-tetramer+ T cells were determined in the lungs at either day 24 (PR8), or day 5 post–challenge (PR8 + X31 & PR8 + X31 + PR8). All values are mean ± s.e.m.
Figure 6 with 1 supplement
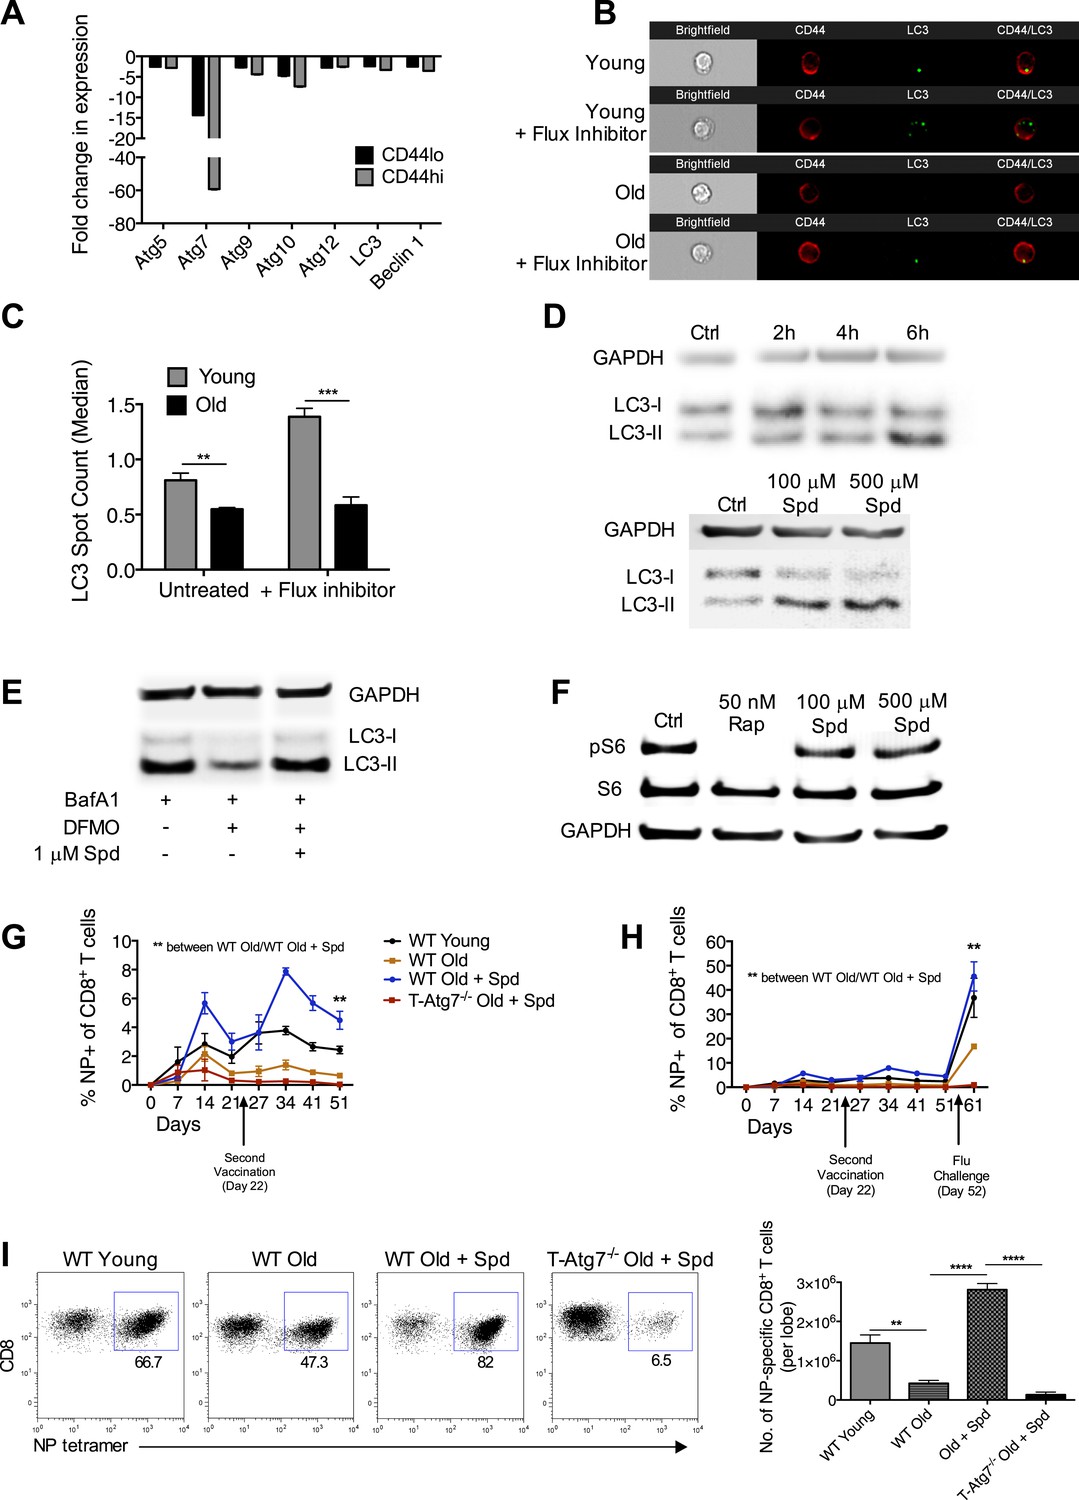
Boosting autophagy restores CD8+ T cell responses to vaccination in elderly mice.
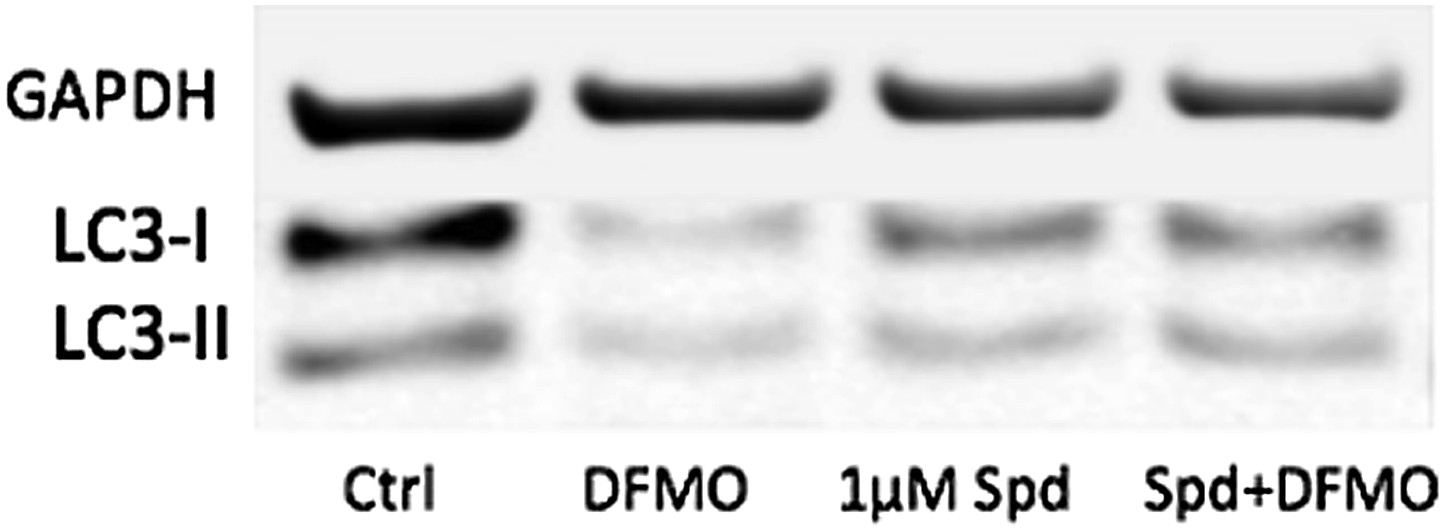
(A) Autophagy gene expression in CD8+ T cells from young and elderly mice. CD44lo and CD44hi CD8+ T cells were purified from 6 week old and 2 year old mice using fluorescent activated cell sorting. mRNA was extracted and the expression of essential autophagy genes was measured by q-PCR. Shown is the fold change in expression in CD8+ T cells from old mice relative to expression in young mice (normalized to gapdh and hprt). (B) LC3 Spot count in CD8+ T cells from young and old mice. Splenic CD8+ T cells from 8 week old and 2 year old mice were treated with an autophagy flux inhibitor for 2 hr, as a control cells were left untreated. LC3 spot count was determined on CD8+ CD44hi T cells using ImageStream. Representative images are shown (×60 magnification). **p = 0.0082, ***p = 0.0004 as determined by Student t-test (n = 4–5). (C) Quantification for images shown in (B). (D) Human T cell line Jurkat was incubated with 100 µM spermidine for 2, 4, or 6 hr or left untreated followed by whole protein extraction for LC3 Western Blot (upper panel). In the lower panel, Jurkat cells were incubated either with no spermidine (control), 100 µM, or 500 µM spermidine for 6 hr and then Western blotted for LC3. GAPDH was used as loading control for all Western blots. (E) Jurkat cells were treated with 1 mM DFMO or 1 mM DFMO with 1 µM spermidine for 48 hr or left untreated (control). In the final 6 hr of incubation, all cells were treated with 10 nM bafilomycin A1 and LC3-I to LC3-II conversion was assessed by Western Blot. (F) Jurkat cells were treated with 50 nM rapamycin, 100 µM or 500 µM spermidine for 6 hr followed by detection of phosphorylated S6 (Ser235/236) by Western Blot. As a control, cells were left untreated. (G) CD8+ T cell kinetics to influenza vaccination in aged mice in the presence of spermidine. 8-week-old young WT and 23 month old WT and T-Atg7−/− mice were vaccinated 22 days apart with S-Flu. 21 days prior to the first vaccination, aged WT and T-Atg7−/− mice were administered spermidine in the drinking water at a concentration of 5 mM through to the experimental endpoint. As a control, 23 month old WT mice were administered water alone. The CD8+ T cell response to NP was tracked over time in the blood by tetramer (n = 4–5). Y-axis depicts the frequency of CD8+ T cells that are specific for NP. **p < 0.01 by Mann–Whitney U-test. (H) CD8+ T cell kinetics to influenza vaccination and challenge in aged mice in the presence of spermidine. 8-week-old young WT and T-Atg7−/− and 23 month old WT and T-Atg7−/− mice were vaccinated as described in (G). 30 days after the last vaccination, mice were challenged with 32 HAU X31 and the CD8+ T cell response to challenge was measured 9 days later in the lungs by tetramer. From 21 days prior to the first vaccination, through to the experimental end point, aged WT and T-Atg7−/− mice were administered spermidine as before. Y-axis indicated the percentage of CD8+ T cells that are specific for NP (n = 4–5). (I) CD8+ T cell response to influenza challenge in vaccinated aged mice in the presence of spermidine. 9 days post–challenge, lungs were harvested and the NP-specific CD8+ T cell response to influenza challenge was measured by tetramer. Example dot plots are gated on CD8+ T cells. Bar chart shows absolute counts of NP-specific CD8+ T cells in the lung per lobe. **p < 0.01, ****p < 0.0001 by Student t test (n = 4–5). All values are mean ± s.e.m.
Figure 6—figure supplement 1
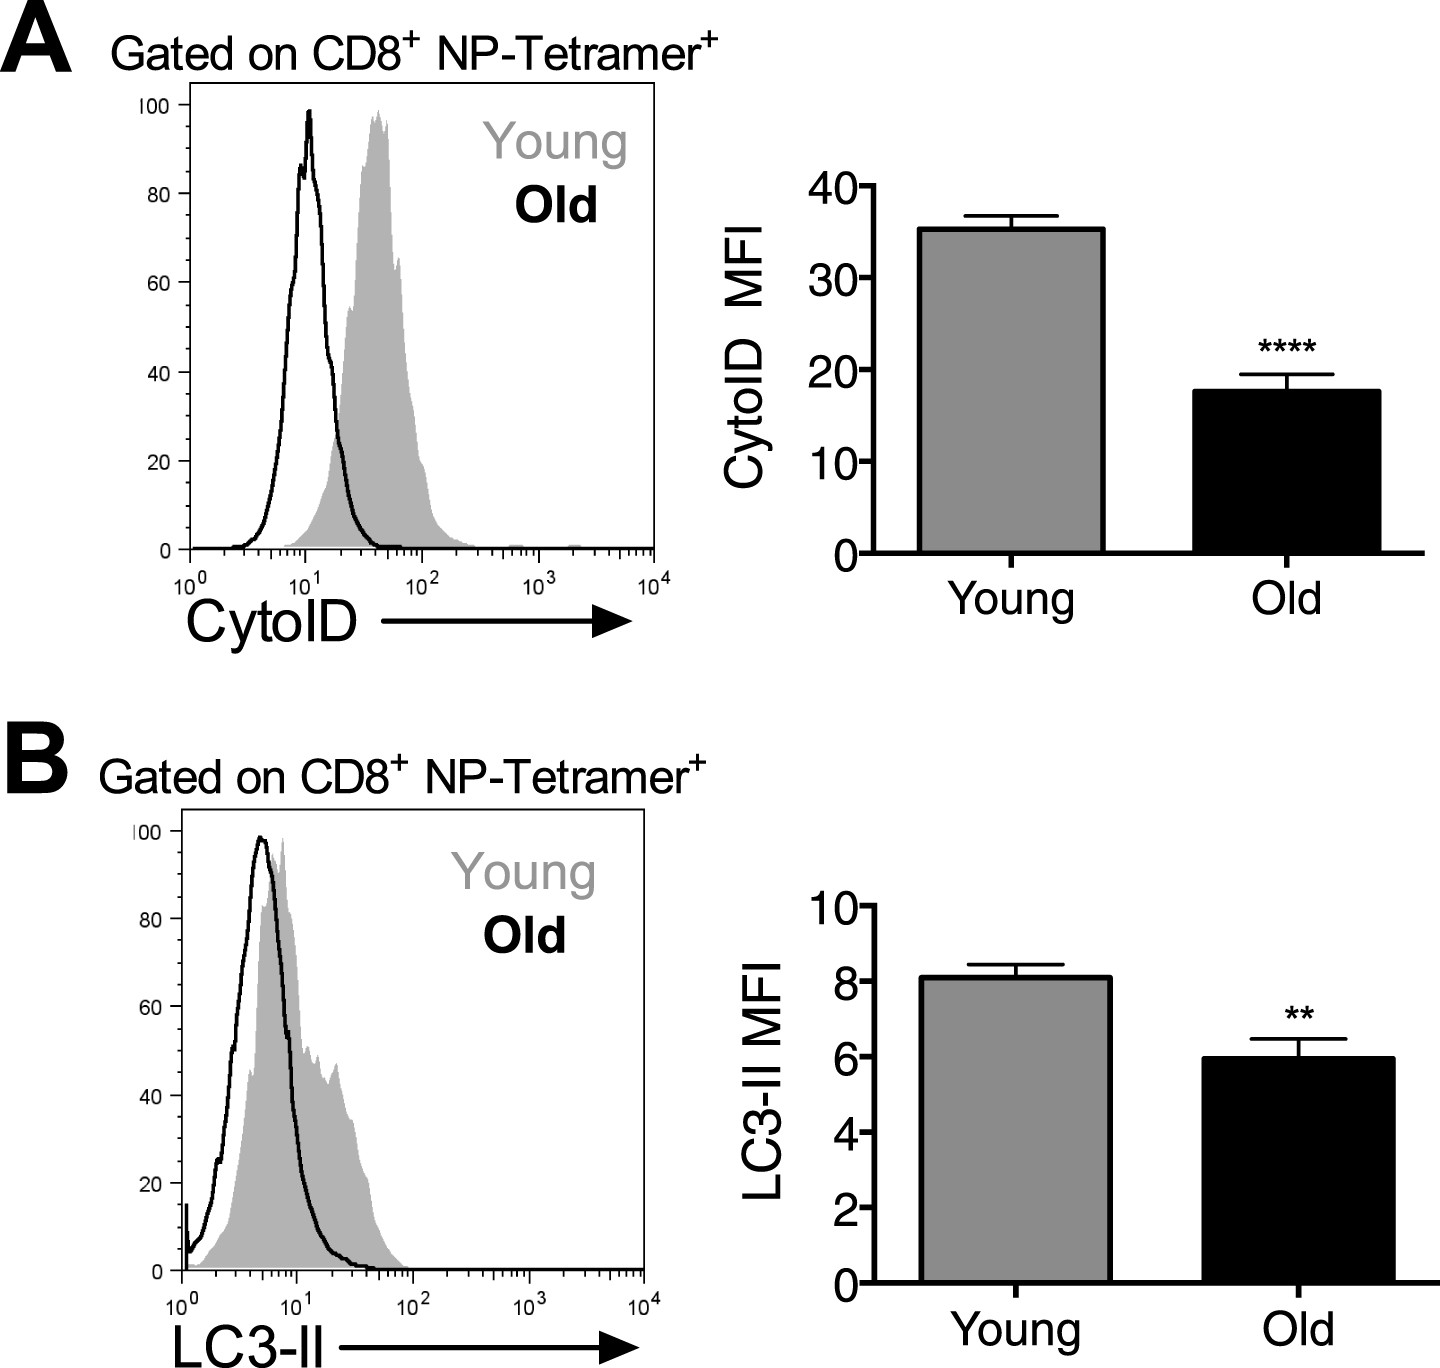
Autophagy levels are significantly diminished in antigen-specific CD8+ T cells from aged mice.
Autophagy levels by CytoID (A) and LC3-II staining (B) in antigen-specific CD8+ T cells from young and old mice. 8-week-old and 2 year old mice were immunized with PR8 influenza. On day 10 post-infection lungs were harvested and stained with CytoID or for LC3-II to assess autophagy levels in NP-Tetramer+ CD8+ T cells by flow cytometry. (A) ****p < 0.0001 (n = 7). (B) **p = 0.0056, (n = 7).
Author response image 1
Download links
A two-part list of links to download the article, or parts of the article, in various formats.
Downloads (link to download the article as PDF)
Open citations (links to open the citations from this article in various online reference manager services)
Cite this article (links to download the citations from this article in formats compatible with various reference manager tools)
Autophagy is a critical regulator of memory CD8+ T cell formation
eLife 3:e03706.
https://doi.org/10.7554/eLife.03706


