Importin-β modulates the permeability of the nuclear pore complex in a Ran-dependent manner
- University College London and Birkbeck College, United Kingdom
- University of California, Berkeley, United States
- Stanford University, United States
- Eidgenössische Technische Hochschule Zürich, Switzerland
- École polytechnique fédérale de Lausanne, Switzerland
- Howard Hughes Medical Institute, University of California, Berkeley, United States
- Lawrence Berkeley National Laboratory, United States
Figures
Figure 1 with 3 supplements
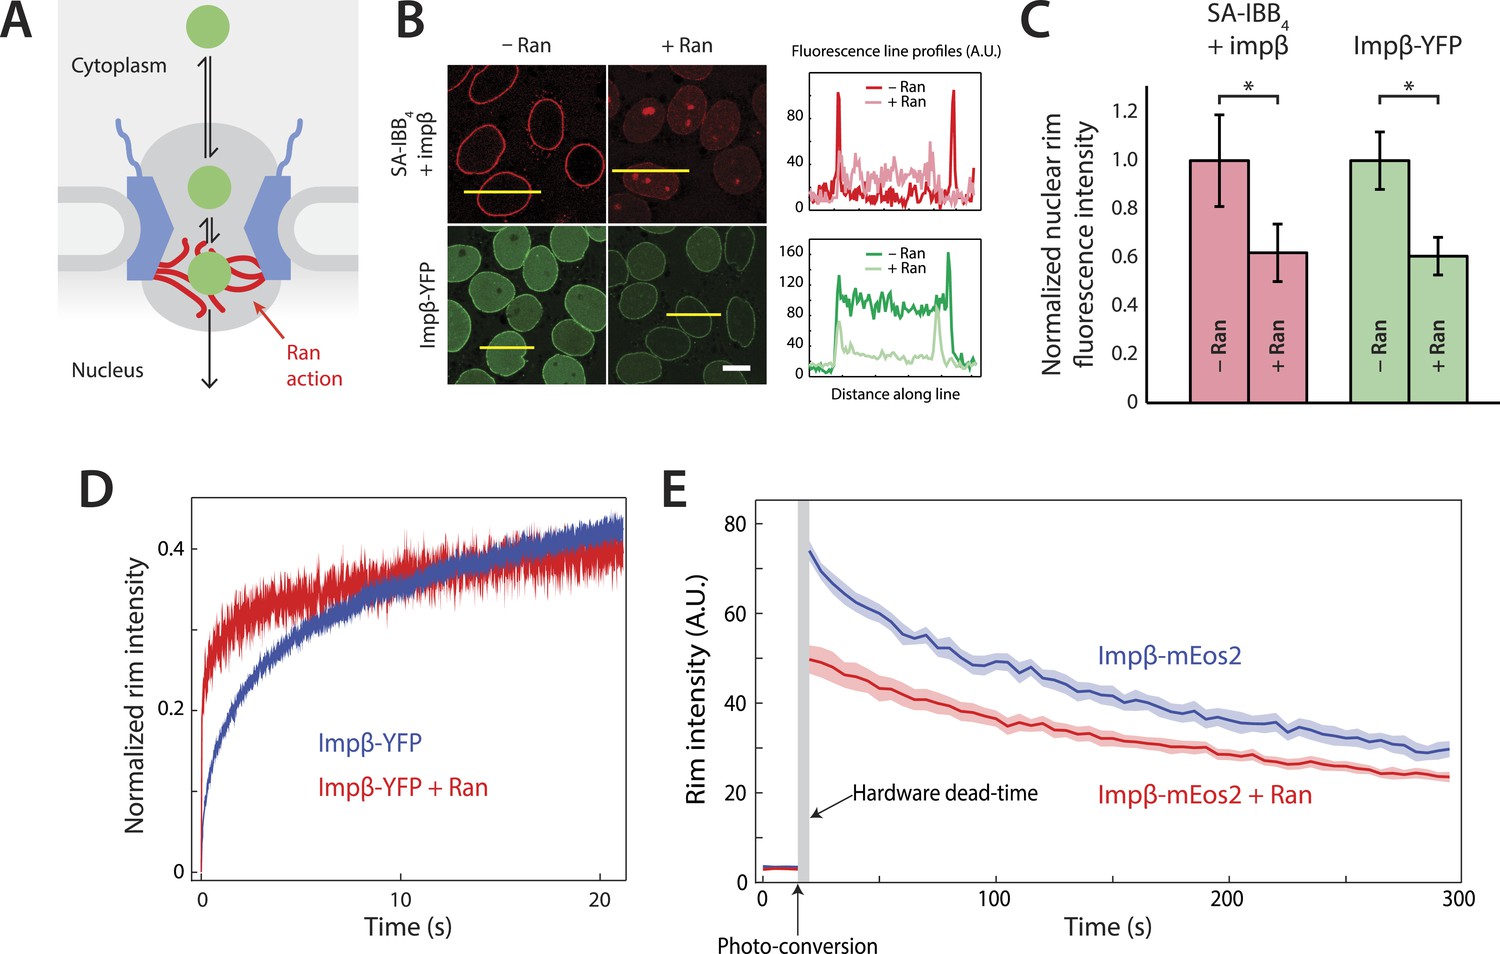
Effect of Ran on impβ binding affinity and turnover at the NPC.
(A) Schematic of the NPC showing the location of the Ran-dependent exit step for cargo-receptor complexes. (B) Representative images of cargo-receptor complexes and impβ-YFP stalled within the pore and forming bright nuclear rims in the absence of Ran. Fluorescence intensity profiles are plotted for the yellow lines showing the nuclear rim intensity drop when Ran is added. Scale bar (white): 10 μm. (C) Nuclear rim fluorescence intensities of nuclei in (B) normalized to −Ran condition. Error bars represent the standard deviation about the mean. Asterisks (*) indicate a significant p < 10–20 using the Mann–Whitney U test (N ≥ 97 for all conditions). (D) Representative FRAP recovery curves of impβ-YFP at the nuclear envelope showing rapid initial recovery of impβ in the presence of Ran with evidence of a second, slower pool of impβ. Recovery in the absence of Ran (blue trace) is considerably slower. (E) Photo-conversion based characterization of the slowly dissociating impβ pool. Ran reduces the initial fluorescence signal but does not clear all impβ's from the NPC as shown by the residual fluorescence at the nuclear rim lasting hundreds of seconds. Shaded regions indicate the standard error of the mean (N = 20 for both conditions).
Figure 1—figure supplement 1
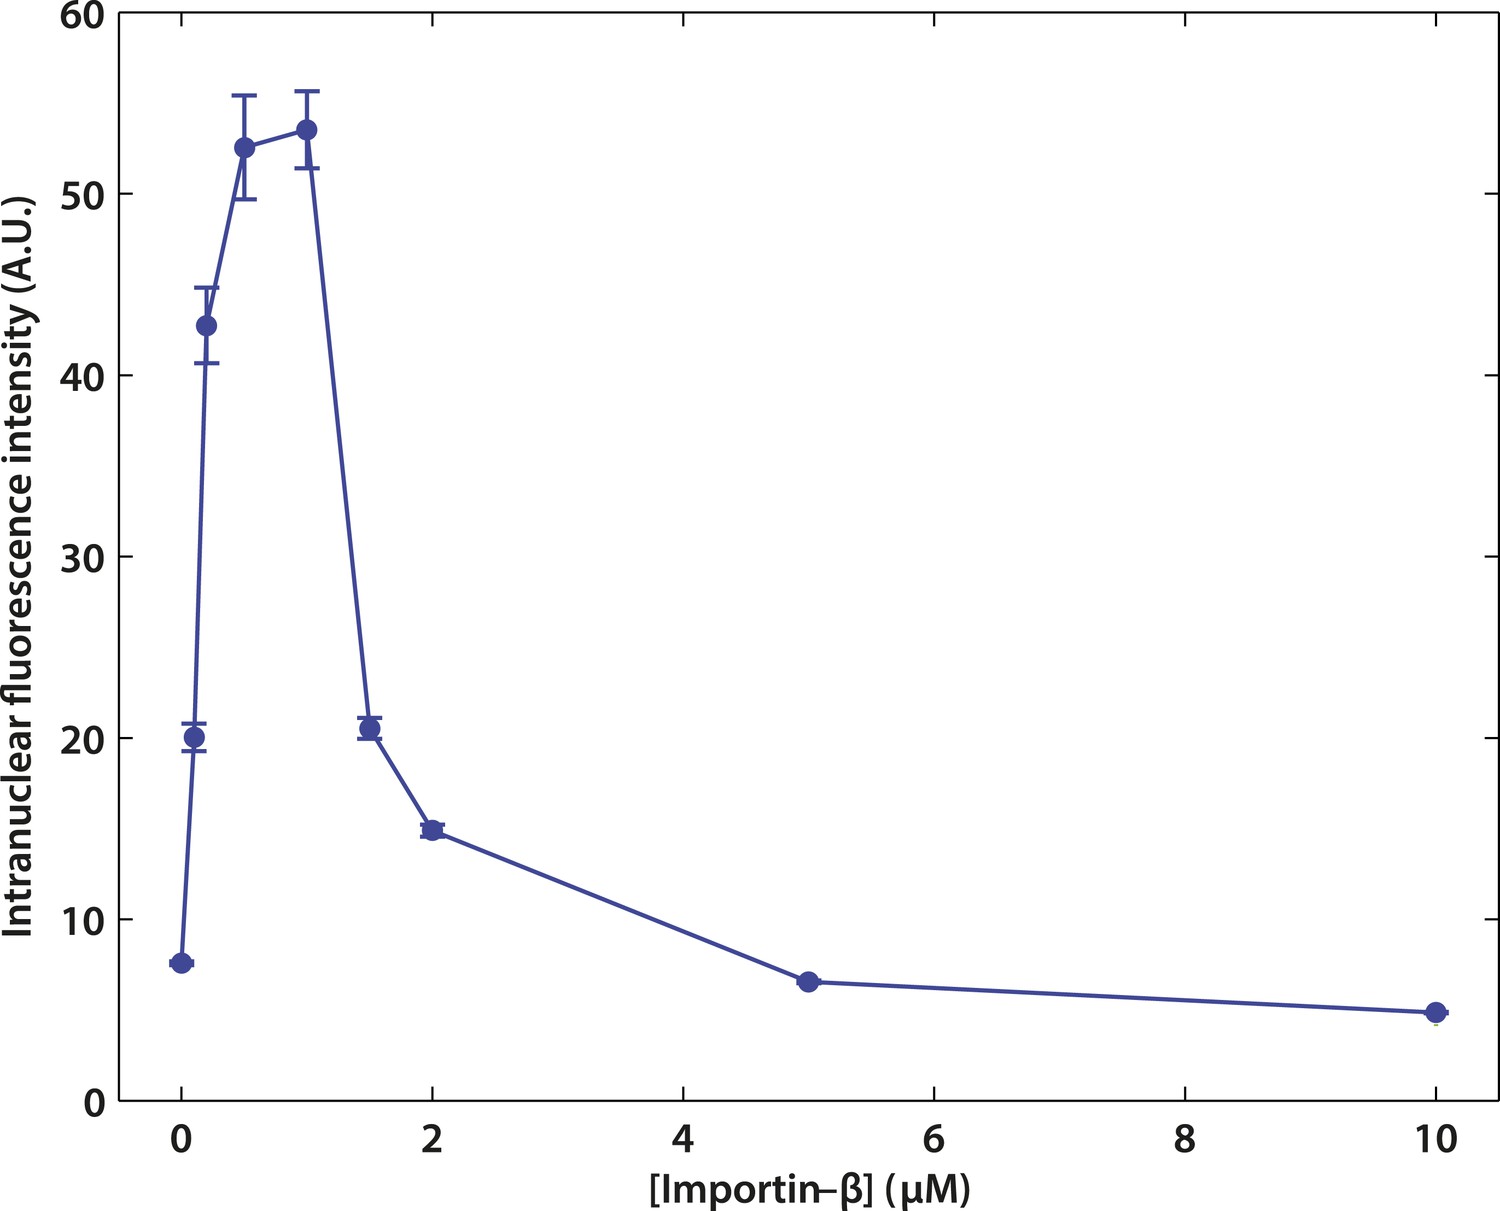
Effect of impβ concentration on active transport.
The optimum concentration was ∼1 μM. At low impβ concentrations, cargo•impβ complex formation is limited by impβ availability, leading to low import levels. At high impβ concentrations, competition for NPC binding sites between free impβ and the cargo•impβ complexes leads to reduced import efficiency.
Figure 1—figure supplement 2
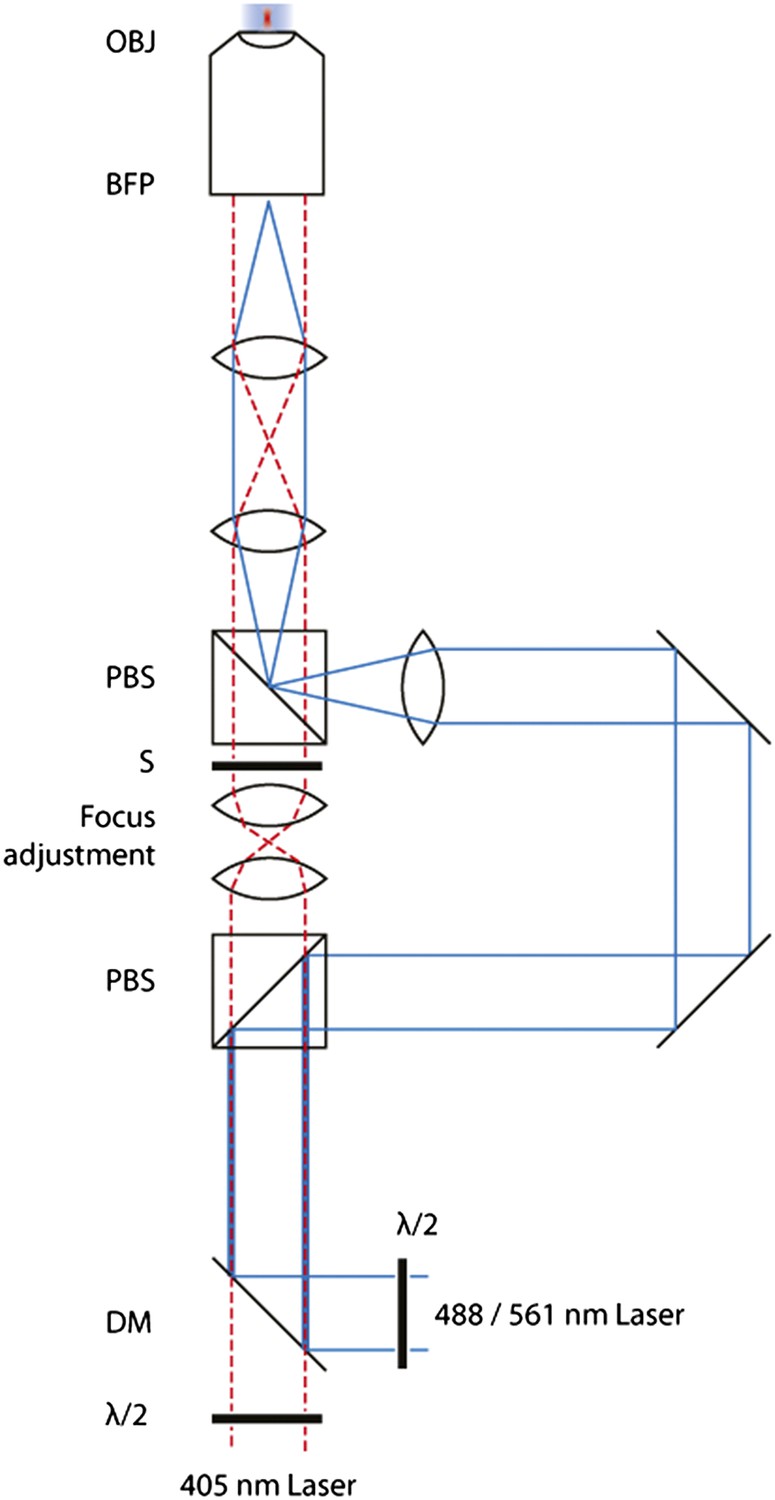
Schematic of the FRAP microscope.
Lasers are combined and passed through a Polarizing Beam Splitter (PBS) whereupon the polarized light is split into two paths. By adjusting the half-wave plates, one can adjust the amount of light through either of the paths. A pair of identical plano-convex lenses (f1 = f2) allows the adjustment of the focus of the diffraction-limited spot along the optical axis. A shutter in this path controls temporal activation of the spot.
Figure 1—figure supplement 3
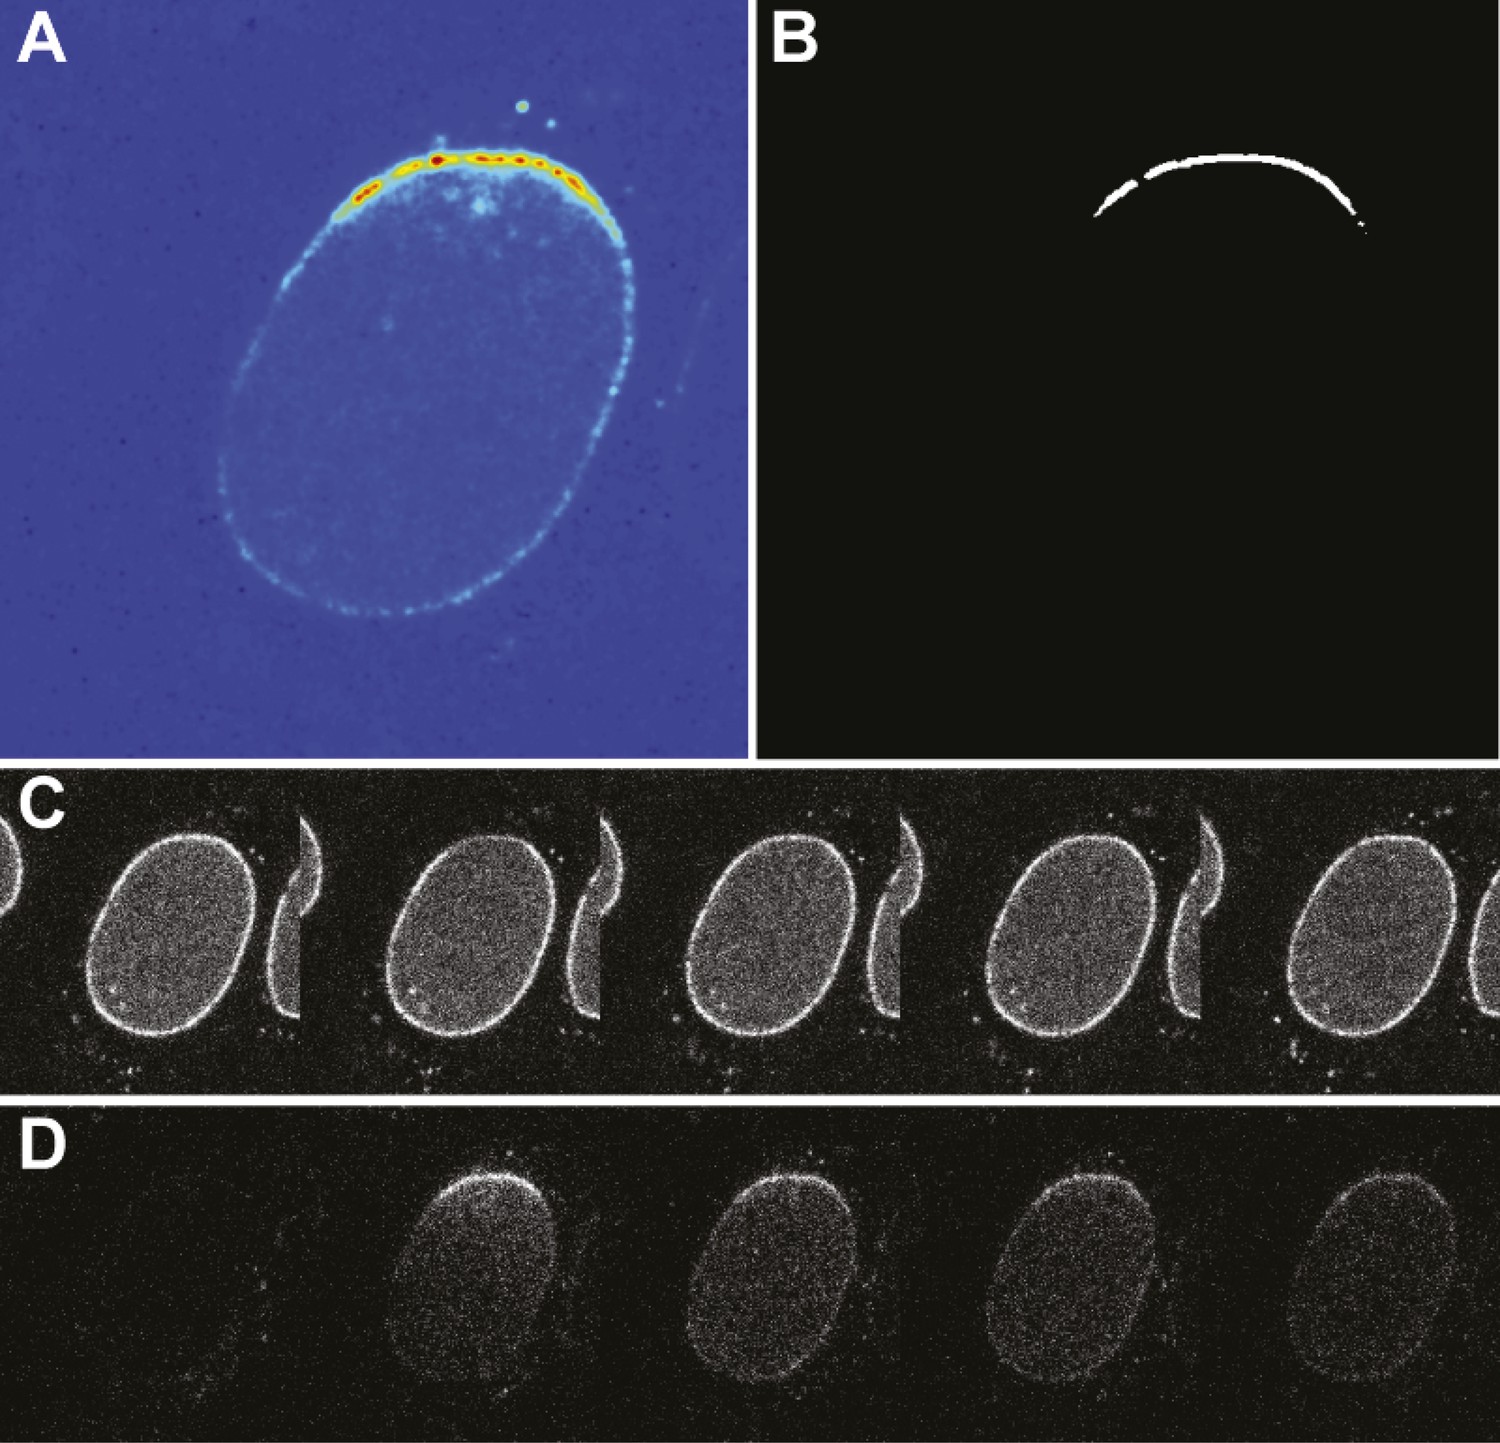
Photoconversion experiment details.
(A) False-color image of the photoswitched region within a single nucleus. (B) Mask generated for photoswitched region of the nuclear envelope. (C) Timecourse of the green channel at time points: pre-photoswitch, 0, 50, 100, and 300 s. (D) Corresponding timecourse of photoswitched molecules in the red channel.
Figure 2 with 1 supplement

Super-resolution imaging of Alexa647-labeled impβ in digitonin-permeabilized HeLa cells.
(A) Simulated widefield impβ localization at the equatorial plane of the nucleus and (B) corresponding dSTORM image. Mean localization precision is 12 nm. (C and D) Corresponding widefield and dSTORM images taken at the basal surface of the nucleus showing characteristic punctate NPC structures. (E) Zoom of the dSTORM image in (B), showing discrete NPC structures (examples, blue arrows). Putative NPC structures (green) markers are automatically identified using the linearized envelope localization histogram (shown in white, Supplementary methods). (F) Method for putative NPC structure isolation and alignment. Peaks in the envelope histogram (black line) are identified as potential locations for putative NPC structures (black circles). Localizations falling into a window (width, w, length, l) centred at these locations (p) are cropped out and rotated to a common frame, c, by the angle θ, maintaining the cytoplasm-nucleus vector, n.
Figure 2—figure supplement 1
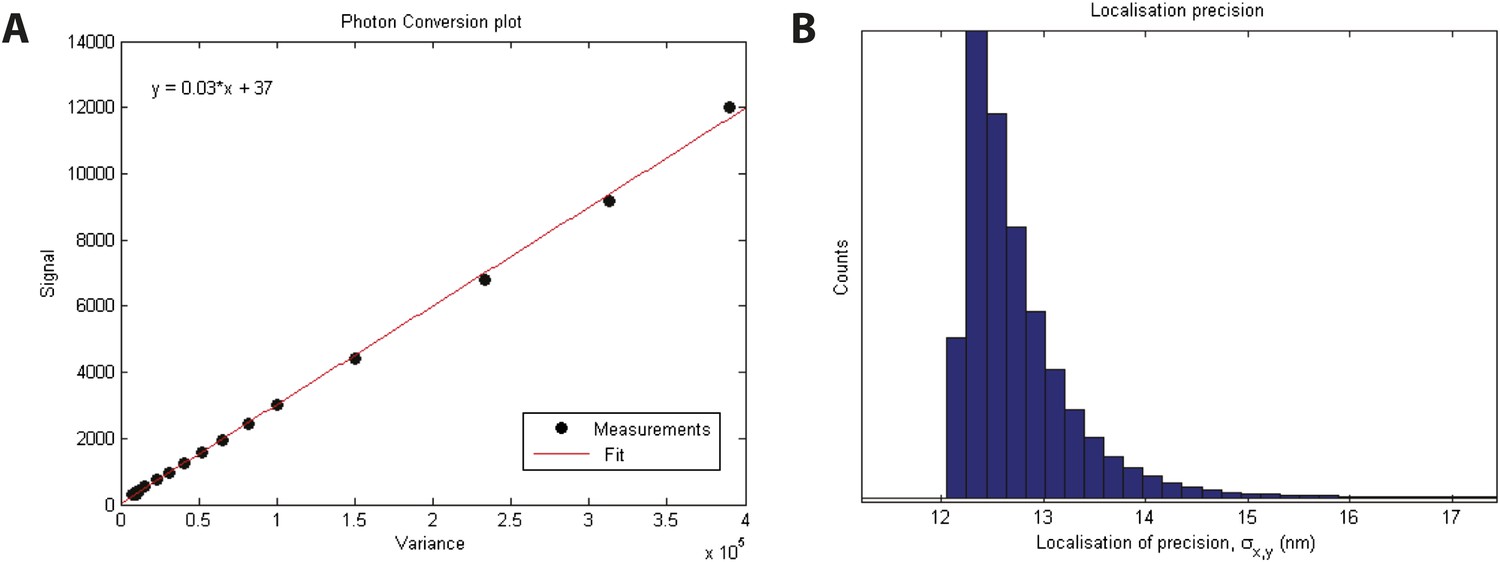
Localization precision.
(A) Calibration of EMCCD camera for photon conversion factor. (B) Histogram of calculated localization precisions from dSTORM image data. The median value of localization precision (positional error) is 12 nm.
Figure 3 with 4 supplements
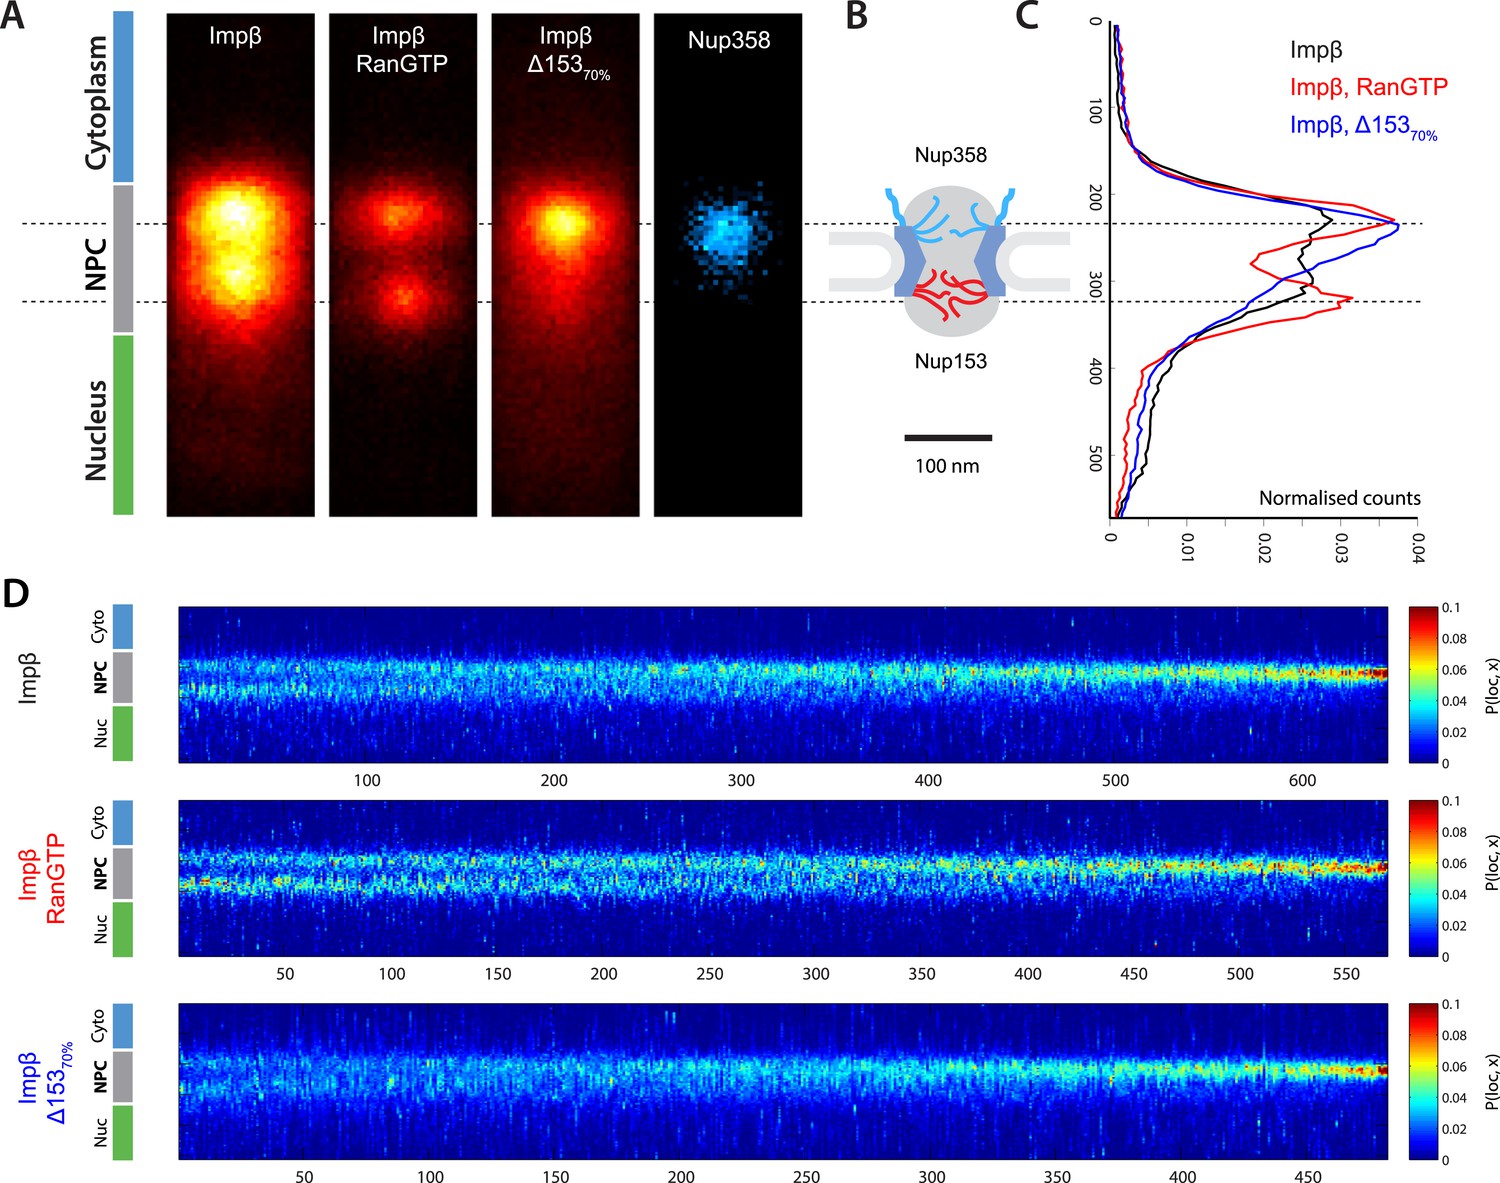
Localization microscopy of impβ spatial organisation and its Ran-dependence.
(A) 2D histograms of impβ density in the NPC under different conditions. To generate these panels, we sum all localizations for a given condition and divide by the number of NPCs per condition. Figure 3—figure supplement 1 shows examples of the raw localization images for each of the conditions. Anti-Nup358 antibody was localized using a second dye pair, as shown in Figure 3—figure supplement 2. Histograms of the number of localizations per NPC, for each condition are shown in Figure 3—figure supplement 3. (B) Schematic of the NPC showing the tethering locations of Nup358 and Nup153. (C) Probability density functions (PDF) of impβ localizations, showing the relative redistribution of impβ localizations in the presence of RanGTP and with Nup153 knockdowns. (D) 'Waterfall' plots showing PDF projections of NPC structures in each of the conditions tested. Each column of the plot represents a single NPC structure and is arranged from left to right according to the ratio of cytoplasmic to nuclear localizations.
Figure 3—figure supplement 1
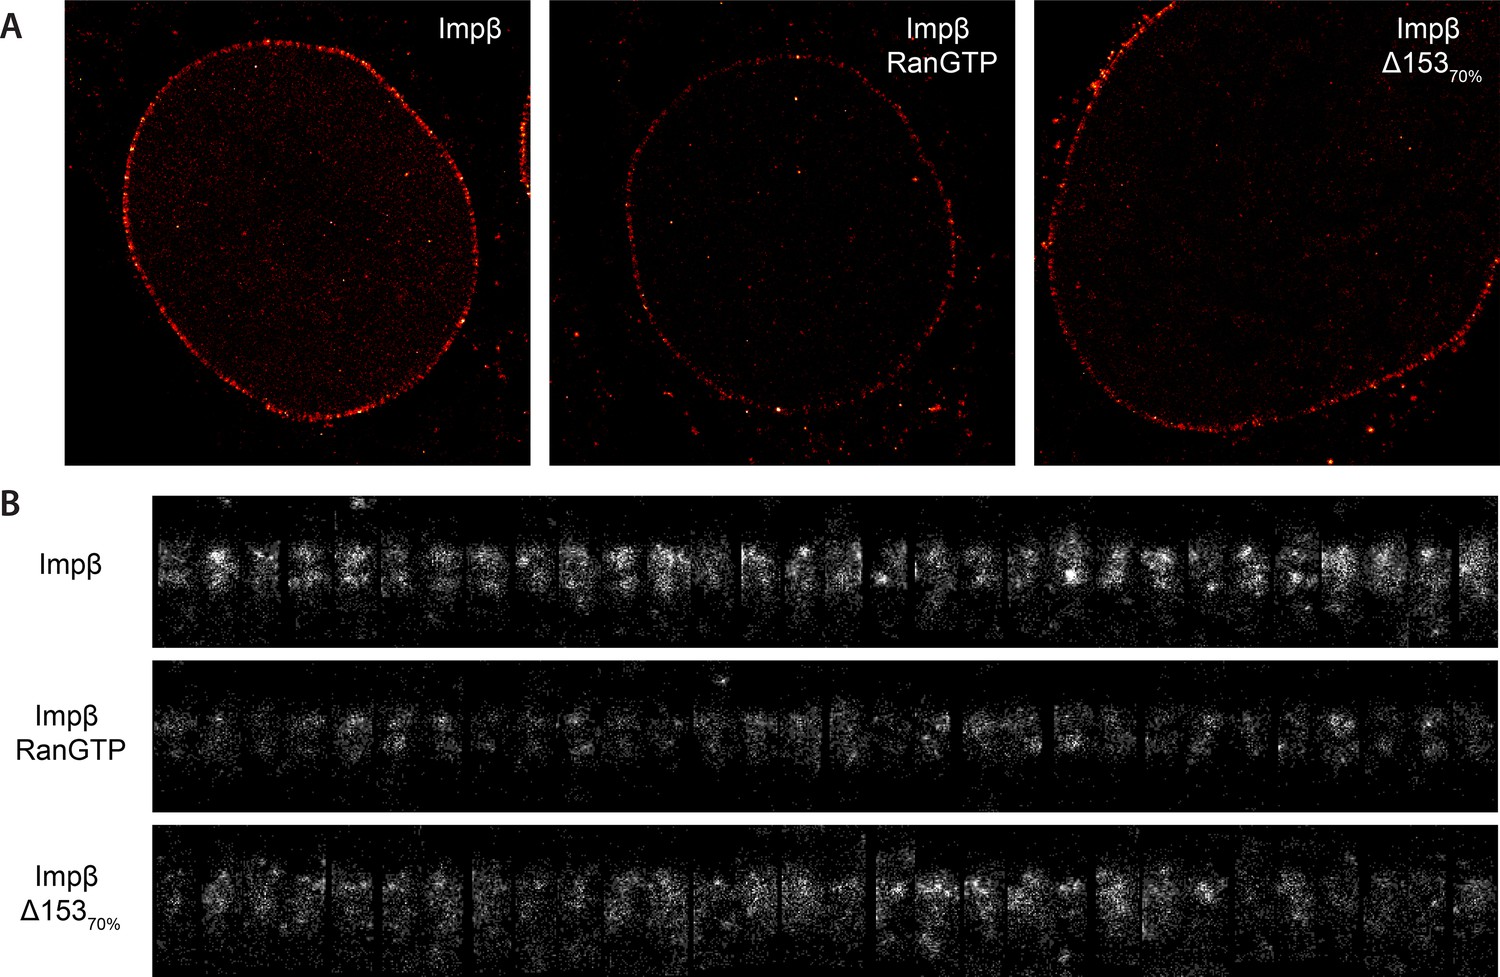
Examples of raw localization data for each of the conditions.
(A) Total raw localizations for each of the conditions presented in Figure 3. Note the strongly reduced number of localizations in the Ran+GTP case. Each image is plotted on the same intensity scale. (B) 30 randomly selected examples of individual putative NPC structures identified from each of the data sets presented in (A) and rotated and aligned to a common frame. The data are presented unnormalised but plotted on a common intensity scale. Again, note the strongly reduced number of localizations in the Ran+GTP and ∆Nup153 case. Also note the increased heterogeneity amongst the structures in the knockdown data.
Figure 3—figure supplement 2
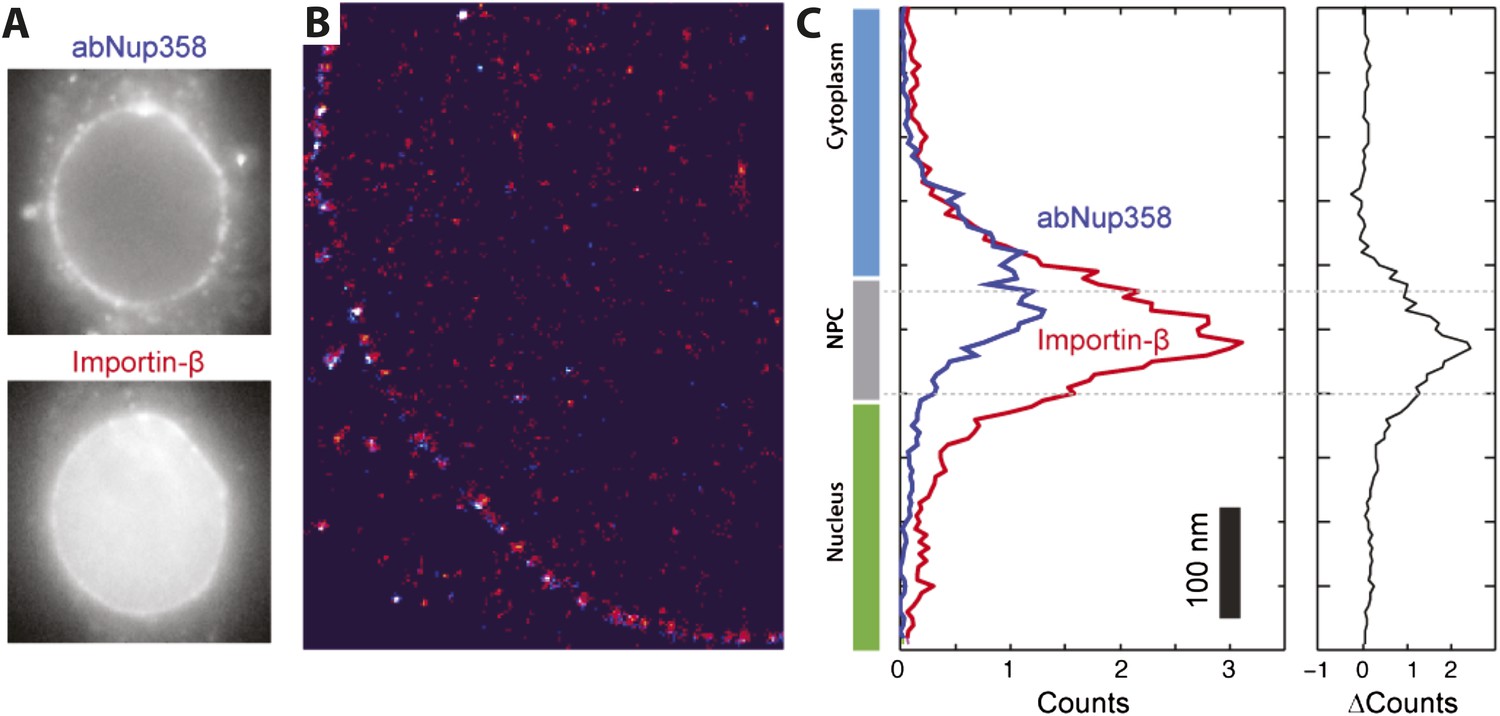
Two color STORM imaging.
(A) Widefield imaging of STORM labeled abNup358 and impβ. (B) Two-color STORM showing abNup358 labeled in blue and impβ labeled in red. The antibody again Nup358 localizes toward the cytoplasmic face of each NPC structure. The image is undersampled due to activation cross-talk problems outlined in the discussion. (C) Histogram of average counts for abNup358 and impβ localizations, showing the cytoplasmic bias in position of abNup358. The difference between the two distributions is found mainly in the NPC channel.
Figure 3—figure supplement 3
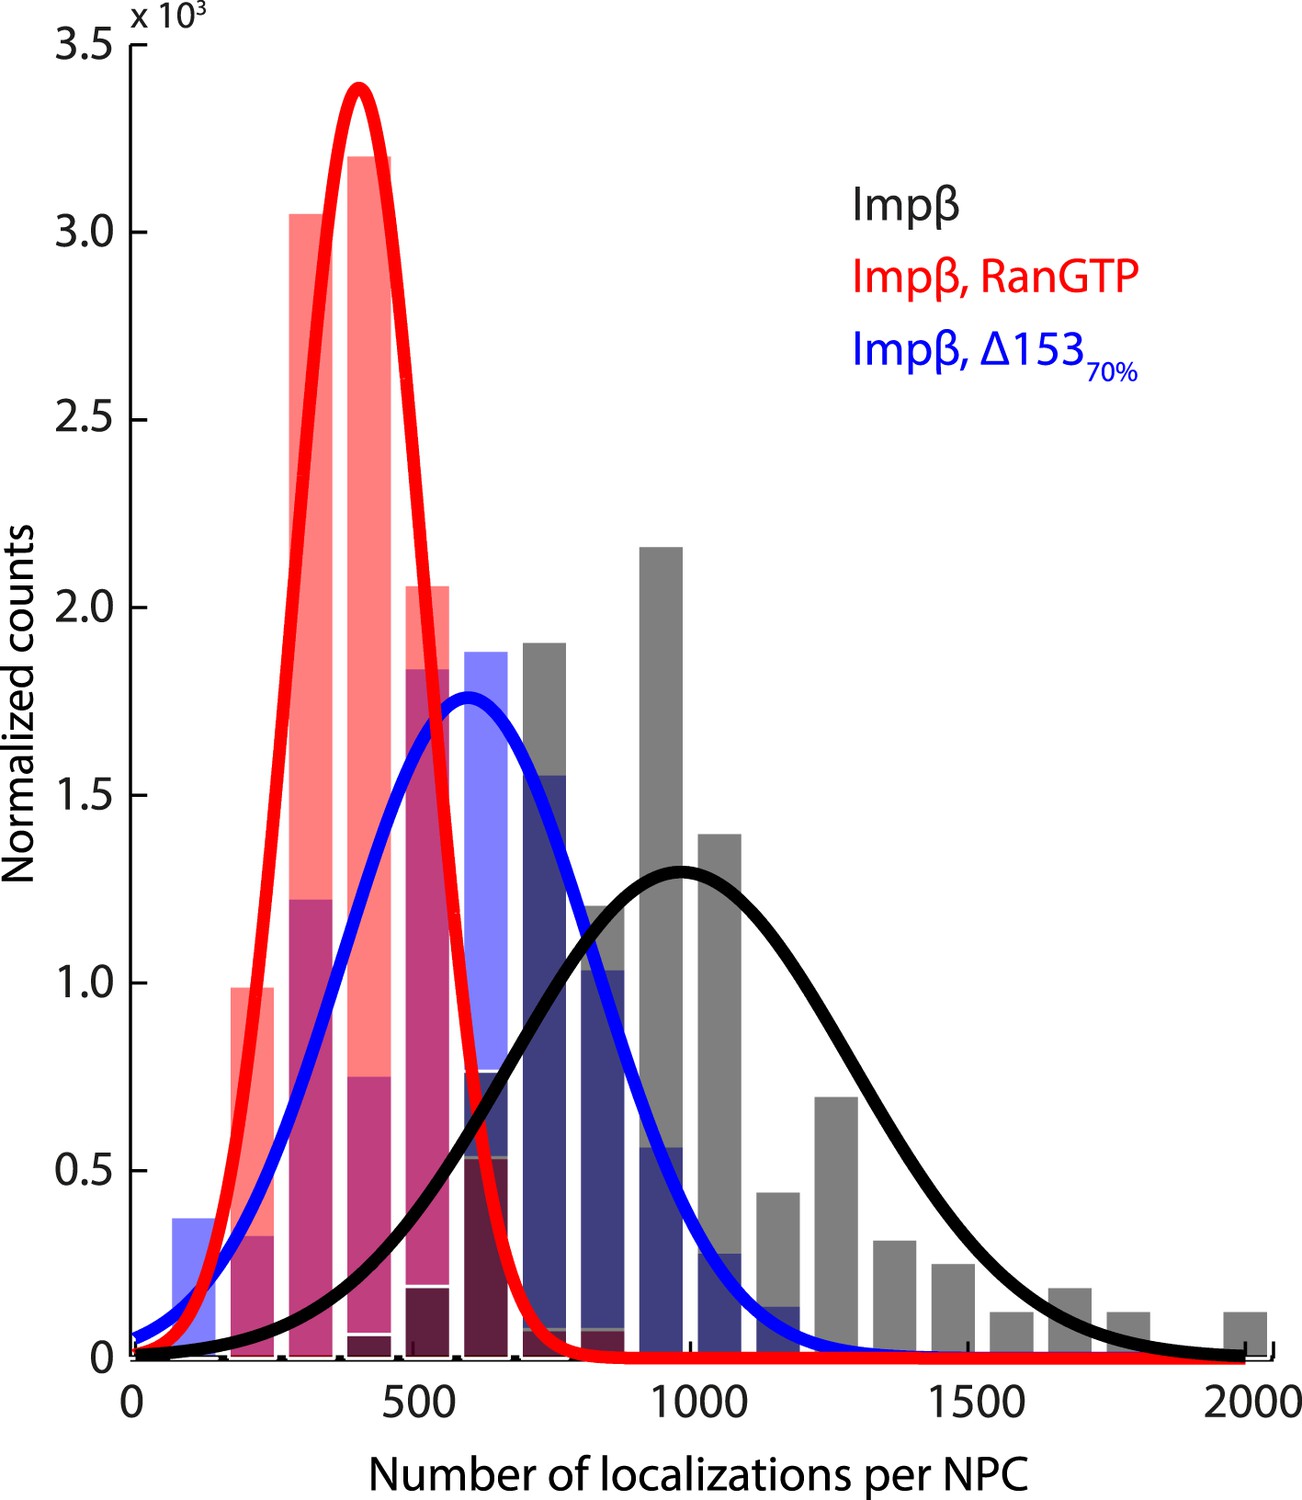
Histogram of the number of raw localizations per NPC structure.
Measured from the dSTORM data in Figure 3—figure supplement 1. Each distribution is fitted to a Gaussian distribution (plotted as a bold line), to show the decrease in the number of localizations between the three conditions tested (Impβ > Impβ, Δ15370% > Impβ+RanGTP).
Figure 3—figure supplement 4

Quantification of siRNA knockdown of Nup153.
(A) Immunofluorescence labeling of Nup153 in mock transfected and Nup153 siRNA-transfected HeLa cells. (B) Nup153 Western blot assay for HeLa cells that were not transfected, mock transfected, or transfected with Nup153 siRNA. β-actin was used as a loading control.
Figure 4 with 1 supplement
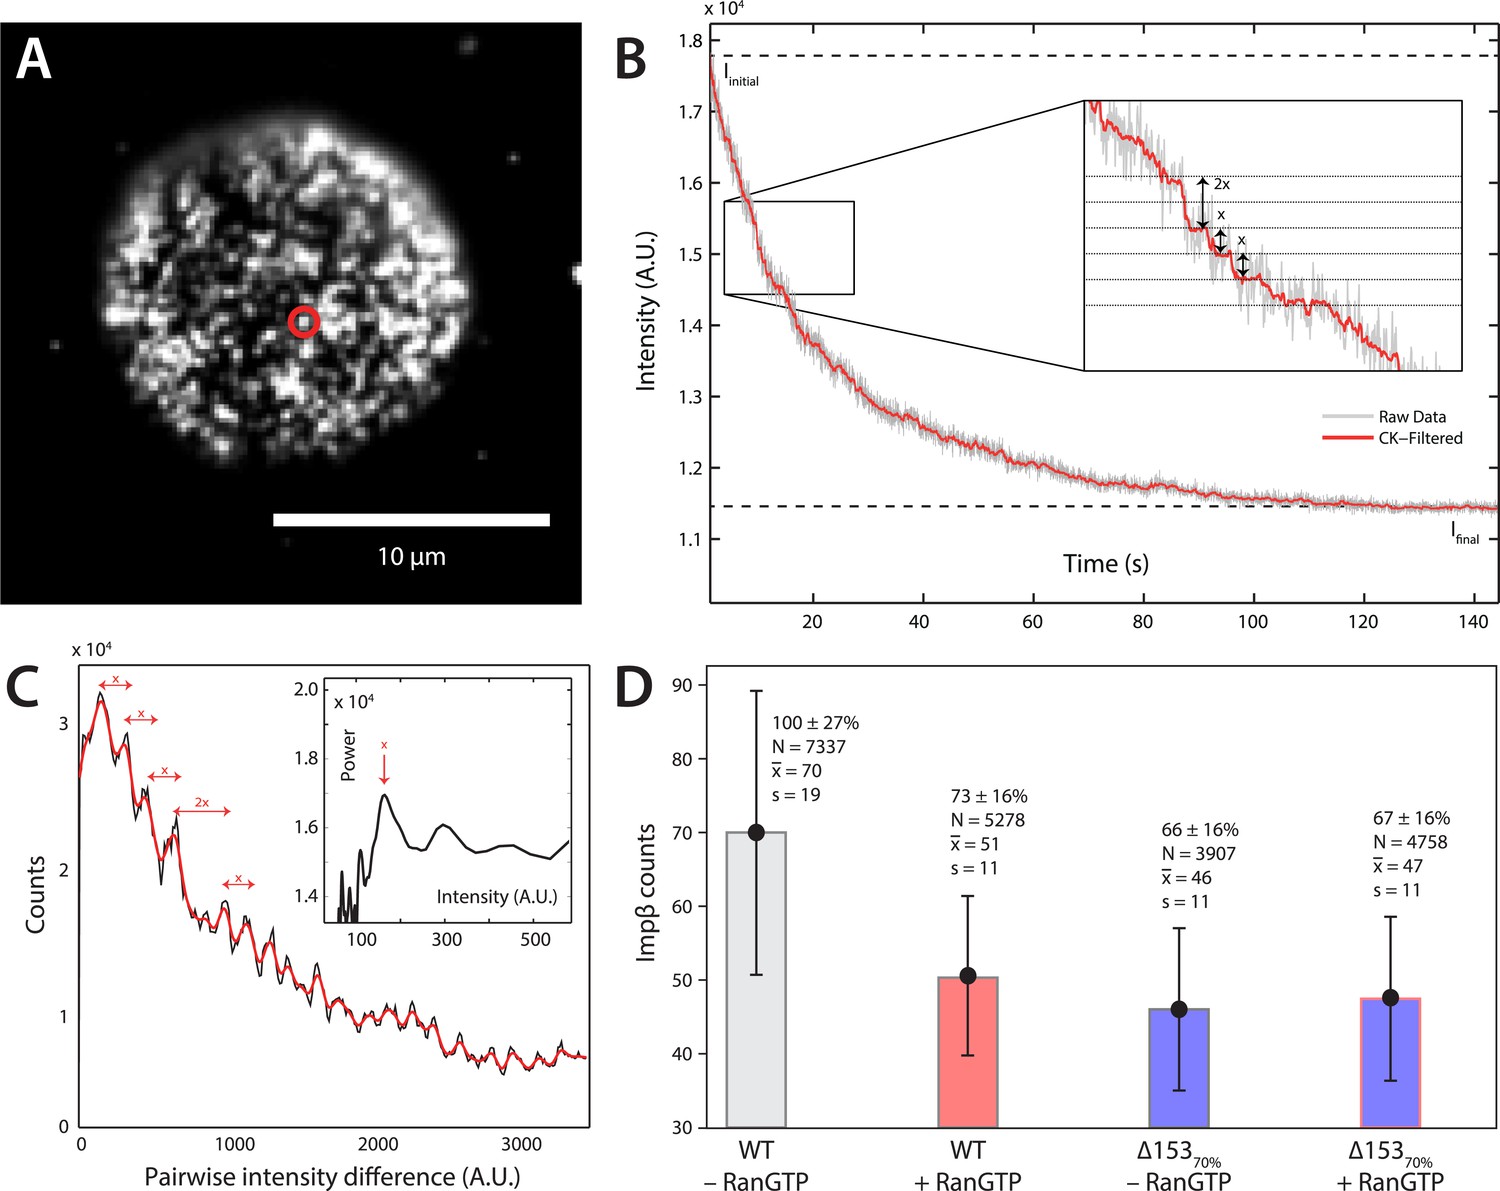
Photobleach step-counting of impβ at the NPC.
(A) A 200-frame average image of impβ-mCherry at the basal envelope of the nucleus. Individual NPCs can be identified (example highlighted in red). (B) Fluorescence intensity vs time trace for the NPC highlighted in (A) under continuous illumination. The raw intensity signal is shown in gray and the Cheung-Kennedy filtered signal is shown in red. Inset: individual photobleaching steps (x) can be clearly identified. (C) Pairwise difference distribution function calculated from the intensity trace shown in (B). Characteristic step sizes can be identified from the peaks in the distribution. Inset: the power spectrum of the pairwise difference distribution, showing the characteristic intensity signal for a single mCherry, x. We can then calculate the number of molecules by dividing the total intensity change in the trace in (B) by the fluorescence intensity of a single molecule calculated from (C). (D) Impβ counts as a function of RanGTP and Nup153. Addition of RanGTP and reduction of Nup153 decrease the impβ counts by approximately equal amounts. Normalized impβ abundance, number of pores analyzed, mean, and standard deviations are denoted. Error bars represent standard deviations about the means.
Figure 4—figure supplement 1
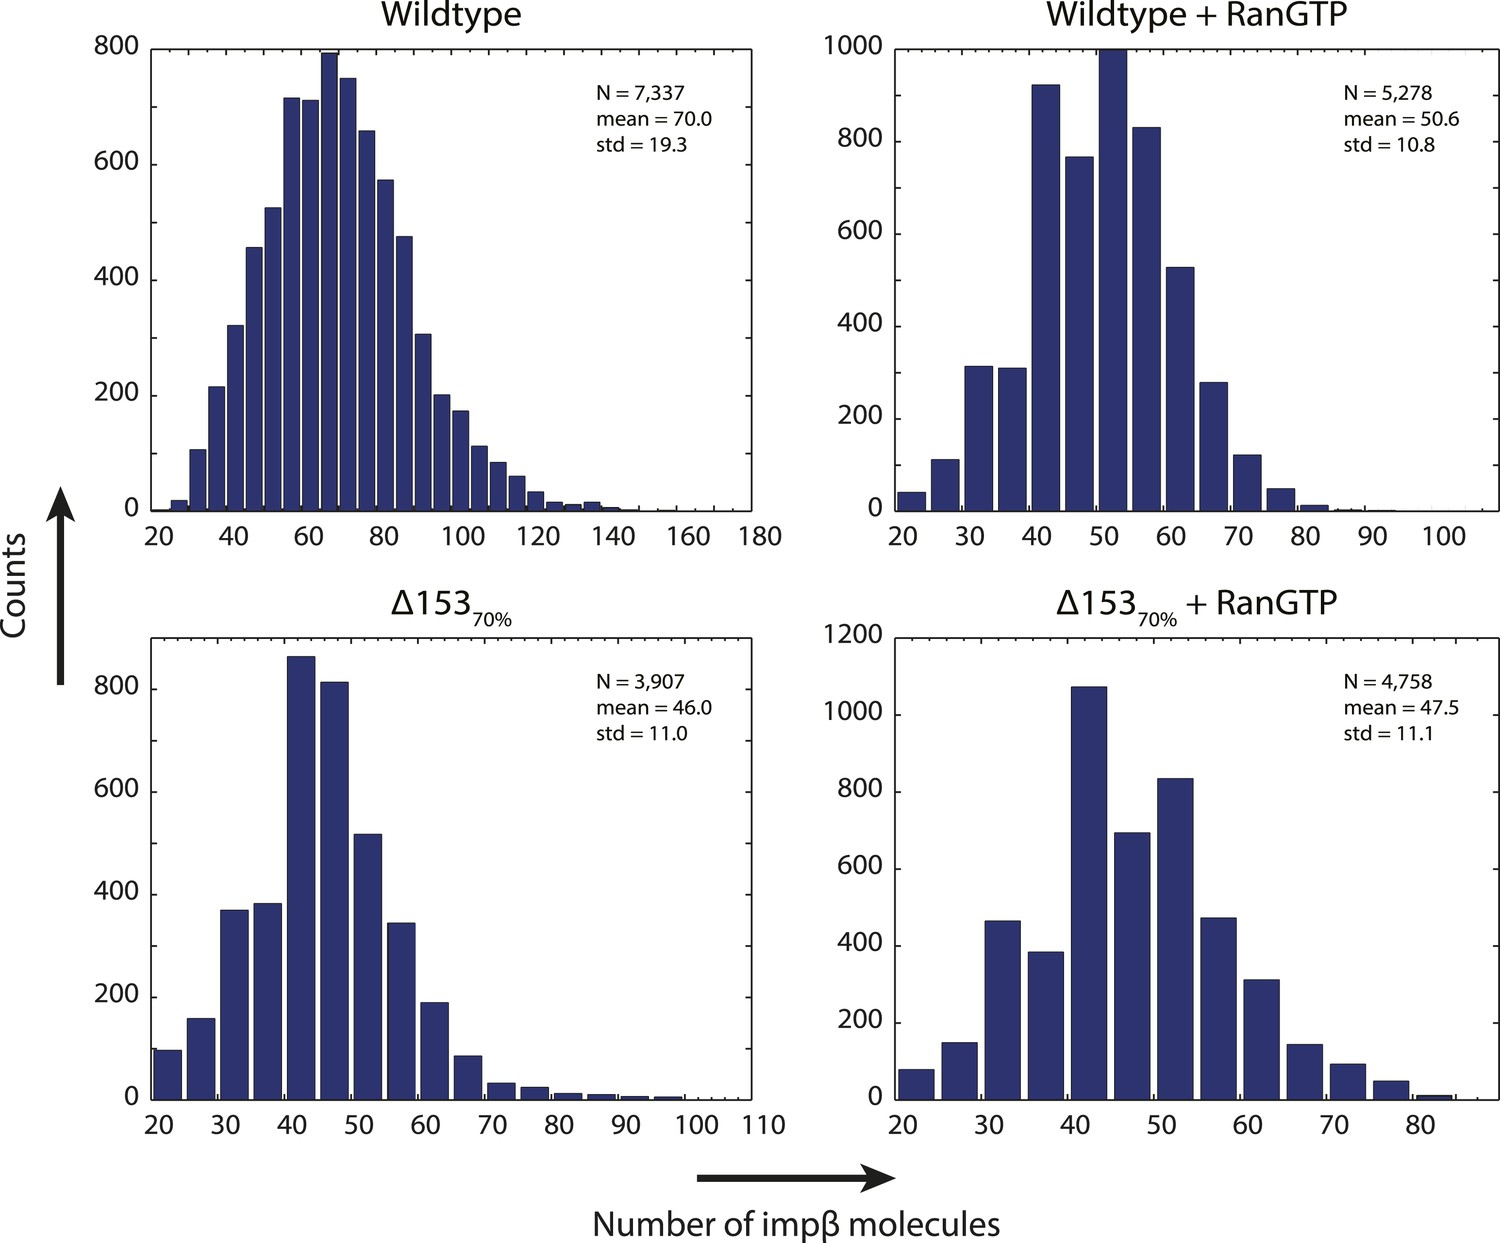
Distribution of count values.
Histogram of the count values for four conditions (wild type or Δ15370% cells with and without RanGTP) with a bin size of five molecules. Numbers of pores analyzed, means, and standard deviations are given.
Figure 5 with 1 supplement

Effect of Nup153 reduction on active transport and passive equilibration.
(A) Confocal fluorescence microscopy images showing the change in distribution of a fluorescently labeled 220 kDa SA-IBB4 cargo as a function of Nup153 knockdown. (B) Reduction of Nup153 enables the cargo to passively equilibrate (pale blue region) more rapidly through NPCs loaded with impβ. However, reduction of Nup153 impairs the active transport of SA-IBB4 (pale yellow region). (C) Passive equilibration of the inert GFP1 and GFP3 probes as a function of impβ (1 μM) and RanGTP (5 μM). For GFP1, note the rate decrease by impβ and the rate increase with RanGTP. For GFP3, passive equilibration is slow in all conditions. (D) Passive equilibration of GFP2 as a function of impβ, RanGTP, and Nup153. For wild-type cells, impβ and RanGTP have similar effects on GFP2 as on GFP1. For Δ15370% cells, impβ no longer slows passive diffusion of GFP2. RanGTP, however, still facilitates equilibration. (E) TRN1 does not significantly slow GFP2 diffusion through the NPC at 1 or even 2 μM. In all plots, shaded regions indicate the standard error of the mean (N ≥ 3 for all conditions).
Figure 5—figure supplement 1

RanGTP and a Ran ‘wash’ increase the passive equilibration of GFP2 into wild type nuclei even when no impβ is present.
In the GFP2 passive equilibration assays, it was intriguing that RanGTP made the pore more permeable than when impβ was excluded. We hypothesized that perhaps there was a significant amount of endogenous impβ, as well as other transport receptors, still residing at the pore that were not removed even after several wash steps during the digitonin permeabilization procedure. To test this, we performed an extra RanGTP wash step, in which Ran, GTP, and an energy-regeneration system were incubated with the nuclei for 10 min before being washed away. During this step, RanGTP will bind to and dissociate any endogenous transport receptors still bound to the NPC which are then subsequently washed away. In comparison to the condition in which impβ and RanGTP are not added to the nuclei, the RanGTP wash did indeed make the NPCs more permeable (red curve), although they were still not as permeable as when impβ and RanGTP are added together or when RanGTP is added alone (green and purple curves). This trend suggests that a subpopulation of endogenous transport receptors still reside at the NPC even after digitonin permeabilization.
Figure 6 with 1 supplement
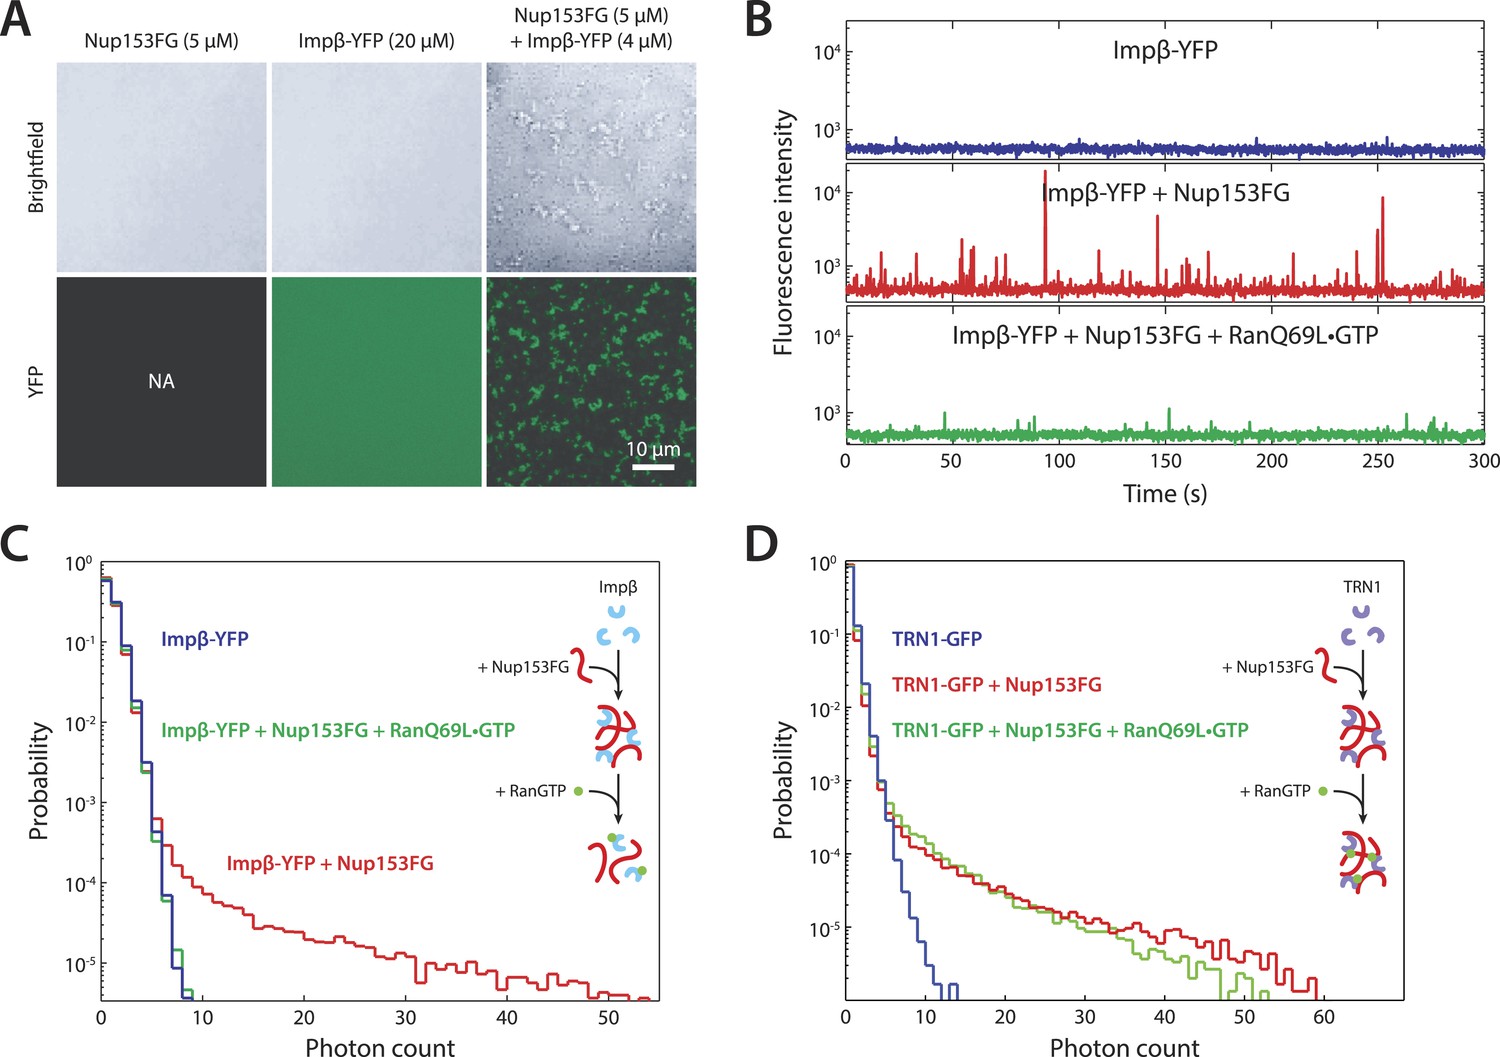
In vitro formation of large RanGTP-reversible impβ•Nup153FG complexes.
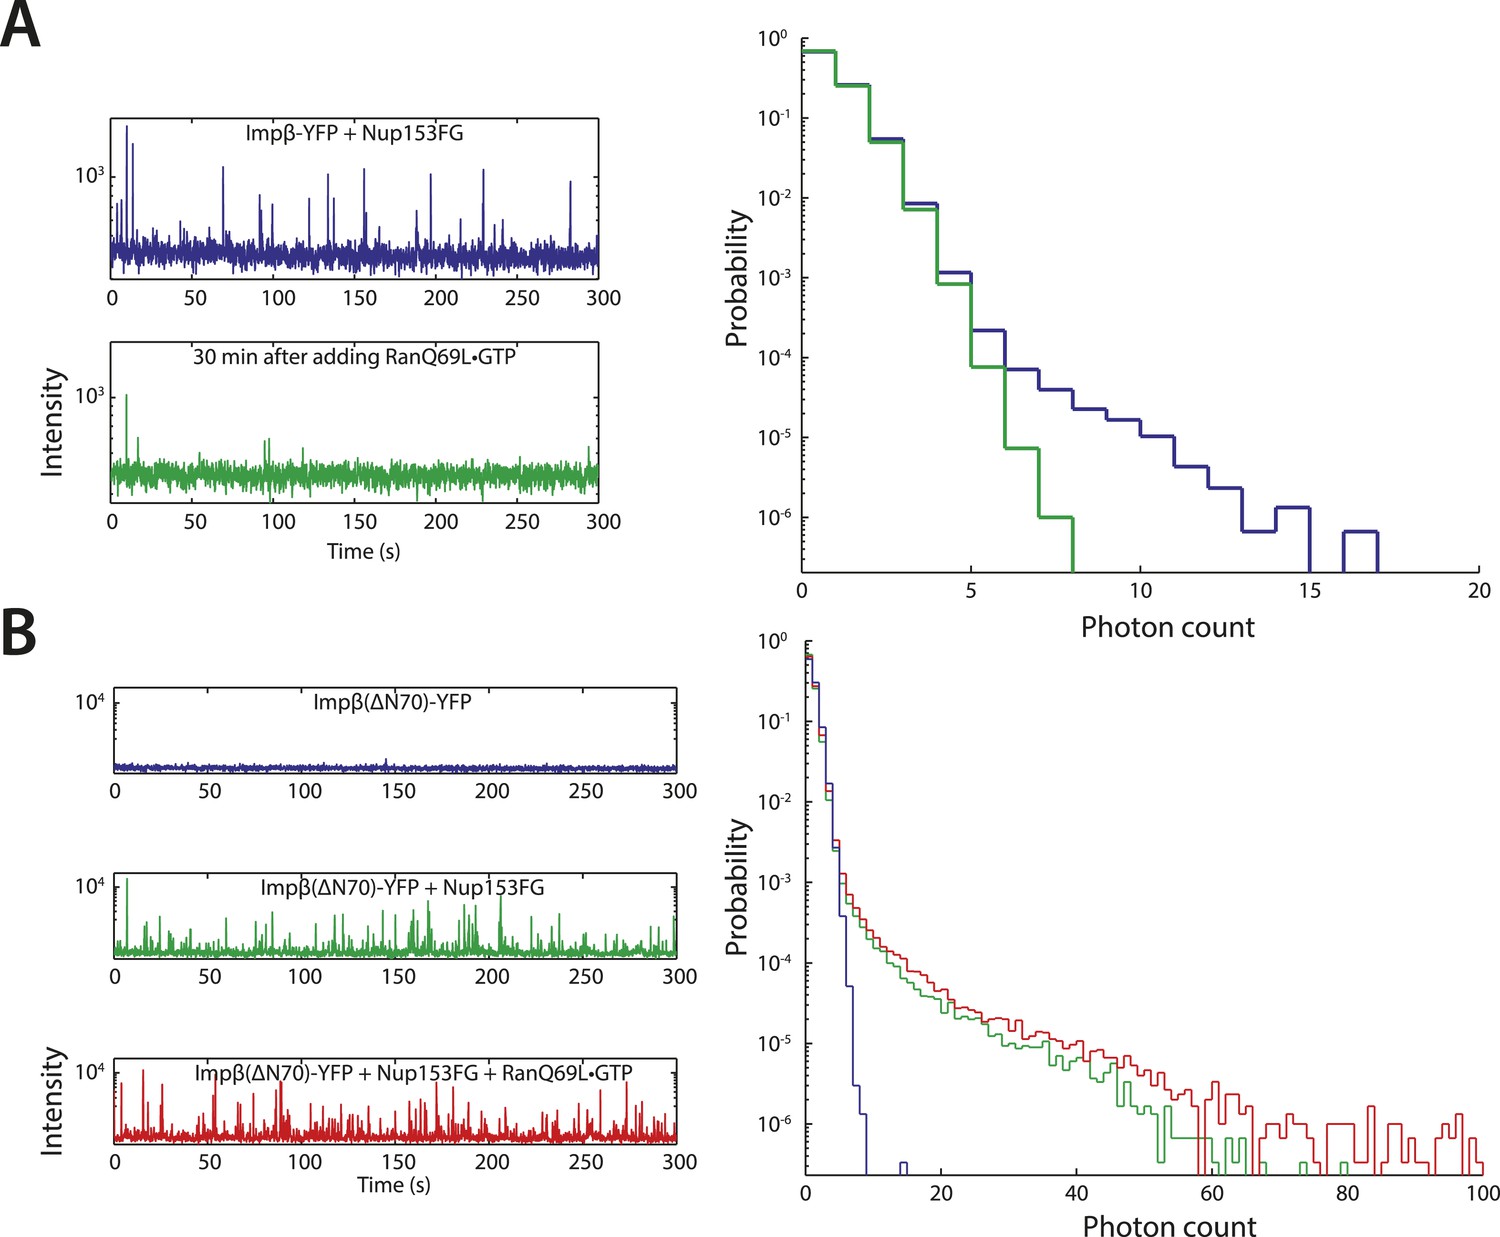
(A) Confocal images of impβ•Nup153FG complexes. Brightfield and YFP fluorescence images of Nup153FG (left), impβ-YFP (center), and Nup153FG + impβ-YFP (right). Complexes form only when both proteins are co-incubated. (B) Fluorescence fluctuation intensity traces of impβ-YFP in the presence of Nup153FG and RanQ69L•GTP. Large intensity bursts appear with the addition of Nup153FG but are inhibited in the presence of RanQ69L•GTP. (C) Photon counting histograms for the experiments shown in (B). Impβ and Nup153FG form large, bright complexes (note the extended tail with Nup153FG); however, these complexes disappear when RanQ69L•GTP is added (see inset schematic). (D) Photon counting histograms of fluorescence fluctuations for TRN1-GFP in the presence of Nup153FG and RanQ69L•GTP. Large complexes also form between TRN1 and Nup153FG but are not affected by RanQ69L•GTP (see inset schematic).
Figure 6—figure supplement 1
Additional fluctuation traces.
(A) RanQ69L•GTP can dissolve existing aggregates. To determine whether RanGTP can dissolve aggregates that have already formed and not just prevent aggregate formation, impβ-YFP•Nup153 aggregates were allowed to form for 5 min at room temperature and their fluorescence fluctuations were measured (blue traces). RanQ69L•GTP was then added to the reaction for 30 min and the fluctuations were measured again (green traces). The disappearance of the majority of large fluorescent spikes indicate that RanQ69L•GTP can dissolve existing aggregates. (B) Test of Ran-reversibility of aggregates formed by an impβ truncation unable to bind Ran. To test the hypothesis that RanQ69L•GTP prevents aggregate formation by displacing impβ that is bound to Nup153FG, we characterized the aggregation capacity of an impβ truncation missing the first 70 N-terminal amino acids, impβ(ΔN70), corresponding to impβ's Ran-binding domain. Impβ(ΔN70)-YFP did not form aggregates on its own (blue trace) but did so when mixed with Nup153FG (green trace). Interestingly, RanQ69L•GTP was now unable to abolish aggregate formation (red trace), indicating that RanGTP dissolves the aggregates through impβ binding and not Nup153FG binding.
Figure 7
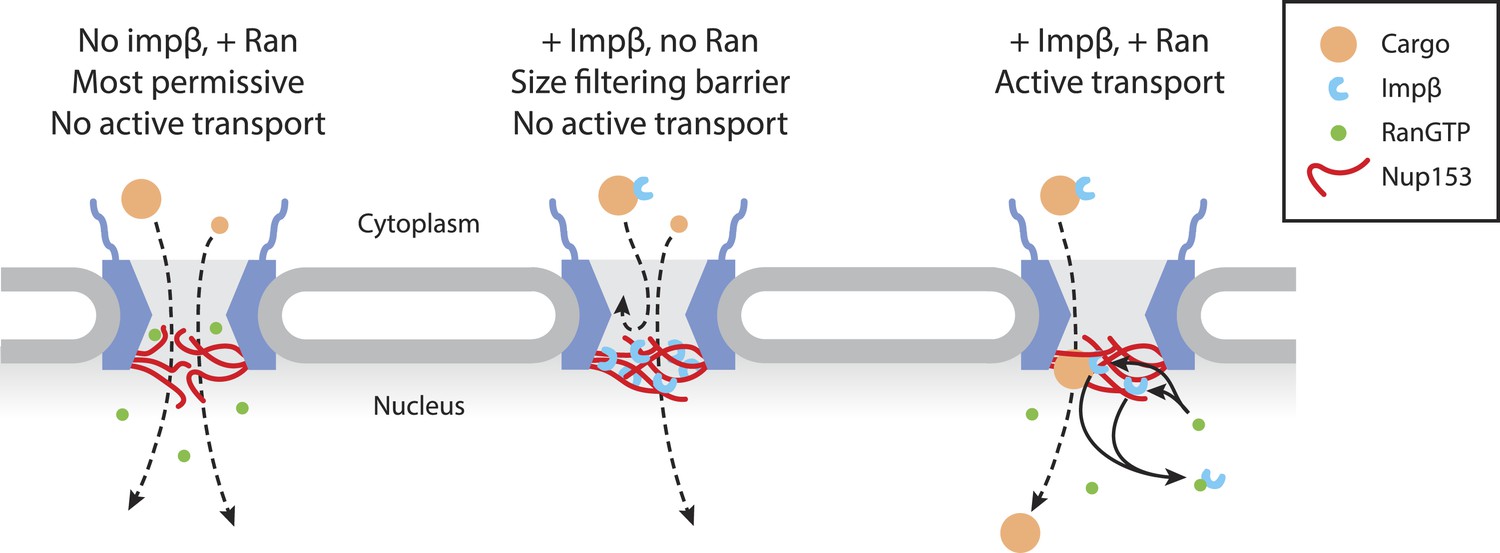
Model of Ran-sensitive impβ•Nup153 interactions at the nuclear face of the NPC.
In this model, multivalent interaction of impβ with Nup153 yields a cross-linked mesh that restricts the movement of inert molecules and cargo-receptor complexes. This impβ•Nup153 barrier is modulated by Ran.
Tables
Table 1
Mann–Whitney confidence intervals of impβ changes seen in ±RanGTP and ±Δ15370% conditions
| WT − RanGTP | WT + RanGTP | Δ15370% − RanGTP | Δ15370% + RanGTP | |
|---|---|---|---|---|
| WT − RanGTP | – | [17.8, 18.9] | [22.5, 23.7] | [21.1, 22.2] |
| WT + RanGTP | [−17.8, −18.9] | – | [4.5, 5.4] | [2.9, 3.8] |
| Δ15370% − RanGTP | [−22.5, −23.7] | [−4.5, −5.4] | – | [−0.9, −1.8] |
| Δ15370% + RanGTP | [−21.1, −22.2] | [−2.9, −3.8] | [0.9, 1.8] | – |
-
For example, the addition of RanGTP compared to baseline results in a drop of about 18 impβ counts (column 1, row 2); The Mann–Whitney confidence interval is [−17.8, −18.9].
Additional files
-
Supplementary file 1
Plasmid constructs.
- https://doi.org/10.7554/eLife.04052.022
Download links
A two-part list of links to download the article, or parts of the article, in various formats.
Downloads (link to download the article as PDF)
Open citations (links to open the citations from this article in various online reference manager services)
Cite this article (links to download the citations from this article in formats compatible with various reference manager tools)
Importin-β modulates the permeability of the nuclear pore complex in a Ran-dependent manner
eLife 4:e04052.
https://doi.org/10.7554/eLife.04052


