Non-crossover gene conversions show strong GC bias and unexpected clustering in humans
- Columbia University, United States
- Broad Institute of Harvard and MIT, United States
- Texas Biomedical Research Institute, United States
- Oxford University, United Kingdom
- University of Michigan, United States
- Harvard Medical School, United States
- Howard Hughes Medical Institute, Harvard Medical School, United States
Figures
Figure 1

Non-crossover detection.
(A) Pictorial representation of a haplotype transmission including NCO events. A parent has two copies of each chromosome but transmits only one copy to his or her children. That copy is composed of DNA segments from the parent's two homologs; that is, it is formed by recombination between these two haplotypes. Here, the two haplotypes in the parent are colored in blue and red, and switches in color represent sites of recombination. The figure only depicts short NCO events and no COs. Overlaid on this haplotype are × symbols representing sites assayed by the SNP array. In this example, only one NCO has a SNP array site within it and only that NCO can be identified. (B) To avoid calling false positive NCO events driven by genotyping error, we required putative NCO events first to be detected in a second generation child (top red arrow) and also transmitted to a third generation grandchild (bottom red arrow). We also required that the allele from the opposite haplotype (i.e., the one not affected by the NCO) in the parent (first generation) be transmitted to at least one child in the second generation (blue arrow). This study design ensures that false positive NCOs will only occur if there are two or more genotyping errors at a site. All 34 pedigrees included in this study have genotype data for both parents, at least three children, one or more grandchild, and both parents of included grandchildren. (C) Genomic locations of the NCO sites that we detected are indicated by arrowheads, with red arrowheads representing NCO events from female meioses, and blue from male meioses. Many of the male NCO events localize to the telomeres. (D) Relative chromosomal positions of events, stratified by the sex of the transmitting parent.
Figure 2 with 1 supplement
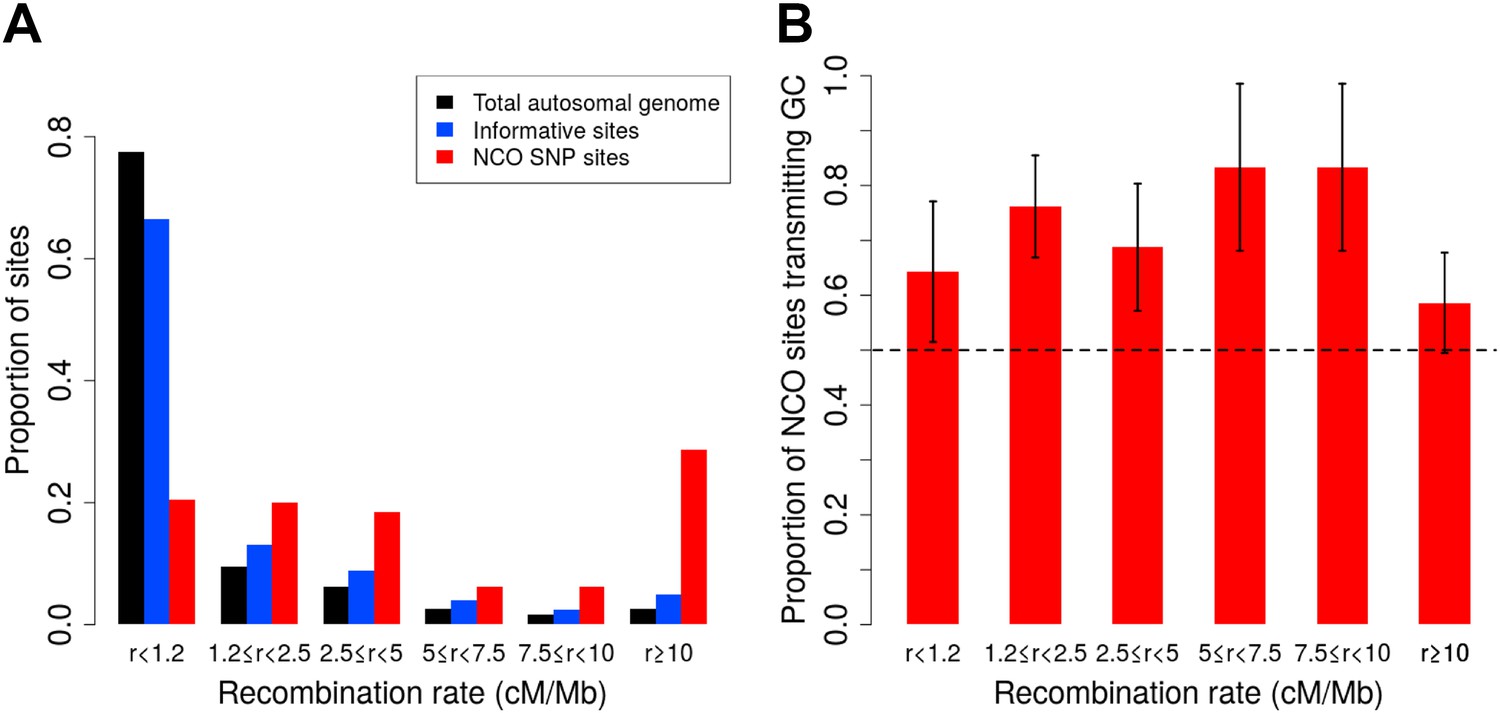
Proportion of non-crossover sites and rate of GC vs AT allele transmissions across recombination rate bins.
(A) Histogram of proportions of sites that fall into six ranges of recombination rates from the HapMap2 LD-based map (The International HapMap Consortium, 2007) for the autosomal genome, all informative sites, and the identified NCO sites (see ‘Materials and methods’—‘Crossover and recombination rates’). (B) Rate of transmissions of G or C at AT/GC SNPs, across six recombination rate bins. Plot shows standard error bars.
Figure 2—figure supplement 1
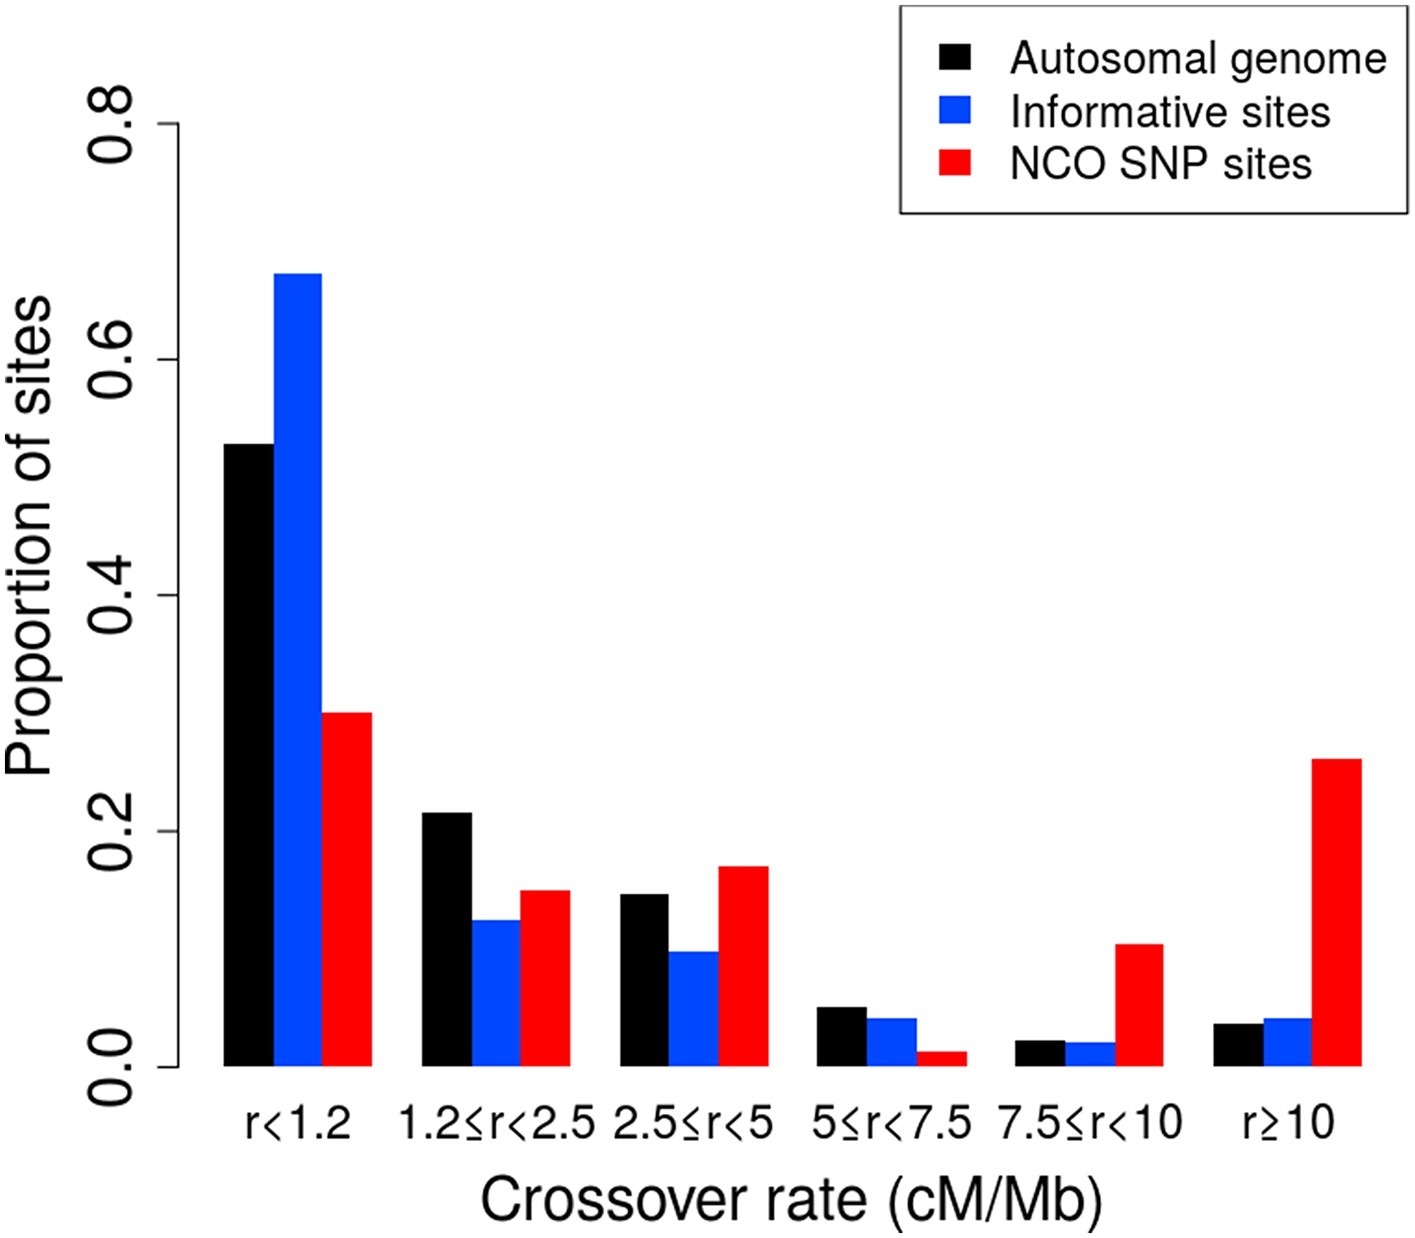
Proportion of non-crossover sites across crossover rate bins.
Histogram of proportions of sites that fall into six ranges of crossover rates from the deCODE pedigree map (Kong et al., 2010) for the autosomal genome, all informative sites, and the identified NCO sites (see ‘Materials and methods’—‘Crossover and recombination rates’).
Figure 3

Tract lengths for identified non-crossovers.
Tract lengths for the 22 NCO events that either have two or more SNPs in a tract or have maximum length of ≤5 kb. Each line corresponds to a NCO tract; lower bounds on length appear in color, with red corresponding to tract lengths informed by SNP array data and blue corresponding to tract lengths from sequence data. Gray dashed lines represent the region of uncertainty surrounding the tract length, with the end points being the upper bound on tract length. Tracts are sorted by the upper bound on tract length.
Figure 4

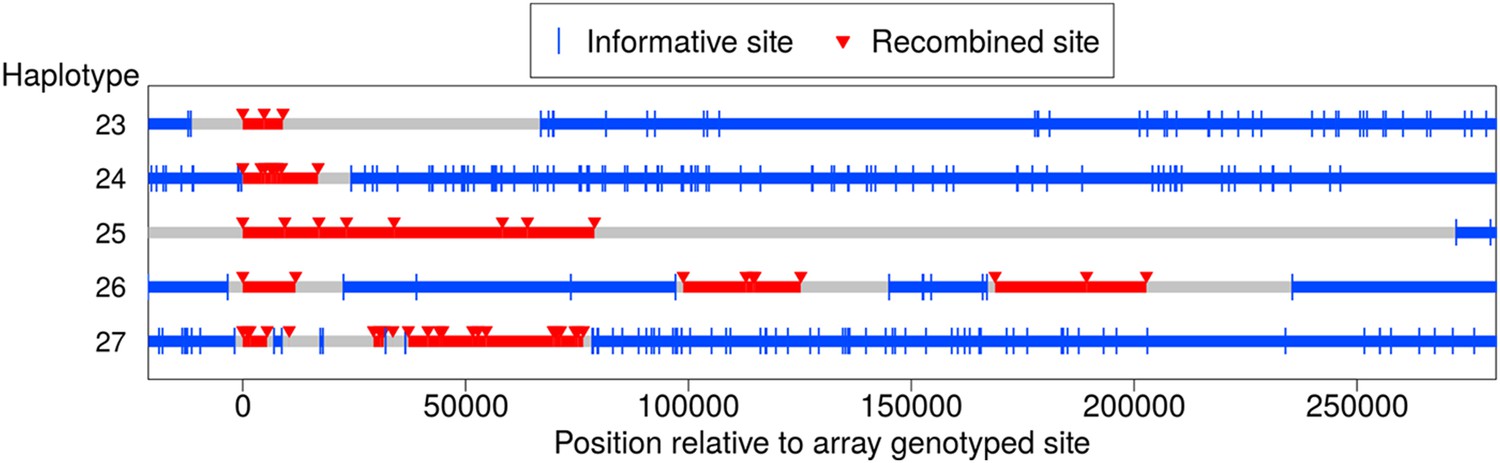
Clustered non-crossover events evident in resequencing and SNP array data.
(A) Recombination patterns in whole genome sequence data for the region surrounding 13 NCO events originally identified in the SNP array data. Each horizontal line represents a haplotype transmission from a single meiosis, and position 0 on the x-axis corresponds to NCO sites identified in the SNP array data. Blue lines depict haplotype segments that derive from the parental homolog transmitted in the wider surrounding region, with blue vertical bars depicting informative sites. Red lines depict segments from the opposite homolog and are putative NCO events, with red arrows indicating informative sites. Grey lines are regions that have ambiguous haplotypic origin. For haplotypes 1–9, only a single site exhibits NCO. For haplotypes 10–13, several NCO sites appear in a short interval near each other but separated by informative SNPs from the background haplotype. Boxes indicate regions for which we preformed Sanger sequencing (see text). (B) Clustered recombination events identified in the SNP array data; note the different scale on the x-axis compared with panel A. Here, haplotypes 14–16 are clustered NCO events while haplotypes 17–22 occur near but not contiguous with CO events (note the switch in haplotype color between the left and right side of the plot). It is uncertain whether the alleles descending from the blue or the red haplotype represent NCO events (‘Materials and methods’—‘Inclusion criteria’); thus the plot uses the same symbol for informative sites from both parental haplotypes. Haplotype 19 also appears to have resulted from a CO, but with informative sites more distant than the range of the plot. Haplotype 21 contains an informative marker that has ambiguous phase in the third generation and therefore was not detected initially, but it is plotted here with a * symbol. The ambiguous phase in the third generation is consistent with neighboring sites and not indicative of an incorrect genotype call.
Figure 5
Long-range recombination events observed in sequence data.
Shown are three contiguous recombination tracts with length ≥ 9 kb, ≥ 16.9 kb, and ≥ 79 kb as well as two sets of clustered long-range recombination events that span ∼200 kb and ∼76 kb.
Additional files
-
Source code 1
Non-crossover event details. TSV file containing information about each NCO site. Descriptions of each column are listed as comments at the beginning of the file.
- https://doi.org/10.7554/eLife.04637.009
-
Source code 2
R source code containing statistical analyses of NCO events.
- https://doi.org/10.7554/eLife.04637.010
Download links
A two-part list of links to download the article, or parts of the article, in various formats.
Downloads (link to download the article as PDF)
Open citations (links to open the citations from this article in various online reference manager services)
Cite this article (links to download the citations from this article in formats compatible with various reference manager tools)
Non-crossover gene conversions show strong GC bias and unexpected clustering in humans
eLife 4:e04637.
https://doi.org/10.7554/eLife.04637


