A highly tunable dopaminergic oscillator generates ultradian rhythms of behavioral arousal
- McGill University, Canada
- Douglas Mental Health University Institute, Canada
- Sorbonne University, France
Figures
Figure 1
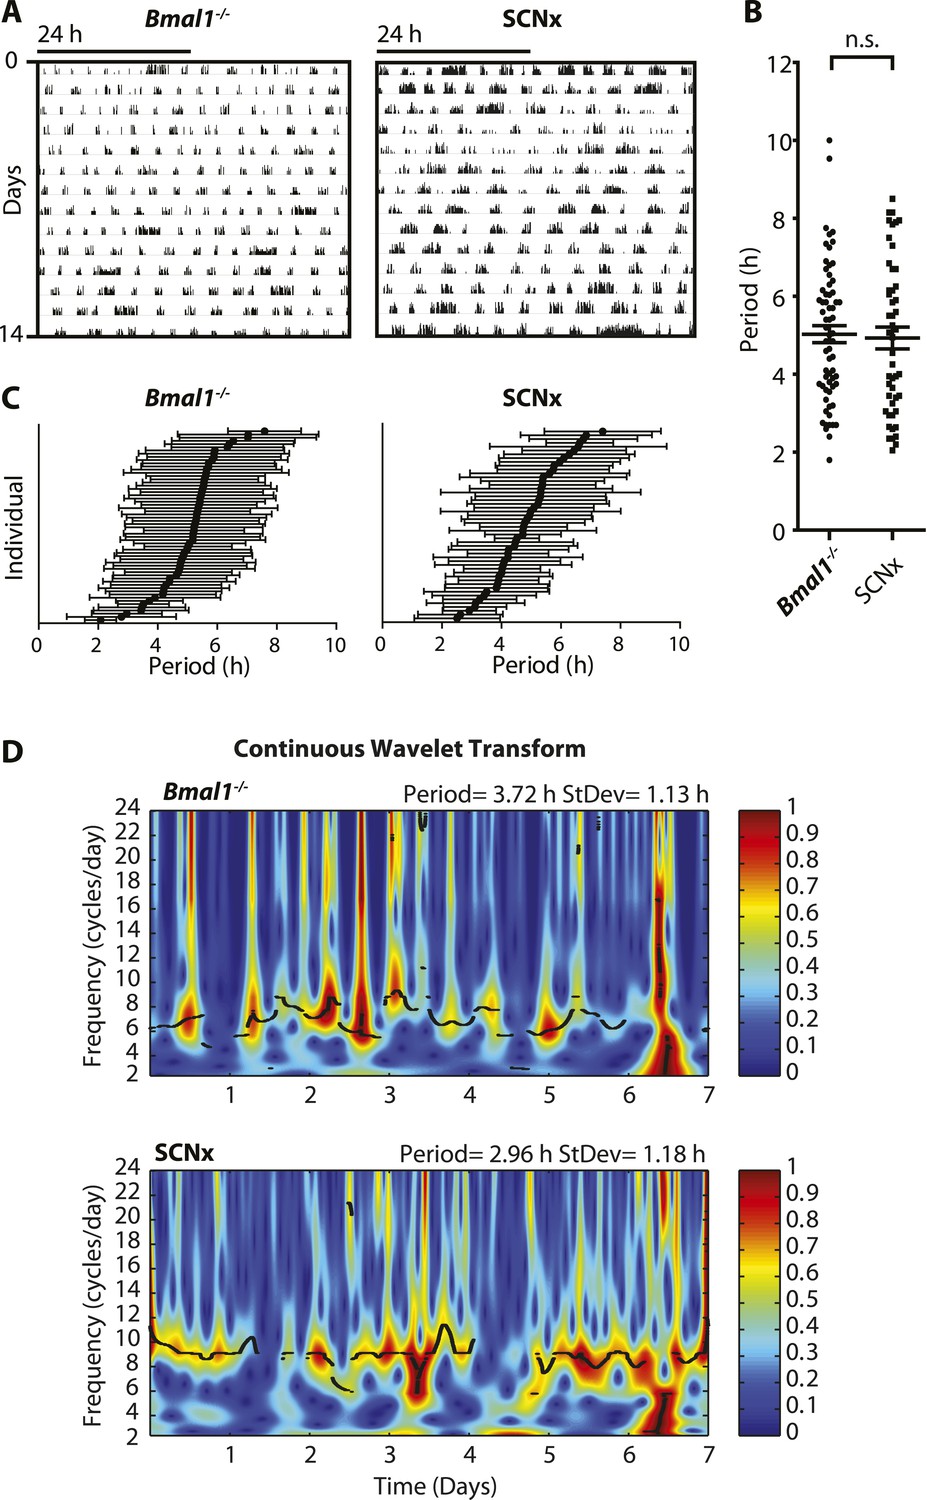
Inter- and intra-animal variability of ultradian activity rhythms across time in circadian incompetent mice.
(A) Representative double-plotted actograms of running wheel activity in SCN-lesioned (SCNx) and Bmal1−/− mice in DD. (B) Dot plot of locomotor period length in DD based on Lomb-Scargle periodogram analysis of seven consecutive days of activity recording (N = 65 for Bmal1−/− and N = 48 for SCNx; t111 = 0.2785, p = 0.78, unpaired t-test). (C) Intra-animal period variability expressed as mean ± SD for each animal, ranked according to mean period length derived from continuous wavelet transforms (CWT) for the 1–12-hr frequency range (same animals and timespans for calculation as in B). (D) CWT-heatmaps showing decibel scaled and normalized amplitude of oscillations according to frequency and time with black traces indicating the ridge of local amplitude maxima.
Figure 2
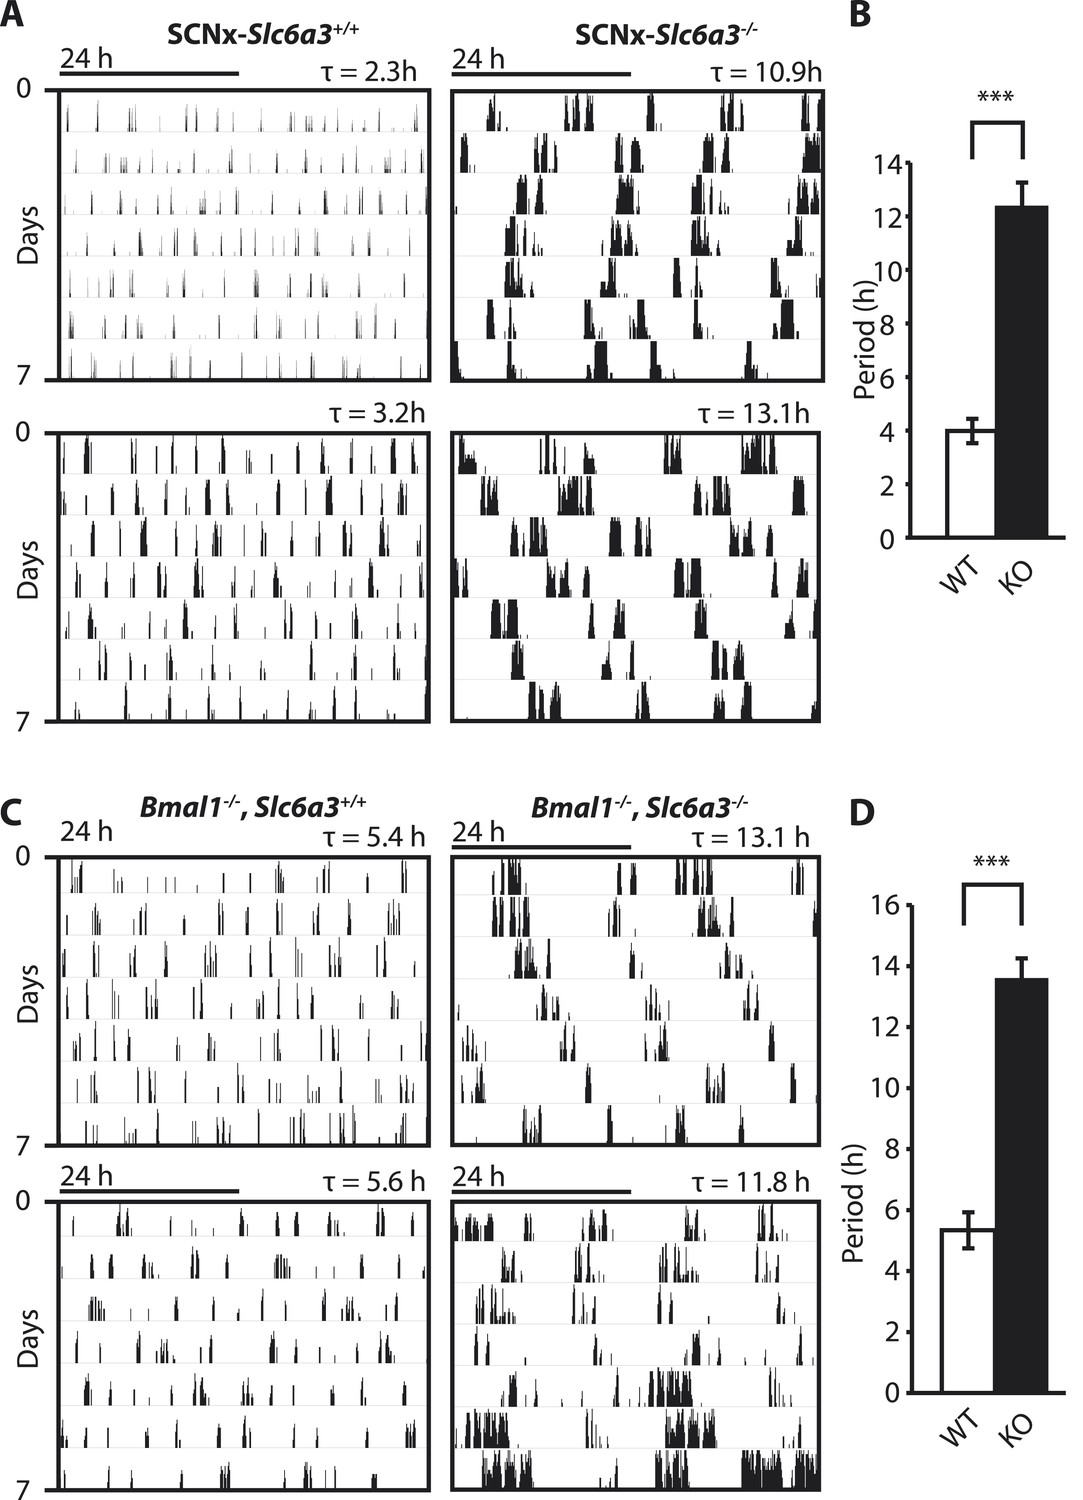
Dopamine transporter knockout alters periodicity of ultradian locomotor rhythms in circadian incompetent mice under constant darkness.
(A) Representative, double-plotted actograms demonstrating marked lengthening of ultradian locomotor periods in SCNx-Slc6a3−/− mice as compared to SCNx-Slc6a3+/+ littermates. Tau(τ) indicates individual period. (B) Period length averages of ultradian activity (N = 7; F1,6 = 253.8, ***p < 0.0001, ANOVA) from Lomb-Scargle periodogram analysis of 7-day time-spans. (C) Representative, double-plotted actograms demonstrating markedly increased ultradian period lengths in Bmal1−/−, Slc6a3−/− mice as compared to Bmal1−/−, Slc6a3+/+ mice. (D) Period length averages of ultradian activity (N = 4; F1,3 = 194.2, ***p < 0.001, ANOVA) from Lomb-Scargle periodogram analysis of 7-day time- spans.
Figure 3 with 1 supplement
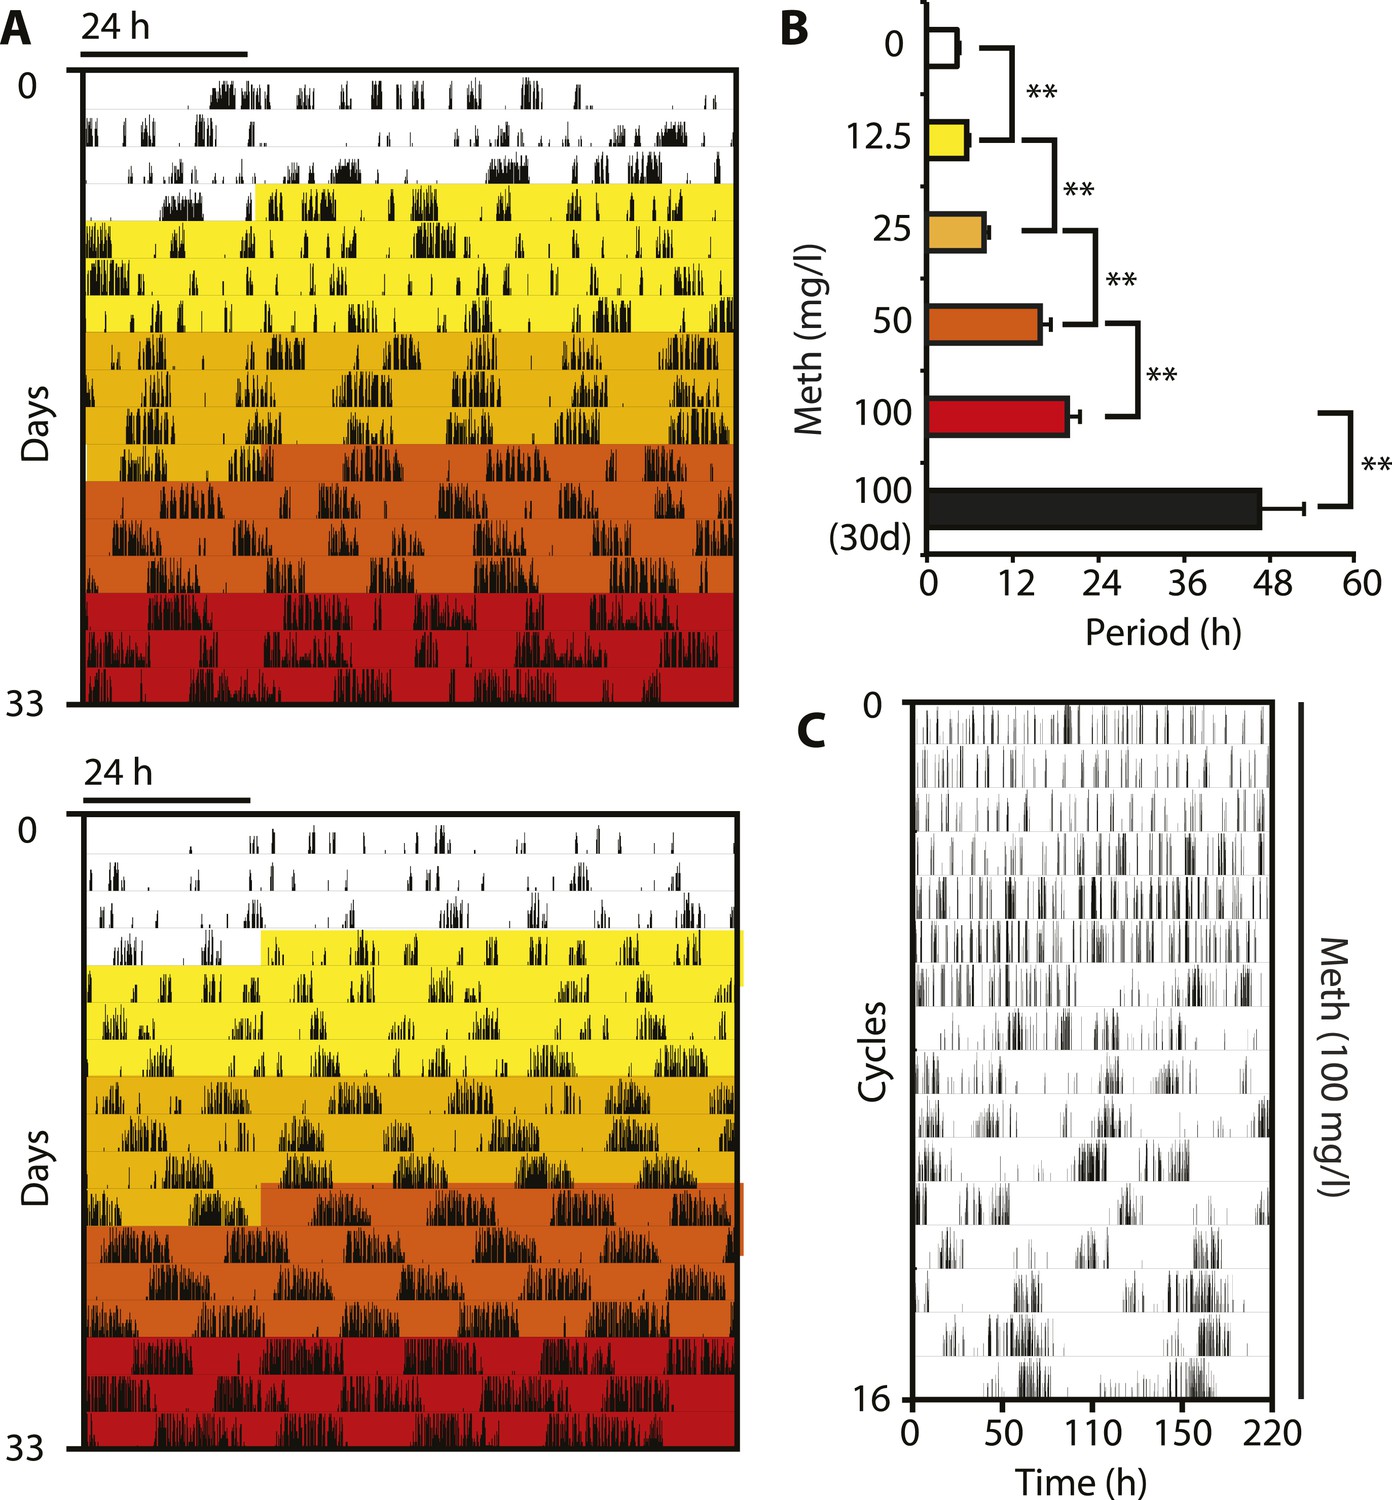
Pharmacological tuning of DAT activity by incrementally increasing methamphetamine concentrations lengthens ultradian locomotor period into the infradian range.
(A) Representative actograms of Meth-treated Bmal1−/− mice in DD. Treatment intervals are highlighted with corresponding concentrations indicated in (B). (B) Mean periods from the last 7 days at a given Meth concentration. Repeated measures ANOVA revealed a significant main effect of concentration/time (F5,40 = 34.30, p < 0.001) and significant period lengthening between consecutive concentrations (mean ± SEM; N = 9; **p ≤ 0.005, planned comparisons; 30 day, 30 day exposure to 100 mg/l). (C) Modulo 110-hr actogram of a Bmal1−/− animal after extended exposure to Meth revealing an ultra-long activity rhythm.
Figure 3—figure supplement 1
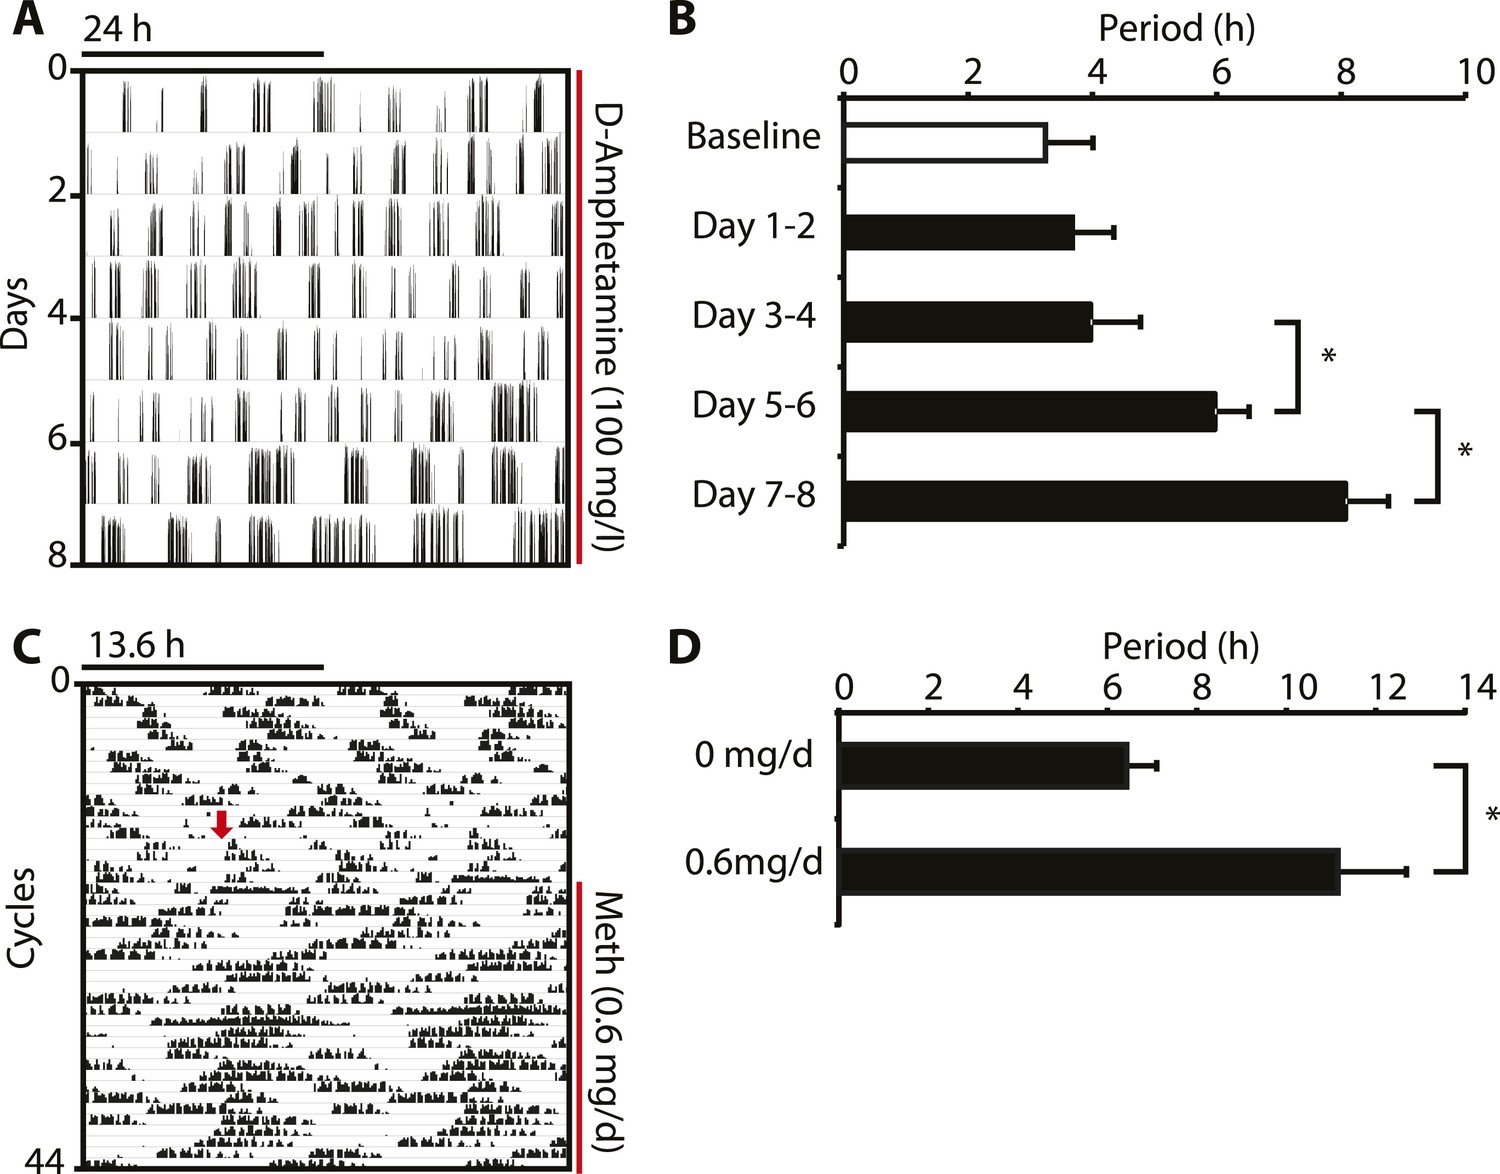
Amphetamine treatment lengthens ultradian locomotor rhythms in Bmal1−/− mice.
(A) Representative actogram of Bmal1−/− mice in DD provided with d-amphetamine (100 mg/l) in their drinking water. (B) Average activity rhythm periods calculated for the indicated days post treatment-onset (mean ± SEM, N = 10; F4,9 = 26.51, p < 0.0001, repeated measures ANOVA; *p ≤ 0.001, planned comparison). (C) Representative running wheel activity actogram (plotted modulo 13.6 hr) of Bmal1−/− mice in DD, which received chronic subcutaneous infusions of Meth (0.6 mg/day) for 14 days. Red arrow indicates time of pump implantation. (D) Average activity rhythm periods during the last 7 days prior to pump implantation (0 mg/day) and the last 7 days of treatment (mean ± SEM, N = 6; F1,5 = 3.525, *p < 0.01, ANOVA).
Figure 4
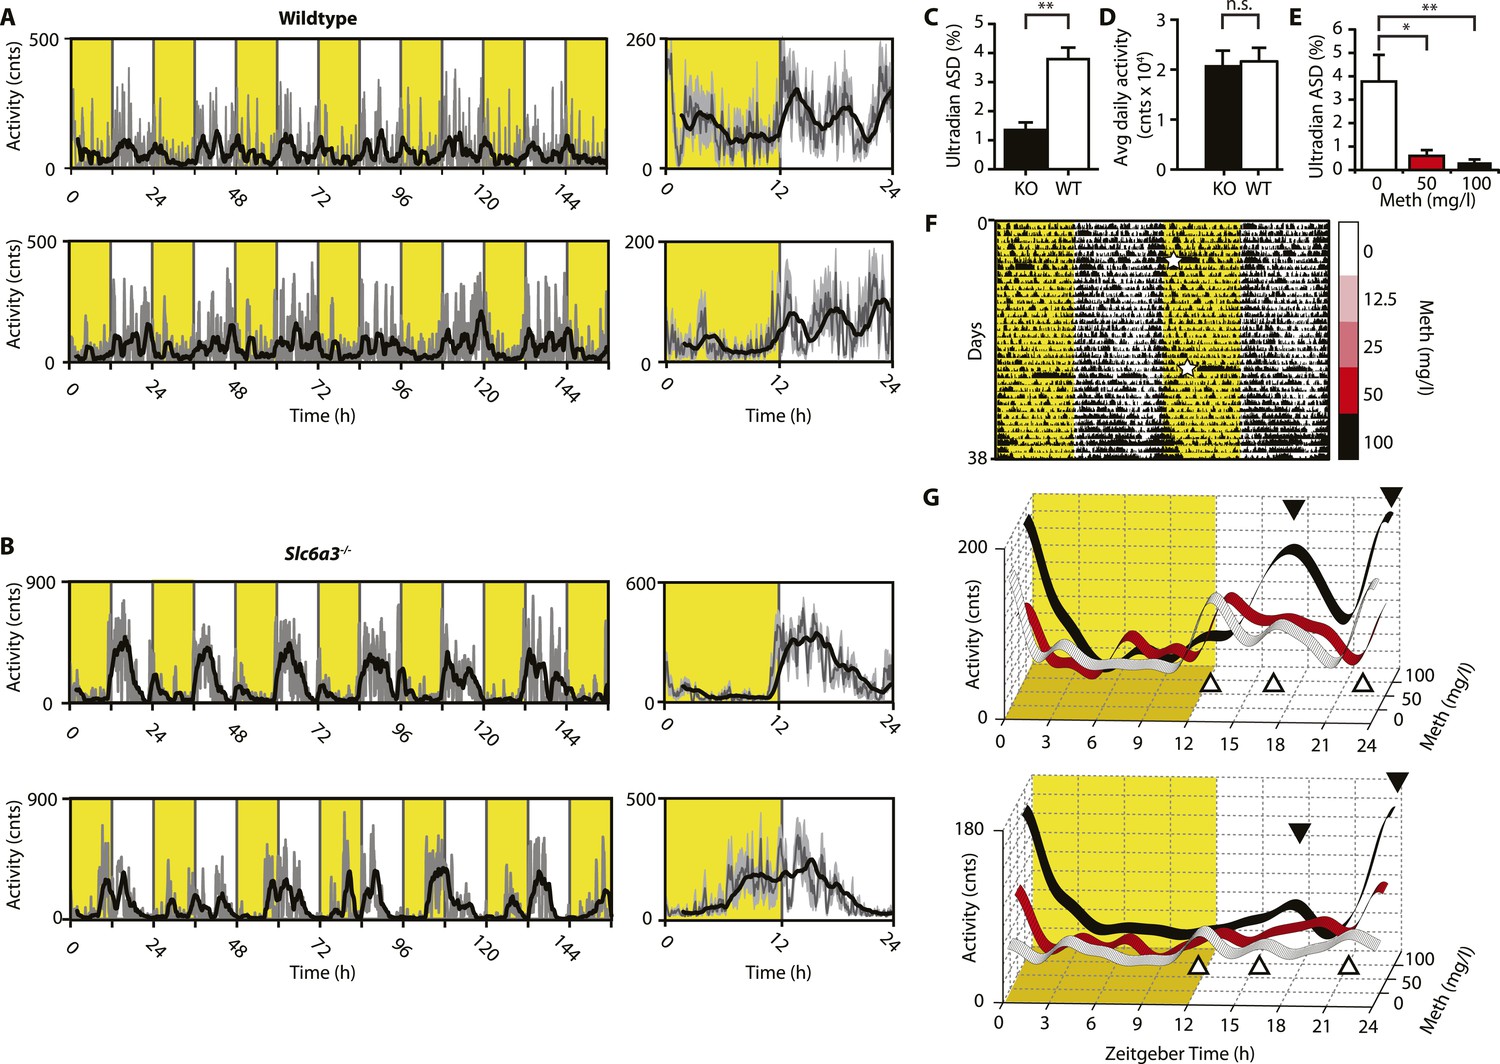
Ultradian activity in SCN-intact Slc6a3−/− mice and their wildtype littermates.
(A and B) Ambulatory activity recorded by telemetry implants across multiple days (left) and averaged over 24 hr (right). Traces represent 2-hr recursive smoothing (black) of the underlying raw DATa (dark grey; SEM envelope, light grey). Areas in yellow indicate lights on. (C) Amplitude spectral density in the ultradian range (2–8 hr) is significantly different between Slc6a3−/− mice and their wildtype littermates revealing a loss of the ultradian component (mean ± SEM; N = 10; F1,18 = 26.40, **p < 0.0001, ANOVA). (D) Although the temporal pattern of locomotion differs between genotypes there is no significant difference in daily activity averaged over multiple days (mean ± SEM; N = 10, F1,18 = 0.1793, ANOVA). (E–G) Addition of Meth to the drinking water of C57BL/6 mice lengthens the night-time activity bouts in a concentration-dependent manner. Averaged daily locomotor activity of individual mice at different Meth concentrations (G) derived from the time-span indicated by colored bars next to the representative actogram (F) and subjected to Butterworth filtering. The three night-time activity peaks before treatment (white triangles), transform to 2 peaks after exposure to the highest concentration (black triangles). The night-time bout lengthening is also reflected in the reduction of ultradian amplitude spectral density in the 1 to 5-hr range (E, mean ± SEM, N = 7; F2,20 = 8.08, p < 0.005, repeated measures ANOVA; *p < 0.05, **p < 0.01, post-hoc Bonferroni). White asterisks (in E) indicate cage changes.
Figure 5
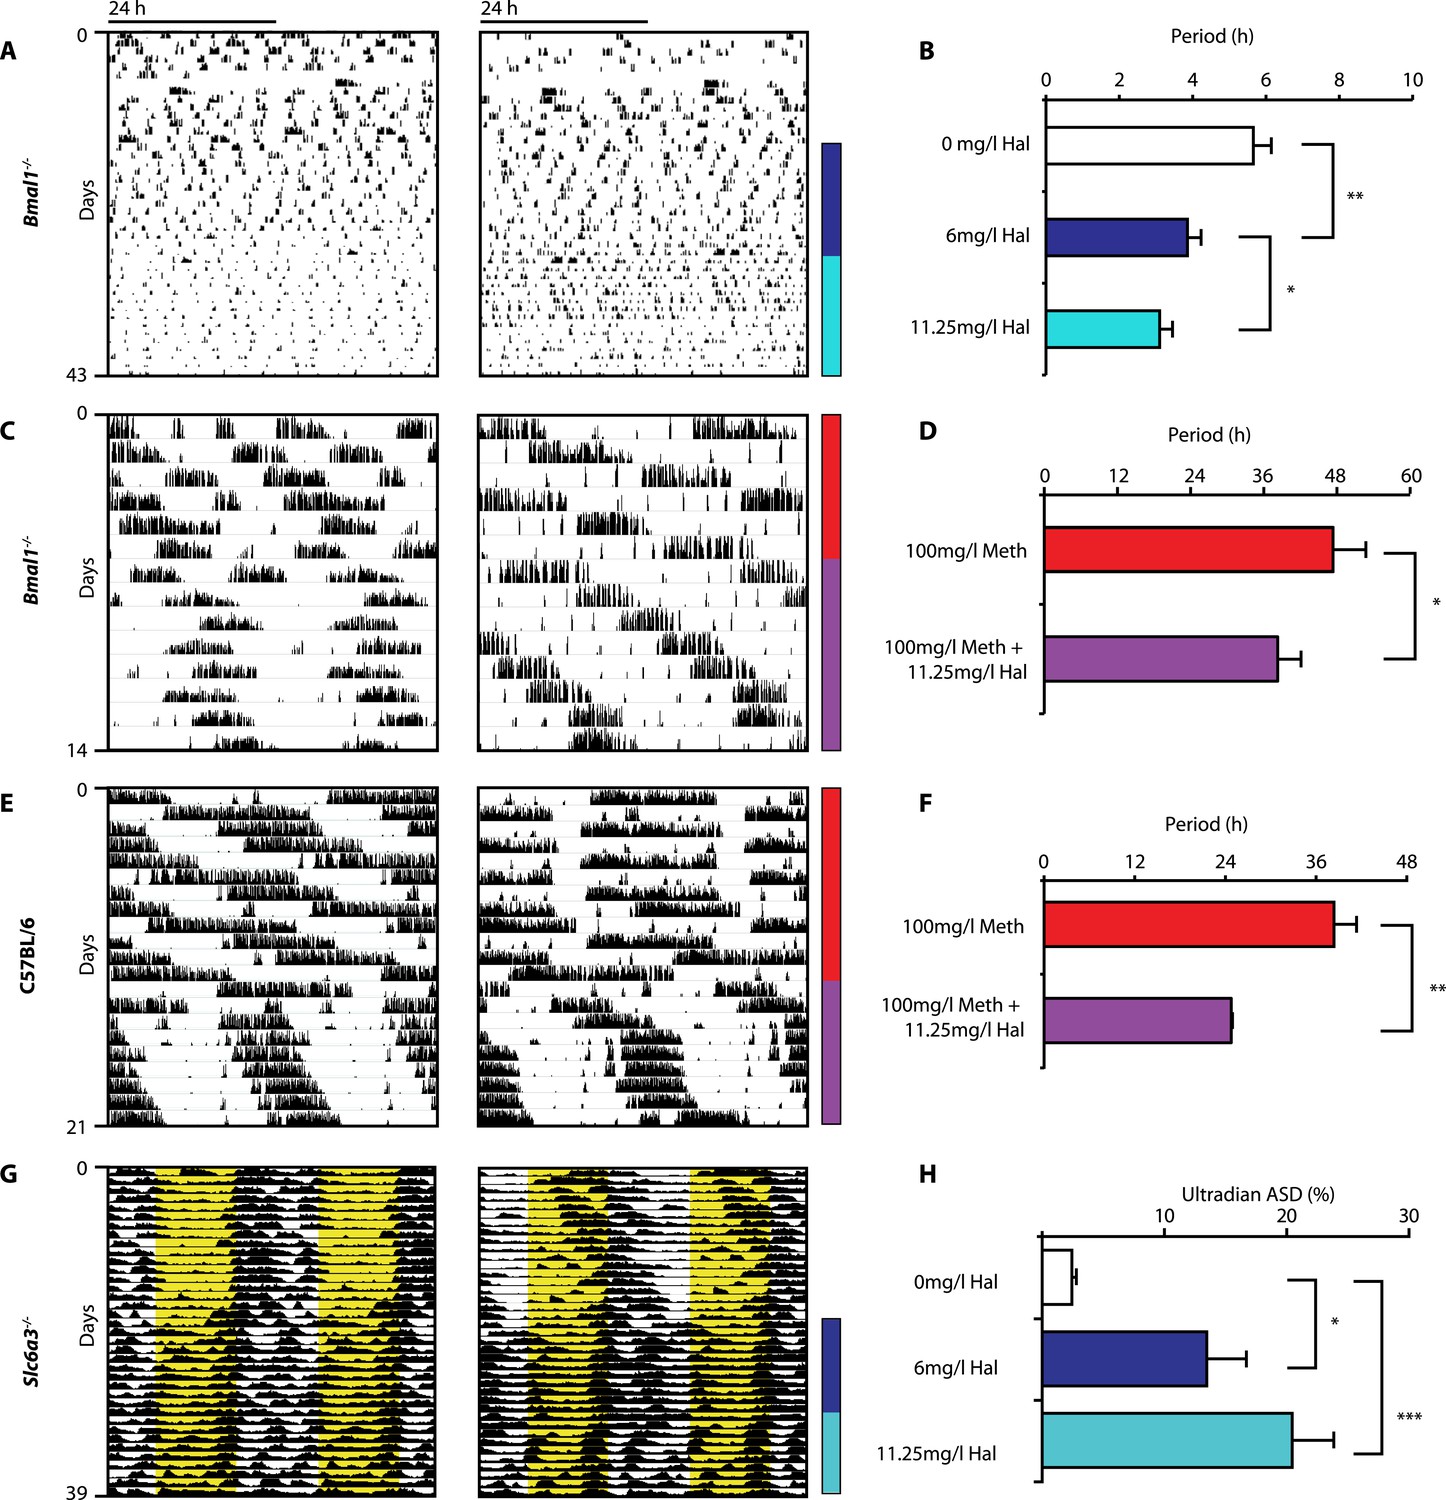
Haloperidol shortens circadian-clock-independent locomotor rhythms.
Representative actograms with Hal treatment periods indicated by colored bars (left); bar graphs indicate corresponding locomotor period (right). (A) Increasing concentrations of Hal provided in the drinking water gradually shortens the endogenous ultradian activity rhythms of Bmal1−/− mice in DD (B, mean ± SEM, N = 12; F2,10 = 14.36, p < 0.0001, repeated measures ANOVA; *p < 0.05 and **p < 0.01, planned comparison ANOVA). (C and E) Hal shortens the infradian rhythms in Meth-treated Bmal1−/− mice (D, mean ± SEM, N = 9; F1,8 = 2.357, *p < 0.05 ANOVA) and WT mice (F, mean ± SEM, N = 9; F1,8 = 3.525, **p < 0.01, ANOVA) in DD. (G) Hal treatment increases the frequency of temperature fluctuation in Slc6a3−/− mice under LD measured by telemetric implants. (H) Changes of amplitude spectral density in the ultradian range (2–8 hr) in response to increasing Hal concentrations (mean ± SEM; N = 8; F2,7 = 14.74, repeated measures ANOVA, *p < 0.05, ***p < 0.0005, post-hoc Bonferroni). For all experiments, periods are calculated based on the running wheel activity during the last 7 days of treatment at the indicated Meth/Hal concentration.
Figure 6 with 1 supplement
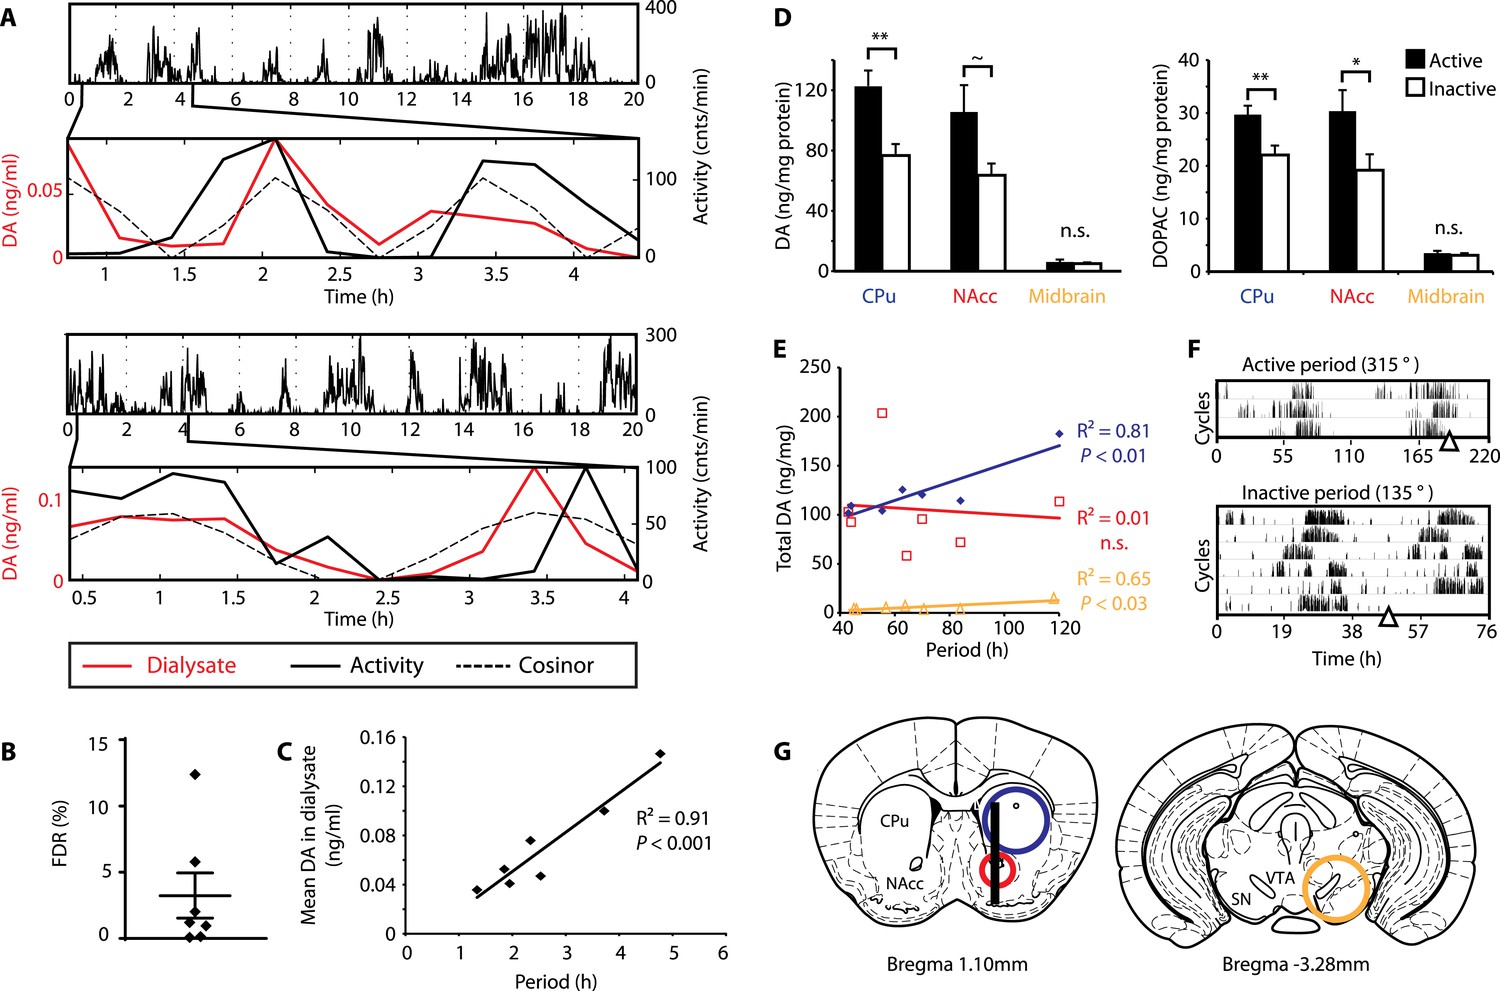
DA fluctuations correlate with ultradian locomotor behavior in Bmal1−/− mice.
(A) Two representative examples of in vivo striatal microdialysis in Bmal1−/− mice. Upper: locomotor activity as measured by beam breaks. Lower: DA dialysate concentration measured at 20-min intervals (red trace) plotted alongside the corresponding locomotor activity (solid black trace). Cosinor (dotted line) was computed from the 20 hr of locomotor activity following dialysate sampling. (B) False discovery rate of the fit between the DA profiles and corresponding cosinors (mean ± SEM, N = 7). (C) Linear regression analysis of period length vs mean DA concentration, dots representing individual animals. (D) Tissue punches of CPu, NAcc, and midbrain were analyzed for DA and DOPAC content in animals sacrificed during their active (■) vs their non-active (□) phase (mean ± SEM; active phase, N = 7, inactive phase, N = 6; *p < 0.05, **p < 0.01, ∼p = 0.066, ANOVA). (E) Linear regression for period vs DA content in animals sacrificed during the active phase revealed significant correlations for the CPu and midbrain. (F) Representative actograms displaying activity rhythms of Meth-treated Bmal1−/− mice used for tissue collection. Triangles indicate collection time points (in °), with locomotor activity bout onset set to 180°. (G) Illustrations of coronal mouse brain sections (Paxinos and Franklin, 2001) indicating position of the active membrane (black bar) and tissue punch placements (circles, colors correspond to labels in D and E).
Figure 6—figure supplement 1
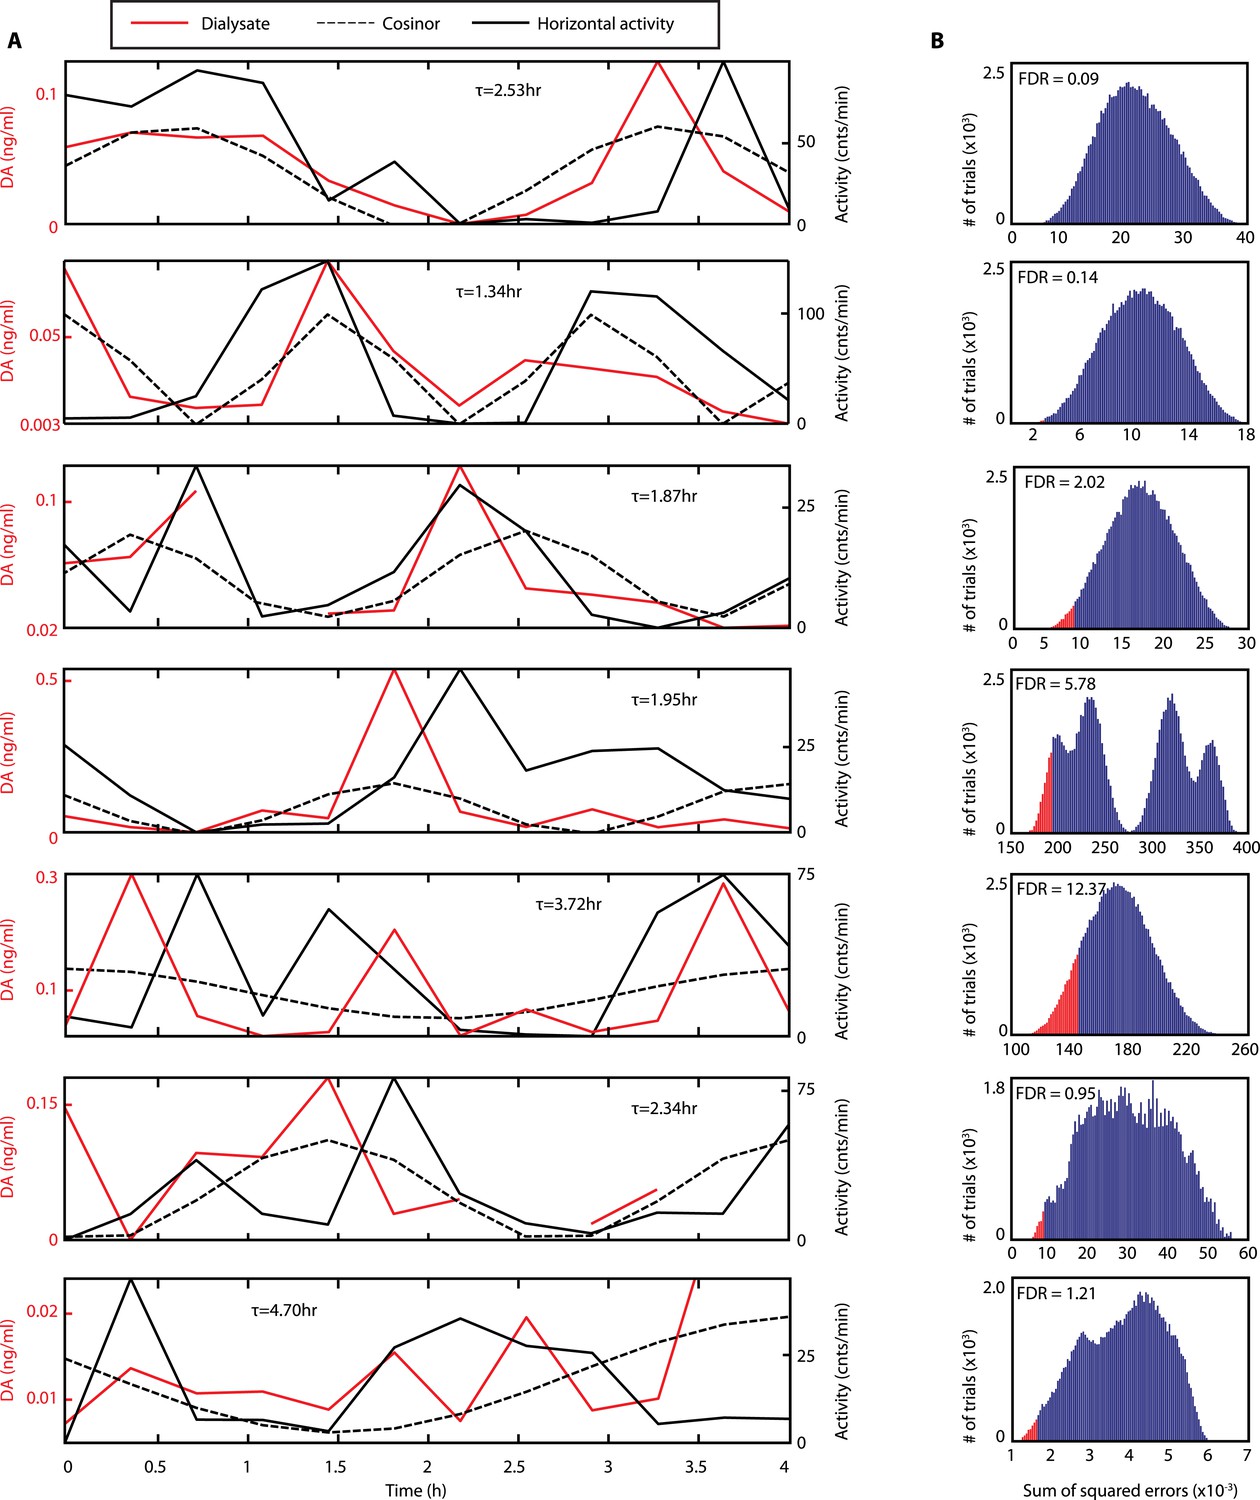
Rhythms of extracellular DA in the striatum of freely-moving Bmal1−/− mice.
(A) Individual records of striatal in vivo microdialysis showing DA dialysate concentrations (red), horizontal activity in 20-min bins (black) and the cosinor trace (dotted). τ indicates locomotor rhythm period computed from the 20 hr of horizontal activity recorded after dialysate collection. (B) Histogram plots showing the distribution of the summed square of errors values for the fit between the cosinor and the DA profile after random permutation of the latter (100,000 operations). False discovery rate is calculated by determining the percentage of permuted profiles which fit the cosinor as well or better than the experimentally determined DA profile (highlighted in red).
Figure 7 with 1 supplement
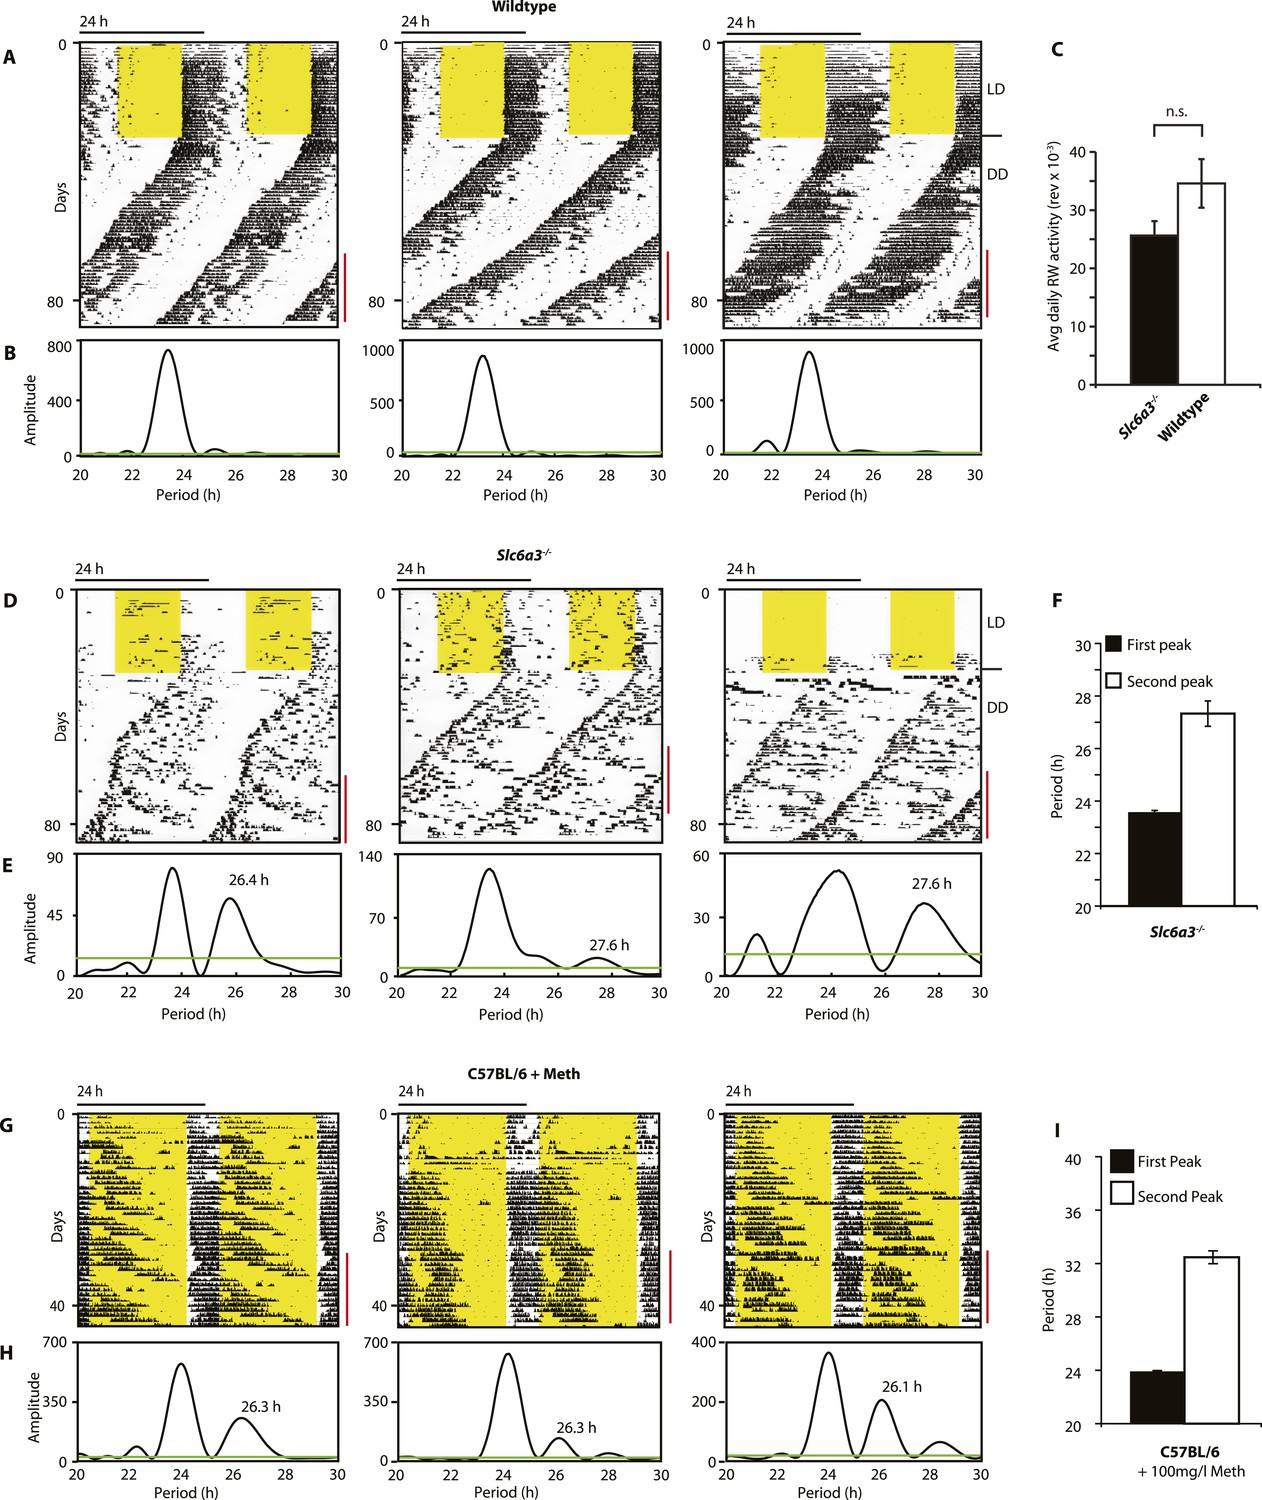
Slc6a3−/− mice show a second rhythmic locomotor activity component.
Representative actograms displaying daily running wheel activity of Slc6a3+/+ (A), Slc6a3−/− mice (D) and C57BL/6 mice on Meth (G). (B, E and H) Lomb-Scargle periodograms generated from the time-span indicated by red bars, in (A, C, G), respectively. (C) There is no significant difference between genotypes in daily activity averaged over the time-span of analysis (mean ± SEM; N = 6, F1,10 = 1.848, ANOVA) (F and I) Average periods of the highest 2 periodogram peaks for Slc6a3−/− mice (E, mean ± SEM, N = 6) and C57BL/6 mice on Meth (H, mean ± SEM, N = 9, Meth-treatment started on day 1 of the recordings). Areas in yellow indicate lights-on. Green line in the periodograms indicates the confidence threshold for rhythmicity (α = 0.01).
Figure 7—figure supplement 1
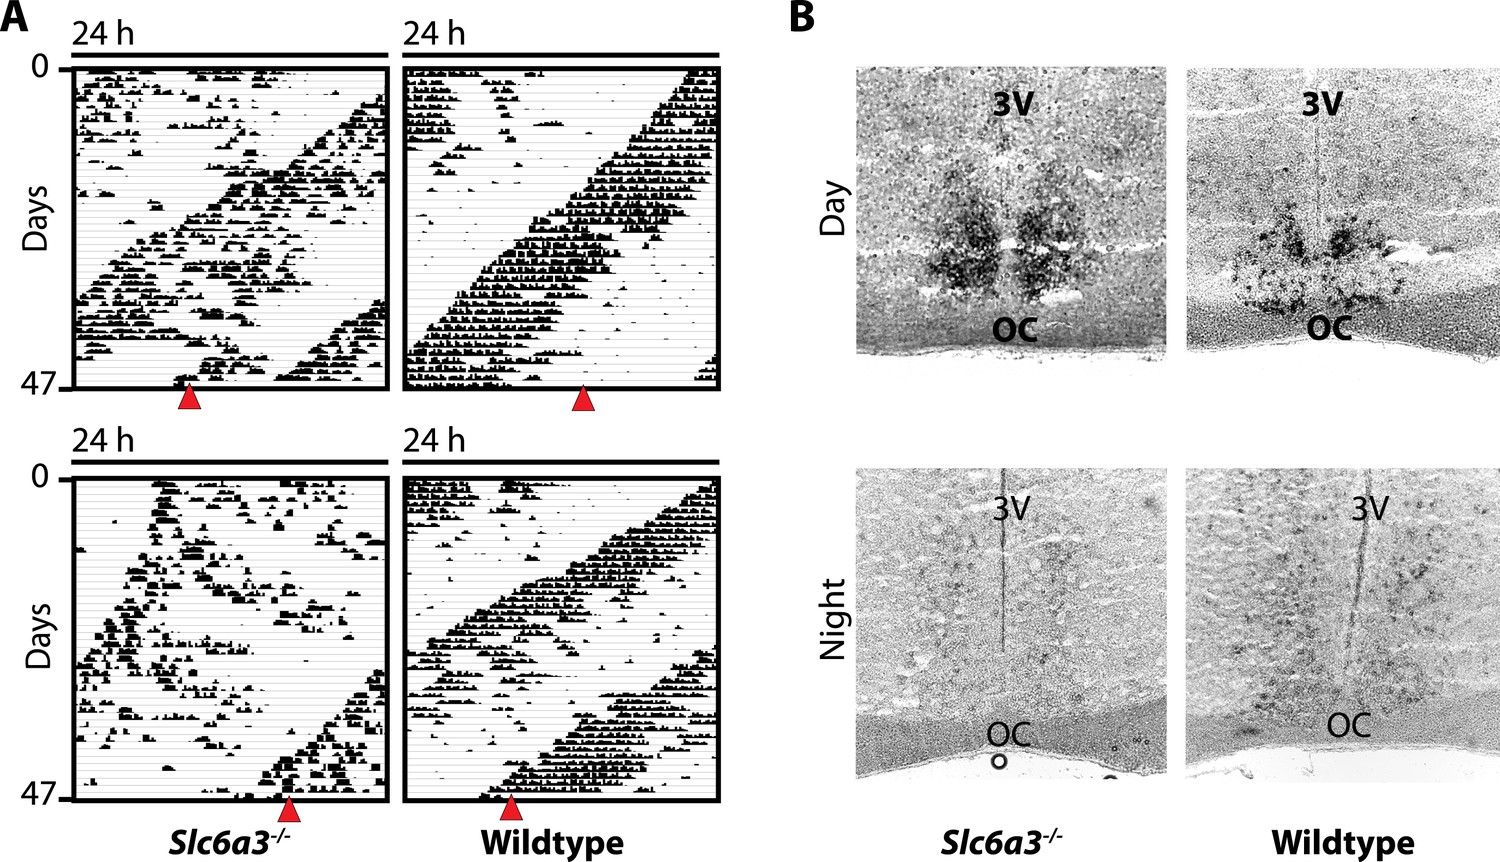
The SCN of Slc6a3−/− mice is unperturbed.
(A) In situ hybridization indicates normal expression of Per1 in the SCN of Slc6a3−/− mice with strong staining of the SCN in the subjective day (DAY) and barely detectable probe signal in the subjective night (NIGHT), a pattern similar to wildtype SCN. (B) Subjective day and night were determined based on running wheel records using the onset of the circadian alpha band. Red triangles indicate time of sacrifice. 3V, third ventricle; OC, optic chiasm.
Figure 8 with 1 supplement
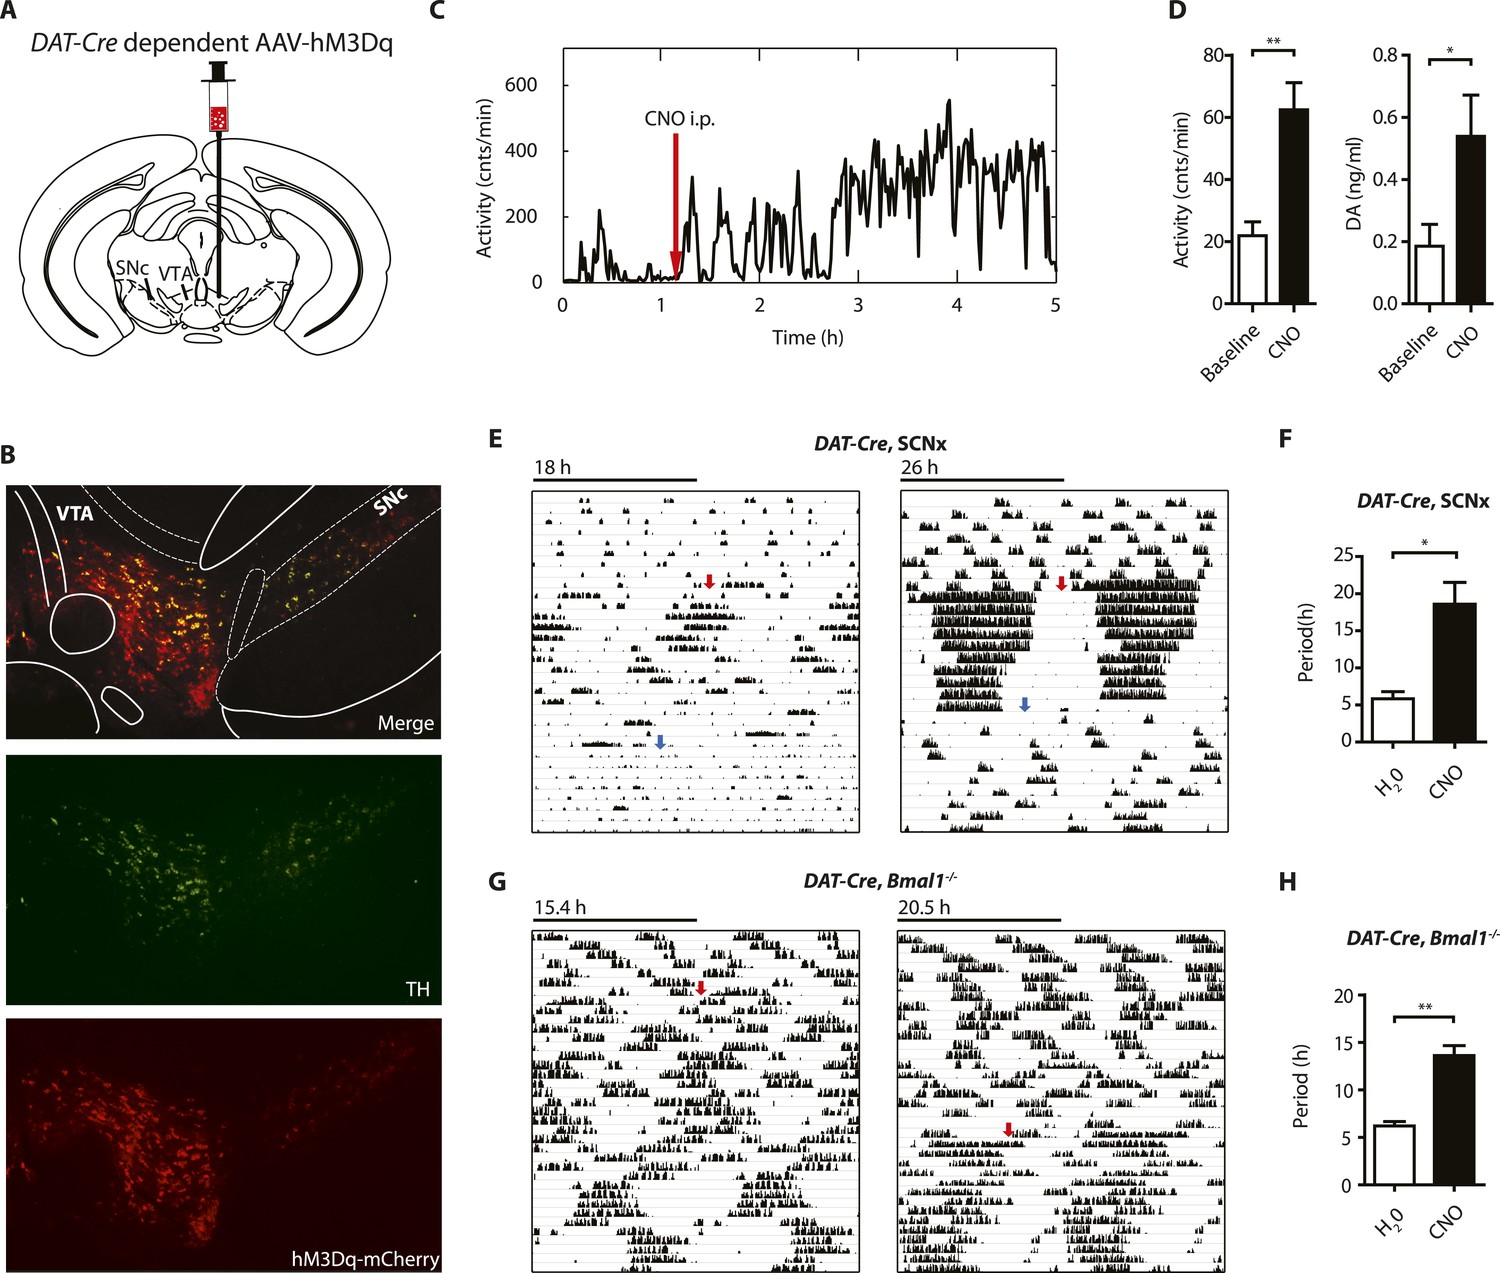
Chemogenetic activation of midbrain DA neurons lengthens ultradian locomotor period.
(A) AAV-DIO-hM3Dq-mCherry was stereotaxically and bilaterally delivered into the VTA/SN region of DAT-Cre transgenic mice as indicated. (B) Representative immuno-fluorescent image of the ventral midbrain from a virus-injected and behaviorally responsive mouse showing extensive co-expression of the mCherry fusion-tag in TH-positive cells of the midbrain. (C) Locomotor response to CNO (red arrow, 1 mg/kg body weight i.p.) of a representative, AAV-hM3Dq transduced DAT-Cre mouse undergoing microdialysis. (D) 20min- binned locomotor activity and extracellular striatal DA content (20 min) of AAV-hM3Dq transduced mice 1 hr prior (Baseline) and 2 hr after CNO injection. Mice were implanted with a striatal microdialysis probe and DA content was measured as in Figure 6A (mean ± SEM; N = 3, *p < 0.05, **p < 0.01, paired t-test). (E–H) Representative actograms of AAV-hM3Dq transduced DAT-Cre, SCNx (E) and DAT-Cre, Bmal1−/− mice (G). Switch to CNO-containing drinking water (7.5 mg/l) is indicated by red arrow. Blue arrow marks return to regular water (in E). Animal activity is plotted modulo according to the period measured during the last 7 days of CNO treatment. Periodogram analysis reveals CNO-dependent period lengthening in both DAT-Cre, SCNx (F, mean ± SEM; N = 6, F1,5 = 3.68,*p < 0.05, ANOVA) and DAT-Cre, Bmal1−/− (H, mean ± SEM; N = 11; F1,10 = 20.48, **p < 0.0001, ANOVA) mice. VTA, ventral tegmental area; SNc, substantia nigra pars compacta.
Figure 8—figure supplement 1
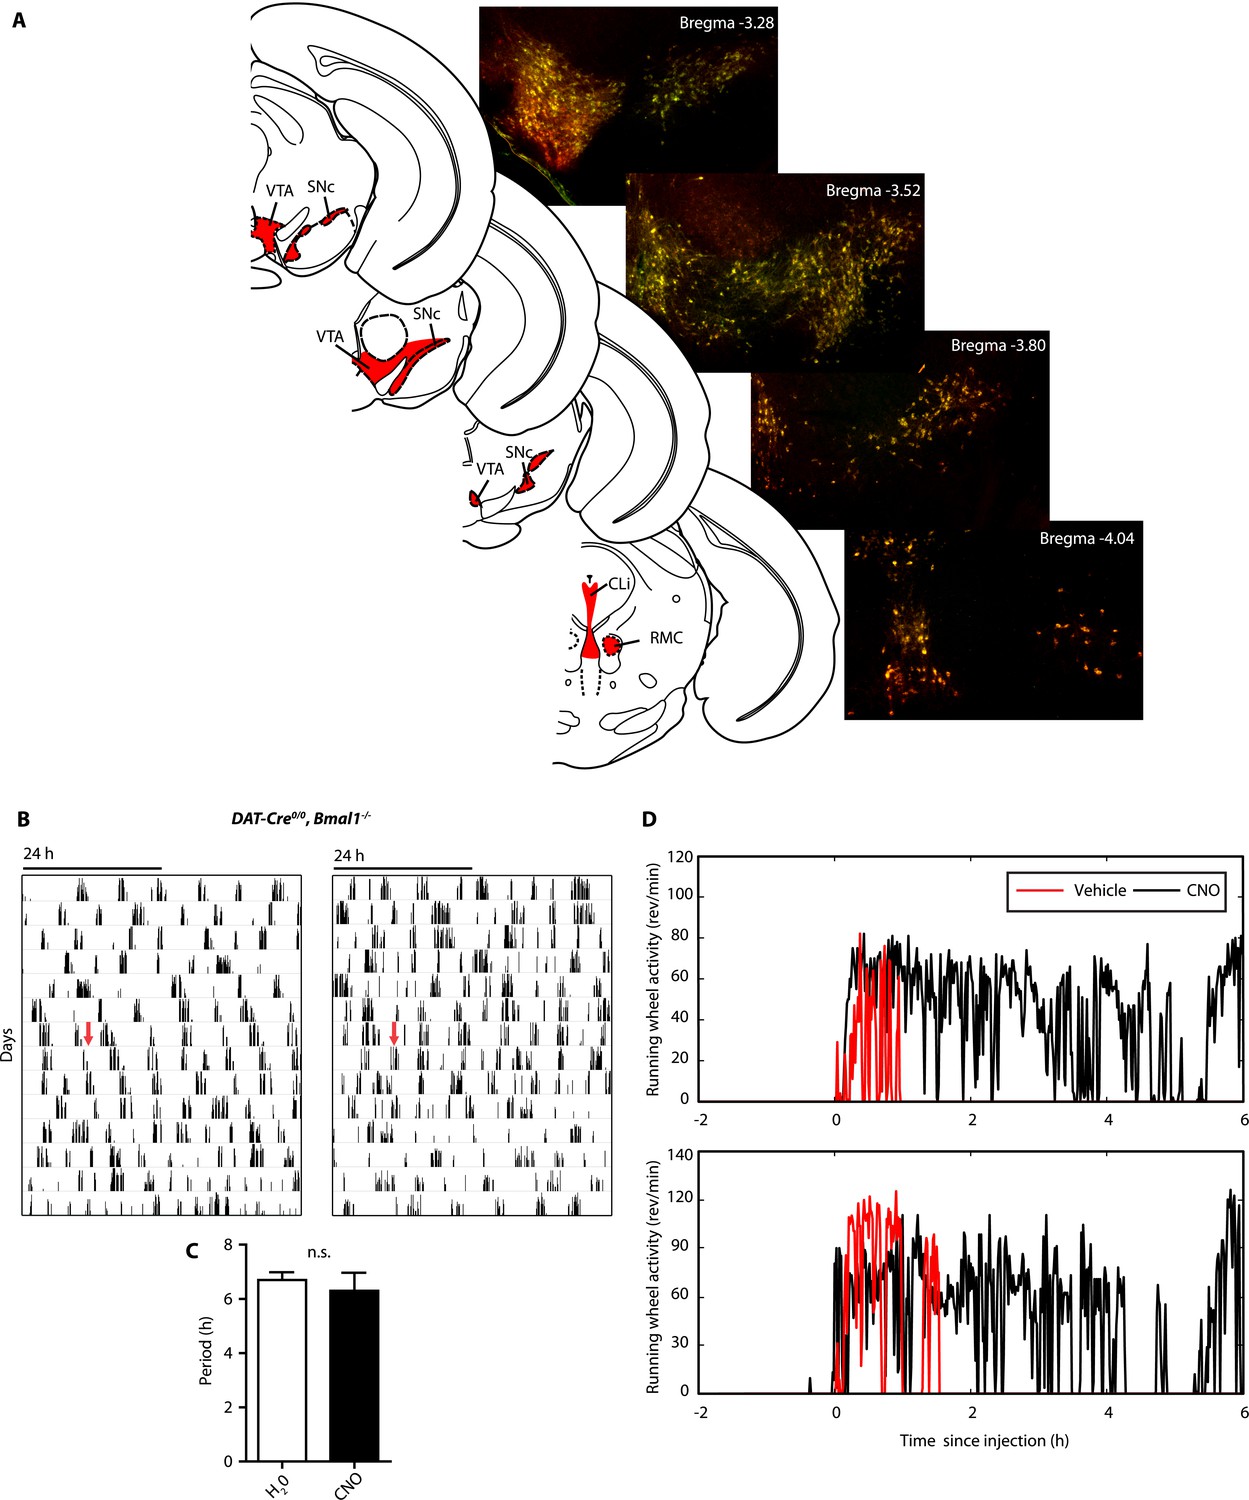
AAV-h3MDq targeting of DA neurons.
(A) Midbrain expression pattern of mCherry and tyrosine hydroxylase (TH) in DAT-Cre mice upon bilateral injection with AAV-DIO-h3MDq-mCherry. Shown are immunofluorescent images of representative sections of CNO-responsive mice that were stained with dsRed (red) and TH (green) antibodies demonstrating comprehensive h3MDq-mCherry expression in TH neurons. Corresponding illustrations indicate sites of viral expression (red). (B) AAV-h3MDq injected DAT-Cre0/0, Bmal1−/− mice which lack the DAT-Cre transgene do not exhibit a change in ultradian activity when exposed to CNO. Shown are representative actograms of running wheel activity in DD. Red arrow indicates switch to CNO (7.5 mg/l) containing drinking water. (C) Periodogram analysis indicates no significant difference in locomotor period between pre and post-treatment (mean ± SEM; N = 7, F1,6 = 0.401, ANOVA). (D) Acute locomotor response (running wheel activity) of AAV-h3MDq injected DAT-Cre mice to midday (ZT 6) i.p. injections of either vehicle (0.5% DMSO in 0.9% Saline) or CNO (1 mg/kg b.w. in vehicle).VTA, ventral tegmental area; SNc, substantia nigra pars compacta; Cli, caudal linear nucleus of the raphe; RMC, red nucleus, magnocellular part.
Figure 9
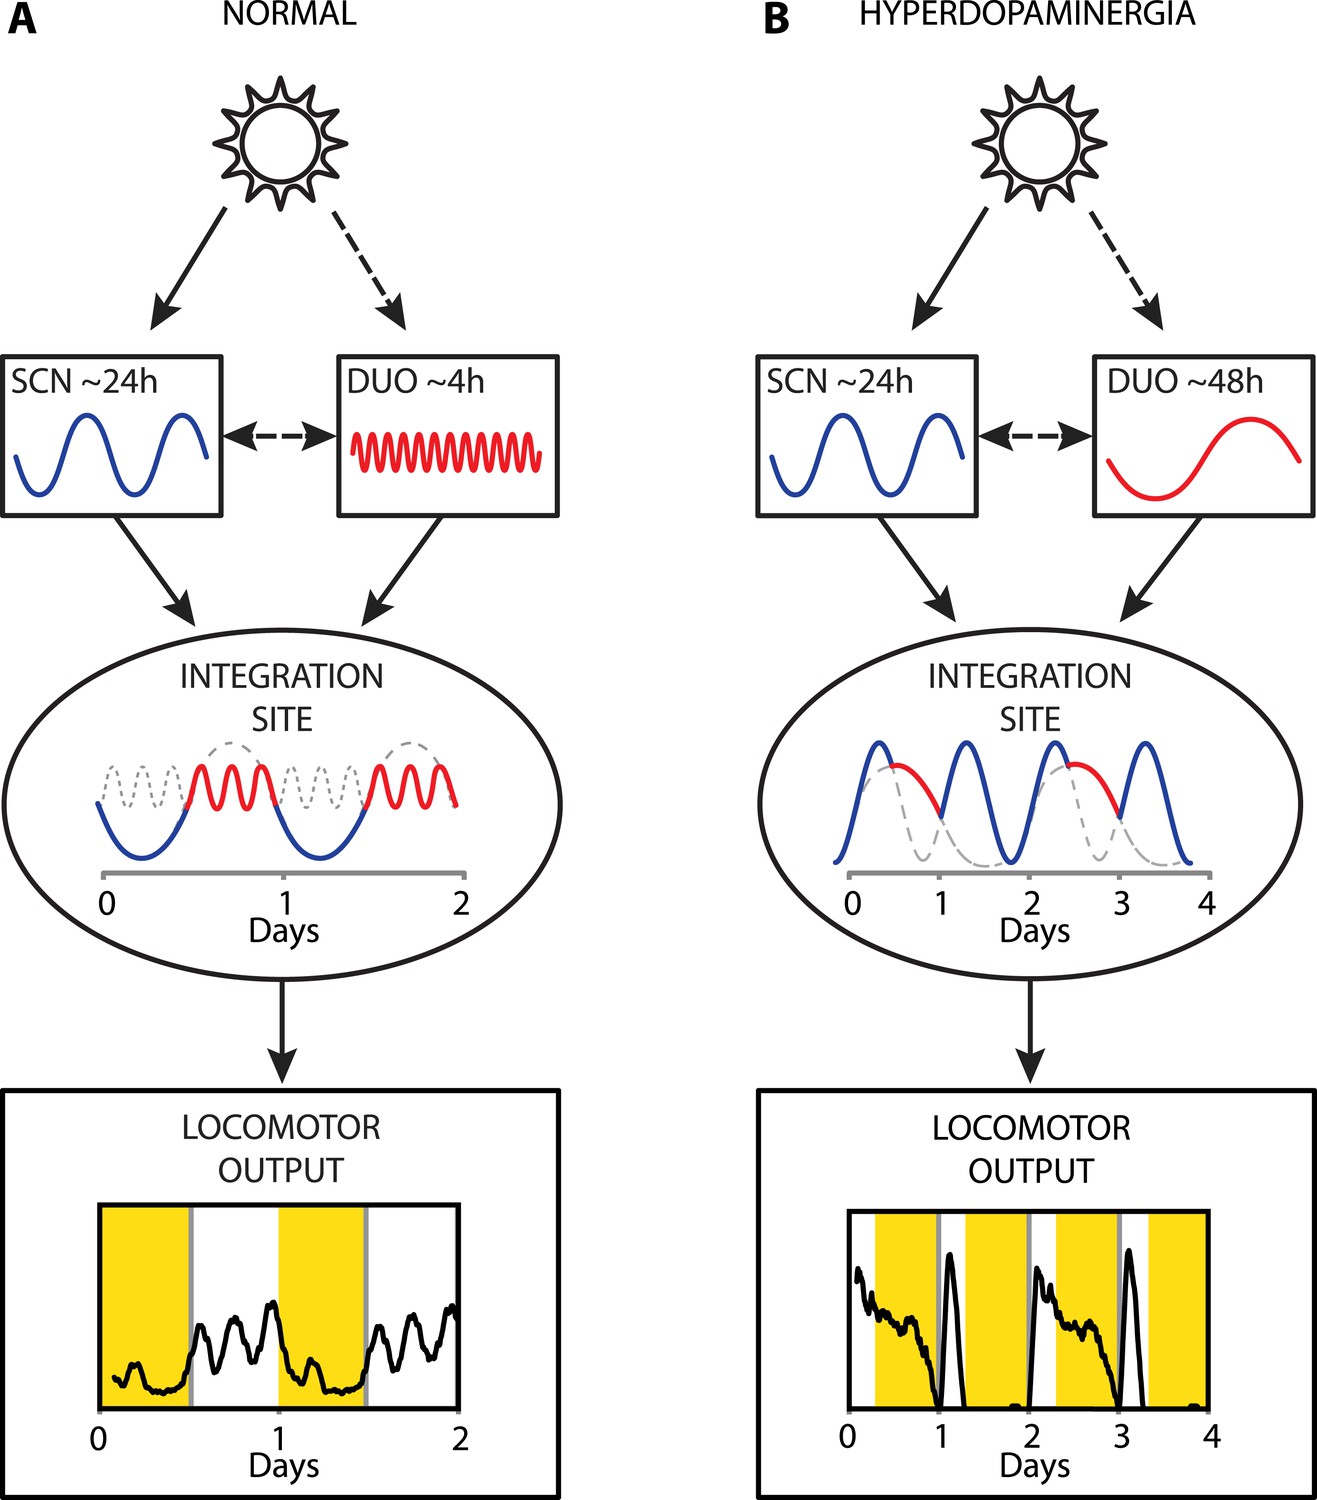
Proposed model of circadian and ultradian oscillator output integration to govern daily locomotor behavior.
(A) Light input entrains the circadian (SCN) and (indirectly) the ultradian (DUO) oscillators creating a stable phase relationship. Their rhythmic outputs, upon integration at a common downstream effector, generate the daily pattern of locomotor activity. (B) Under conditions of high DA tone (e.g., DAT elimination or Meth-treatment), DUO period lengthens, leading to a second, separate activity rhythm. This rhythm either free-runs (see Figure 7D,G) or phase locks with the SCN pacemaker by adopting a subharmonic, that is, 48-hr period, as frequently observed upon Meth treatment. Representative output plots show average activity of individual mice computed from 8 days of ambulatory activity (A) or 14 days of running wheel activity under Meth treatment (B).
Download links
A two-part list of links to download the article, or parts of the article, in various formats.
Downloads (link to download the article as PDF)
Open citations (links to open the citations from this article in various online reference manager services)
Cite this article (links to download the citations from this article in formats compatible with various reference manager tools)
A highly tunable dopaminergic oscillator generates ultradian rhythms of behavioral arousal
eLife 3:e05105.
https://doi.org/10.7554/eLife.05105


