Genomic mosaicism with increased amyloid precursor protein (APP) gene copy number in single neurons from sporadic Alzheimer's disease brains
- Dorris Neuroscience Center, The Scripps Research Institute, United States
- University of California, San Diego, United States
Figures
Figure 1

Methodologies used in assessing genomically mosaic AD.
(A) Neuronal nuclei were isolated from the prefrontal cortex and cerebellum of postmortem human brain (see ‘Materials and methods’ for samples used) as described (Westra et al., 2008). (B) Nuclear DNA was stained with propidium iodide (PI) and DNA content was quantified using flow cytometric analysis. (C) APP copy number variations were analyzed in small populations of nuclei (∼75 genomes) using custom primers for exon 14 of APP. (D) Single-cell qPCR assessed APP copy number variations in individual neuronal nuclei via TaqMan probes and a modified Biomark integrated fluidic chip system (Fluidigm Corporation, South San Francisco). (E) FISH paints against the whole q arm of chromosome 21 and a point probe against a region on the q arm of 21 (21q22.13-q22.2) were used to double-label and call aneusomies in AD samples. (F) Peptide nucleic acid (PNA) FISH was combined with super resolution microscopy for threshold detection of APP copy number above ∼2 occurring at a single locus.
Figure 2 with 2 supplements

AD cortical nuclei show increased DNA content variation (DCV) by flow cytometry.
(A) Histogram displaying gating parameters used in sorting ‘high’ and ‘low’ DNA content populations for validation of DNA content. (B) Validation of DNA content analyses using semi-quantitative MDA whole-genome amplification (WGA) on ‘high’ and ‘low’ DNA content populations of 1000, 500, and 100 nuclei. (C and D) Representative DNA content histograms for lymphocytes (LYM), AD cerebellum (CBL), and AD prefrontal cortex (CTX). Each colored histogram represents a separate sample in each set; CTX and CBL samples are from paired brains. Chicken erythrocyte nuclei (CEN) were used as internal calibration controls. (E) Representative orthogonal view of DNA content vs forward scatter width (FSC-W). For each brain sample, the area to the right of the vertical line indicates a DNA content increase of the population of nuclei. AD-6 CTX is a representative right-hand peak shift and AD-7 is a representative right-hand shoulder (see Figure 3A for more examples). (F) DNA content changes for all human LYM, ND, and AD brain samples examined (AD CTX N = 32, AD CBL N = 16, LYM N = 15 [20 meta analysis], ND CTX = 21 [36 meta analysis], ND CBL = 11 [12 meta analysis]). Red bars denote average for each group relative to lymphocytes. Averages are as follows (including metadata from Westra et al. (2010)): AD CTX 8.219%; AD CBL −0.1104%; LYM −0.2915%; ND CTX 2.239%; ND CBL −3.358%. (G) DNA content changes of the current study (AVOVA p < 0.0001). (H) DNA content changes of the current study combined with metadata from Westra et al. (2010) (ANOVA p < 0.0001). (I) Comparison of mean coefficient of variation (CV statistic from FlowJo of the population, included metadata from Westra et al., 2010) demonstrates that there is an average increase in the variation of AD samples (ANOVA p < 0.0001). *p = 0.05, **p = 0.01, ***p = 0.001, ****p < 0.0001, See Figure 2—source data 1 for exact p values. See Figure 2—figure supplement 1 for age, PMI and Braak score correlations. See Figure 2—figure supplement 2 for control of nuclear size analysis.
-
Figure 2—source data 1
DNA Index (DI) and percent change values and statistics.
- https://doi.org/10.7554/eLife.05116.005
Figure 2—figure supplement 1
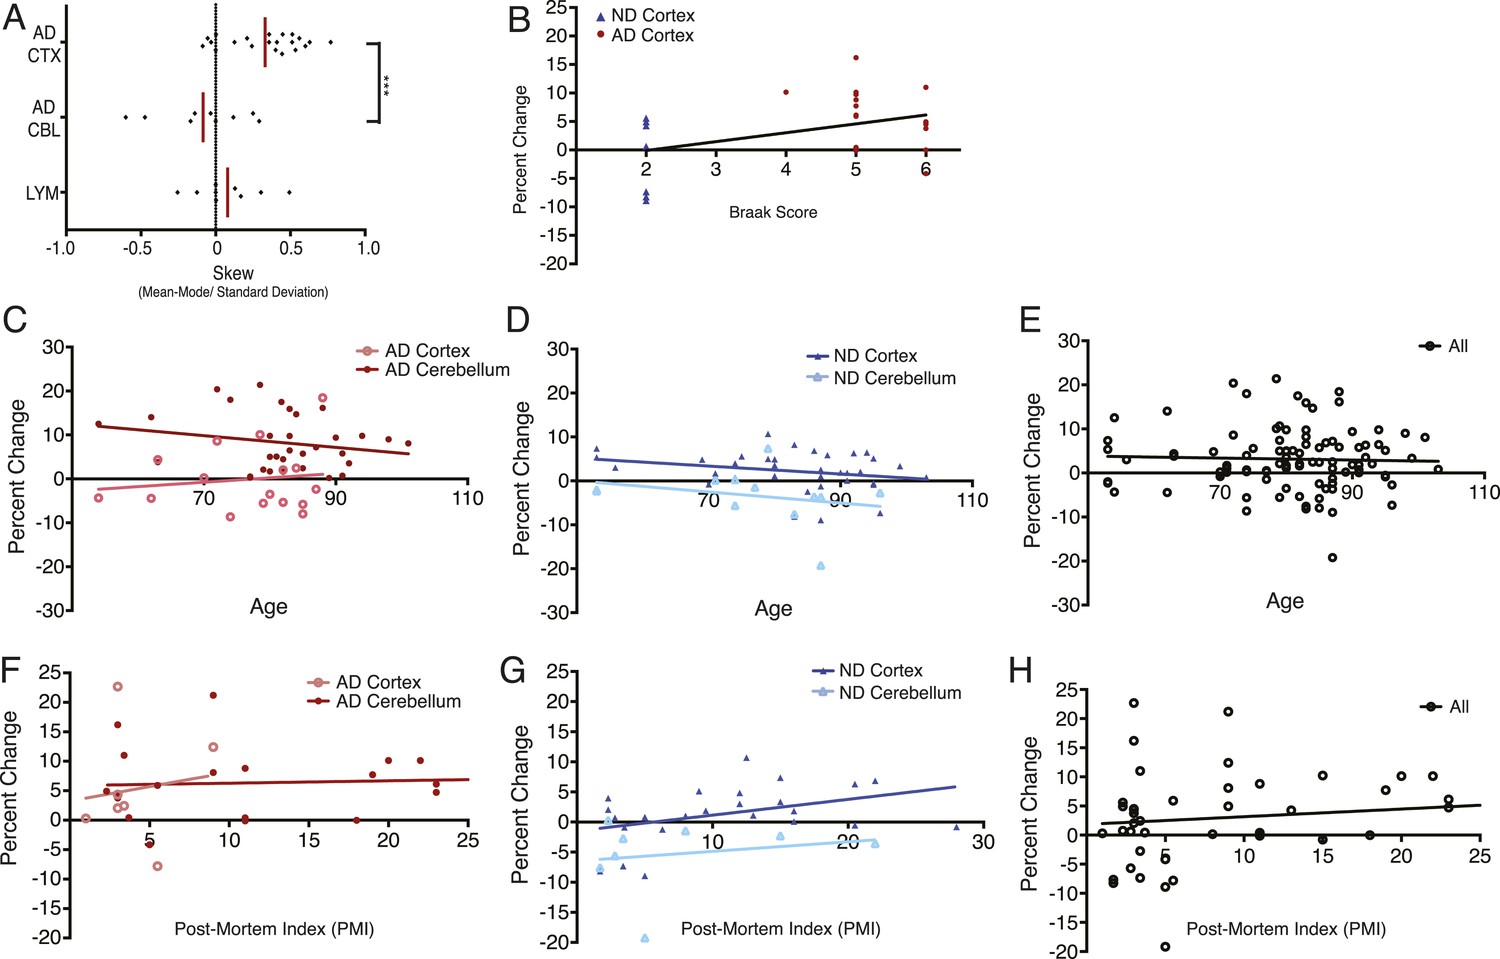
DNA content shows no correlation with age or post-mortem index (PMI).
(A) Comparison of mean skew values for each sample group, skew determined as: (Mean − Mode/Standard Deviation of the diploid DNA content peak). (B) No correlation was observed between DNA content and Braak score. (C–E) No correlation was observed between DNA content and age across all brains analyzed. (F–H) No correlation was observed between DNA content and post-mortem index across all brains analyzed.
Figure 2—figure supplement 2
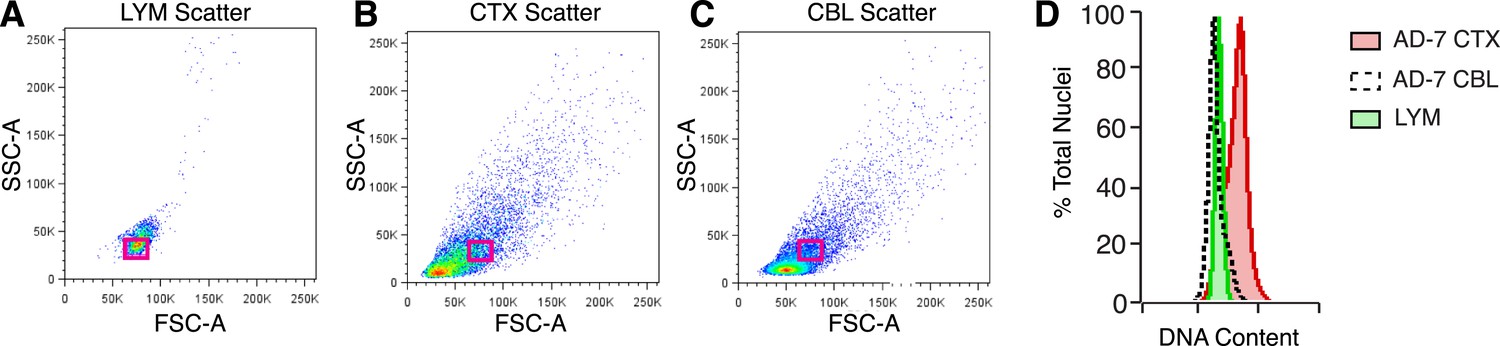
Analysis of nuclear size and DNA content.
(A–C) Representative flow cytometry scatter plots of nuclei. (A) Lymphocytes (LYM), (B) CTX nuclei, (C) CBL nuclei. (D) Overlay of red boxes shown in (A–C), demonstrating that cortical nuclei similar in size to LYM and CBL consistently display a DNA content shift.
Figure 3
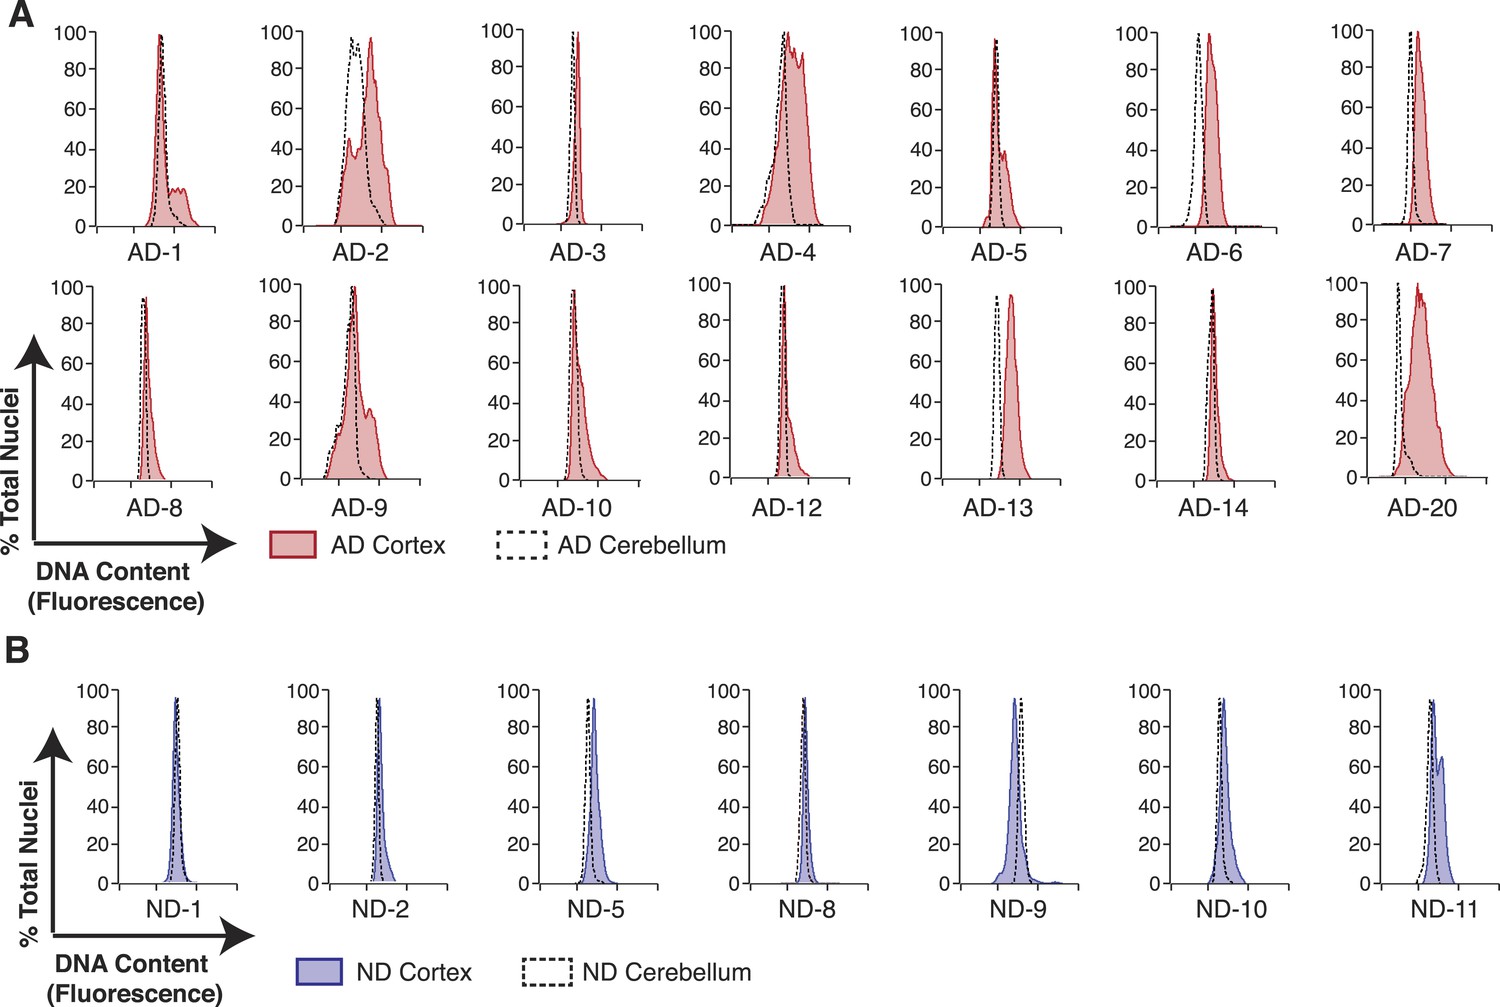
Pairwise DNA content analyses in AD cortical nuclei vs AD cerebellum.
(A) Pairwise analysis of overlaid DNA content histograms (CTX = solid red, CBL = black dashed lines) in the same AD individual (each graph represents a unique AD individual). (B) Pairwise analysis of overlaid DNA content histograms (CTX = solid blue, CBL = black dashed lines) in the same ND individual.
Figure 4
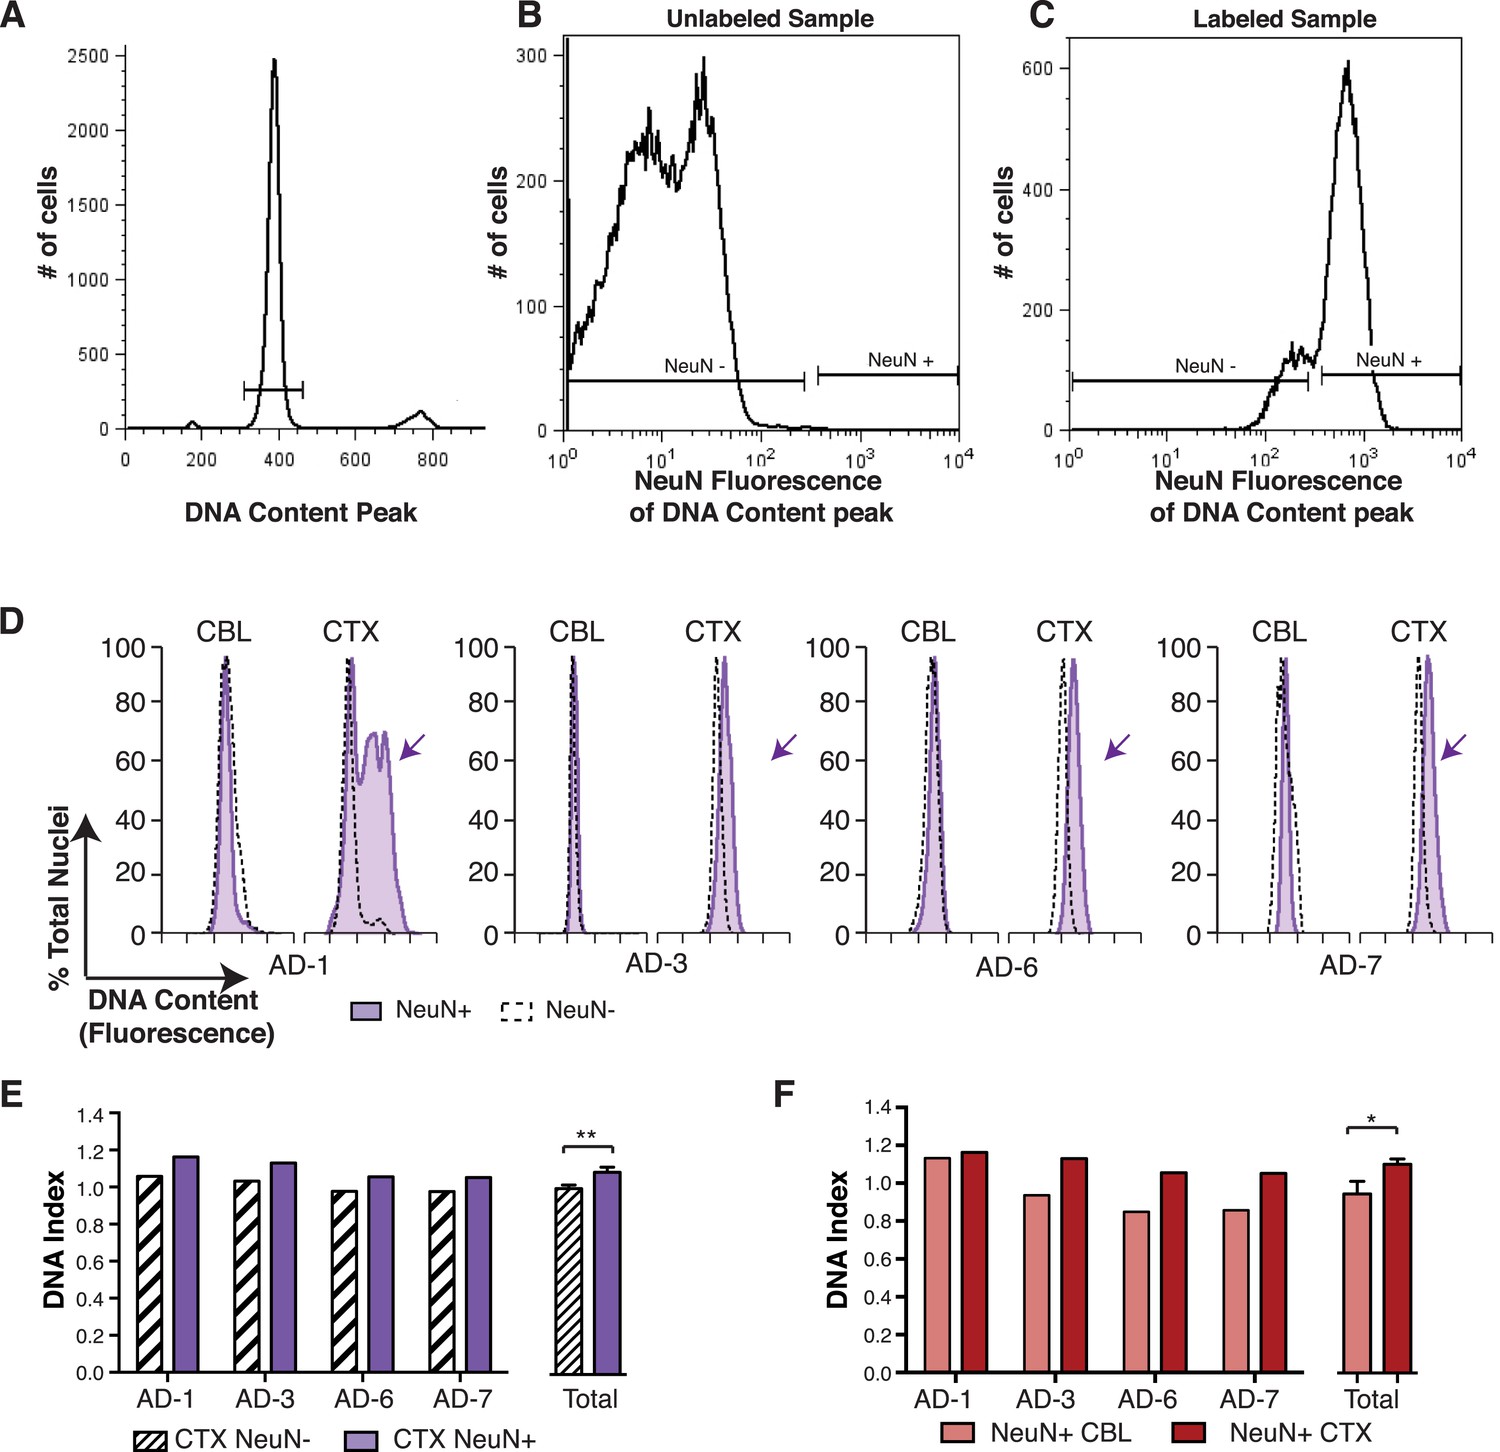
DNA content increases observed in AD cortical nuclei are attributable to neurons.
(A–C) The gating procedure used for NeuN-positive flow cytometry analysis. (A) DNA content peak for identified nuclei. (B) A sample of unlabeled neuronal nuclei that display no NeuN-positive signal. (C) Selection for NeuN-positive nuclei for downstream analysis. (D) DNA content histograms of four AD samples displaying NeuN-positive nuclei (solid purple) vs NeuN-negative nuclei (black dashed line). NeuN-positive populations display distinct cortical histograms with prominent right-shifted peaks (arrows). (E) Comparison of DNA index (DI) increases from NeuN-positive nuclei (solid purple) vs NeuN-negative nuclei (black dashes) from AD CTX samples. NeuN-positive nuclei (DI = 1.10) showed an average gain of 9% over NeuN-negative nuclei (DI = 1.01), **p = 0.0011. (F) Comparison of DNA content in NeuN-positive nuclei from AD CTX (DI = 1.10) (red) vs AD CBL (DI = 0.94) (pink) from the same individual; CTX nuclei displayed a 15.6% gain over CBL nuclei, *p = 0.0335. Statistics are paired two-tailed t-test. Bars indicate ± SEM.
Figure 5 with 1 supplement

Mosaic amplification of the APP locus in small cohorts of AD cortical neurons unrelated to trisomy 21.
(A) Comparison of relative copy number of APP in CBL and CTX fractions from six AD brains. APP locus-specific amplification was determined relative to reference gene SEMA4A; paired CBL nuclei were used as a calibrator sample for each brain, normalized to 2.00 for a diploid cell. Differences in ΔΔCt ± SEM of APP in the cortex vs cerebellum were assessed in each individual using an unpaired, two-tailed t-test (****p = 0.0001, *p = 0.0165, *p = 0.0489) (B) Comparison of relative copy number of APP in CBL and CTX fractions from 4 non-diseased brains. (C) Average relative copy number in non-diseased vs AD brains. Control genes and DS individuals were also examined (Figure 5—figure supplement 1). (D–J) FISH strategy of chromosome 21 counting through simultaneous labeling using chr 21 q arm ‘whole’ chromosome paint (WCP, green) and chr 21 regional FISH probe for 21q22.13-q22.2 (red) (see Figure 5—source data 1 for raw counts). (D and E) The ability to detect aneuploidy was validated using interphase nuclei from a human trisomy 21 brain, where three regional spots (red, encompassing the APP gene) were seen, despite WCP spatial variation (see also Rehen et al. (2005)). (F–I) Chromosome 21 aneusomy was examined in prefrontal cortical nuclei. Examples of chr 21 (F) monosomy, (G) disomy, (H) trisomy, and (I) tetrasomy (please note tetrasomy is not an example of aneuploidy). (J) Quantification of individual FISH signals showed no significant differences in monosomy, disomy, trisomy, or tetrasomy. 5 control brains and 9 AD brains were used. At least 450 nuclei were quantified per brain sample. Scale bar = 10 um. 4974 total nuclei examined.
-
Figure 5—source data 1
Raw dual point-paint probe FISH counts.
- https://doi.org/10.7554/eLife.05116.011
Figure 5—figure supplement 1
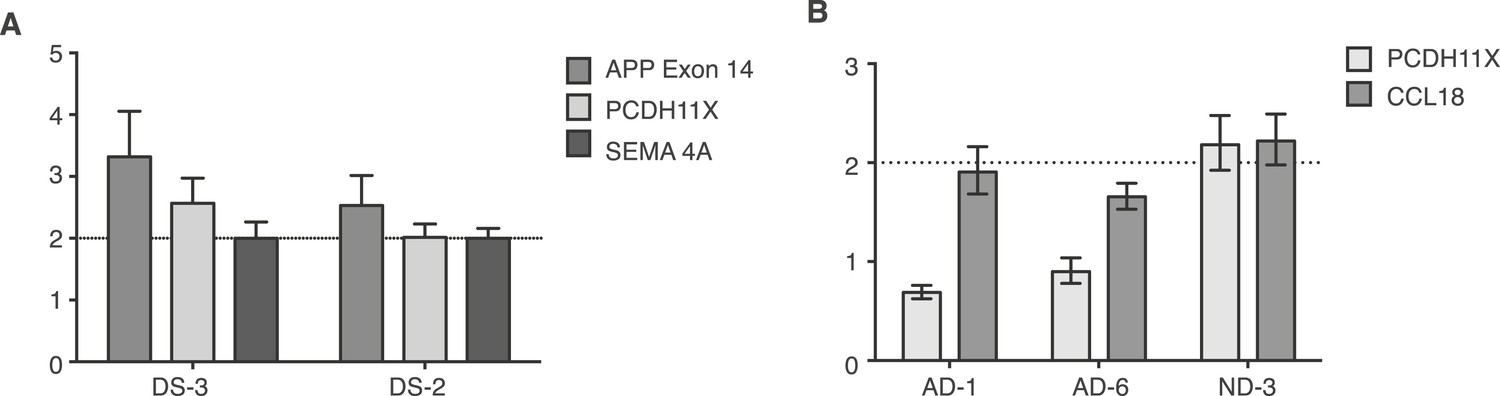
Controls for small population qPCR.
(A) Reference genes validated in small population qPCR via examination of APP exon 14 in Down Syndrome (DS) nuclei as a positive control. (B) Representative males (AD-1 and AD-6) displayed reduced copy number of PCDH11X, a gene located on the X chromosome, while a representative female demonstrates two copies of PCDH11X and CCL18, a second single copy control gene.
Figure 6 with 1 supplement

Mosaic APP locus amplification in single neurons from AD brains.
(A) Single nuclei relative copy numbers for exon 3 of APP from non-diseased (ND) CBL, ND CTX, AD CBL, and AD CTX; each black diamond represents one neuron. For each group, the mean is displayed in red and bars represent 95% confidence intervals. AD CTX showed a mean APP copy number of 3.80; this is significantly higher than AD CBL (2.23), ND CTX (1.60), and ND CBL (2.28). *p = 0.0147, **p = 0.0015, **p < 0.0012, ANOVA p < 0.0001 (see Figure 6—source data 1 for raw numbers and statistics). (B) Single nuclei relative copy numbers for exon 14 of APP, similar to (A). The two exons showed a high concordance (Figure 6—figure supplement 1) where the AD CTX showed a mean APP copy number of 3.40 while the AD CBL (2.34), ND CTX (1.44), and ND CBL (1.92) remained closer to 2 copies. *p = 0.0163, **p = 0.0016, ****p < 0.0001, ANOVA p < 0.0001. (C–F) Distribution of copy number calls for exon 3 (C and D) and exon 14 (E and F) binned by relative copy number. The AD CTX for both exons displayed unique distributions, with more nuclei falling into the high copy number bins. (G and I) Distribution of nuclei with copy numbers less than, equal to, and greater than two copies. (H and J) Average copy number increases in nuclei binned with greater than two copies (gold columns in G) (AD CTX: Exon 3 = 5.01, Exon 14 = 4.96, *p = 0.0361). All statistics represent an ANOVA with a Tukey's multiple comparison test. Bars indicate ± SEM.
-
Figure 6—source data 1
Single Cell qPCR Data and Statistics.
- https://doi.org/10.7554/eLife.05116.014
Figure 6—figure supplement 1

Concordance of APP exon 3 and 14 from single cell qPCR.
(A) Relative copy numbers (RCN) for APP exon 3 and APP exon 14 displaying concordance between exons. 100 of 115 nuclei examined for both exons display copy numbers within one copy number call. 10 of the 15 remaining nuclei, while more than one copy number apart, were both called as gains. Bars represent RCN Min and RCN Max. (B) Scatter plot of average relative copy numbers. The data remain consistent with those displayed for individual exons (Figure 6A,B). Statistics represent an ANOVA with a Tukey's multiple comparison test. **p < 0.01, ***p < 0.001.
Figure 7 with 1 supplement
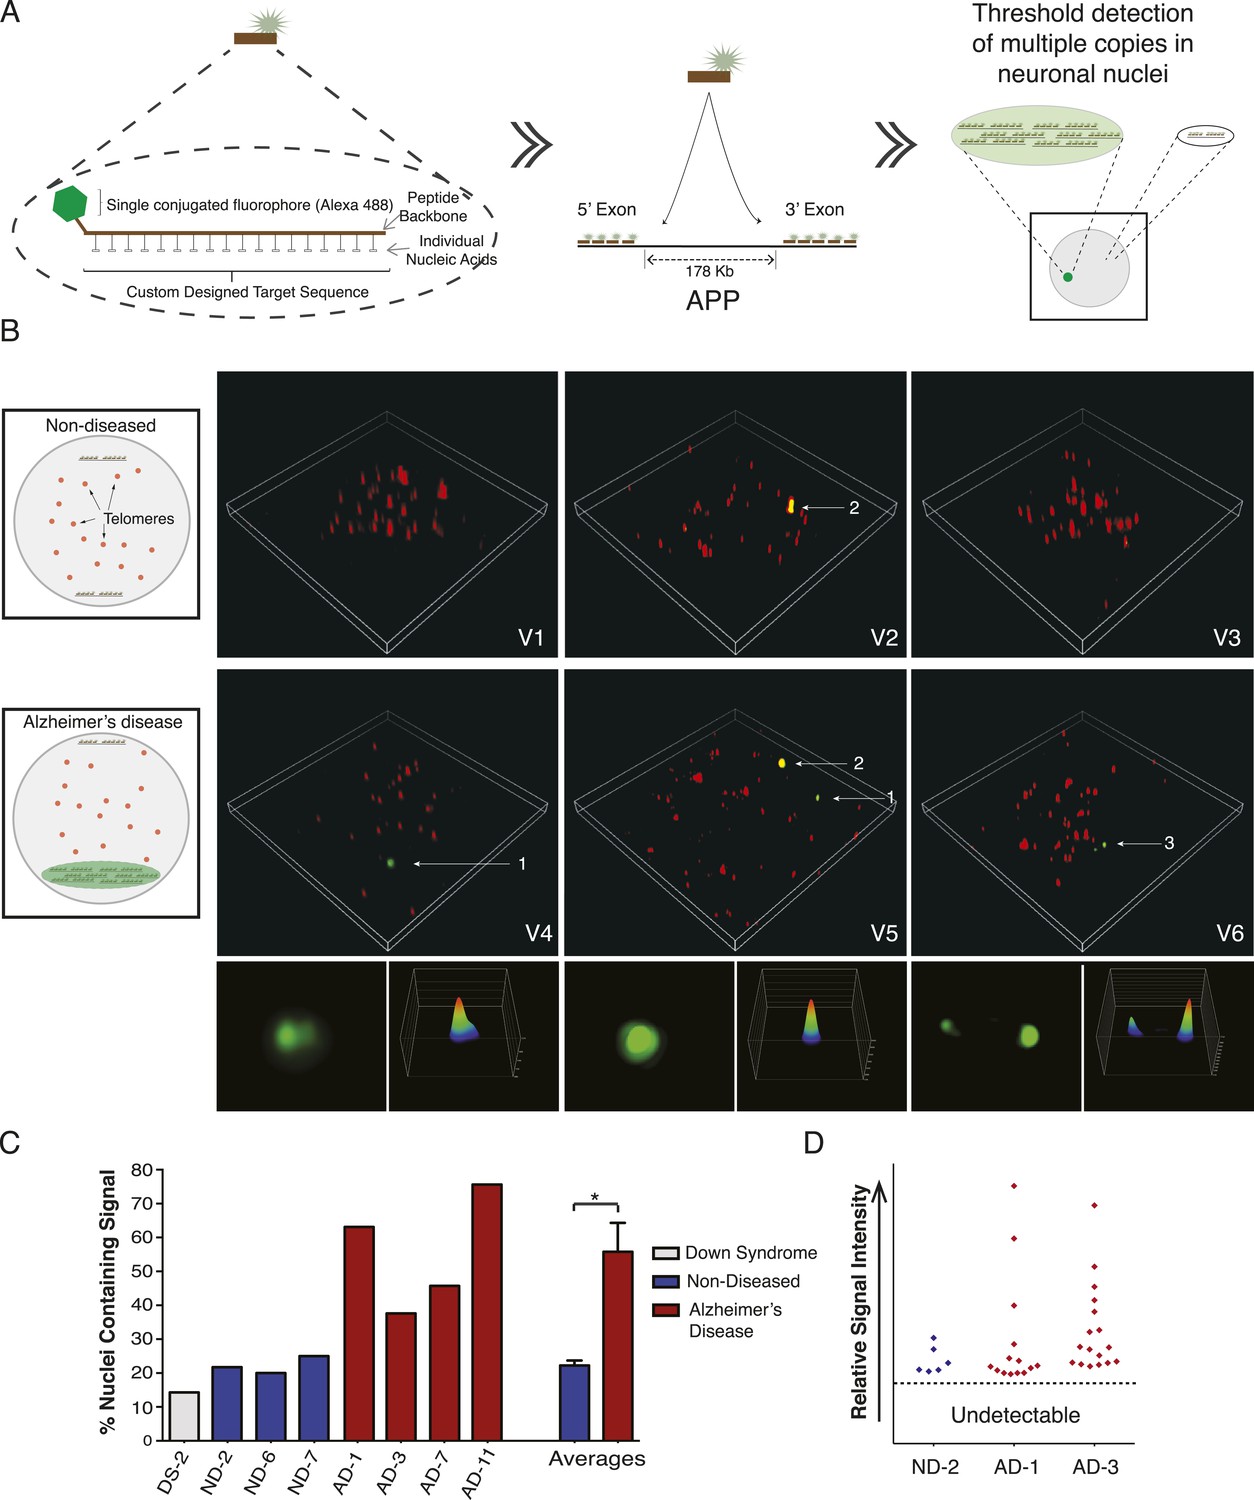
Visualization of APP copy number increases in neuronal nuclei from AD brain samples.
(A) Peptide nucleic acid probes (PNA) were developed against nine separate sites on APP (4 sites within exon 3 and 5 sites within exon 14). Each PNA probe consists of a peptide backbone conjugated to a single fluorophore, with separately conjugated nucleotides, substantially increasing specificity (Lansdorp et al., 1996). Single copies of APP are not detectable because of fluorophore detection limits. Detection of increased copy number by PNA probes can be visualized as copies of APP increase (Figure 7—figure supplement 1B,C). Positive internal controls using PNA probes directed against telomere sequences were simultaneously hybridized. (B) Visualization of copy number increases in neuronal nuclei. Green puncta (arrow 1, insets) indicate visualized APP increases. Telomere labeling (red puncta) was present in all nuclei, demonstrating probe accessibility and template fidelity. Lipofuscin (arrow 2, orange puncta) was detected in nuclei, visualized by extensive fluorescence signal in all channels, but was eliminated from quantifications. Limited nuclei displayed two green puncta (arrow 3). V1-6 Refers to the supplemental videos where 3-D projections can be visualized. (C) Graphic representation of non-diseased (blue) and DS (grey) brains displayed limited numbers of threshold-detected increases in APP (Figure 7—source data 1). AD (red) brains displayed significant and consistent threshold-detected increases in APP. (D) Individual threshold-detected APP increases were quantified and plotted on a relative intensity scale (blue diamonds: non-diseased, red diamonds: AD). Dotted line represents the threshold below which APP copy number was undetectable, only limited puncta were identified in non-diseased nuclei. Bars indicate ± SEM, *p < 0.05.
-
Figure 7—source data 1
Data and statistics for PNA-FISH counts.
- https://doi.org/10.7554/eLife.05116.017
Figure 7—figure supplement 1
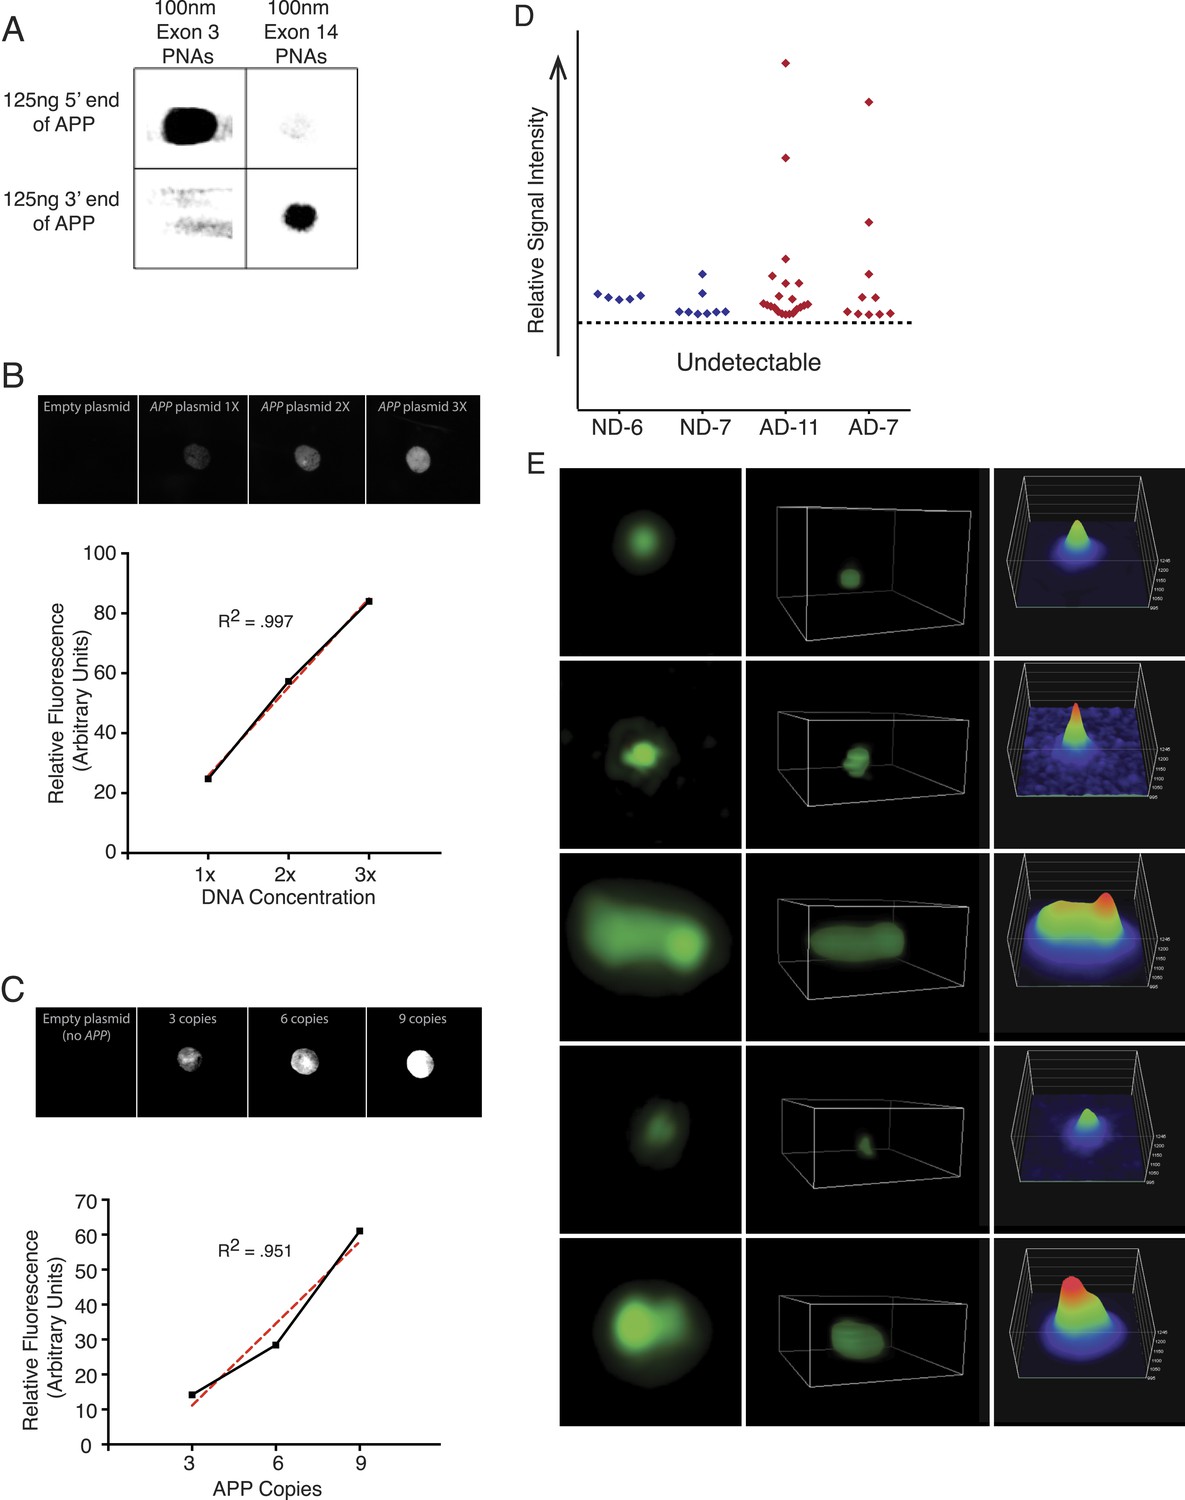
PNA FISH controls.
(A) PNA probe specificity was verified via dot blots of APP sequence followed by PNA probe hybridization and immunoblotting against the Alexa-488 fluorophor. Probes designed against exon 3 exhibited specific binding to the 5′ region of APP, and probes designed against exon 14 exhibited specific binding to the 3′ region of APP, while probes did not display significant binding to non-specific sequences. (B) Plasmids containing all 9 APP PNA binding sites were blotted at 1× (1.8 µg), 2× (3.6 µg), and 3× (5.4 µg) DNA concentration, and PNA probes were hybridized and an empty plasmid at 1.8 μg was used for a negative control in lane 1. Fluorescent output demonstrated a linear increase with increasing DNA concentration. (C) 10 μg of plasmids containing 0, 3, 6, and 9 copies of the APP PNA binding sites was blotted onto membrane and probes were hybridized. Fluorescent output showed an expected linear increase with the number of PNA probe binding sites. (D) Quantification of the variable APP signal increases observed across four brains. (E) Representative APP signals visualized and verified using super-resolution 3D projections displayed a range of variable intensities.
Videos
Video 1
PNA-Fish analysis of APP in nuclei from non-diseased cortical neurons.
Video of 3-D projection from Figure 7B, V1. Green puncta indicating APP increases were infrequently visualized in non-diseased brains. Red puncta indicate telomere labeling with separate telomere-specific PNA probes and were visualized as a positive control for PNA hybridization.
Video 2
PNA-Fish analysis of APP in nuclei from non-diseased cortical neurons with lipofuscin.
Video of 3-D projection from Figure 7B, V2. Green puncta indicating APP increases were infrequently visualized in non-diseased brains. Lipofuscin (orange puncta), visualized by extensive fluorescence signal in all channels, was detected in some nuclei, but was excluded from analysis. Red puncta indicate telomere labeling with separate telomere-specific PNA probes and were visualized as a positive control for PNA hybridization.
Video 3
PNA-Fish analysis of APP in nuclei from non-diseased cortical neurons.
Video of 3-D projection from Figure 7B, V3. Green puncta indicating APP increases were infrequently visualized in non-diseased brains. Red puncta indicate telomere labeling with separate telomere-specific PNA probes and were visualized as a positive control for PNA hybridization.
Video 4
PNA-Fish analysis of APP in nuclei from AD cortical neurons.
Video of 3-D projection from Figure 7B, V4. Green puncta indicate visualized APP increases. Red puncta indicate telomere labeling with separate telomere-specific PNA probes and were visualized as a positive control for PNA hybridization.
Video 5
PNA-Fish analysis of APP in nuclei from AD cortical neurons with lipofuscin.
Video of 3-D projection from Figure 7B, V5. Green puncta indicate visualized APP increases. Lipofuscin (orange puncta), visualized by extensive fluorescence signal in all channels, was detected in some nuclei, but was excluded from analysis. Red puncta indicate telomere labeling with separate telomere-specific PNA probes and were visualized as a positive control for PNA hybridization.
Video 6
PNA-Fish analysis of APP in nuclei from AD cortical neurons.
Video of 3-D projection from Figure 7B, V6. Green puncta indicate visualized APP increases. Limited nuclei in AD displayed two green puncta. Red puncta indicate telomere labeling with separate telomere-specific PNA probes and were visualized as a positive control for PNA hybridization.
Tables
Table 1
Human samples used in each experiment
| Sex | Age | Paper code | Sample | Experiments | Post mortem interval | Braak score | |
|---|---|---|---|---|---|---|---|
| Alzheimer's disease prefrontal cortex, N = 32 | F | 81 | 1521 | D | 23 | VI | |
| F | 83 | 1562 | D | 6 | U | ||
| F | 74 | AD-13 | 1866 | DT | U | U | |
| F | 79 | AD-5 | 1868 | DST | U | U | |
| F | 82 | AD-10 | 1875 | DST | U | U | |
| F | 83 | 1893 | D | 9 | U | ||
| F | 87 | 1899 | D | 5 | VI | ||
| F | 62 | AD-9 | 1912 | DST | U | U | |
| F | 80 | AD-8 | 1913 | DT | U | U | |
| F | 54 | AD-4 | 1916 | DTB | U | U | |
| F | 72 | AD-2 | 1921 | DTB | U | U | |
| F | 77 | 2400 | D | 3.7 | V | ||
| F | 80 | AD-11 | 2500 | DP | 2.3 | VI | |
| F | 101 | 50341 | D | 19 | V | ||
| F | 91 | 61788 | D | 11 | V | ||
| F | 98 | 62405 | D | 11 | V | ||
| F | 89 | 62439 | D | 11 | V | ||
| F | 77 | 62509 | D | 18 | VI | ||
| M | 88 | AD-1 | 102 | DSBP | 3 | IV | |
| M | 90 | 268 | D | 91 | V | ||
| M | 83 | 736 | D | 27 | U | ||
| M | 82 | 1211 | D | 18 | U | ||
| M | 79 | AD-15 | 1252 | D | 9 | U | |
| M | 92 | 1748 | D | 5.5 | V | ||
| M | 85 | AD-12 | 1861 | DT | U | U | |
| M | 85 | AD-14 | 1870 | DT | U | U | |
| M | 82 | AD-3 | 2401 | DSBP | 3 | VI | |
| M | 84 | AD-6 | 2499 | DS | 3.4 | VI | |
| M | 63 | AD-7 | 4199 | DP | 3 | VI | |
| M | 80 | 13173 | D | 22 | IV | ||
| M | 94 | 30022 | D | 20 | V | ||
| M | 91 | 60987 | D | 22.5 | V | ||
| Mean | 82.1 | ||||||
| Alzheimer's disease cerebellum, N = 15 | F | 74 | AD-13 | 1866 | D | U | U |
| F | 79 | AD-5 | 1868 | DS | U | U | |
| F | 82 | AD-10 | 1875 | DS | U | U | |
| F | 80 | AD-8 | 1913 | D | U | U | |
| F | 62 | AD-9 | 1912 | DS | U | U | |
| F | 54 | AD-4 | 1916 | DB | U | U | |
| F | 72 | AD-2 | 1921 | DB | U | U | |
| M | 88 | AD-1 | 102 | DSB | 3 | IV | |
| M | 79 | AD-15 | 1252 | D | 9 | U | |
| M | 70 | 1625 | D | 1 | U | ||
| M | 85 | AD-12 | 1861 | D | U | U | |
| M | 85 | AD-14 | 1870 | D | U | U | |
| M | 82 | AD-3 | 2401 | DSB | 3 | VI | |
| M | 84 | AD-6 | 2499 | DS | 3.4 | VI | |
| M | 63 | AD-7 | 4199 | D | 3 | VI | |
| Mean | 75.9 | ||||||
| Non-diseased prefrontal cortex, N = 40 | F | 74 | ND-2 | 1901 | DSBP | 2.3 | II |
| F | 74 | ND-8 | 299 | D | 2.8 | II | |
| F | 84 | ND-3 | 703 | S | 5.8 | III | |
| F | 53 | ND-11 | 1379 | D | 15 | III | |
| F | 73 | 713* | T | U | U | ||
| F | 95 | 60831 | D | 9 | II | ||
| F | 51 | 1568 | P | 22 | U | ||
| F | 17 | 1230 | P | 16 | U | ||
| F | 87 | ND-10 | 1502 | D | 5 | II | |
| F | 80 | 60728 | D | 13 | II | ||
| M | 79 | ND-9 | 827* | DT | U | U | |
| M | 96 | ND-1 | 1102 | DSB | 3.4 | II | |
| M | 83 | ND-5 | 2501 | DB | 1.7 | II | |
| M | 95 | ND-4 | 1301 | DS | 3.5 | I | |
| M | 87 | 1471* | T | U | U | ||
| F | 71 | 1571* | T | U | U | ||
| M | 53 | 1344* | DT | U | U | ||
| F | 93 | 318 | D | 2.3 | VI | ||
| F | 92 | 955 | D | 20.5 | III | ||
| F | 56 | 4238 | D | 12 | |||
| M | 70 | 4534 | D | 28 | |||
| F | 91 | 11488 | D | 16 | II | ||
| F | 79 | 13188 | D | 12.5 | |||
| F | 90 | 13204 | D | 9.5 | II | ||
| F | 103 | 60329 | D | 5 | III | ||
| F | 85 | 60428 | D | 8.5 | III | ||
| F | 99 | 60524 | D | 15 | II | ||
| F | 95 | 62043 | D | 20.5 | |||
| M | 71 | 389 | M | 15 | |||
| F | 83 | 719 | M | 17 | III | ||
| M | 69 | 946 | M | 12 | |||
| M | 87 | 2039 | M | 6.3 | III | ||
| F | 86 | 4546 | M | 22 | |||
| M | 91 | 60772 | M | 16 | II | ||
| F | 80 | 61218 | M | 5.5 | |||
| M | 87 | 61334 | M | 8 | II | ||
| M | 88 | PDC2 | M | U | |||
| M | 80 | PDC5 | M | U | |||
| M | 75 | PDC8 | M | U | |||
| Mean | 79.54 | ||||||
| Non-diseased cebellum, N = 15 | F | 74 | ND-2 | 1901 | DSB | 2.3 | II |
| F | 74 | ND-8 | 299 | D | 2.8 | II | |
| F | 84 | ND-3 | 703 | S | 5.8 | III | |
| F | 77 | 1569 | D | 8 | III | ||
| F | 83 | 719 | D | U | U | ||
| F | 53 | 1379 | D | 15 | III | ||
| F | 71 | 1571 | DT | U | U | ||
| F | 87 | ND-10 | 1502 | D | 5 | II | |
| M | 53 | 1344 | DT | U | U | ||
| M | 96 | ND-1 | 1102 | DSB | 3.4 | II | |
| M | 83 | ND-5 | 2501 | DB | 1.7 | II | |
| M | 95 | ND-4 | 1301 | DS | 3.5 | I | |
| M | 79 | ND-9 | 827 | D | U | U | |
| M | 87 | 1471 | D | U | U | ||
| F | 86 | 4546 | M | 22 | U | ||
| Mean | 78.8 | ||||||
| DS/AD, N = 3 | F | 51 | DS-1 | M1864 | B | 19 | U |
| F | 47 | DS-2 | M3233 | S | 24 | U | |
| F | 44 | DS-3 | 1258 | S | 13 | U | |
| Mean | 47.3 | ||||||
| LYM, N = 21 | F | 40 | 5162 | D | N/A | N/A | |
| F | 40 | 3963 | D | N/A | N/A | ||
| F | 63 | 4984 | D | N/A | N/A | ||
| F | 60 | 4519 | D | N/A | N/A | ||
| M | 55 | Lym 1 | D | N/A | N/A | ||
| M | 35 | 4651 | D | N/A | N/A | ||
| 29 | D | N/A | N/A | ||||
| 187 | D | N/A | N/A | ||||
| 4781 | D | N/A | N/A | ||||
| 4801 | D | N/A | N/A | ||||
| 4903 | D | N/A | N/A | ||||
| M | 28 | 5259 | D | N/A | N/A | ||
| M | 56 | 83 | M | ||||
| F | 52 | 1344 | M | ||||
| F | 56 | 4603 | M | ||||
| M | 54 | 4609 | M | ||||
| M | 58 | Lym 2 | M | ||||
| F | 51 | Lym 3 | M | ||||
| M | 52 | Lym 4 | M | ||||
| Mean | 50.0 | M |
-
Samples in bold are paired CBL and CTX.
-
*
Denotes mid frontal gyrus (MFG), D = DNA content analyses, S= Small population qPCR, T = FISH Analysis, B = single cell qPCR on Biomark HD, P=PNA FISH, M = Westra et al. DNA content metadata.
Table 2
Primers used for small population and single nuclei qPCR
| Gene | Protein | Locus | Assay type | Primer sequence | Probe | Product length | Efficiency |
|---|---|---|---|---|---|---|---|
| APP, Exon 14 | Amyloid precursor protein | 21q21.3 | SYBR Green | F-TGCACGTGAAAGCAGTTGAAG, R-AAAGATGGCATGAGAGCATCG | N/A | 214 | 0.973 |
| SEMA4A | Semaphorin 4A | 1q22 | SYBR Green | F- ATGCCCAGGGTCAGATACTAT, R-TTCTCCGAGATCCTCTGTTTC | N/A | 177 | 0.997 |
| CCL18 | Chemokine (C–C motif) ligand 18 | 17q11.2 | SYBR Green | F-TTCCTGACTCTCAAGGAAAGG, R-CTGGCACTTACATGACACCTG | N/A | 209 | 1.006 |
| PCDH11X | Protocadherin 11 X-linked | Xq21.3 | SYBR Green | F-TCTTTTGGTCAGTGTTGTGCG, R-CAACAAGTCGCCTATCAGGAC | N/A | 188 | 0.993 |
| APP, Exon 14 | Amyloid precursor protein | 21q21.3 | TaqMan | CGGTCAAAGATGGCATGAGAGCATC*, Assay Hs01255859_cn | FAM-MGB | 91 | 1.040 |
| APP, Exon 3 | Amyloid precursor protein | 21q21.3 | TaqMan | F-GCACTTCTGGTCCCAAGCAT, R-CCAGTTCTGGATGGTCACTG | ROX-IB | 140 | 0.992 |
| SEMA4A | Semaphorin 4A | 1q22 | TaqMan | GTTCAAGGGTATGTGAGGTGAGATG*, Assay Hs00329046_cn_VIC | VIC-MGB | 90 | 1.016 |
-
*
Denotes probe sequence provided by Life Technologies.
Table 3
Quality control between 48.48 Dynamic Array runs
| Cell 1 | Cell 2 | Cell 3 | Cell 4 | Cell 5 | Cell 6 | Cell 7 | Cell 8 | ||
|---|---|---|---|---|---|---|---|---|---|
| APP 14 | Run 1 | 21.37 | 18.77 | 18.02 | 18.34 | 17.11 | 19.33 | 20.12 | 18.02 |
| Run 2 | 20.60 | 18.77 | 18.14 | 18.41 | 17.25 | 19.50 | 20.60 | 18.26 | |
| APP3 | Run 1 | 22.79 | 20.35 | 18.53 | 19.11 | ||||
| Run 2 | 21.97 | 19.84 | 18.65 | 19.28 | |||||
| SEMA4A | Run 1 | 25.54 | 24.29 | 22.44 | 24.23 | 22.81 | 25.74 | 24.46 | 24.67 |
| Run 2 | 25.26 | 24.53 | 23.92 | 24.39 | 23.03 | 25.42 | 24.11 | 24.30 |
Table 4
Confidence Intervals for (CI) calling Copy Number (CN)
| CN | CI | RCN, value |
|---|---|---|
| 1 | Lower | 0.92156 |
| Upper | 1.08512 | |
| 2 | Lower | 1.84312 |
| Upper | 2.17023 | |
| 3 | Lower | 2.76468 |
| Upper | 3.25535 | |
| 4 | Lower | 3.68624 |
| Upper | 4.34047 | |
| 5 | Lower | 4.60780 |
| Upper | 5.42559 | |
| 6 | Lower | 5.52936 |
| Upper | 6.51070 |
Table 5
Peptide nucleic acid (PNA) probe sequences
| Gene | Protein | Locus | Assay | Sequence |
|---|---|---|---|---|
| APP Exon 3 | Amyloid precursor protein | 21q21.3 | PNA FISH | A488-GATGGGTCTTGCACTG, A488-CCCCGCTTGCACCAGTT, A488-GGTTGGCTTCTACCACA, A488-CAGTTCAGGGTAGAC |
| APP Exon 14 | Amyloid precursor protein | 21q21.3 | PNA FISH | A488-CTCCATTCACGG, A488-GTGGTTTTCGTTTCGGT, A488-ACTGATCCTTGGTTCAC, A488-ACTGATCCTTGGTTCAC, A488-ACGTCATCTGAATAGTT |
| Telomere | N/A | Telomeres | PNA FISH | TelC-Cy3 (F1002, PNA BIO) |
Download links
A two-part list of links to download the article, or parts of the article, in various formats.
Downloads (link to download the article as PDF)
Open citations (links to open the citations from this article in various online reference manager services)
Cite this article (links to download the citations from this article in formats compatible with various reference manager tools)
Genomic mosaicism with increased amyloid precursor protein (APP) gene copy number in single neurons from sporadic Alzheimer's disease brains
eLife 4:e05116.
https://doi.org/10.7554/eLife.05116


