C-terminal threonines and serines play distinct roles in the desensitization of rhodopsin, a G protein-coupled receptor
- University of Washington, United States
- Keck School of Medicine of University of Southern California, United States
- Vanderbilt University School of Medicine, United States
- University of Michigan, United States
- Howard Hughes Medical Institute, University of Washington, United States
Figures
Figure 1 with 1 supplement
Single-photon responses: activation of individual wild-type and mutant rhodopsins.
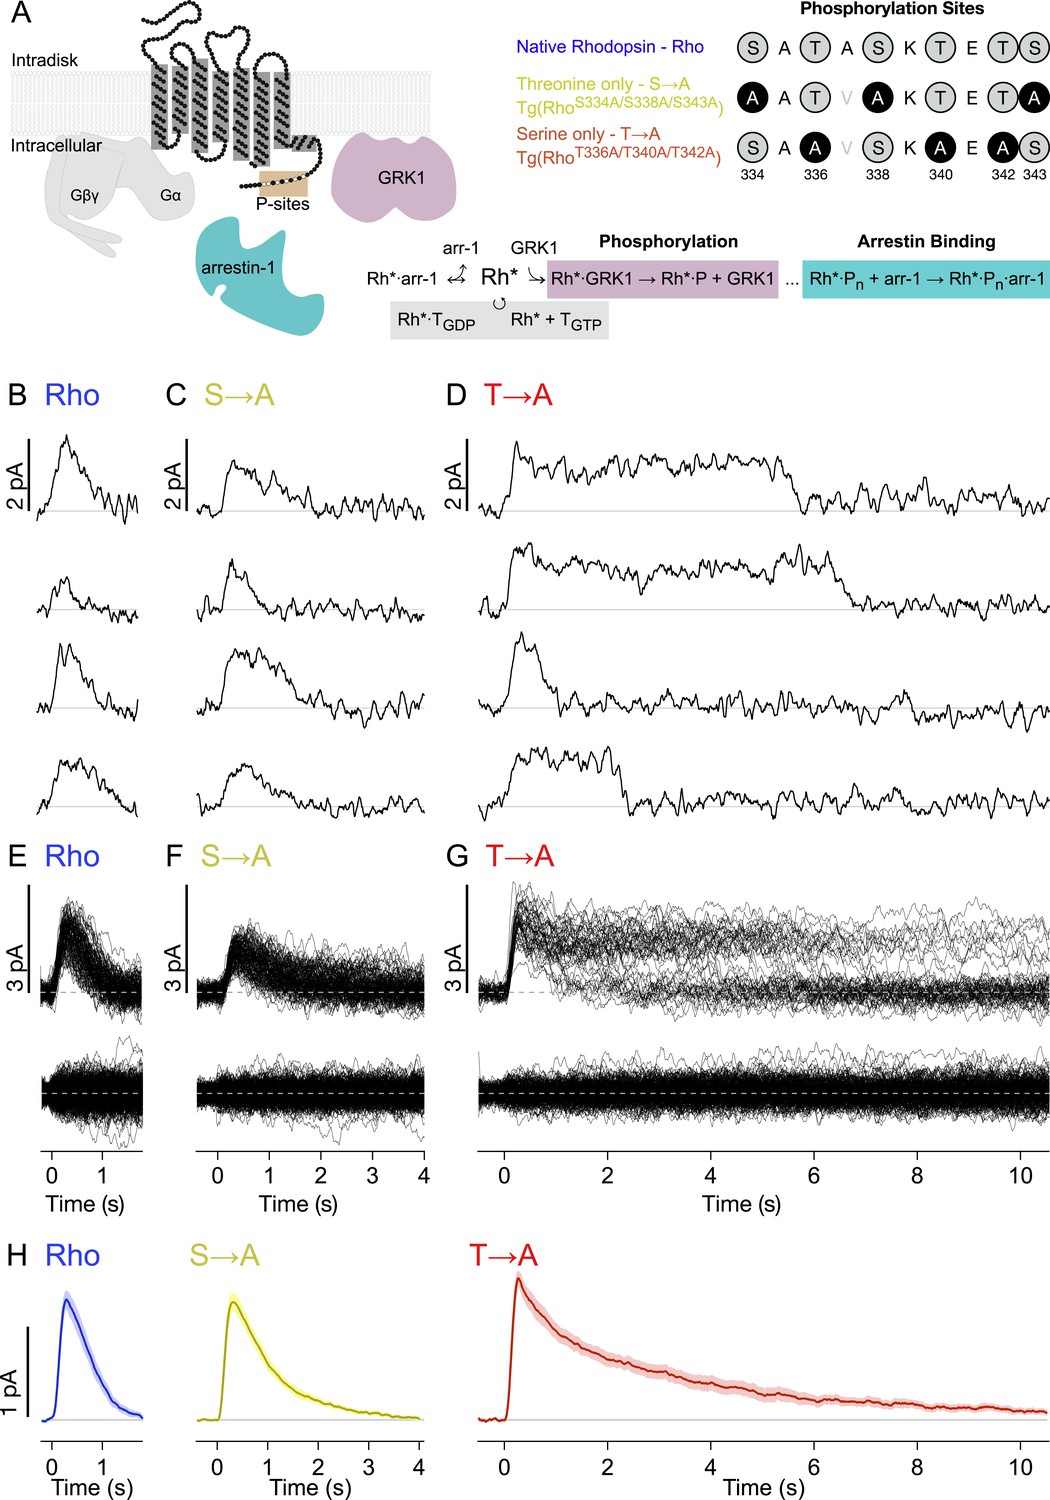
(A) Schematic showing rhodopsin, the G protein transducin (T = Gβγ and Gα, gray), G protein receptor kinases 1(GRK1), and arrestin-1. Phosphorylation consists of GRK1 binding and phosphate attachment. Arrestin-1 serves to quench rhodopsin activity and to compete with GRK1, modifying the GRK1 binding rate (Doan et al., 2009). The upper right panel shows the sequence of the rhodopsin C-terminus and the mutations to test the effects of replacing either threonine or serine residues with alanine. The mutation A337V is included to produce a linear epitope for mAb 3A6, as in Mendez et al. (2000). Labels indicate strain nomenclature (above) and protein nomenclature (below). (B–D) Representative examples of individual single-photon responses (SPRs). (E–G) All SPRs from representative cells of each strain, with identified singles (∼50) above and failures (no response to flash, ∼150) below: (B, E) Rhodopsin (wild type, WT); (C, F) S → A, previously referred to as STM (Mendez et al., 2000); (D, G) T → A. (H) Average SPRs across all cells: WT—N = 8, S → A—N = 9, T → A—N = 9.
Figure 1—figure supplement 1

Isolation of single-photon responses.
(A) Configuration for recording. The flash intensity was adjusted to produce occasional responses, as shown in the example trace. Determination of quantal analysis parameters: a template (the average response) was scaled to match the rising phase of the flash-aligned response. The amplitude distribution was fit with a quantal response model, where:
is the probability of activating n rhodopsin molecules, and:
is the probability that n active rhodopsin molecules produce a response with amplitude a, with parameters: mean Rh*/flash (λ), failure noise (σD), mean SPR amplitude (A), and SPR dispersion (σA) (Baylor et al., 1979). The full distribution is given as:
(B) Thresholds for classifying responses θ1, θ2 were calculated such that:
and
Plotted are the cell selection criteria, θ1/σDark for each cell, included or rejected, for each mouse strain. On the right are example amplitude distributions for a cell that fails the criterion (θ1/σDark < 2.33) (left plot) and one that passes (right plot).
Figure 2

Single-photon response properties.
(A-top) Distribution of response durations for each cell (single line). The response duration was determined by detecting the transition from an ‘up’ state to a ‘down’ state, as in Draber and Schultze (1994) (Inset). (A-bottom) Pooled distributions across cells. Noise in determining response duration shown in gray. Response duration distributions are non-normal (p < 0.001, K-S test for non-normality) and are significantly different from one another at the 99% confidence level (Kruskal–Wallis analysis of variance, corrected for multiple comparisons). (B) Average time course of SPR variance (left axis) compared to the average SPR (right axis) for each strain. (C) Ratio of the time-to-peak of the variance relative to the time-to-peak of the mean response across cells for each strain. WT—2.1 ± 0.8 s; S → A—2.4 ± 0.8 s; T → A—11.2 ± 0.8 s. WT and S → A n.s. (D) Coefficients of variation, CVarea, for individual cells (points) and mean ± SEM (bars). All measurements are significantly different (p < 0.001, one-way ANOVA, corrected for multiple comparisons).
Figure 3
Rhodopsin mutants are multiply phosphorylated in vivo.
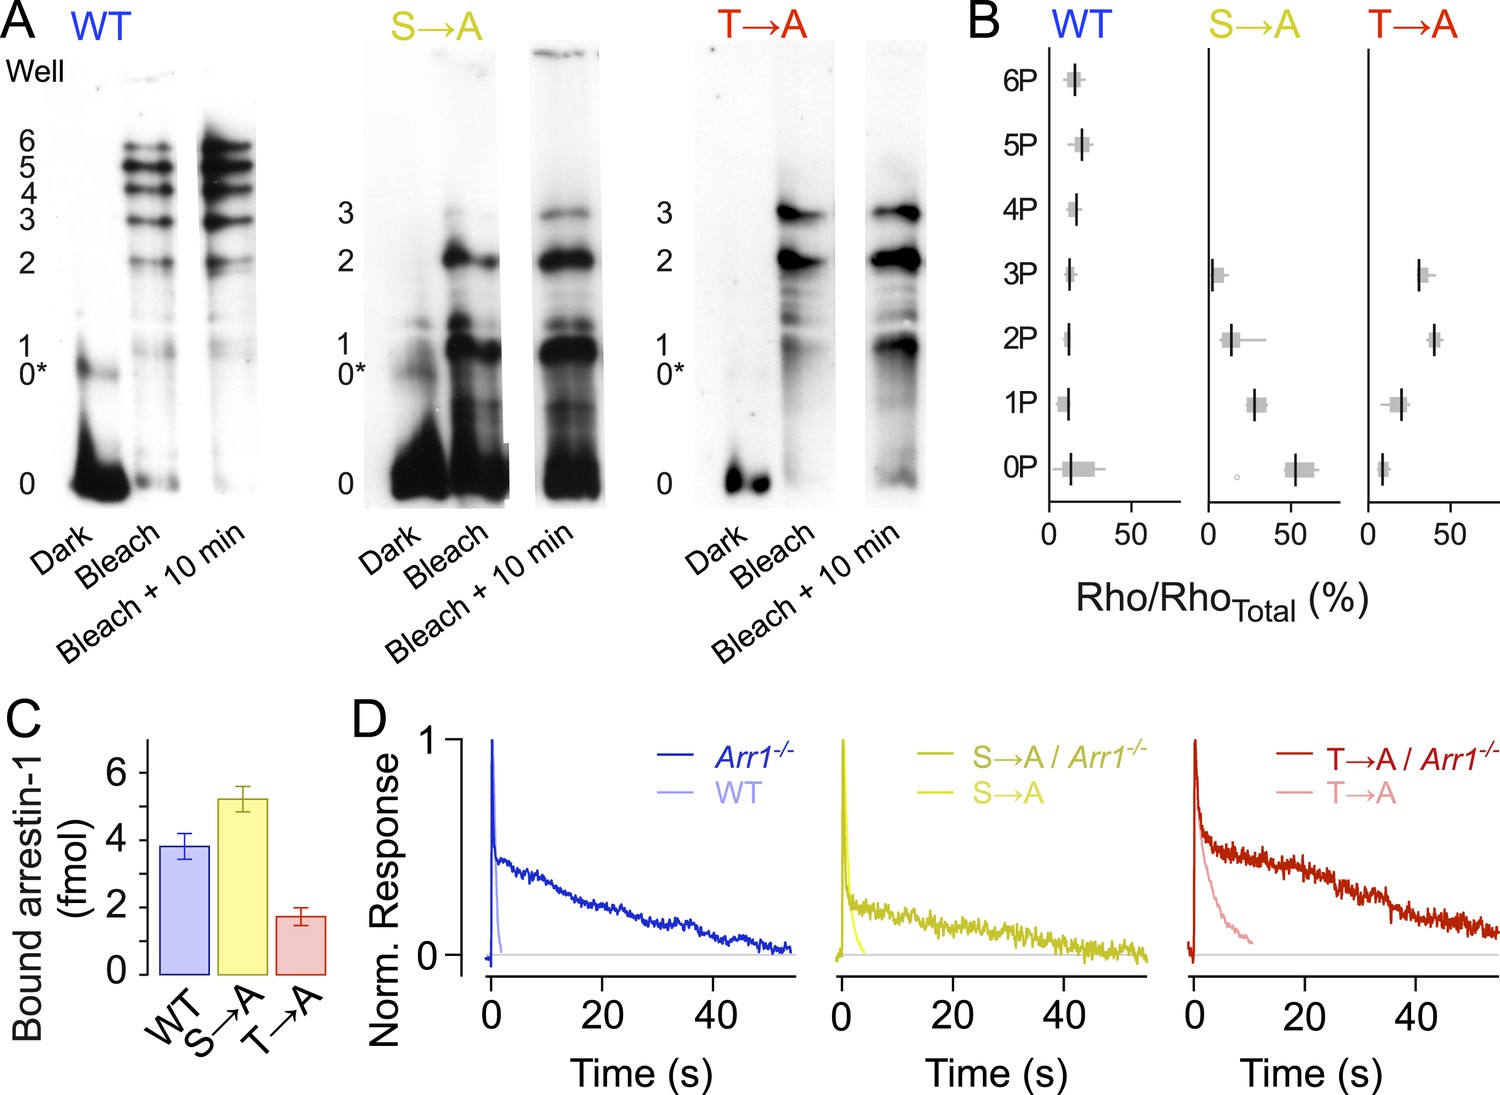
(A) Isoelectric focusing of WT, S → A, or T → A retinal membranes from dark-adapted retina (Dark) or retinas exposed to 5-min light (Bleached) or after illumination for 5 min followed by dark incubation for 10 min (Bleached + 10 min). Each strain was run on a separate gel; all lanes in a panel are from the same gel. The gel was blotted and probed with R2-12N, a mouse monoclonal antibody that recognizes the amino-terminus of rhodopsin. The rhodopsin species are indicated at the left of the gel, from unphosphorylated (0) to maximally phosphorylated (6 for WT and 3 for the T → A and S → A mutants). 0* corresponds to unphosphorylated opsin. (B) The density of the bands was quantified using the Odyssey Imaging System (LI-COR Biosciences), normalized to total rhodopsin, and plotted as box and whisker plots. Black lines indicate the median density (N = 4–9). (C–D) Rhodopsin desensitization requires arrestin-1 binding. (C) Arrestin-1 binding to rhodopsin in isolated rod outer segment membranes (see ‘Materials and methods’). (D) Knocking out arrestin-1 prolongs average responses. Each panel compares the average response (8–12 cells in each case) with and without arrestin-1. Average time constants, measured after the initial decay, were 27 ± 2 s for Arr1−/− rods, 20 ± 3 s for S → A/Arr1−/− rods, and 34 ± 4 s for T → A/Arr1−/− rods.
Figure 4 with 2 supplements
S → A rods express ∼1.3× total rhodopsin as WT rods, in ∼1.3× larger rods, at the same concentration.
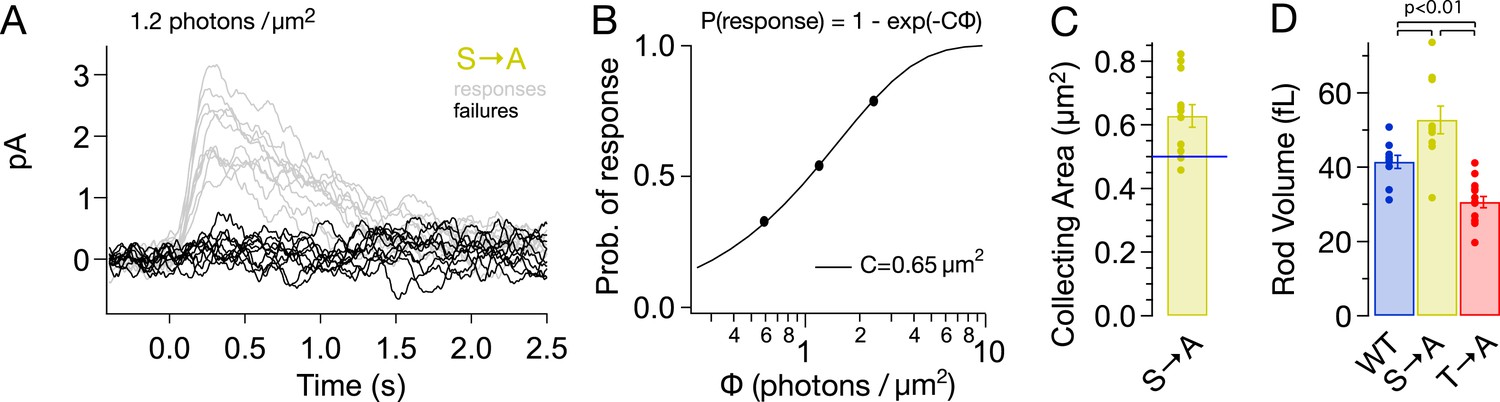
(A) Responses from a S → A rod to a dim, full-field flash, delivering 1.2 photons/μm2, classified as either a response (gray) or failure (black). The rod responded 66 times to 121 flashes. (B) The fraction of flashes producing responses is plotted against the flash strength for the rod in (A). The poisson distribution gives the fraction of responses as p(response) = 1 − p(failure) = 1 − exp(−CΦ), where Φ is the flash strength (photons/μm2), and C is the collecting area (in μm2). A collecting area of 0.65 μm2 gives the best fit to the data. (C) Across N = 12 cells, the collecting areas measured 0.63 ± 0.04 μm2, ∼1.3× larger than WT rods (0.5 μm2, blue line, Azevedo and Rieke, 2011). (D) Volume of rod outer segments from 3D serial reconstructions (Figure 4—figure supplement 1). WT, 41 ± 2 fL; S → A, 53 ± 4 fL; and T → A, 31 ± 2 fL (p < 0.01, one-way ANOVA, corrected for multiple comparisons).
Figure 4—figure supplement 1
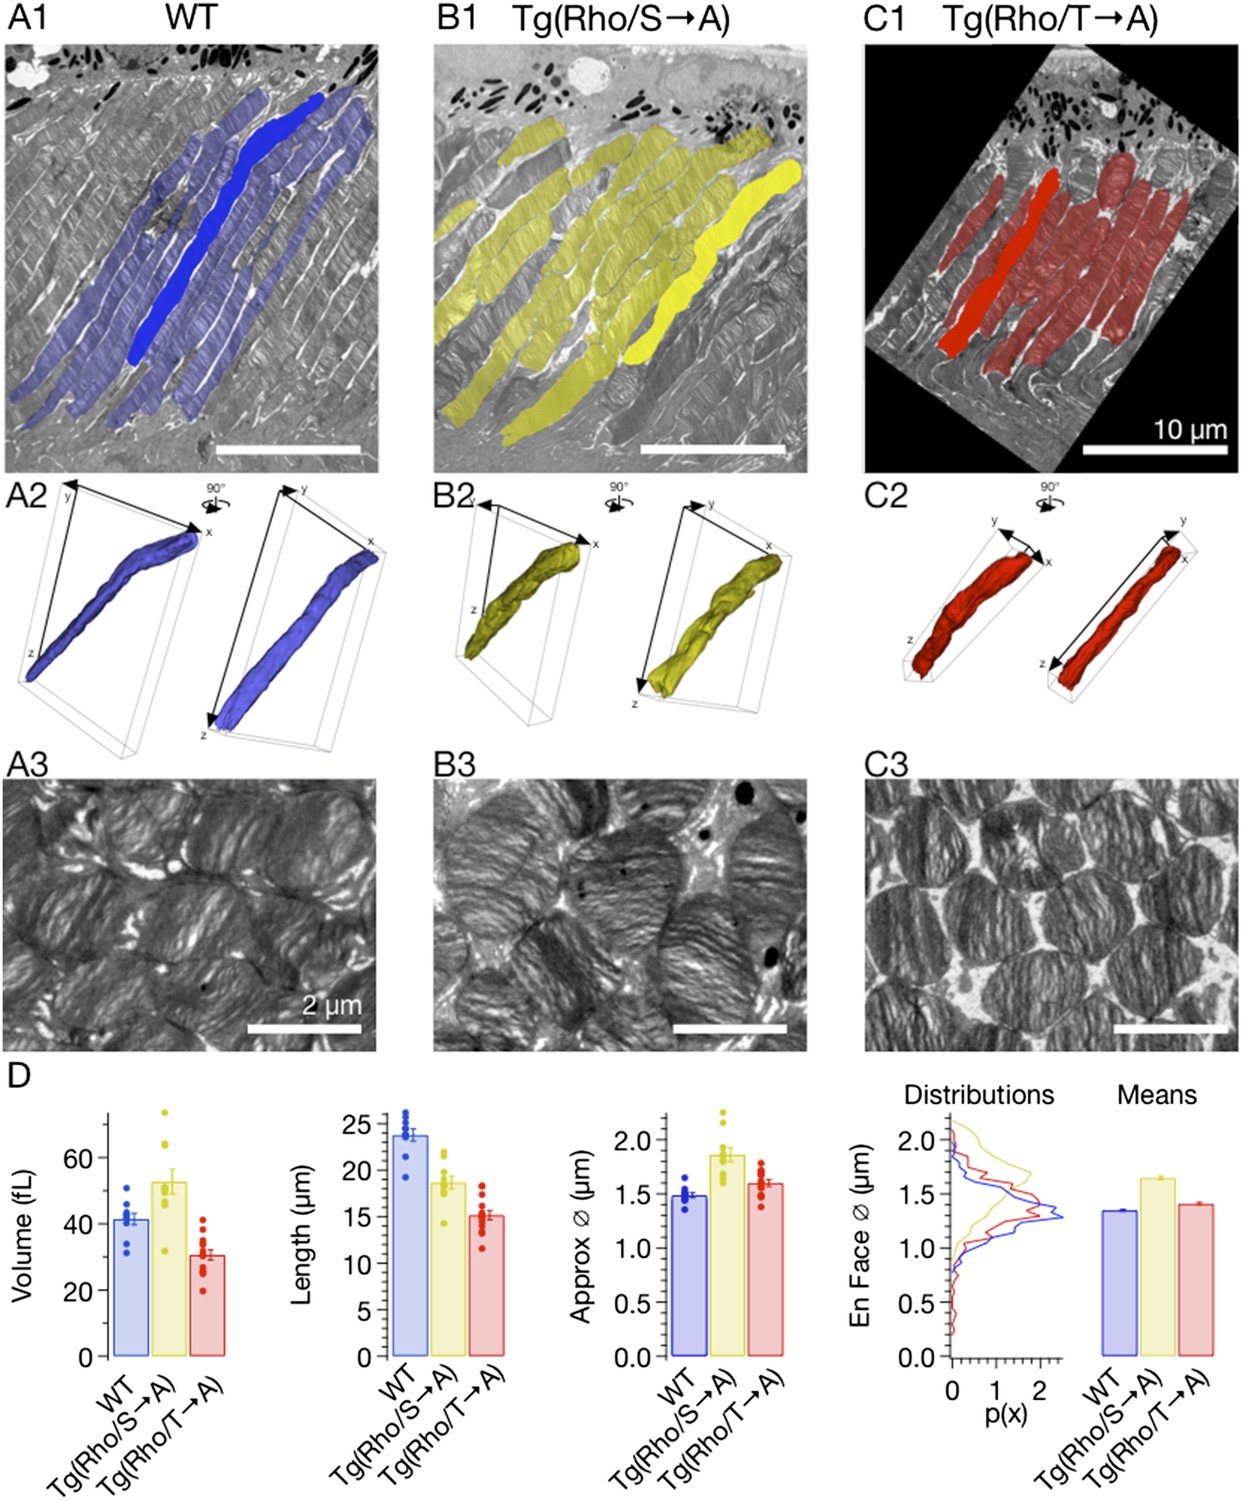
Ectopic expression of rhodopsin mutants modestly alters rod morphology.
(A–C) Serial EM images of rod outer segments were segmented by hand and reconstructed in TrakEM2. (A1–C1) EM micrographs of 80-nm section of outer segments with segmented rods indicated in colors. Scale bar 10 μm. (A2–C2) 3D representation of highlighted rods in A1–C1 from two different viewing angles, rotated 90° about vertical. (A3–C3) En face section of the same retinas showing rod outer segment cross sections. Scale bar 2 μm. (D) Comparison of rod morphology across strains. Volume, length, and approximate diameter (Approx. Ø) were calculated from reconstructions, while en face diameter (En face Ø) was measured from segmentation of en face micrographs. T → A and WT approximate diameter measurements are not significantly different. Otherwise, all measurements are significantly different (p < 0.01, one-way ANOVA, corrected for multiple comparisons).
Figure 4—figure supplement 2
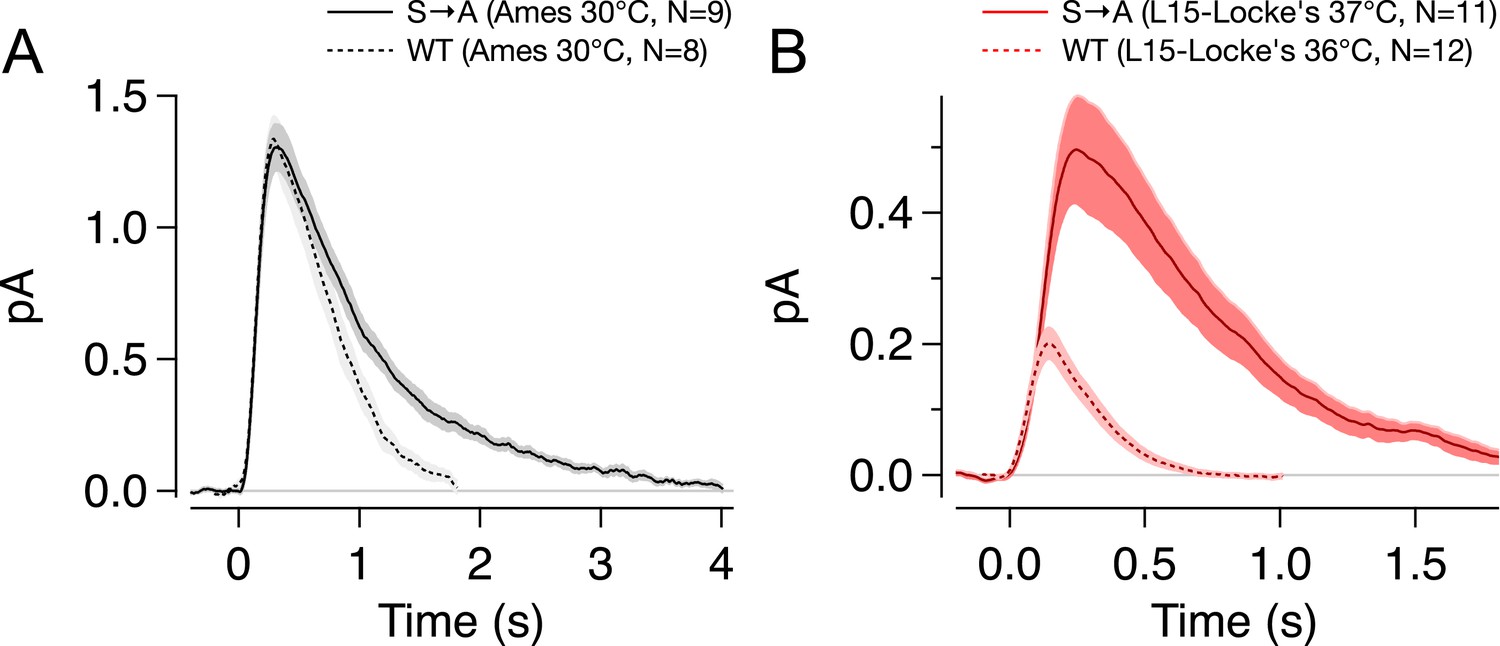
Effect of experimental conditions on S → A responses.
Previous work has demonstrated a large effect of tissue storage conditions on response amplitude and kinetics. This effect accounts for the less dramatic differences between WT and S → A responses than in previous work by Mendez et al. (A) Storage and recording S → A (solid) or WT (dotted) rods in Ames medium resulted in larger and slower SPRs. (B) When retina was stored in L-15 and recording carried out in Locke's medium (solid red), dim flash responses were smaller, yet the differences between strains were accentuated. WT responses in L-15/Locke's conditions (dotted red) from Azevedo and Rieke (2011).
Figure 5 with 1 supplement
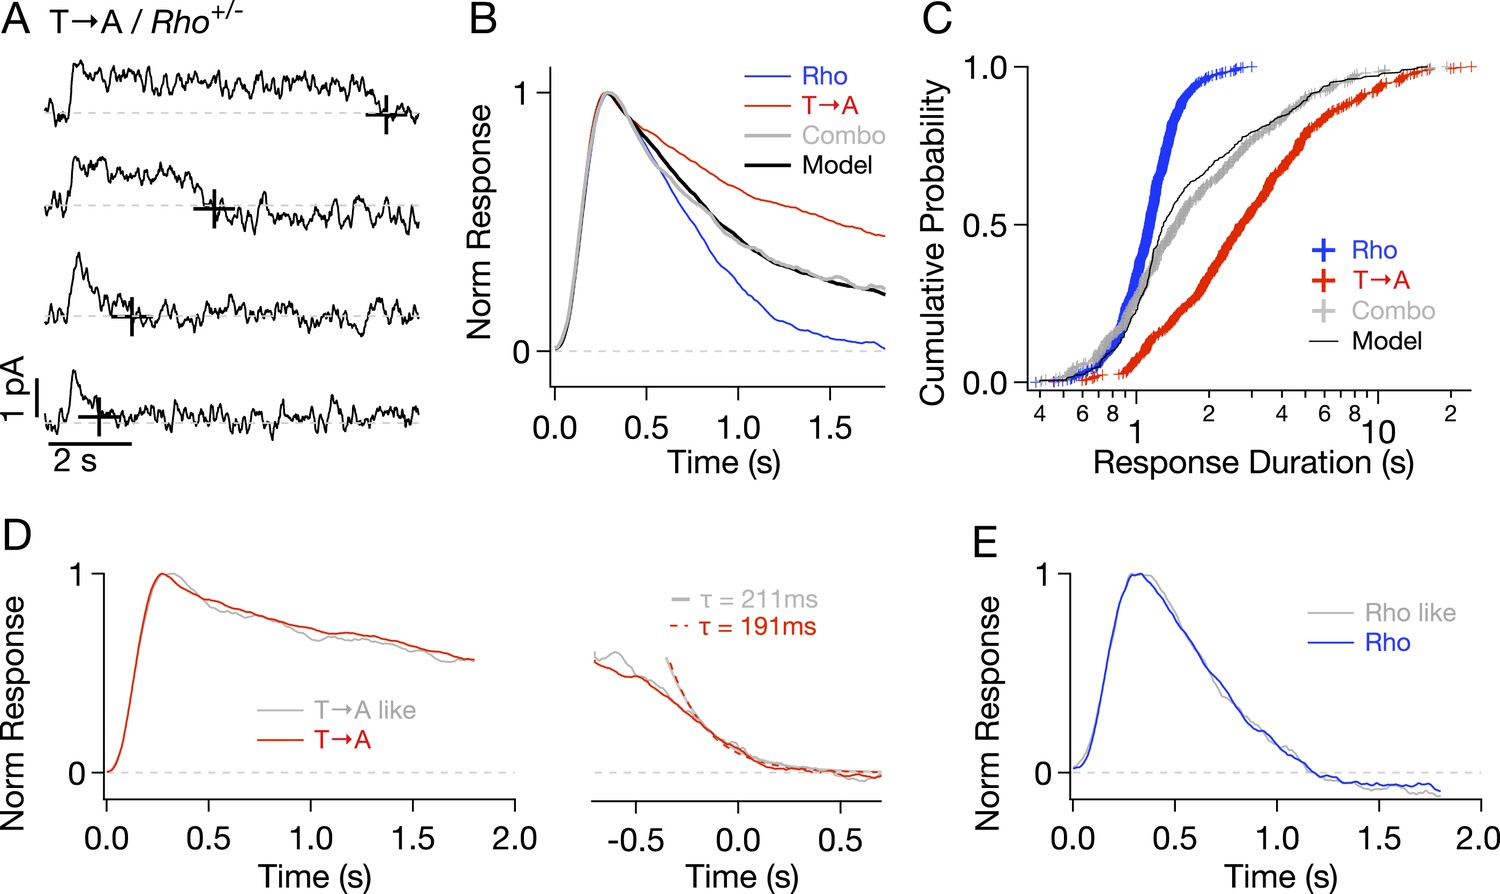
Comparison of single-photon responses from different rhodopsin mutants expressed in the same cell.
(A) Representative SPRs from a T → A/Rho+/− cell, termed a ‘Combo’ rod. Response termination shown as black crosses. (B) Normalized response from Combo rods (gray) fit by a linear combination of normalized Rho and pure T → A responses. (C) Cumulative distribution of response durations from pure Rho and T → A rods and from Combo rods. A random selection of Rho and T → A response durations in a 1:1 ratio gives the modeled distribution (black line). (D-left) Average of initial phase of T → A responses (red) and combo responses (gray) classified as T → A-like (Figure 5—figure supplement 1). (D-right) Average tails of T → A-like responses aligned to the response ends, normalized to the peaks (left). Dotted lines depict decaying exponential fits to the combo tail (gray, τ = 211 ms) and T → A tail (red, τ = 191 ms). (E) Averages of Rho-like responses from WT and Combo rods.
Figure 5—figure supplement 1
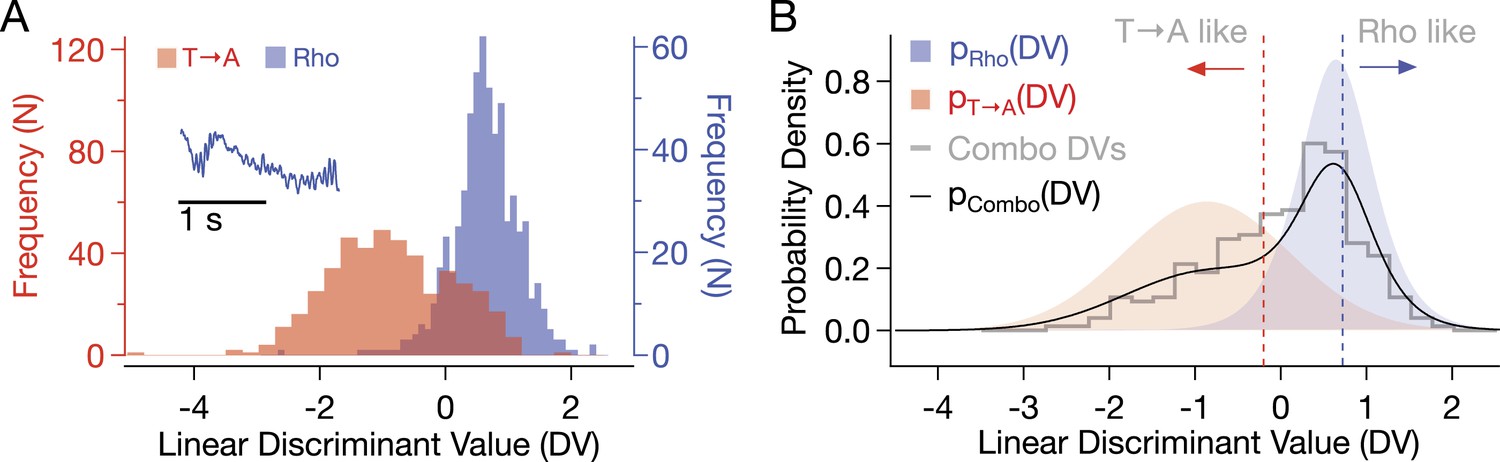
Combo rod responses were classified according to similarity to a template that discriminated between Rho and T → A responses (inset).
To find the template, principal component analysis was performed on the response matrix R, with WT and T → A responses of 1810 time samples each (rows) forming the columns. The responses were projected into the subspace spanned by the 21 eigenvalues and eigenvectors accounting for 99% of the variance. A linear discriminant, w, was calculated as:
where mi is the mean of responses × in a class, Di, and Sw is the sum of the within-class scatter matrices, Si given by:
where t indicates the vector transpose (Duda et al., 2001; Chang et al., 2012). (A) Discriminant values (DVs) of pure T → A and Rho responses. Correlating the initial response phase with the template gives the linear DV. This discriminant gives the lowest misclassification error (Bayes Error). T → A DVs were fit with a Gaussian probability density function (PDF) (μ = −0.86, σ = 0.96, p(χ2) = 0.321). Rho DVs were fit with a logistic PDF (μ = 0.64, σ = = 0.29, p(χ2) = 0.971). PDFs are plotted in (B). (B) The probability density of combo rod response DVs was fit with a linear combination of T → A and Rho PDFs: pCombo = c*pRho + (1 − c) pT → A, where c = 0.55 (black line, p(χ2) = 0.068). Vertical red line indicates DV values such that only 5% of Rho responses would receive a lower DV value. Blue line indicates the same for T → A.
Figure 6
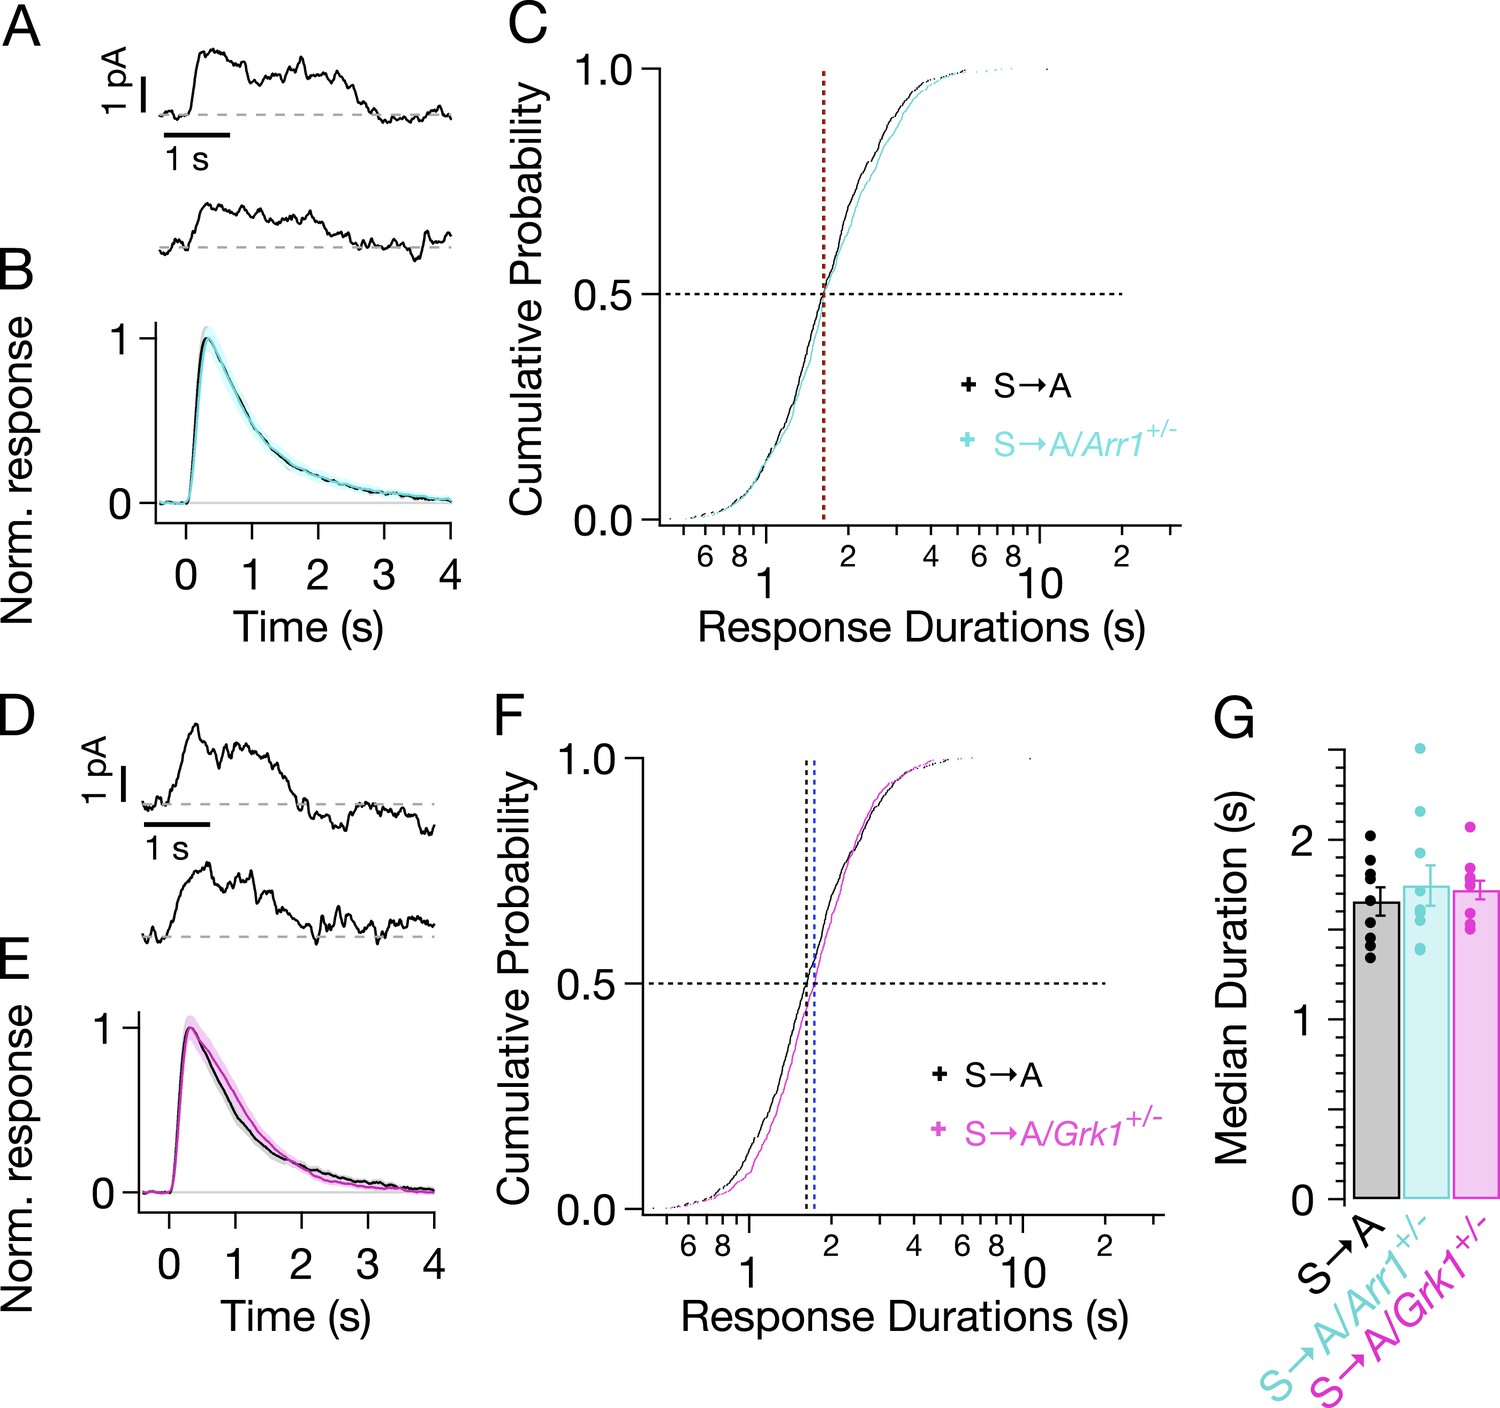
Genetic reduction of arrestin-1 or GRK1 expression does not alter S → A responses.
(A) Representative SPRs in S → A/Arr1+/− rods. (B) Average single S → A responses across cells with either normal (black) or lowered (cyan) arrestin-1 concentration. (C) Response durations in all cells with either normal (black) or lowered (cyan) arrestin-1 concentration. Pooled distributions are indistinguishable (p > 0.05, Kruskal–Wallis analysis of variance, corrected for multiple comparisons). (D–F) Comparison of S → A and S → A/GRK1+/− (magenta) responses and response durations. Pooled distributions are indistinguishable (p > 0.05, Kruskal–Wallis analysis of variance). (G) Median response durations with reduced arrestin-1 or GRK1 in individual S → A rods.
Figure 7
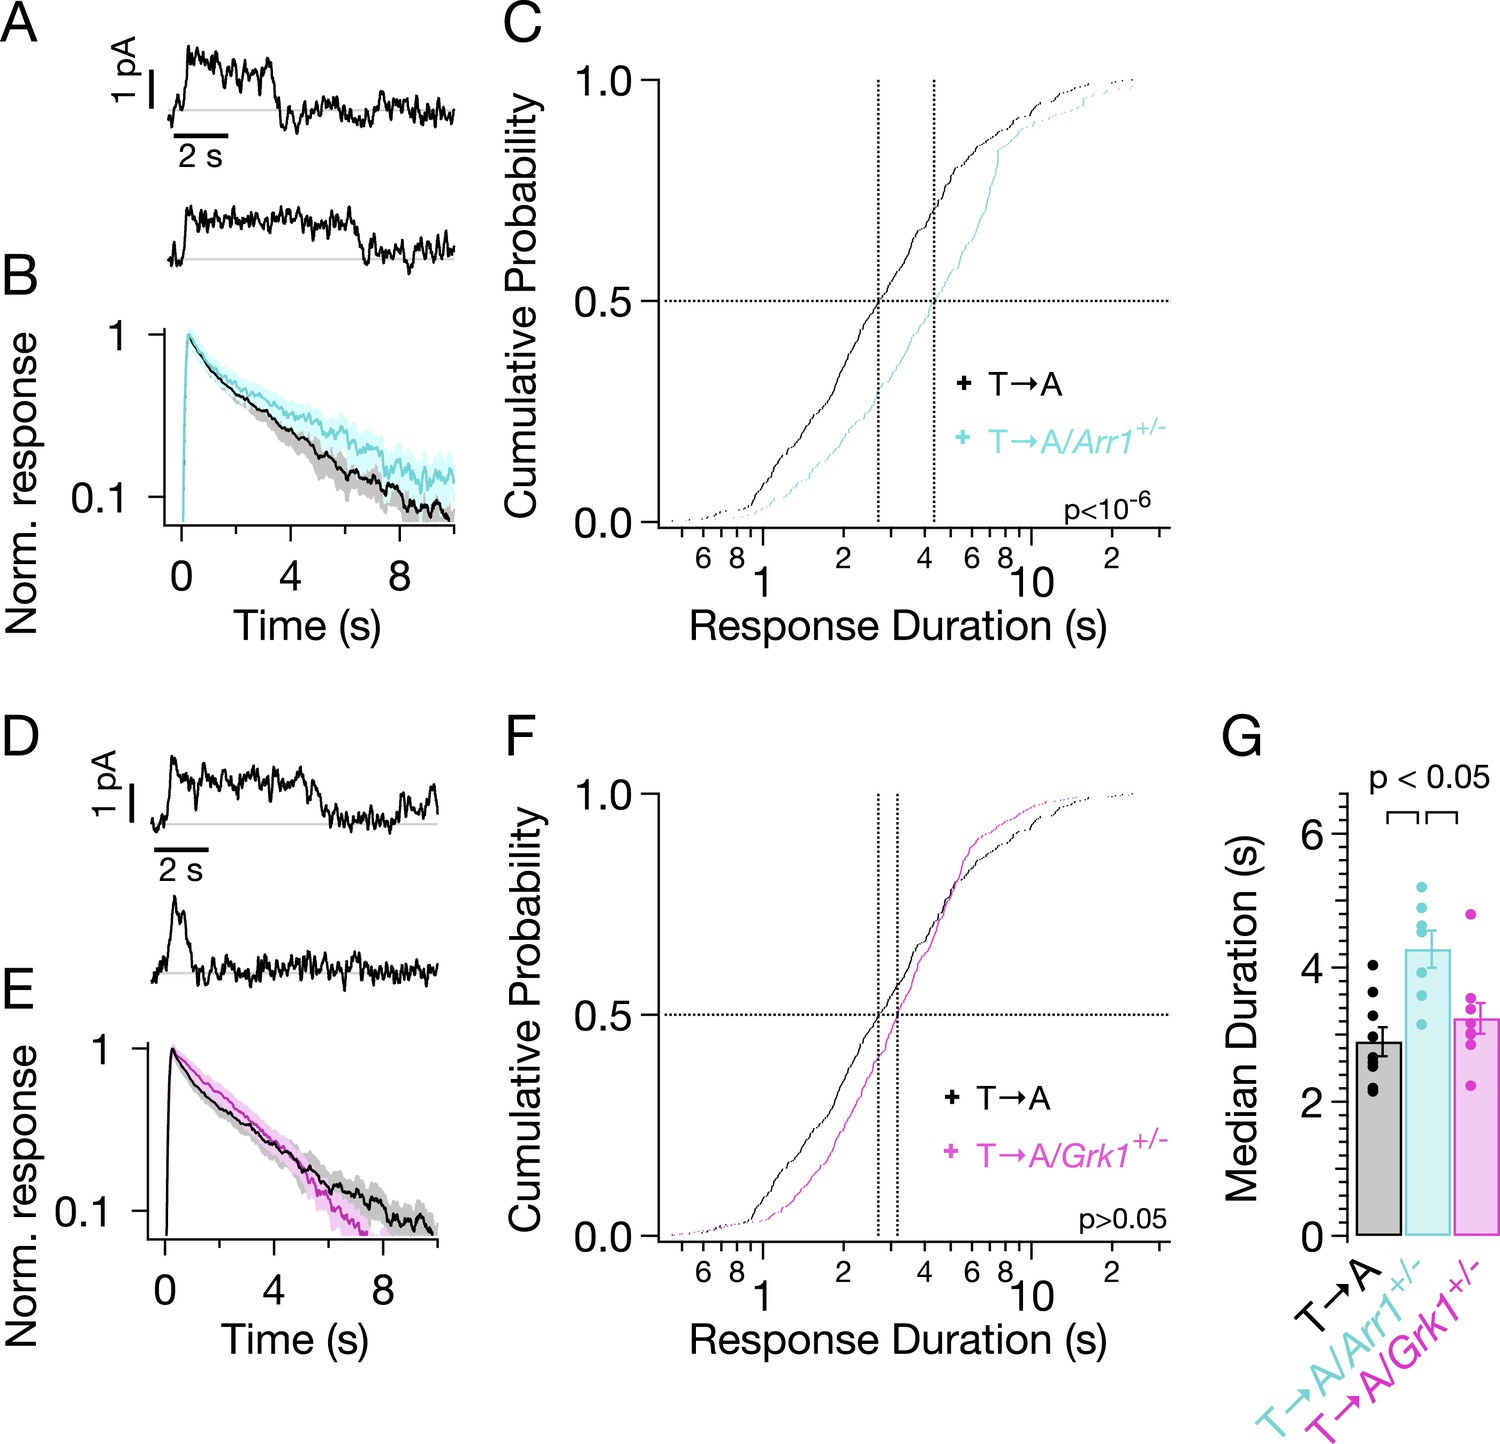
Genetic reduction of arrestin-1 expression prolongs T → A responses.
(A) Representative SPRs in T → A/Arr1+/− rods. (B) Average single T → A responses across cells with either normal (black) or lowered (cyan) arrestin-1 concentration, showing slower response decay with lower arrestin-1 (log y-axis). (C) Response durations in all cells with either normal (black) or lowered (cyan) arrestin-1 concentration. Pooled distributions are significantly different (p < 10−6, Kruskal–Wallis analysis of variance). (D–F) Comparison of T → A and T → A/GRK1+/− (magenta) responses. Pooled response duration distributions are indistinguishable (p > 0.05, Kruskal–Wallis analysis of variance). (G) Median response durations with reduced arrestin-1 or GRK1 in individual T → A rods.
Figure 8 with 1 supplement
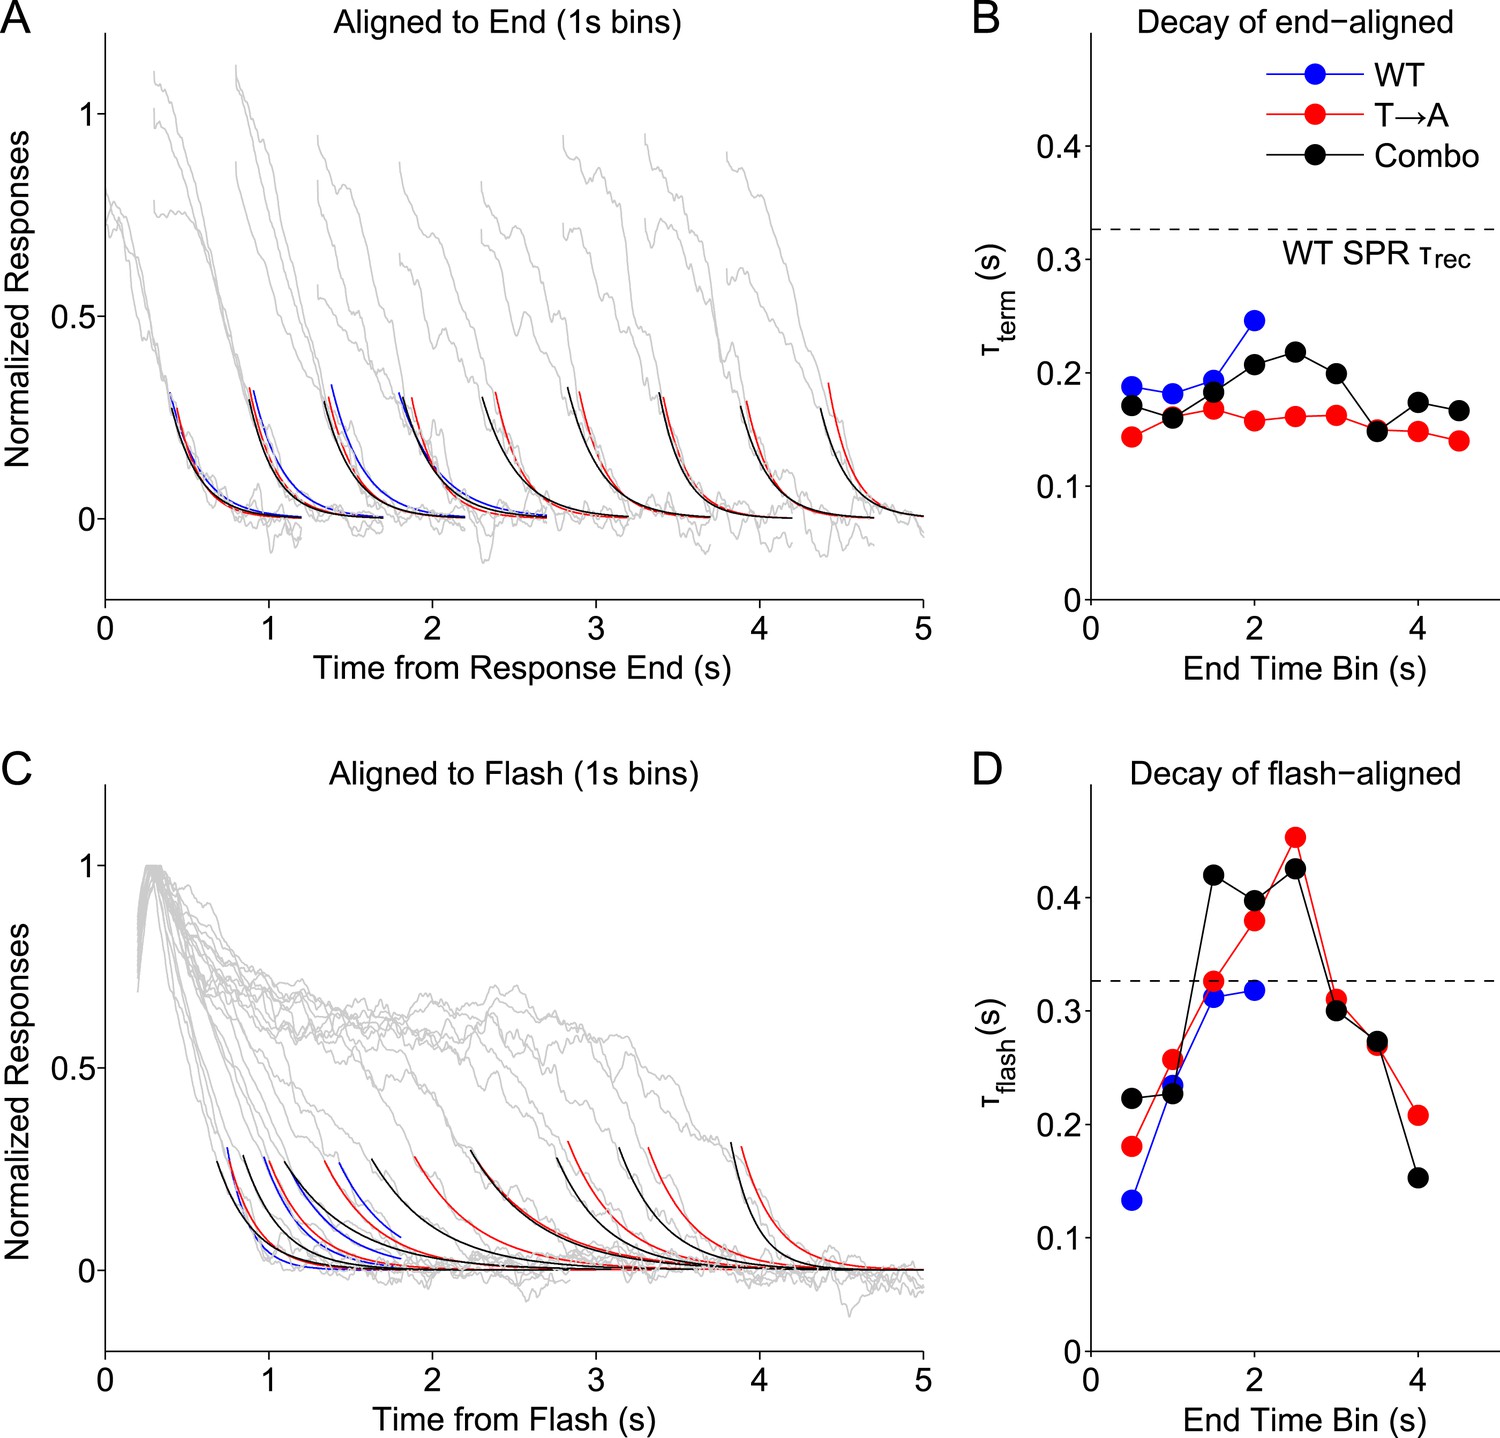
Stochastic rhodopsin desensitization affects the kinectics of single-photon responses.
(A) Responses from WT, T → A, and Combo lines were binned according to their duration, in 1-s wide bins every 0.5 s (oversampling) and aligned to their termination points (gray lines). An exponential function (A*exp(−t/B)) was fit to the decline (<0.25) (blue, WT; red, T → A; black, combo). (B) Time constant of termination-aligned decay (τterm) as a function of the bin center. Dashed line shows the recovery time constant of the average WT SPR. (C) Responses were aligned to the time of the flash and fit with the decay function. (D) Time constant of decay for the average of responses in each 1-s bin, aligned to the flash.
Figure 8—figure supplement 1
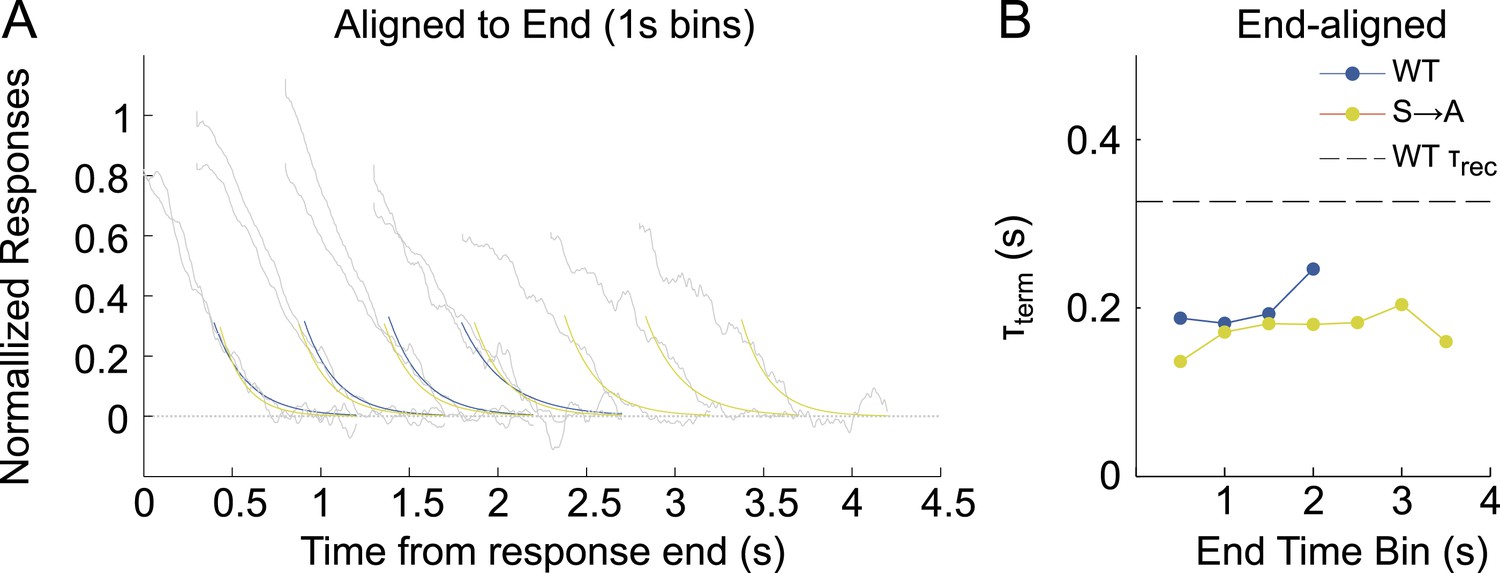
Termination-aligned S → A responses exhibit recovery time constants of ∼200 ms.
(A) Responses from WT and S → A lines were binned according to their duration, in 1-s wide bins every 0.5 s (oversampling) and aligned to their termination points (gray lines). An exponential function (A*exp(−t/B)) was fit to the decline, after crossing a defined threshold (0.25) (blue, WT; yellow, S → A). (B) Time constant of termination-aligned decay (τterm) as a function of the bin center. Dashed line shows the recovery time constant of the average WT SPR.
Tables
Table 1
Population measurements (±SEM) of dark currents and single-photon response (SPR) parameters for pure strains
| Dark current (pA) | SPR peak (pA) | SPR peak time (s) | SPR τrec (s) | SPR mean duration (s) | SPR CVarea | |
|---|---|---|---|---|---|---|
| WT | 10.3 ± 0.2 | 1.35 ± 0.09 | 0.30 ± 0.01 | 0.32 ± 0.04 | 1.19 ± 0.06 | 0.37 ± 0.02 |
| S → A | 8.8 ± 0.5 | 1.34 ± 0.09 | 0.32 ± 0.02 | 0.90 ± 0.06 | 1.84 ± 0.08 | 0.51 ± 0.02 |
| T → A | 10.7 ± 0.7 | 1.55 ± 0.07 | 0.27 ± 0.01 | 3.61 ± 0.44 | 3.96 ± 0.28 | 0.78 ± 0.03 |
-
τrec: recovery time constant.
Download links
A two-part list of links to download the article, or parts of the article, in various formats.
Downloads (link to download the article as PDF)
Open citations (links to open the citations from this article in various online reference manager services)
Cite this article (links to download the citations from this article in formats compatible with various reference manager tools)
C-terminal threonines and serines play distinct roles in the desensitization of rhodopsin, a G protein-coupled receptor
eLife 4:e05981.
https://doi.org/10.7554/eLife.05981


