Protein aggregates are associated with replicative aging without compromising protein quality control
- Eidgenössische Technische Hochschule Zürich, Switzerland
Figures
Figure 1 with 2 supplements
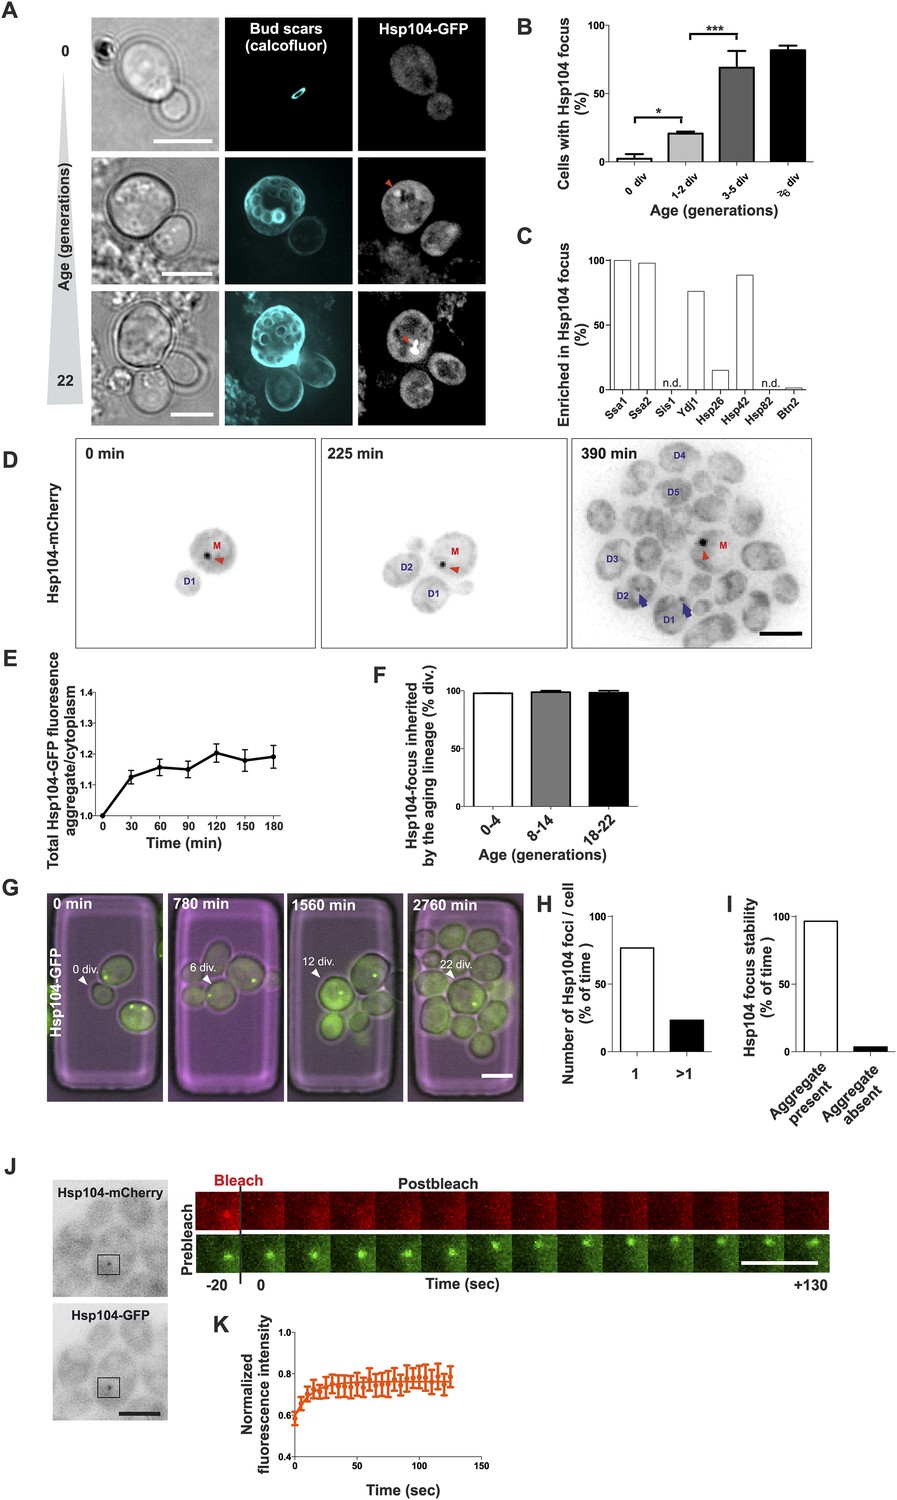
Replicative aging leads to the formation of age-associated protein deposit.
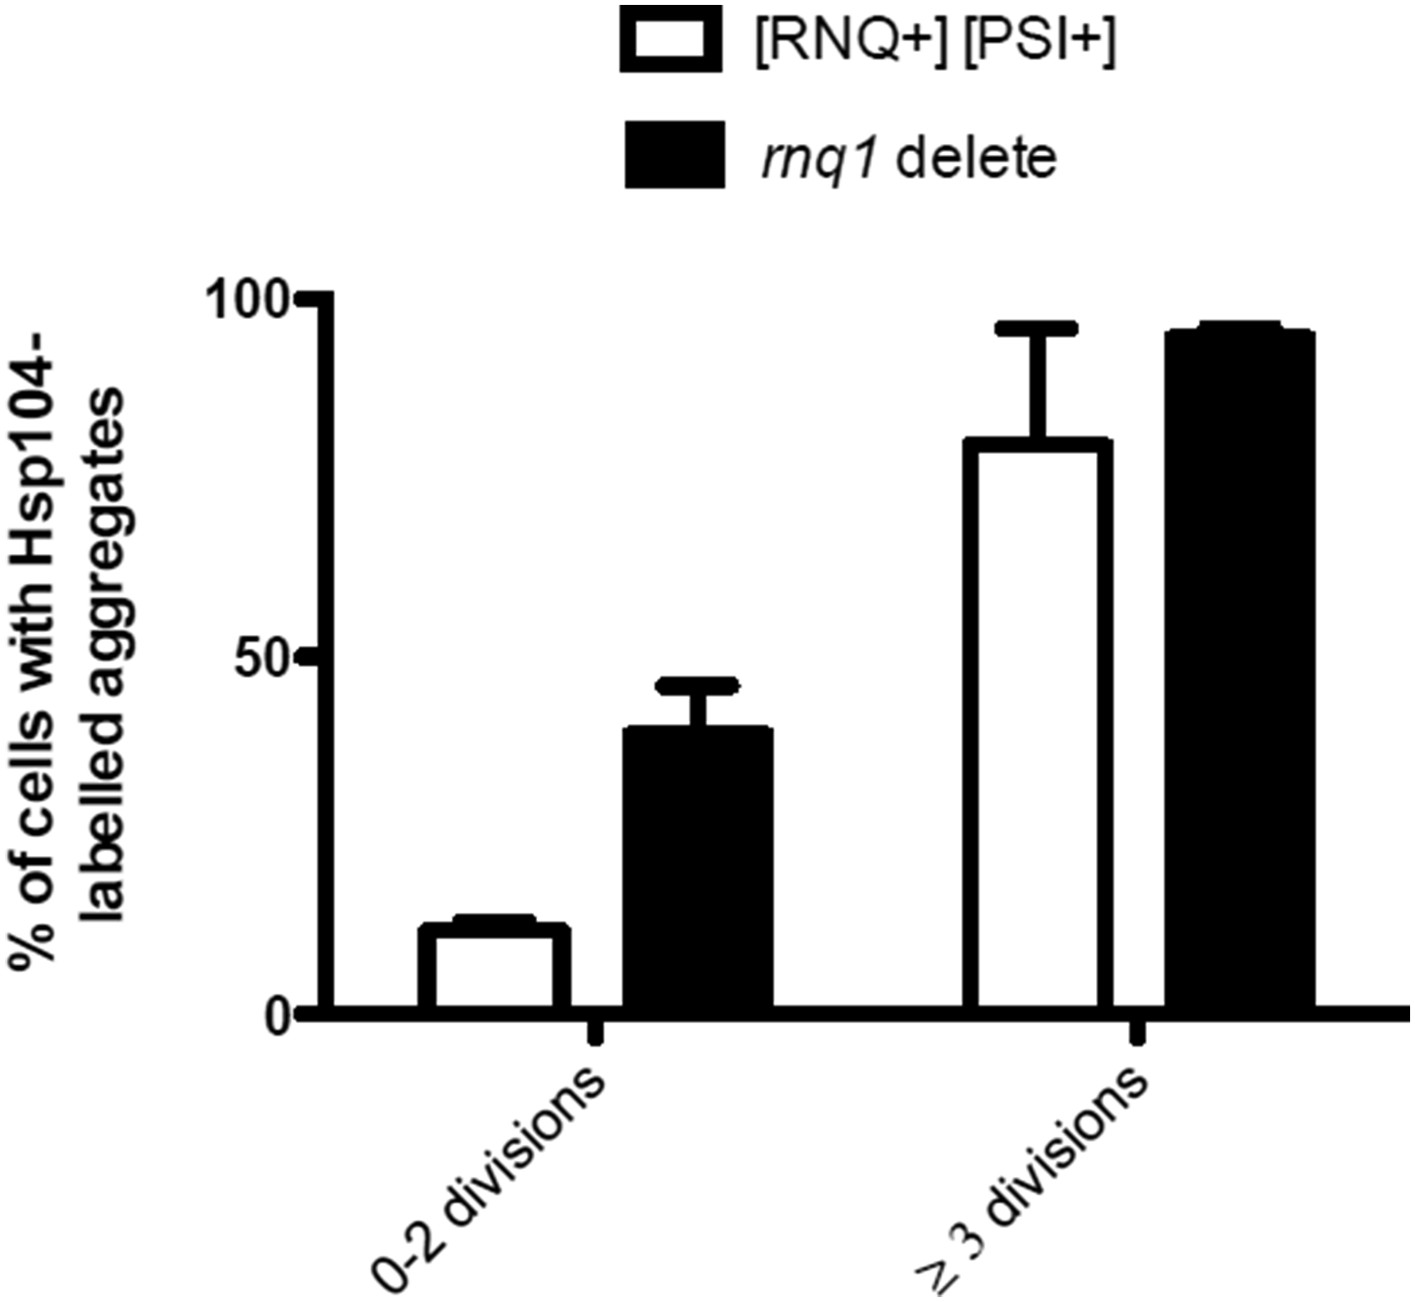
(A) Representative images of cells expressing endogenous Hsp104 tagged with GFP. The C-terminal tagging does not hamper Hsp104 disaggregation activity (Specht et al., 2011). Cells of different age were harvested using the Mother Enrichment Program (MEP) (Lindstrom and Gottschling, 2009) and stained with calcofluor. (B) Percentage of cells of different age groups containing at least one Hsp104-focus, (N = 135 to 472 cells per age group). (C) Fraction of Hsp104-mCherry foci that are enriched with the indicated chaperones (N = 16 to 92 Hsp104-focus containing cells per strain, n.d. = not detected). (D) Representative frames of a movie of dividing cells expressing Hsp104-mCherry (black). Red arrowhead indicates an aggregate that is retained in the mother cell (M). This cell divided five times giving rise to four daughter cells that start to form aggregates after dividing 2–3 times (blue arrows at 390 min). (E) Integrated density at newly forming age-associated protein deposits (deposit/cytoplasm) over time, (N = 26). (F) Fraction of divisions during which the age-associated protein deposit is asymmetrically inherited by the mother cell as a function of the age of the mother cell (N = 66 to 306 divisions per age group from 2-3 independent experiments. The approximate mother cell age was estimated from separate bud scar analysis). (G) Representative micrographs of a dividing mother cell expressing Hsp104-GFP followed for 66 hr in a microfluidic chip (Lee et al., 2012). (H) Proportion of cells having the indicated number of Hsp104 foci. Hsp104 foci containing cells that could be followed >10 consecutive divisions were quantified for the number of Hsp104-foci/cell at each time point, (N = 44). (I) Total time spent with and without an Hsp104-focus for cells undergoing >10 consecutive divisions, starting with a focus, (N = 44). (J) Fluorescent recovery after photobleaching (FRAP) analysis of Hsp104-mCherry turnover at age-associated protein deposit. The mCherry signal at the age-associated protein deposit was photobleached in HSP104-GFP/HSP104-mCherry diploid cells and the kinetics of recovery were monitored, using the GFP signal to localize the age-associated protein deposit over time. (K) Fitting of nine recovery curves showed that on average a large (59%) fraction was immobile and the half-time recovery for the mobile fraction was 8.9 s, (N = 9). Scale bars 5 μm. Graphs display mean ± SEM, *p < 0.05, ***p < 0.001.
Figure 1—figure supplement 1
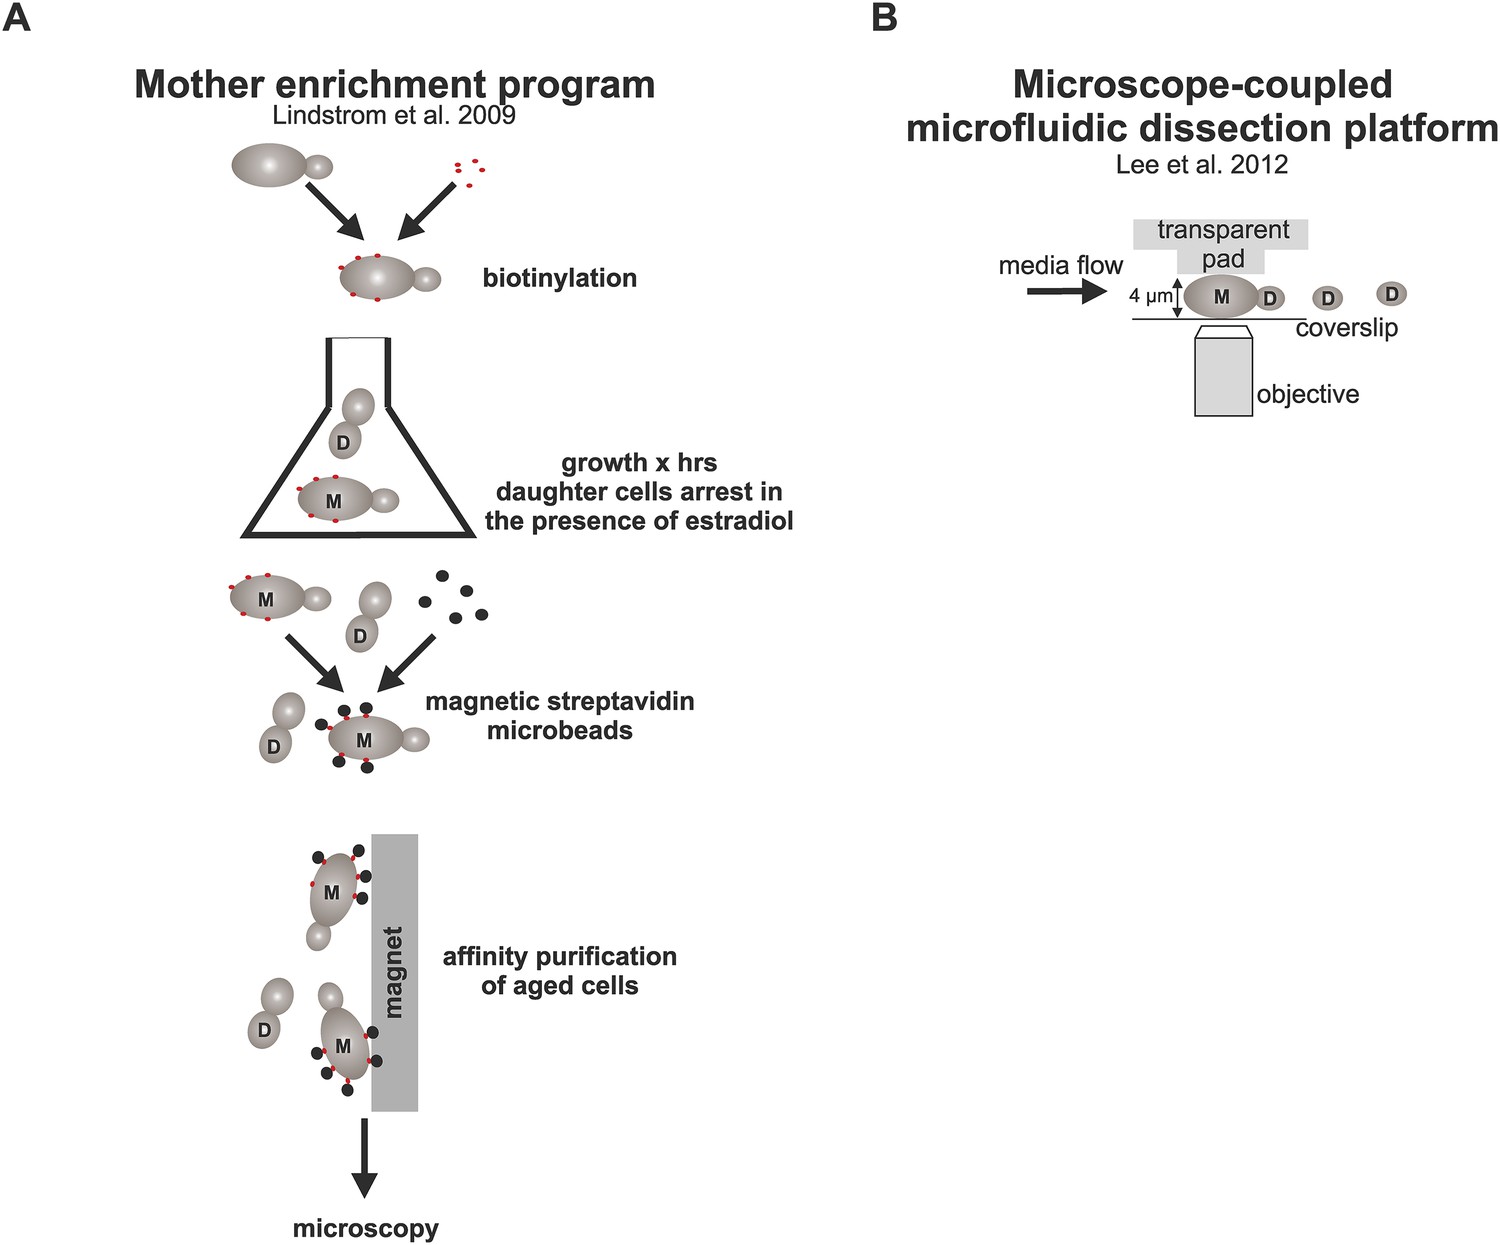
Schematic representation of the strategies used here to study aged cells.
(A) Strategy to obtain old cells: cells were biotinylated and grown for (x) amount of time in YPD media containing estradiol, which activates the MEP (Lindstrom and Gottschling, 2009) and results in daughter specific cell cycle arrest due to excision of two essential genes UBC9 and CDC20. After desired time, aged mother cells containing the cell wall-linked biotin coat were coupled to streptavidin microbeads, purified with affinity chromatography, and imaged under the microscope. (B) The microfluidic system (Lee et al., 2012) allows microscopic examination of trapped mother cells as they undergo repetitive divisions. Cells are captured between a PDMS pad and a glass cover slip and subjected to constant media flow, which washes away the newly born daughter cells that are not captured between the pad due to their smaller size.
Figure 1—figure supplement 2
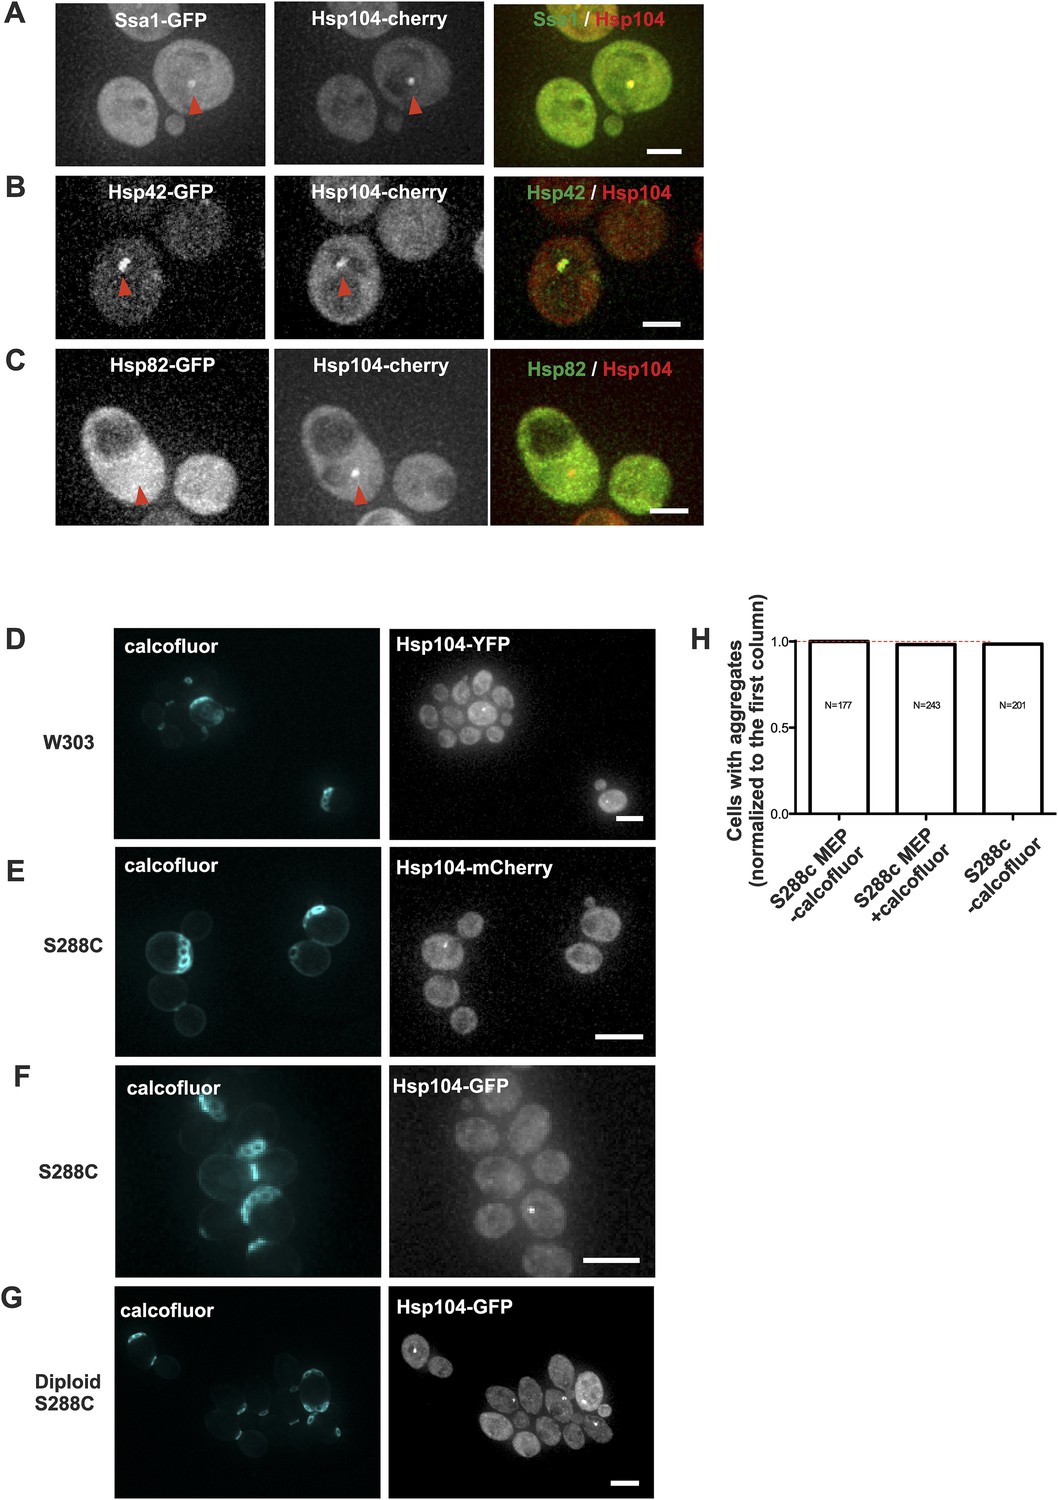
Age-associated protein deposit formation is a general age-dependent phenomenon marked by a subset of chaperones.
(A–C) Representative images of Hsp104-mCherry expressing cells co-tagged with (A) Ssa1-GFP (B) Hsp42-GFP, or (C) Hsp82. Age-associated protein deposit are depicted with a red arrowhead. (D) W303 cells expressing Hsp104-YFP. (E) S288C cells expressing Hsp104-mCherry or (F) Hsp104-GFP. (G) Diploid S288C cells expressing Hsp104-GFP. (H) Comparison of the relative amount of age-associated protein deposit containing cells in calcofluor treated MEP and non-MEP background cells vs non-calcofluor treated MEP strain background, (N = 177–243 cells analyzed per genotype). Scale bars: (A–C) 2 μm, (D–G) 5 μm.
Figure 2
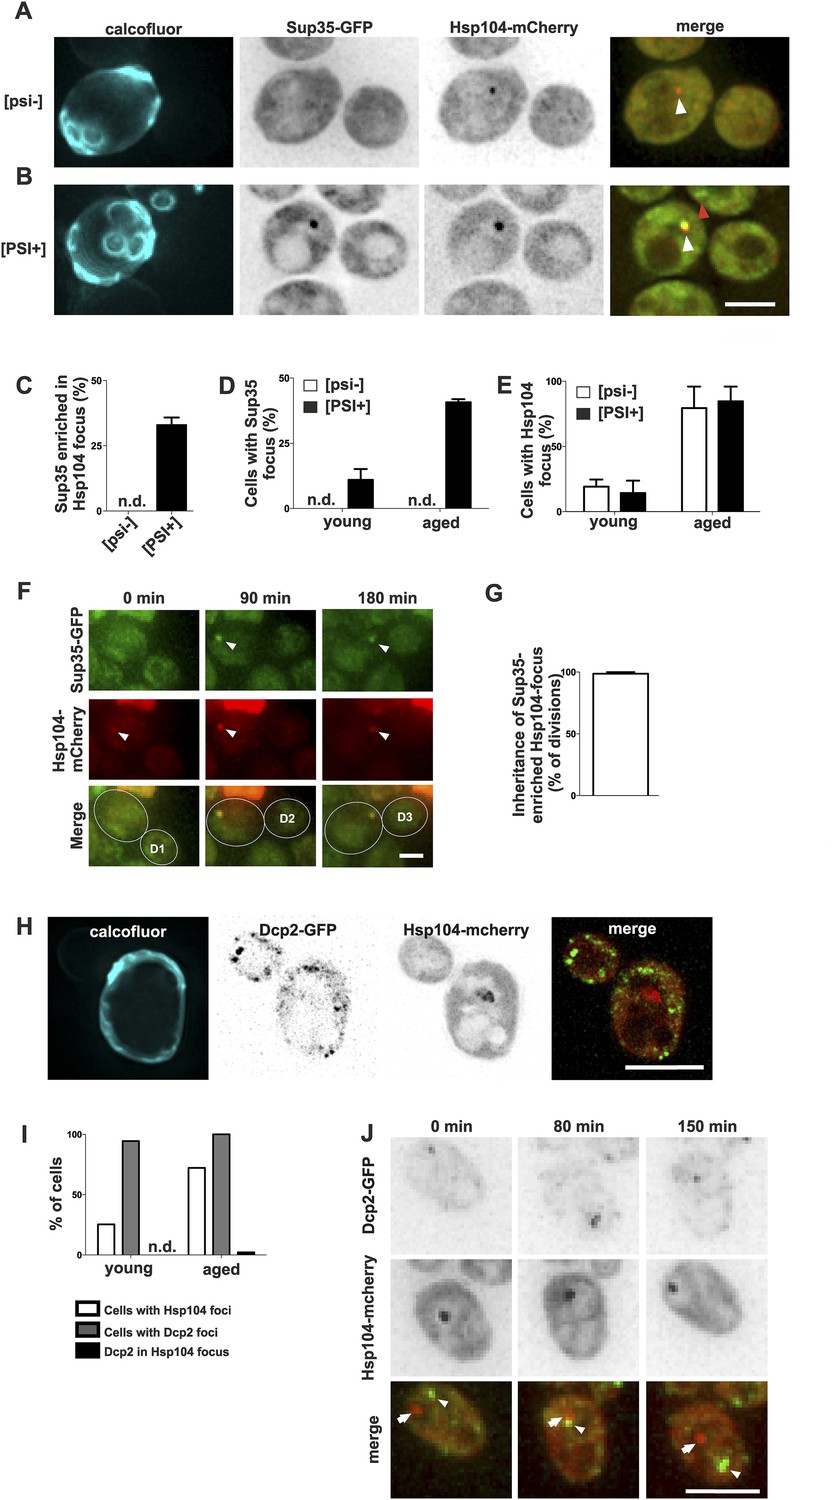
Prion form of Sup35 is deposited to the age-associated protein deposit.
(A, B) Co-localization of Sup35-GFP and Hsp104-mCherry in diploid [psi−] (A) and [PSI+] (B) cells, where a single locus of the respective gene was tagged with the fluorescent marker indicated. White arrowhead indicates the age-associated protein deposit (Hsp104 positive) and the red arrowhead Sup35-aggregates not associated with the age-associated protein deposit. (C) Percentage of age-associated protein deposits in [psi–] and [PSI+] cells with enriched Sup35, (N = 130). (D) Percentage of cells with large Sup35-foci in cells of indicated age groups (N = 157–184 cells pre age group, average age young [psi–] 1.1, young [PSI+] 1.1, aged [psi–] 6.9, aged [PSI+] 5.9 generations). (E) Percentage of [psi–] and [PSI+] cells of the indicated age group (see D) containing an age-associated protein deposit, (N = 157–184 cells pre age group). (F) Time-lapse images of a [PSI+] cell co-expressing Sup35-GFP (green) Hsp104-mCherry (red) at the indicated time points. Arrowheads point at the age-associated protein deposit as observed in the different channels. The newborn daughters are indicated in the bottom row. (G) Percentage of divisions where the Sup35-GFP-labeled age-associated protein deposit is retained in the aging mother cell lineage, (N = 204 divisions). (H) Fluorescent images of a cell co-expressing the P-body protein Dcp2 tagged with GFP and Hsp104 tagged with mCherry. (I) Percentages of cells of indicated age groups that contain the indicated fluorescent foci, (N = 18–71 per group). (J) Time-lapse, fluorescent images of Dcp2-GFP and Hsp104-mCherry expressing cells at the indicated time points after switching the cells to 0.1% glucose. Scale bars (A, B, H, J) 5 μm, (F) 2 μm. Graphs display mean ± SEM.
Figure 3
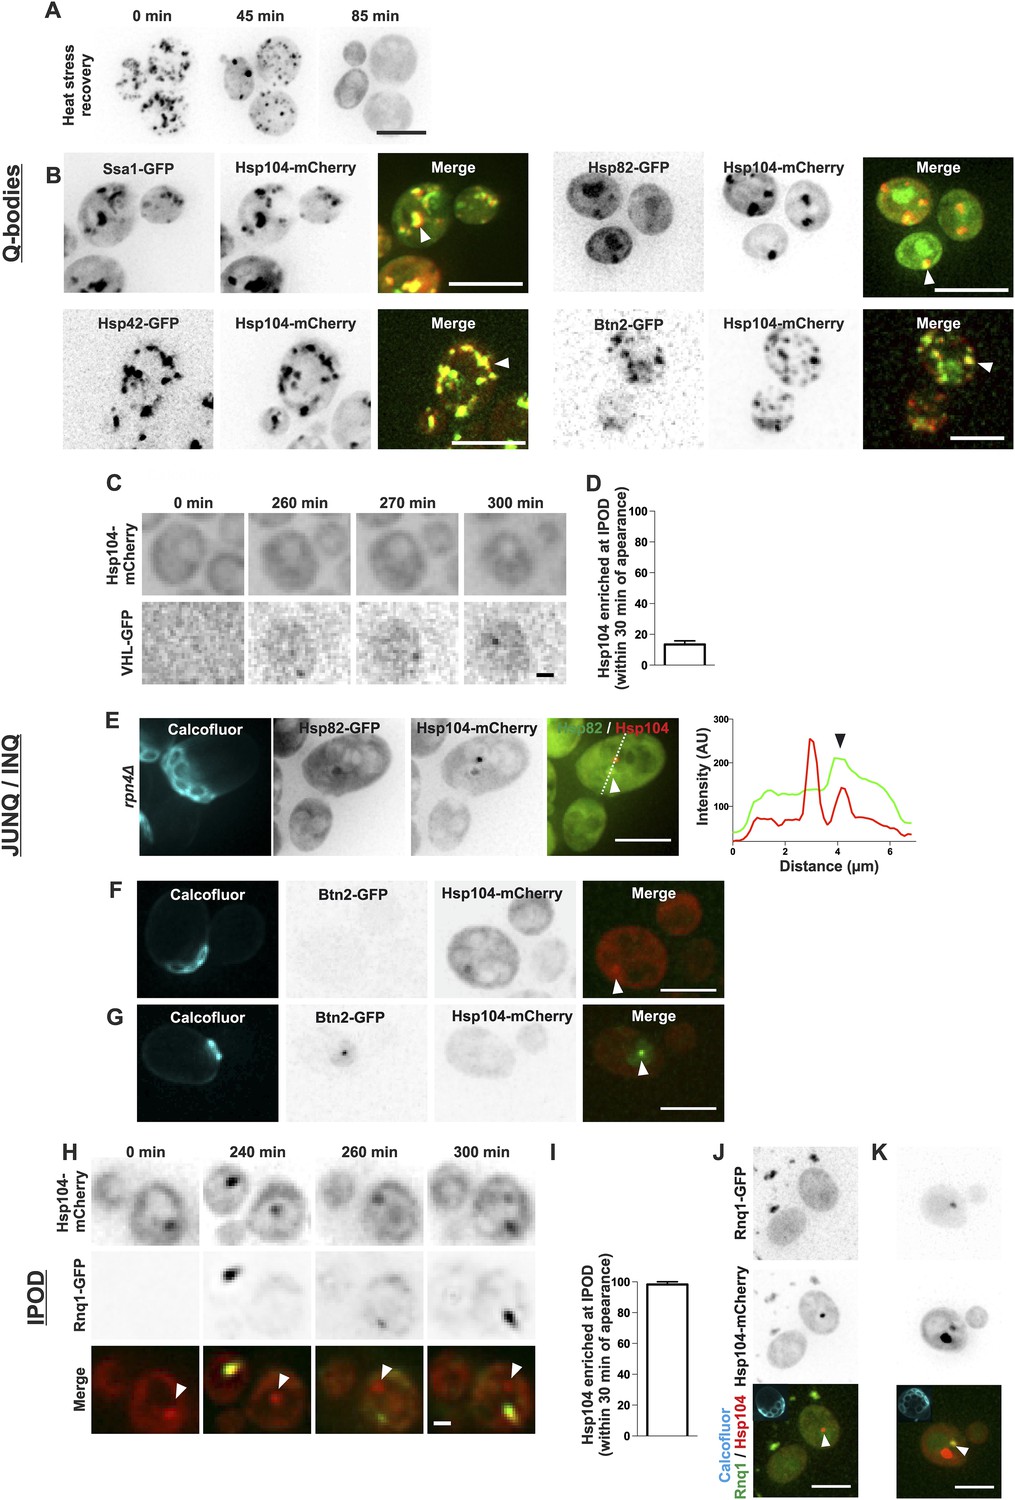
The age-associated protein deposit can be distinguished from Q-bodies, JUNQ/INQ, and IPOD.
(A) Cells were heat shocked (42°C for 30 min) to induce the formation of Q-bodies (stress induced Hsp104-labeled aggregates) and the kinetics of Q-bodies dissolution was followed with time-lapse microscopy of Hsp104-GFP. (B) Cells were imaged after heat shock (42°C for 30 min). Arrowhead in 3D-projected images depicts co-localization of Hsp104 with age-associated deposit-resident (Ssa1, Hsp42) and non-resident (Hsp82, Btn2) markers in Q-bodies (compare with Figure 1C). (C) The expression of JUNQ/INQ marker VHL-GFP was induced at the start of the imaging to follow its recognition by Hsp104-mCherry. (D) Quantification of VHL-GFP foci recognized by Hsp104-GFP within 30 min of their appearance (N = 29 cells). (E) 3D-projected images of RPN4 deleted cells expressing Hsp82-GFP and Hsp104-mCherry. Hsp82-GFP, which localizes to Q-bodies (Figure 3A) but not to age-associated protein deposits (Figure 1C), co-localizes with one of the two Hsp104-mCherry foci in aged cell (see fluorescence intensity line-scan over the two foci). (F) 3D-projected image of Btn2-GFP and Hsp104-mCherry expressing cell. Btn2 is typically very low abundant and does not accumulate (98.6% of cases, N = 72) to the age-associated deposit (white arrowhead). (G) Cell with a Btn2 focus, which typically (96.4% of cases, N = 30) did not display accumulation of Hsp104-mCherry). (H) Rnq1-overexpression was induced at the onset of imaging. The panel shows the z-sections displaying the age-associated deposit (white arrowhead in ‘merge’). (I) Quantification of newly formed Rnq1-GFP foci that accumulate Hsp104-mCherry within 30 min of their appearance (N = 53 cells). (J) Representative image of [PIN+, PSI+] cell harboring GFP-tagged endogenous Rnq1 and mCherry-tagged Hsp104. Arrowhead indicates the age-associated protein deposit. (K) Example of a [PIN+, PSI+] cell that displays an Rnq1-aggregate. Arrowhead indicates Hsp104-labeled foci, of which only one has accumulated Rnq1. Scale bars: A-B, E, J-K 5 μm, C, G 2 μm. Graphs display mean ± SEM.
Figure 4
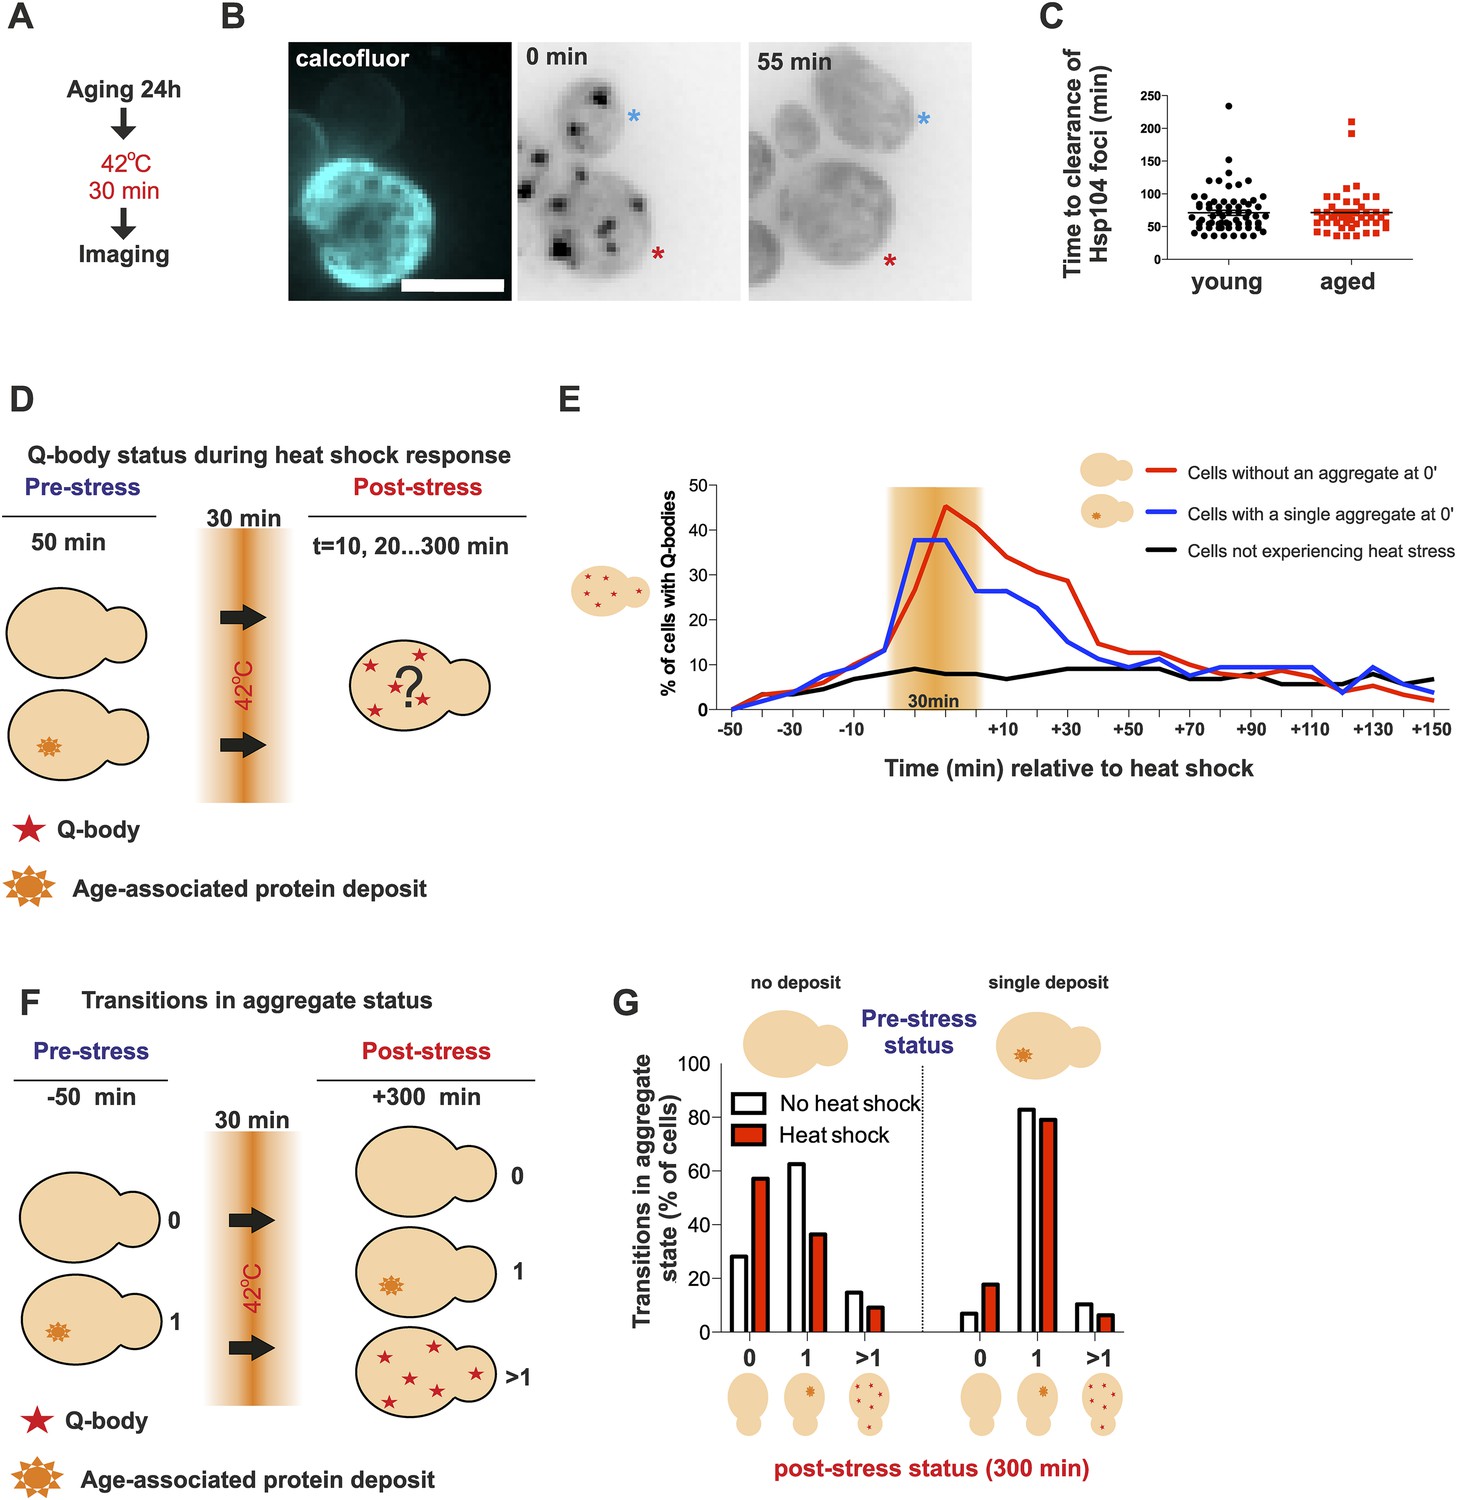
Aged cells are not impaired in handling proteotoxic stress.
(A) Experimental scheme. (B) Representative image of displaying the dynamics of recovery from heat shock induced proteotoxic stress (Q-bodies) between aged (red star) and young cell (blue star). (C) Q-body clearance time of individual cells of the indicated age groups, (old: average 9.2 generations, age between 6 and 19, N = 50; young: 0.4 generations, age between 0 and 1, N = 70). (D) Experimental scheme: Hsp104-mCherry-expressing cells were captured on a temperature-controlled microfluidic device and imaged prior (−50 min), during (30 min) and after (up to 300 min) mild heat shock. It is important to note, that the strength of the heat stress induced on the microfluidic platform is not comparable with Figure 3A,B and Figure 4A–C. (E) Single cell analysis of Q-body formation (cells with >1 Hsp104-foci) in cells with a pre-existing age-associated protein deposit (red line, N = 53), cells without a pre-existing deposit (blue line, N = 97), and cells that did not experience stress (N = 82). Data from two independent experiments. (F) Transitions in the aggregate state were recorded 50 min before the heat stress and 300 min after the heat stress. (G) Quantification of transitions (N = 32–77 per group, from two independent experiments). White bars indicate cells that did not experience heat stress and red bars denote transitions in aggregate state in heat-stress experienced cells. Scale bar 5 μm.
Figure 5
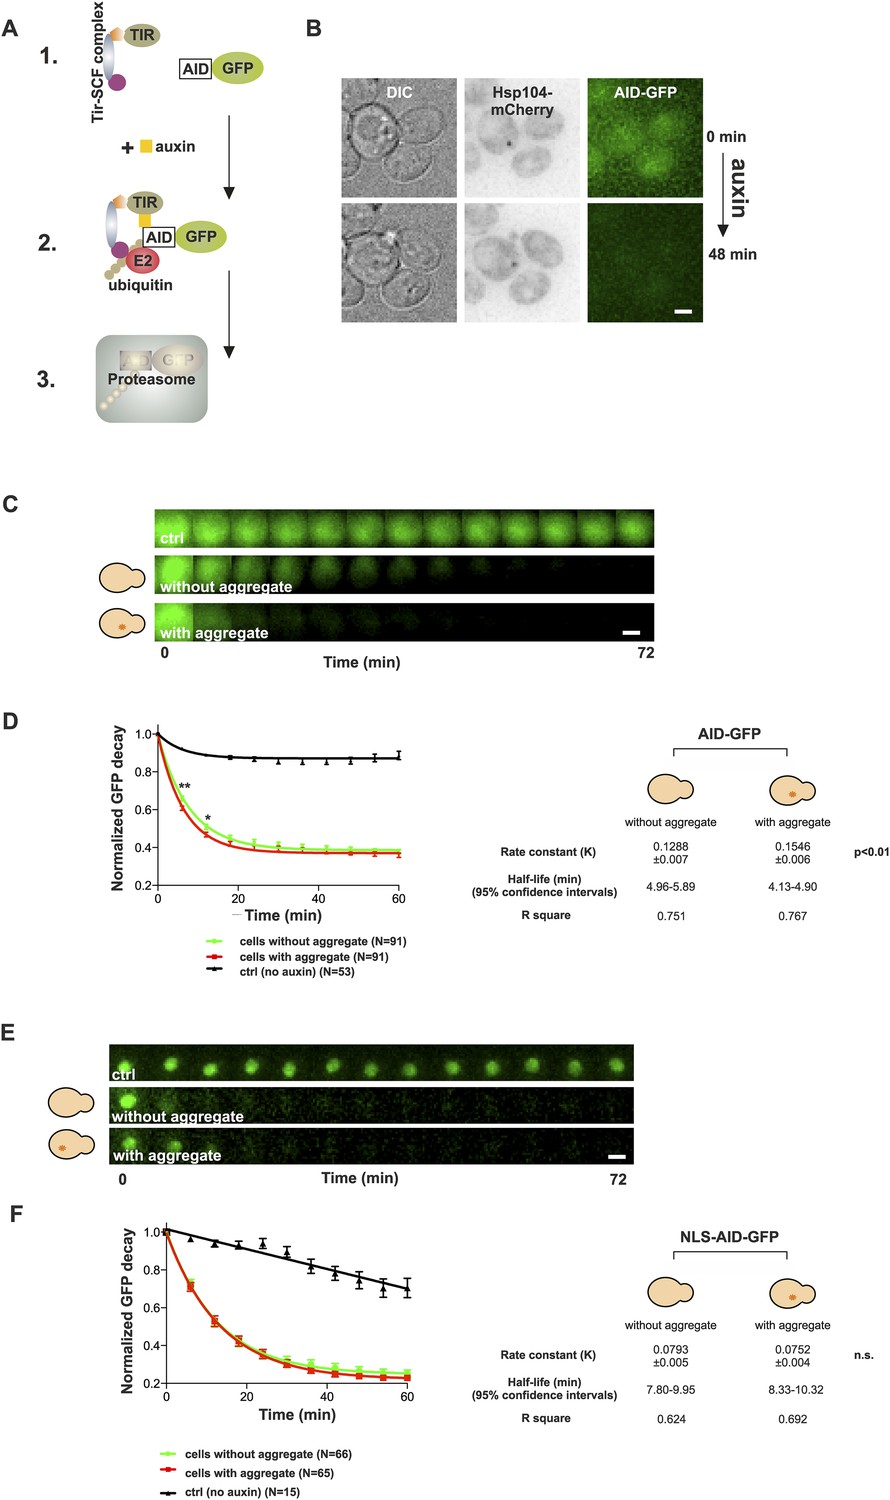
Presence of age-associated protein deposit promotes the function of cytosolic ubiquitin–proteasome system in vivo.
(A) Schematic representation of the auxin-induced degron (AID)-system (Nishimura et al., 2009). Addition of auxin facilitates the recognition of the degron-motif in the target protein (GFP) by the exogenously expressed Arabidobsis thaliana E3 ligase SCF-Tir1 and subsequent ubiquitination and degradation by the endogenous ubiquitin–proteaome system (UPS). (B) Representative images of cells expressing Hsp104-mCherry and AID-GFP taken immediately (0 min) and 48 min after auxin-addition. (C) Examples of time frames GFP degradation in the absence of auxin (upper panel) in the presence of auxin in cells with (middle) or without (below) an age-associated protein deposit. (D) The decay rates of GFP in the indicated groups. The error bars depict the normalized intensity values (average ± SEM) derived from 53 (ctrl) and 91 (auxin added) cells from three pooled replicates. The solid lines indicated non-linear one-phase decay fit. (E) GFP-NLS decay in the representative groups. (F) The decay rates and the graph fitting of NLS-GFP in the indicated groups as in (D). N = 15 (ctrl), 65–66 (auxin added) cells from three pooled replicates. The error bars depict the normalized intensity values (average ± SEM), while the solid lines indicate the non-linear one-phase decay fit.
Figure 6
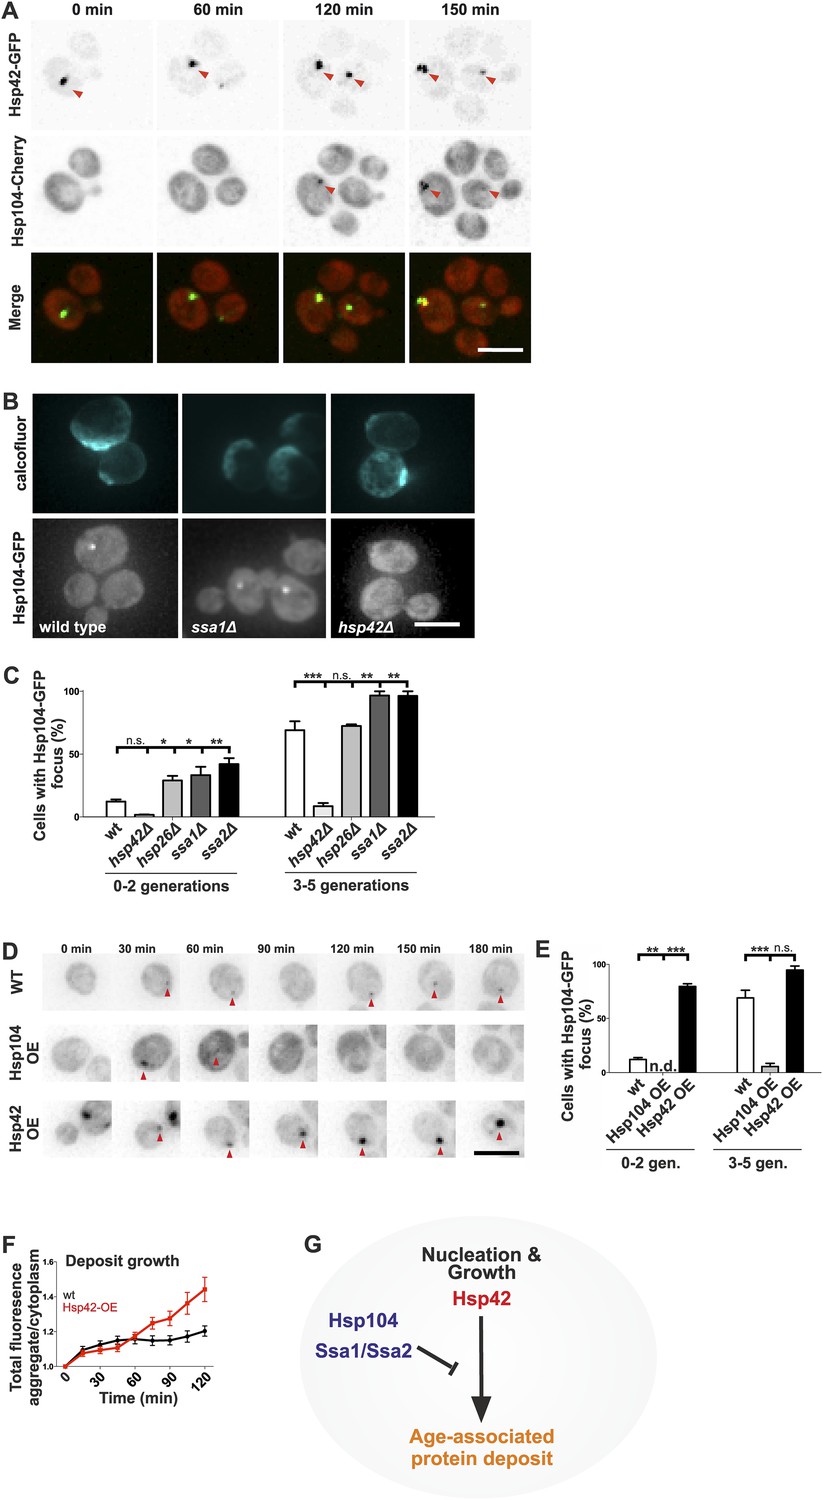
Identification of the roles of chaperones in age-associated protein deposit assembly.
(A) Representative time-lapse images of cells expressing endogenously tagged Hsp42-GFP (upper panel) and Hsp104-mCherry (middle panel). Arrowhead depicts the age-associated protein deposit structure. (B) Representative images of aged Hsp104-GFP expressing wild-type, ssa1Δ, and hsp42Δ mutant cells. (C) Quantification of Hsp104-foci containing cells in indicated age groups, (N = 317–1020 cells per genotype). (D) Time-lapse images of cells expressing endogenous Hsp104-GFP in wild-type, Hsp104 over-expressing, and Hsp42 over-expressing cells (age-associated protein deposit depicted by a red arrowhead). (E) Quantification of percentage of cells with age-associated protein deposit in wild-type, Hsp104 over-expressing, and Hsp42 over-expressing cells of indicated age groups (N = 432–1020 cells per genotype). (F) Quantification of endogenous Hsp104-GFP integrated density (age-associated protein deposit/cytoplasm) following its appearance in wild-type (black line) and Hsp42 over expressing cells (red line), (N = 19–23). (G) A summarizing model of the pathway underlying age-associated protein deposit formation. Scale bars 5 μm. Graphs display mean ± SEM, n.s not significant, *p < 0.05, **p < 0.01, ***p < 0.001.
Figure 7
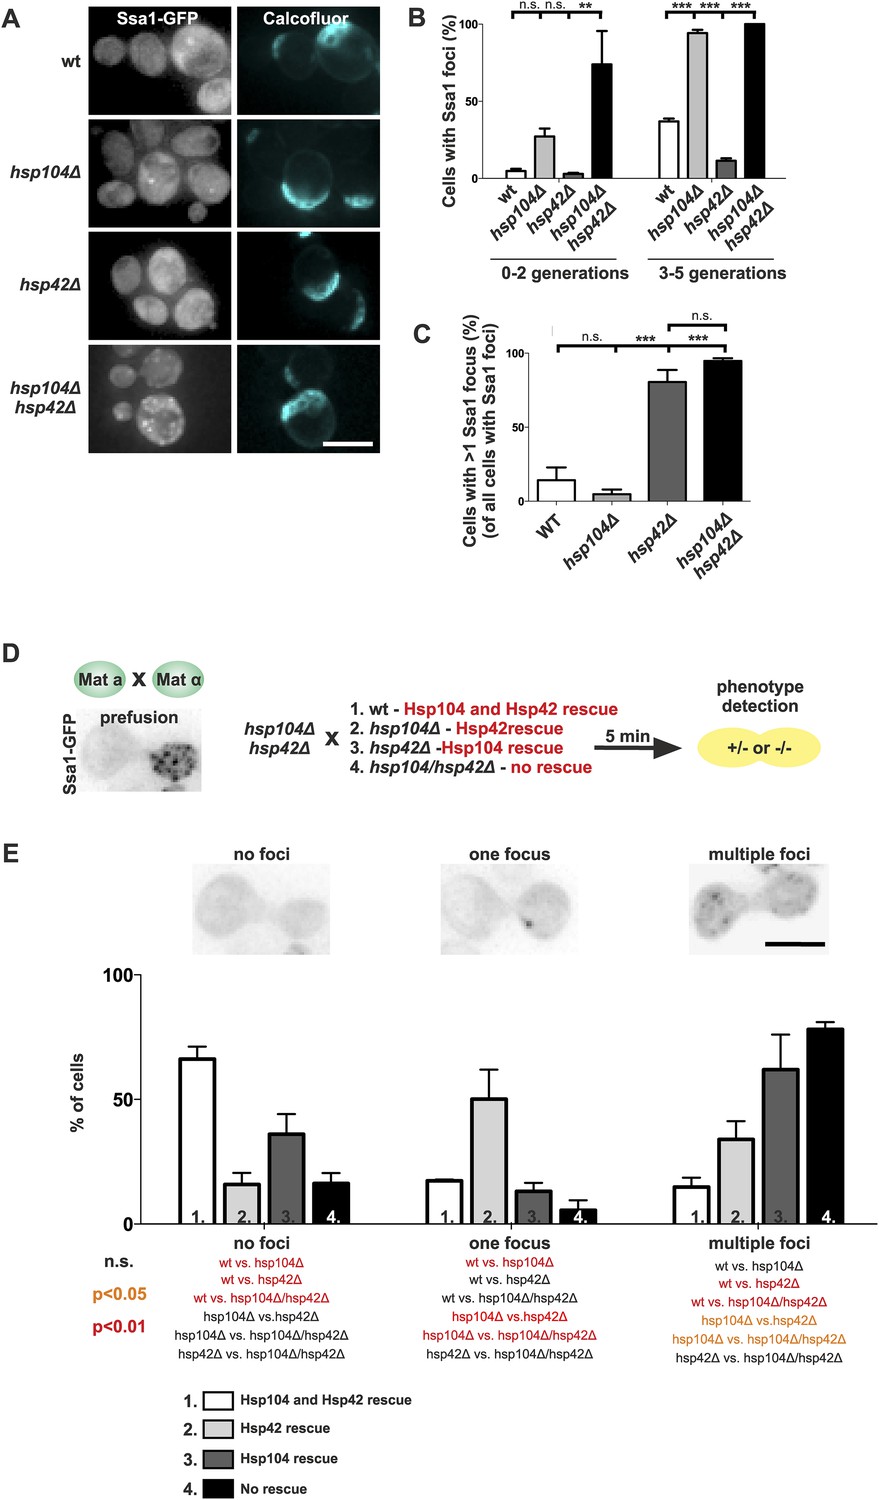
The assembly of age-associated protein deposit is promoted by Hsp42 and counteracted by Hsp104/Hsp70.
(A) Representative aged wild-type, hsp104Δ, hsp42Δ and hsp104Δ and hsp42Δ double-mutant cells. (B) Quantification of the fraction of cells in indicated age groups that display Ssa1-GFP foci (age-associated protein deposit), (N = 363–493 cells per genotype). (C) Quantification of the portion of cells that display >1 Ssa1 foci from all Ssa1-foci containing cells, (N = 363–493 cells per genotype). (D) Illustration of the experimental scheme of the reconstitution assay. Cells that lack both HSP104 and HSP42 and display fragmented aggregate phenotype were mated with cells of the opposite mating type to reintroduce either Hsp104 and/or Hsp42. The resulting zygote was imaged with time-lapse microscopy and analyzed 5 min after fusion to score for aggregation phenotype (analyzed by Ssa1-GFP). (E) Quantification of the Ssa1-GFP phenotype (no foci, one focus, multiple foci) 5 min post fusion, (N = 73–100 fusion events per genotype). Scale bars 5 μm. Graphs display mean ± SEM, n.s not significant, **p < 0.01, ***p < 0.001.
Figure 8

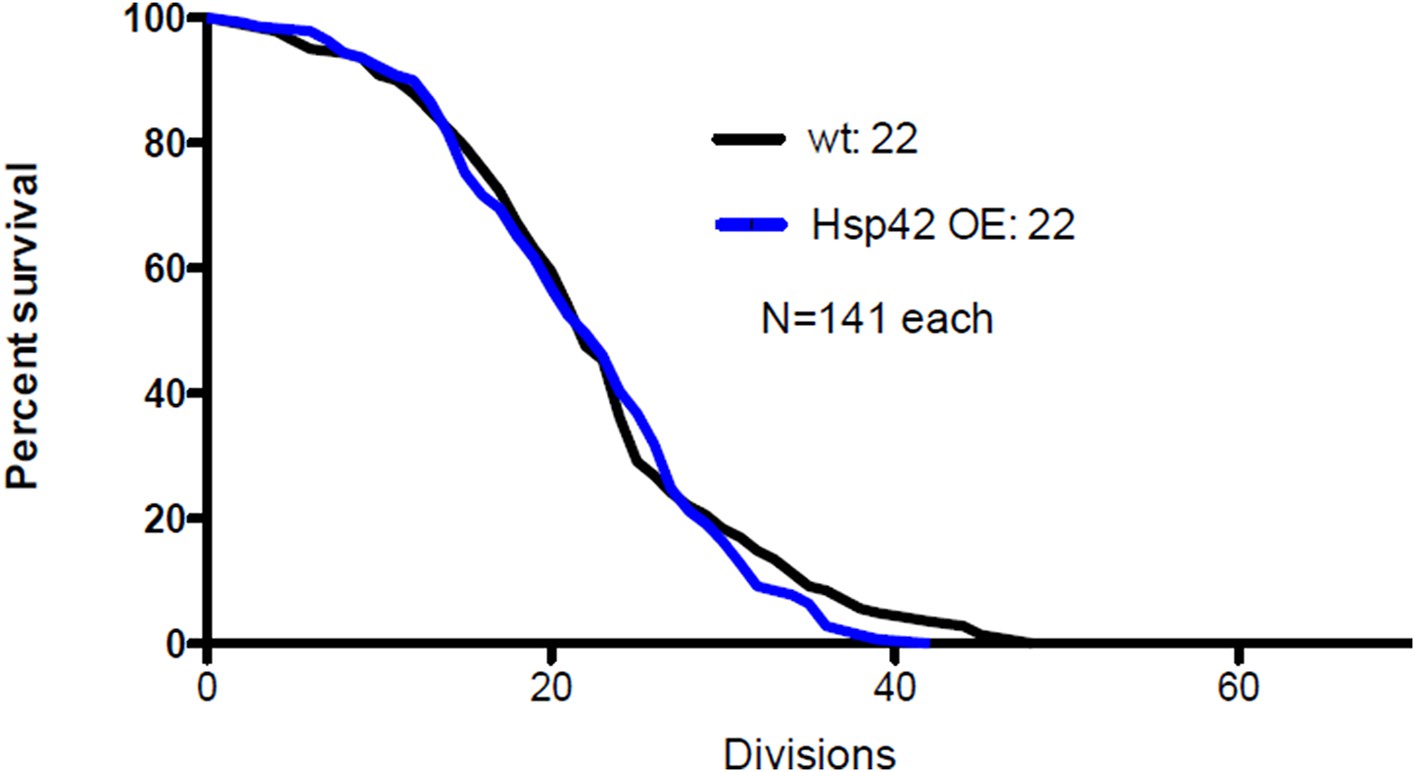
Age-associated protein deposit formation establishes asymmetric inheritance of protein aggregates and correlates with replicative age.
(A) Time-lapse imaging of Ssa1-GFP in hsp42Δ hsp104Δ double-mutant cells (arrowheads denote Ssa1-GFP aggregates relocating from the mother cell to the bud). (B) Quantification of Ssa1-GFP foci found in the buds of mitotic yeast cells (N = 216–434 buds per genotype). (C) Replicative aging experiments of wild-type (black line, 27 generations), hsp104Δ mutant (blue line, 21.5 generations), hsp42Δ mutant (red line, 39 generations), and hsp104Δ and hsp42Δ double mutant (purple, 23 generations) single cells, (N = 101–140 cells per genotype). (D) A schematic model for the age-associated protein deposit pathway: Hsp42 acts as a collector of protein aggregate seeds and promotes their deposition at the ER membrane ensuring their asymmetric inheritance by the aging lineage during mitosis. These cytoplasmic seeds are subjected to Hsp104/Hsp70-dependent refolding, which is inactive (blue rectangle) at the site of the age-associated protein deposit assembly. Scale bar 5 μm. Graph displays mean ± SEM, n.s not significant, ***p < 0.001.
Author response image 1
Author response image 2
The expression of Sup35-NM-YFP in the MEP strain.
Left: at the start of the GAL induction, Right: 250 minutes later.
Author response image 3
Videos
Video 1
Age-associated protein deposit is a stable structure that is faithfully inherited by the aging mother cell lineage.
Aged yeast cell expressing Hsp104-mCherry (in green) to mark protein aggregates and Cdc10-GFP (in red) to mark the mother bud interface undergoing four consecutive divisions.
Video 2
The lack of the age-associated protein deposit assembly pathway results in the inheritance of the aggregates by the daughter cells.
Expression of Ssa1-GFP was followed in hsp104Δ hsp42Δ double-mutant cell as it underwent cell division.
Additional files
-
Supplementary file 1
Yeast strains used in this study.
- https://doi.org/10.7554/eLife.06197.015
Download links
A two-part list of links to download the article, or parts of the article, in various formats.
Downloads (link to download the article as PDF)
Open citations (links to open the citations from this article in various online reference manager services)
Cite this article (links to download the citations from this article in formats compatible with various reference manager tools)
Protein aggregates are associated with replicative aging without compromising protein quality control
eLife 4:e06197.
https://doi.org/10.7554/eLife.06197


