fMRI reveals neural activity overlap between adult and infant pain
- University of Oxford, United Kingdom
Figures
Figure 1
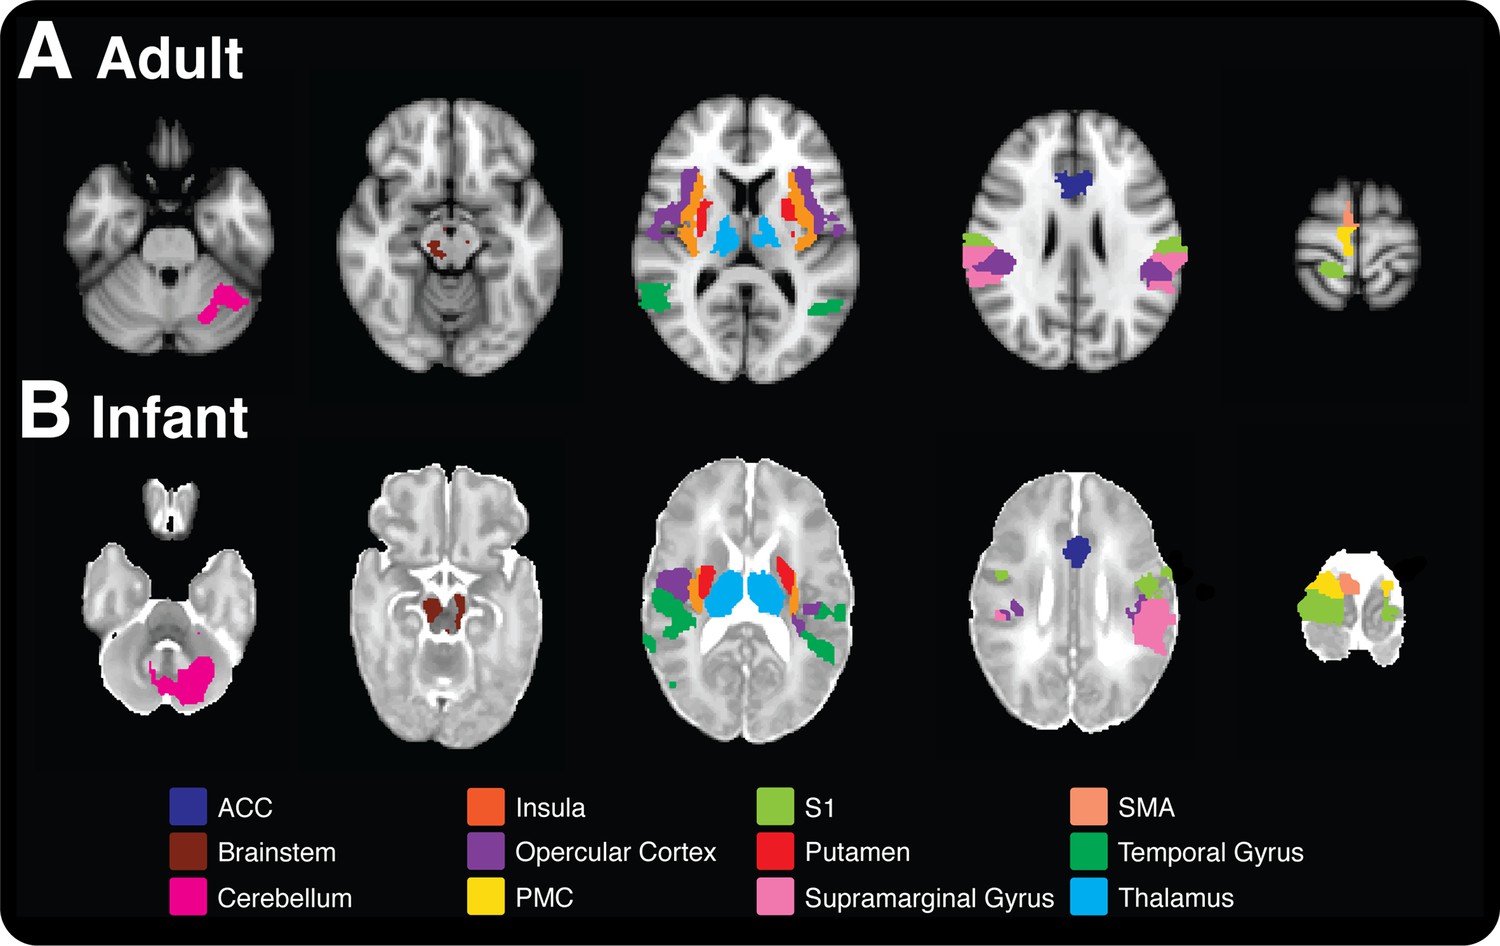
Comparison of nociceptive-evoked brain activity in selected brain regions that are active in both adults and infants.
Significantly, active voxels across each stimulus intensity level are presented for (A) adult and (B) infant participants (applied force: adults 32–512 mN; infants 32–128 mN). Each colour represents activity in a different anatomical brain region. (A) Adult activity is overlaid onto a standard T1 weighted MNI template and (B) infant activity is overlaid onto a standard T2 weighted neonatal template, corresponding to a 40-week gestation infant. ACC: anterior cingulate cortex; S1: primary somatosensory cortex: PMC: primary motor cortex; SMA: supplementary motor area.
Figure 2 with 1 supplement
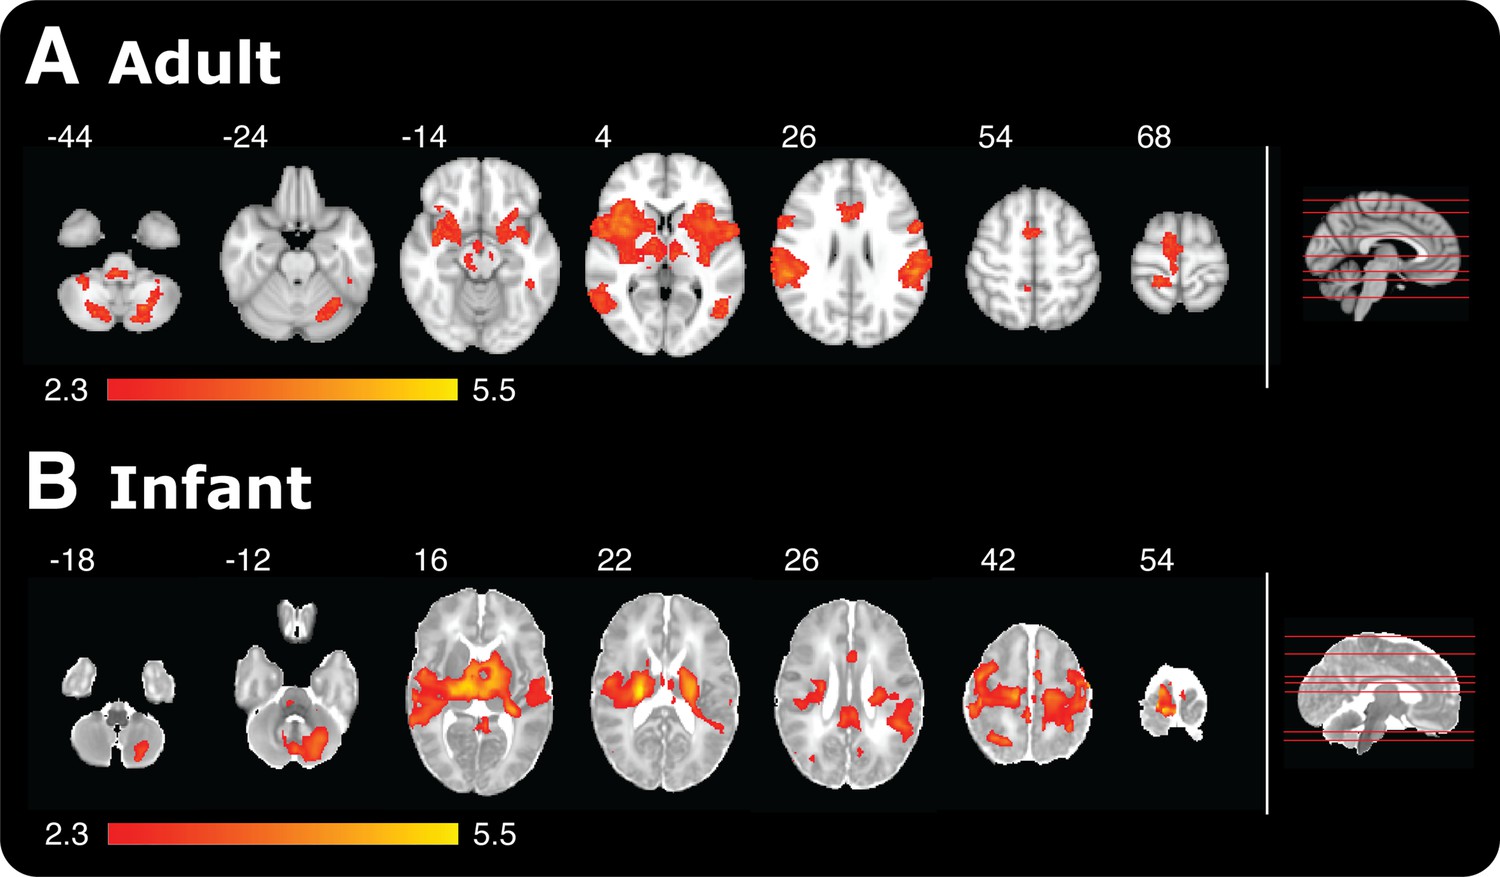
Noxious-evoked brain activity in response to the maximal presented stimulus in adults (512 mN) and infants (128 mN).
Red-yellow coloured areas represent active brain regions (threshold z ≥ 2.3 with a corrected cluster significance level of p < 0.05). An image of a midline sagittal brain slice (right panel) identifies the location of each example slice in the horizontal plane. (A) Adult activity is overlaid onto a standard T1 weighted MNI template and (B) infant activity is overlaid onto a standard T2 weighted neonatal template, corresponding to a 40-week gestation infant.
Figure 2—figure supplement 1
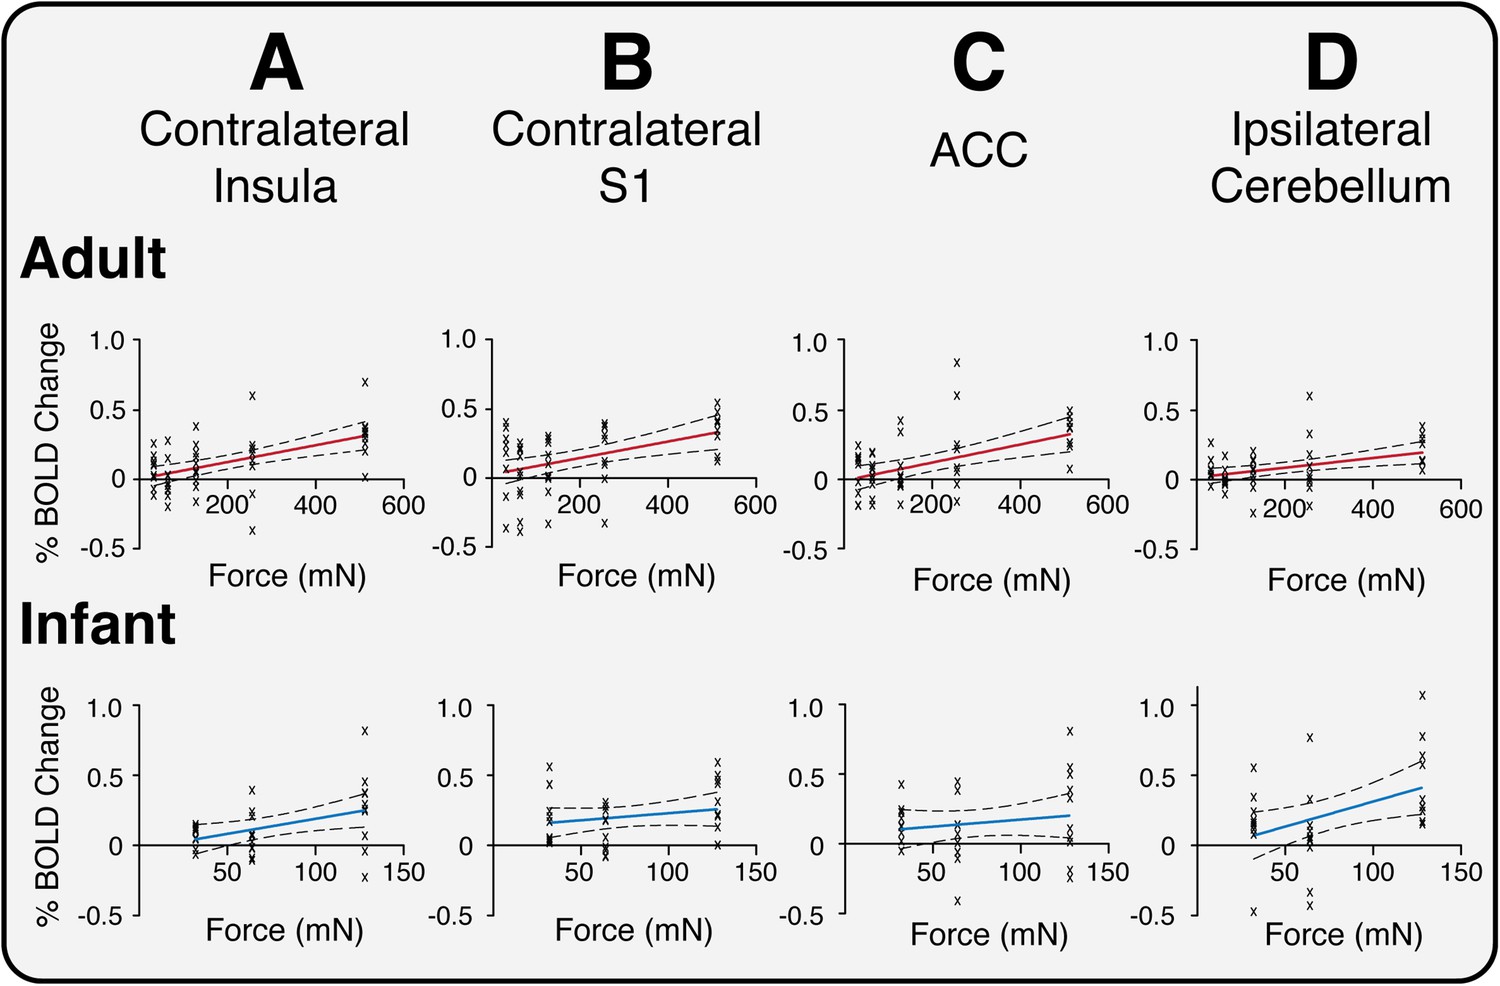
Relationship between percentage change in BOLD signal and stimulus intensity (force) in four example active brain regions in adult and infant participants.
A: Contralateral insula; B: Contralateral primary somatosensory cortex (S1); C: Anterior cingulate cortex (ACC); and D: Ipsilateral cerebellum. The crosses represent activity in individual participants. Red and blue lines are fitted regression lines and dashed lines show 95 % confidence intervals.
Tables
Table 1
Identification of all active brain regions in adults and infants following acute noxious stimulation at all stimulus intensities (applied force: adults 32–512 mN; infants 32–128 mN)
| Adults | Infants | ||||||||||||||||
|---|---|---|---|---|---|---|---|---|---|---|---|---|---|---|---|---|---|
| Anatomical area | Region | Peak Z within cluster | MNI coords | Rank | Slope of regression (*E-03) | P val* | Peak Z within cluster | Neonate template coords | Rank | Slope of regression (*E-03) | P val* | ||||||
| x | y | z | x | y | z | ||||||||||||
| Active regions in both adults and infants | Intensity encoding regions (in adults) | Temporal gyrus | Contra | 3.92 | 64 | −34 | 20 | 1 | 1.01 | 0.0002 | 3.05 | 32 | −32 | 12 | 1 | 2.46 | 0.0083 |
| Cingulate gyrus | Anterior | 4.11 | 6 | 4 | 40 | 2 | 0.65 | 0.0005 | 2.58 | −1 | 1 | 26 | 11 | 1.01 | 0.3971 | ||
| Opercular cortex | Contra | 5.60 | 40 | 6 | 10 | 3 | 0.63 | 0.0001 | 3.38 | 32 | −13 | 19 | 2 | 2.23 | 0.0391 | ||
| Insula | Contra | 4.18 | 34 | 14 | 6 | 4 | 0.61 | 0.0001 | 3.04 | 19 | −22 | 23 | 3 | 2.15 | 0.0207 | ||
| Supramarginal gyrus | Contra | 4.33 | 64 | −38 | 20 | 5 | 0.60 | 0.0008 | 3.29 | 25 | −23 | 39 | 9 | 1.08 | 0.1749 | ||
| Postcentral gyrus | Contra | 4.28 | 58 | −18 | 22 | 6 | 0.60 | 0.0012 | 3.85 | 15 | −22 | 52 | 10 | 1.01 | 0.2667 | ||
| Visual cortex | Contra | 3.62 | 44 | −62 | 4 | 7 | 0.59 | 0.0004 | 3.25 | 21 | −52 | 34 | 6 | 1.41 | 0.0814 | ||
| Putamen | Contra | 3.68 | 22 | 6 | 6 | 8 | 0.55 | 0.0001 | 3.30 | 17 | −17 | 18 | 8 | 1.20 | 0.1656 | ||
| Thalamus | Contra | 3.51 | 14 | −14 | 0 | 9 | 0.50 | 0.0010 | 3.58 | 6 | −16 | 15 | 4 | 1.91 | 0.0592 | ||
| Insula | Ipsi | 4.67 | −38 | −18 | 14 | 10 | 0.49 | 0.0001 | 2.59 | −26 | −14 | 14 | 5 | 1.69 | 0.1015 | ||
| Supplementary motor area | Contra | 3.91 | 8 | 4 | 46 | 11 | 0.39 | 0.0008 | 3.50 | 6 | −18 | 48 | 7 | 1.23 | 0.2315 | ||
| Non intensity encoding regions (in adults) | Cerebellum | Ipsi | 3.88 | −20 | −66 | −44 | 0.35 | 0.0029 | 3.53 | −3 | −46 | −6 | 3.57 | 0.0164 | |||
| Temporal gyrus | Ipsi | 3.72 | −52 | −56 | 10 | 0.18 | 0.5487 | 3.41 | −32 | −22 | 14 | 2.90 | 0.0196 | ||||
| Supramarginal gyrus | Ipsi | 4.59 | −64 | −28 | 20 | 0.51 | 0.0035 | 3.13 | −31 | −24 | 30 | 2.79 | 0.0055 | ||||
| Cerebellum | Contra | 3.36 | 20 | −70 | −50 | 0.31 | 0.0246 | 3.16 | 2 | −44 | −6 | 2.72 | 0.1634 | ||||
| Opercular cortex | Ipsi | 5.23 | −50 | −28 | 26 | 0.50 | 0.0018 | 2.69 | −27 | −12 | 13 | 2.23 | 0.0710 | ||||
| Postcentral gyrus | Ipsi | 4.71 | −62 | −18 | 24 | 0.44 | 0.0375 | 3.52 | −31 | −15 | 41 | 2.12 | 0.0845 | ||||
| Thalamus | Ipsi | 3.52 | −12 | −14 | 10 | 0.42 | 0.0018 | 3.48 | −1 | −20 | 13 | 1.67 | 0.1009 | ||||
| Angular gyrus | Ipsi | 3.59 | −58 | −50 | 18 | 0.53 | 0.0107 | 2.98 | −23 | −39 | 33 | 1.56 | 0.0528 | ||||
| Precentral gyrus | Ipsi | 4.01 | −58 | 0 | 10 | 0.43 | 0.0578 | 3.46 | −23 | −17 | 48 | 1.53 | 0.1247 | ||||
| Frontal gyrus | Contra | 3.88 | 58 | 12 | 0 | 0.56 | 0.0212 | 3.11 | 11 | −12 | 48 | 1.42 | 0.0646 | ||||
| Cingulate gyrus | Posterior | 3.71 | −14 | −28 | 38 | 0.08 | 0.2480 | 3.18 | −9 | −23 | 35 | 1.42 | 0.1101 | ||||
| Angular gyrus | Contra | 3.71 | 60 | −46 | 18 | 0.54 | 0.0080 | 3.12 | 22 | −51 | 35 | 1.42 | 0.0407 | ||||
| Precuneous cortex | Contra | 3.60 | 16 | −68 | 40 | 0.38 | 0.0714 | 3.70 | 5 | −30 | 52 | 1.19 | 0.1623 | ||||
| Visual cortex | Ipsi | 3.82 | −52 | −70 | 10 | −0.09 | 0.3758 | 2.59 | −7 | −40 | 11 | 1.17 | 0.1657 | ||||
| Brainstem | 3.86 | 10 | −26 | −8 | 0.33 | 0.1710 | 2.99 | −3 | −27 | −10 | 1.11 | 0.4350 | |||||
| Parietal lobule | Contra | 3.10 | 20 | −44 | 68 | 0.61 | 0.1097 | 3.10 | 27 | −24 | 46 | 1.09 | 0.1271 | ||||
| Putamen | Ipsi | 3.63 | −16 | 10 | −2 | 0.45 | 0.0023 | 3.13 | −14 | −14 | 19 | 0.92 | 0.2813 | ||||
| Supplementary motor area | Ipsi | 3.55 | −6 | 4 | 44 | 0.40 | 0.0219 | 3.16 | −4 | −10 | 46 | 0.91 | 0.3903 | ||||
| Precentral Gyrus | Contra | 4.05 | 58 | 4 | 8 | 0.44 | 0.0276 | 3.76 | 6 | −20 | 53 | 0.88 | 0.2672 | ||||
| Frontal gyrus | Ipsi | 3.57 | −8 | 22 | 32 | −0.24 | 0.1954 | 2.79 | −13 | −9 | 50 | 0.70 | 0.4820 | ||||
| Pallidum | Contra | 3.40 | 16 | −4 | −4 | 0.49 | 0.0071 | 2.84 | 13 | −13 | 13 | 0.64 | 0.4863 | ||||
| Active regions in adults only | Amygdala | Contra | 3.49 | 20 | −2 | −14 | 0.69 | 0.0160 | |||||||||
| Amygdala | Ipsi | 4.28 | −20 | −2 | −12 | 0.43 | 0.0860 | ||||||||||
| Orbitofrontal cortex | Ipsi | 3.40 | −18 | 4 | −16 | 0.42 | 0.0157 | no activity | |||||||||
| Orbitofrontal cortex | Contra | 3.57 | 34 | 30 | −2 | 0.44 | 0.0460 | ||||||||||
| Active regions in infants only | Precuneous cortex | Ipsi | 3.80 | −1 | −26 | 52 | 1.26 | 0.1699 | |||||||||
| Pallidum | Ipsi | 3.16 | −8 | −5 | 14 | 0.59 | 0.4787 | ||||||||||
| Parietal lobule | Ipsi | 3.31 | −28 | −23 | 33 | 0.99 | 0.2711 | ||||||||||
| Auditory cortex | Contra | 2.89 | 26 | −14 | 18 | 3.07 | 0.0119 | ||||||||||
| Auditory cortex | Ipsi | 3.34 | −17 | −29 | 19 | 2.56 | 0.0304 | ||||||||||
| Caudate | Contra | no activity | 3.61 | 13 | −17 | 22 | 0.59 | 0.5822 | |||||||||
| Caudate | Ipsi | 3.47 | −7 | −8 | 18 | 1.05 | 0.3415 | ||||||||||
| Hippocampus | Contra | 2.61 | 21 | −25 | 9 | 1.84 | 0.1288 | ||||||||||
| Hippocampus | Ipsi | 2.77 | −15 | −31 | 9 | 1.00 | 0.3326 | ||||||||||
| Parahippocampus | Contra | 3.02 | 11 | −23 | 0 | 1.53 | 0.3740 | ||||||||||
| Parahippocampus | Ipsi | 2.99 | −7 | −24 | −8 | 0.19 | 0.9013 | ||||||||||
Download links
A two-part list of links to download the article, or parts of the article, in various formats.
Downloads (link to download the article as PDF)
Open citations (links to open the citations from this article in various online reference manager services)
Cite this article (links to download the citations from this article in formats compatible with various reference manager tools)
fMRI reveals neural activity overlap between adult and infant pain
eLife 4:e06356.
https://doi.org/10.7554/eLife.06356


