The retrotrapezoid nucleus neurons expressing Atoh1 and Phox2b are essential for the respiratory response to CO2
- Université Paris-Saclay, Université Paris-Sud, CNRS, UMR 9197, Institut des Neurosciences Paris-Saclay, France
- Inserm U1024, and CNRS UMR 8197, France
- National Institute of Neuroscience, National Center of Neurology and Psychiatry, Japan
- University of Tsukuba, Japan
- Karolinska Institutet, Sweden
Figures
Figure 1
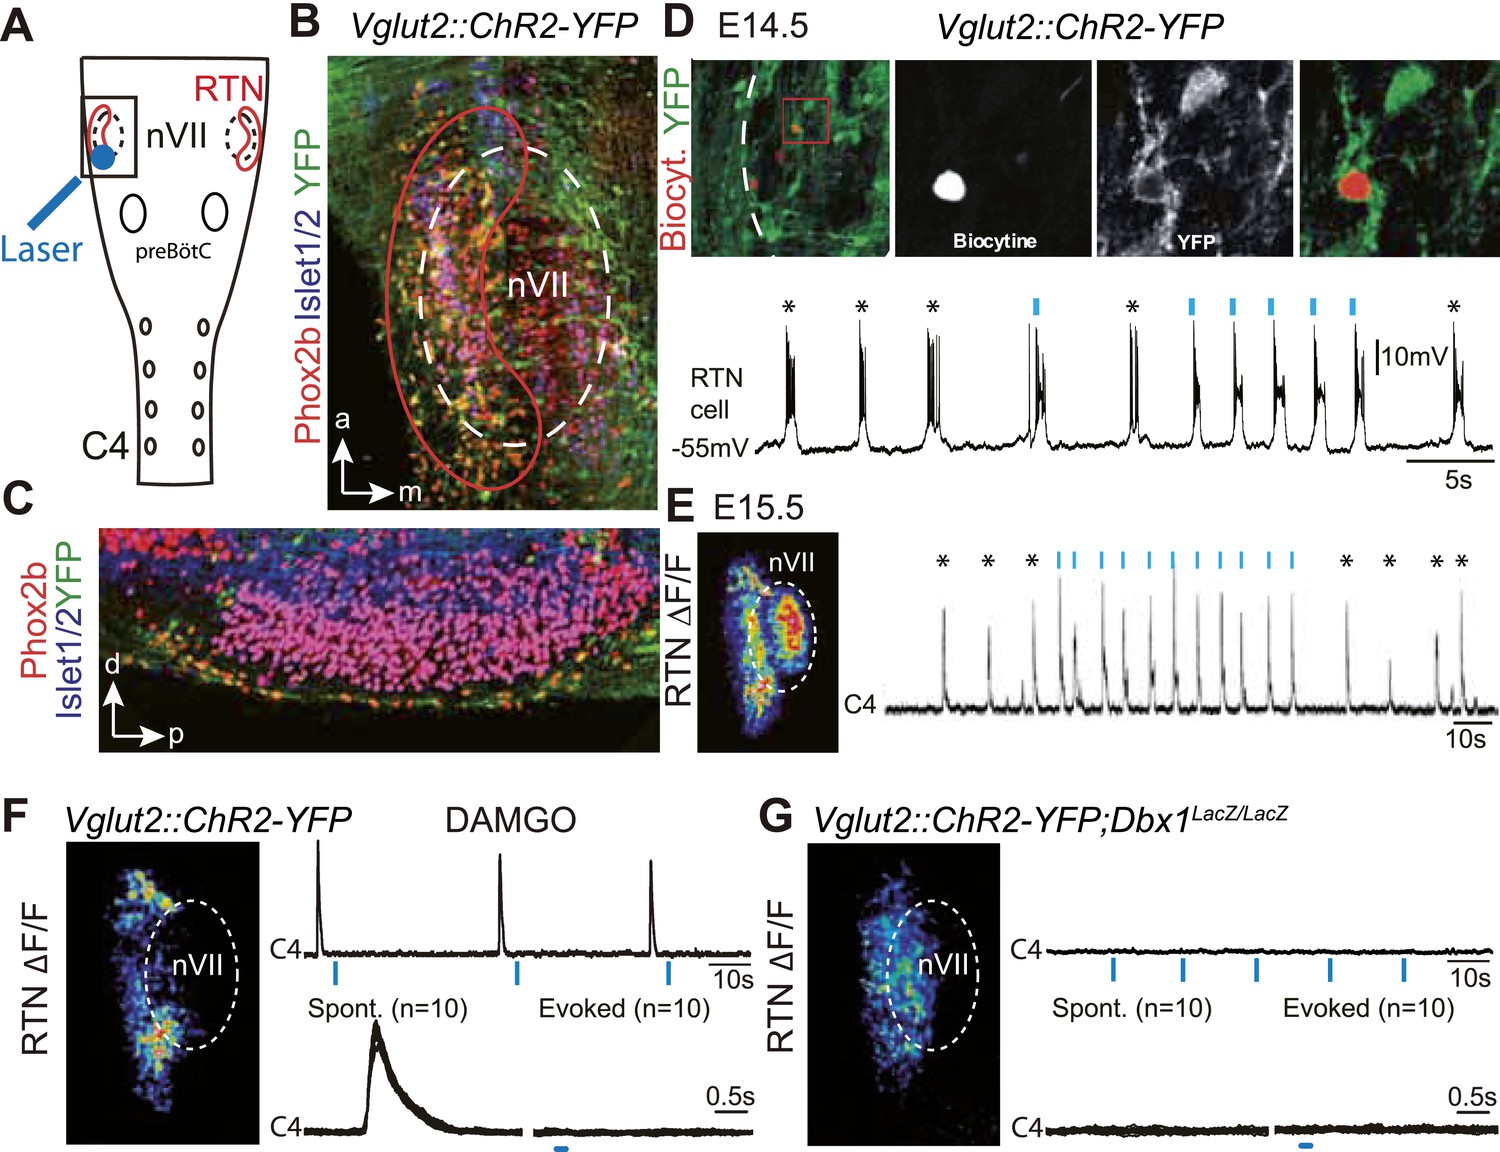
Effect of photostimulating Vglut2::Chr2-expressing embryonic retrotrapezoid nucleus (RTN) neurons on membrane potential and motor output.
(A) Cartoon of a ventral view of the hindbrain showing the position of nVII (dotted line), RTN (red outline), the preBötC and the C4 phrenic nerve roots. (B) Ventral view corresponding to the boxed area in A (anterior at top, lateral on the left) of the RTN (red outline) and nVII (stippled outline) in a Vglut2::ChR2-YFP embryo, labeled for the indicated markers. (C) Sagittal section, labeled for the indicated markers, showing the Phox2b+/YFP+/Islet1,2− cells ventral to nVII and optimally accessible to light. (D) Above, ventral view of YFP expression in the RTN region of an E14.5 Vglut2::ChR2-YFP embryo showing the three recorded and biocytin-filled RTN cells (left panel). A high magnification of the one in the boxed area is provided in the right panels showing biocytin and YFP labeling separately and the overlay. Below, membrane potential trajectory of the RTN cell shown at high magnification, featuring spontaneously rhythmic (stars) and light-evoked (blue bars) bursts of action potentials. (E) Left panel, photostimulation of the RTN region in E15.5 brainstem-spinal cord preparations from a Vglut2::ChR2-YFP embryo evokes Calcium Green-1 AM (ΔF/F) changes in the RTN and adjacent nVII. Right panel, integrated C4 recording in such a preparation showing spontaneous C4 bursts of activity (stars) and bursts evoked by photostimulation (blue bars). Note that the light pulses entrain the ongoing endogenous rhythm. (F) In the presence of DAMGO that depresses the excitability of the preBötC, but not of the RTN, photostimulation of the RTN region in E15.5 preparations still evokes ΔF/F changes in the RTN but not in nVII (left panel). Right panel, above, integrated C4 activity showing systematic failures of photostimulation to evoke C4 responses. Below, set of 10 superimposed C4 activity traces. (G) Same experiment in Vglut2::ChR2;Dbx1LacZ/LacZ mutants (n = 5) in which the preBötC but not the RTN is disrupted. The mutation completely abrogates light-evoked nVII and C4 responses.
Figure 2
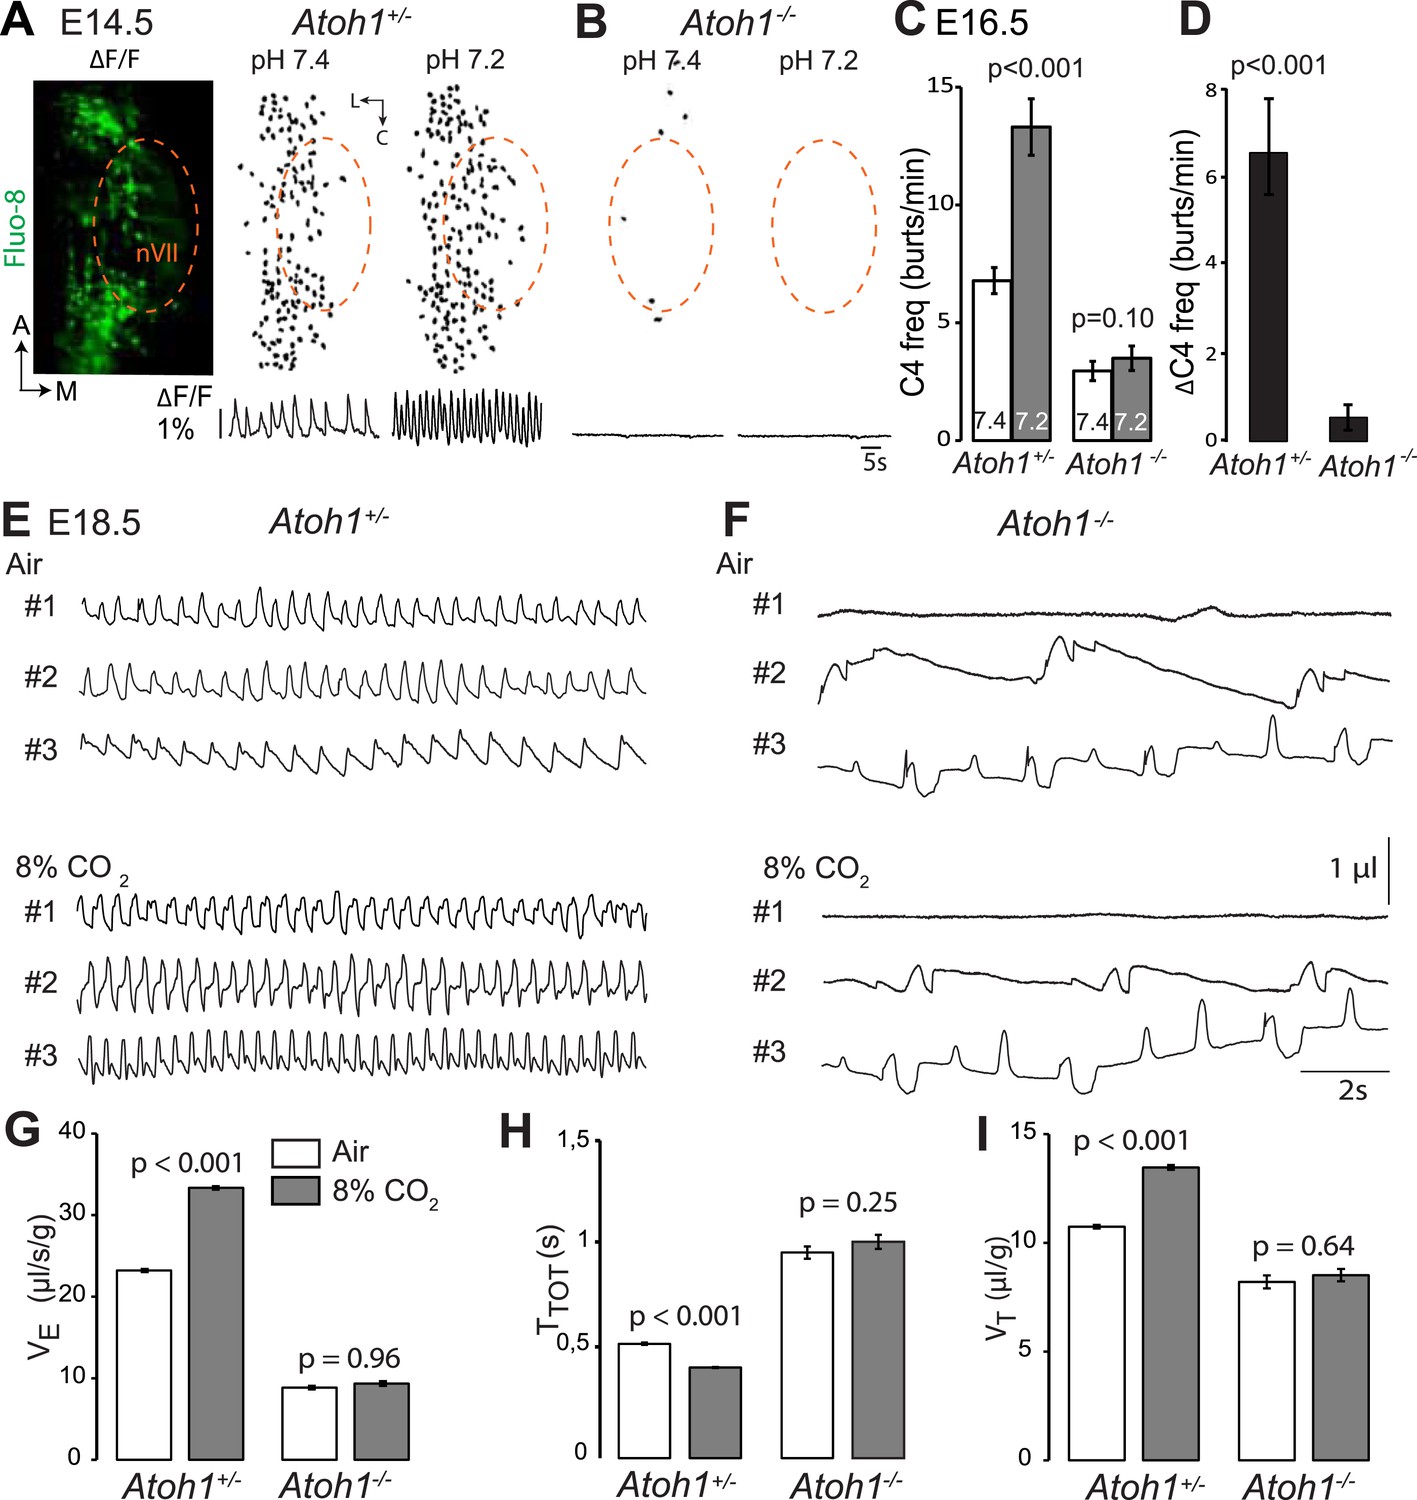
Absence of a functional RTN and lack of CO2 chemosensitivity in Atoh1−/− (Atoh1CreERT2/CreERT2) mice.
(A) Left, ventral view centered on nVII (dotted outline) showing Fluo-8 AM fluorescence changes (ΔF/F) of RTN cells in an E14.5 Atoh1+/− brainstem preparation. Right, RTN cell maps (top) and average population activity traces (bottom) at pH7.4 and pH7.2. The vertical black bar in front of the traces represents a 1% ΔF/F change as indicated. (B) Corresponding maps and tracings for an Atoh1−/− embryo attesting to the absence of a functional RTN. (C) Quantification of C4 burst frequencies in baseline (white bar) and low pH (gray bar) conditions for Atoh1+/− (n = 11) and Atoh1−/− (n = 8) E16.5 preparations. Baseline frequency dropped by 56% in the mutants and was not affected by acidification. (D) Change of C4 frequency (ΔC4) induced by a pH challenge in Atoh1+/− and Atoh1−/− preparations. (E and F) Representative examples of plethysmographic recordings of three live E18.5 Atoh1+/− and Atoh1−/− pups (#1–#3) delivered by Caesarean section and breathing normal or hypercapnic air as indicated. (G–I) Mean values of ventilation (VE) (G), breath duration (TTOT) (H) and tidal volume (VT) (I) of control (n = 31) and mutant (n = 8) pups breathing normal or hypercapnic air, excluding periods of apnea.
Figure 3
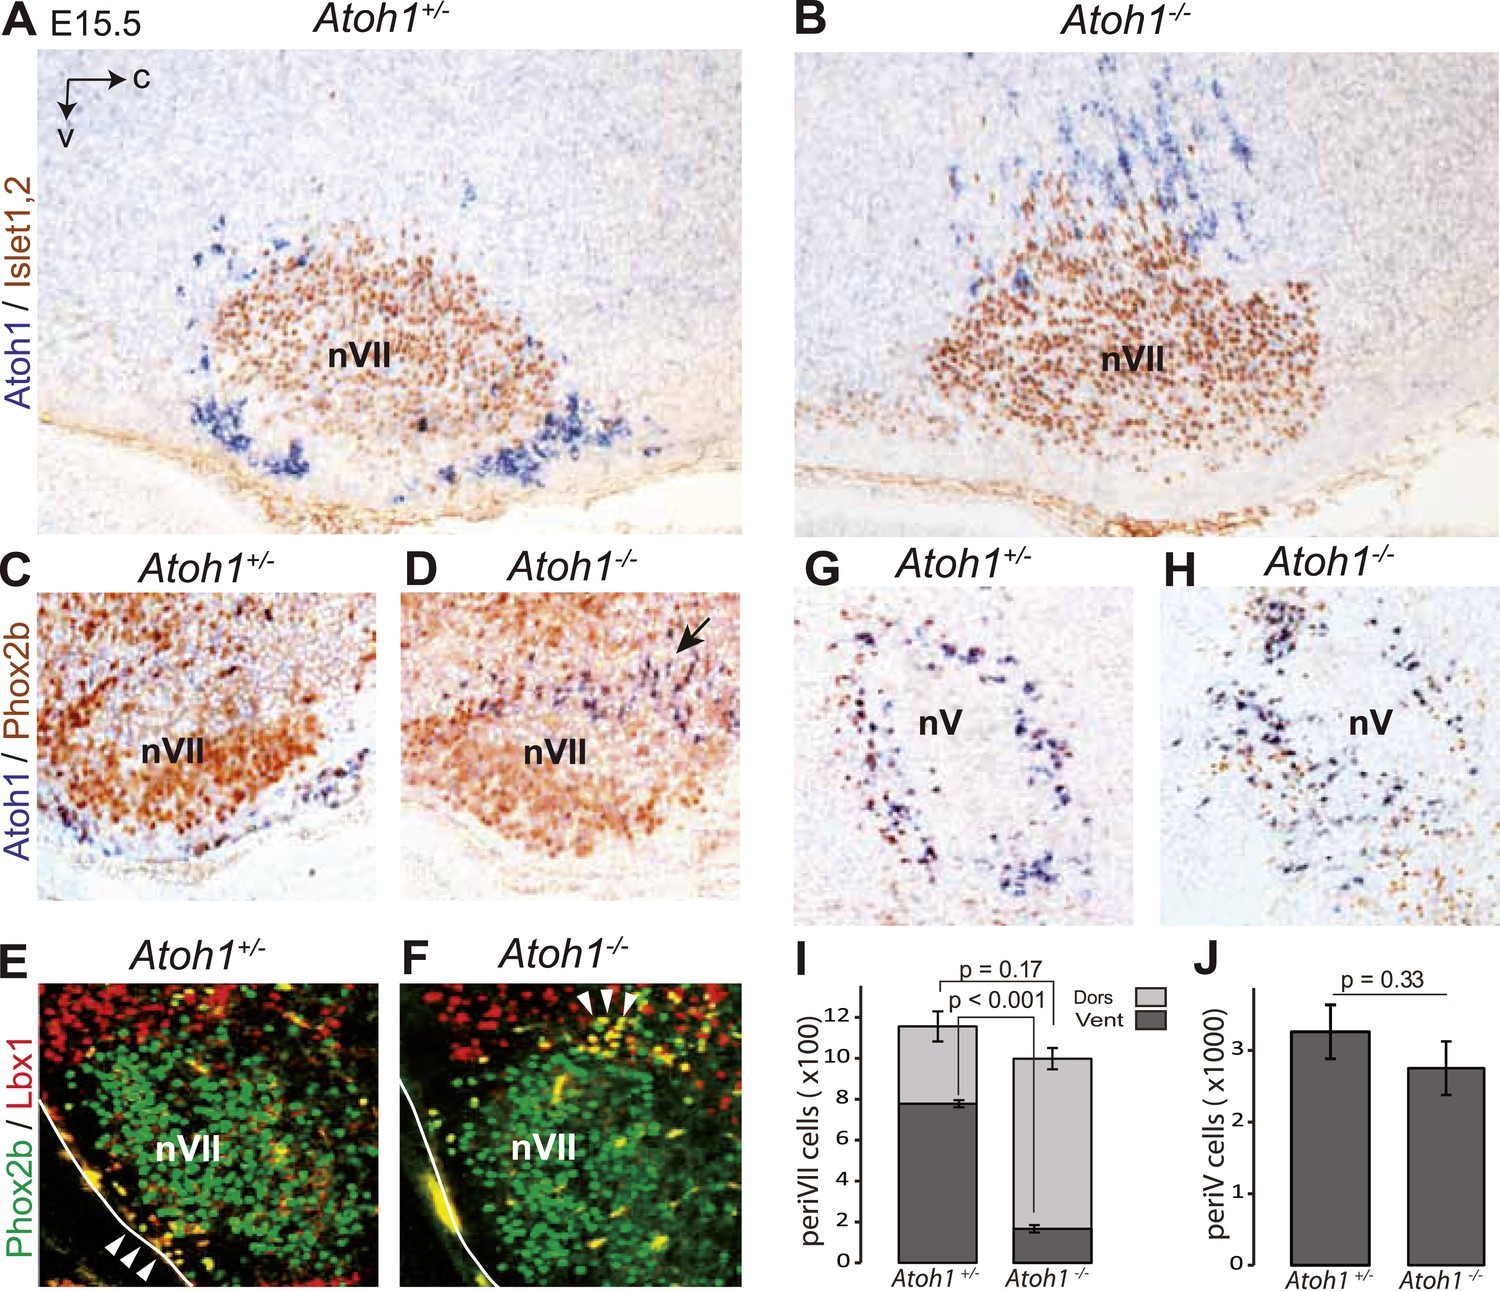
Ventral to dorsal shift of periVII and normal location of periV cells in Atoh1−/− embryos.
(A and B) Combined in situ hybridization (ISH) with a 3′ UTR probe of Atoh1 (blue) and immunohistochemistry (IHC) with anti-Islet1,2 antibodies (brown) to visualize nVII on sagittal sections through the hindbrain from E15.5 Atoh1+/− and Atoh1−/− embryos. In Atoh1−/− embryos, the neurons identified by expression of the Atoh1 3′ UTR, which would have expressed Atoh1 protein normally, are depleted ventral of nVII visualized by Islet1,2 labeling, but accumulate dorsally. (C and D) Combined ISH with a 3′ UTR probe for Atoh1 and IHC for Phox2b on sagittal (C and D) (anterior at left) sections through the medulla of E15.5 Atoh1+/− and Atoh1−/− embryos as indicated. The arrow points to the dorsally shifted periVII cells that express the Atoh1 3′ UTR and Phox2b. The PeriVII cells that would have normally expressed the Atoh1 protein are depleted ventral of nVII in the mutants and accumulate dorsally. (E and F) Immunofluorescence for Phox2b (green) and Lbx1 (red) on coronal sections (lateral at left) through the medulla of E15.5 Atoh1+/− and Atoh1−/− embryos. The Lbx1+/Phox2b+ periVII cells (yellow) are depleted ventral of nVII but accumulate dorsally (arrowheads). (G and H) Combined ISH with a 3′ UTR probe for Atoh1 and IHC for Phox2b on coronal sections (lateral at left) through the pons of E15.5 Atoh1+/− and Atoh1−/− embryos showing the normal location of periV cells in the mutants. (I) Quantification of the dorsal and ventral population of periVII cells identified by Atoh1 3′ UTR expression at E15.5. Their total numbers were not significantly different from the controls in Atoh1−/− embryos, but 83 ± 1.5% are located dorsally in the mutants vs 32 ± 4.1% in the controls. (J) Quantification of periV cells identified by Atoh1 3′ UTR expression at E15.5.
Figure 4
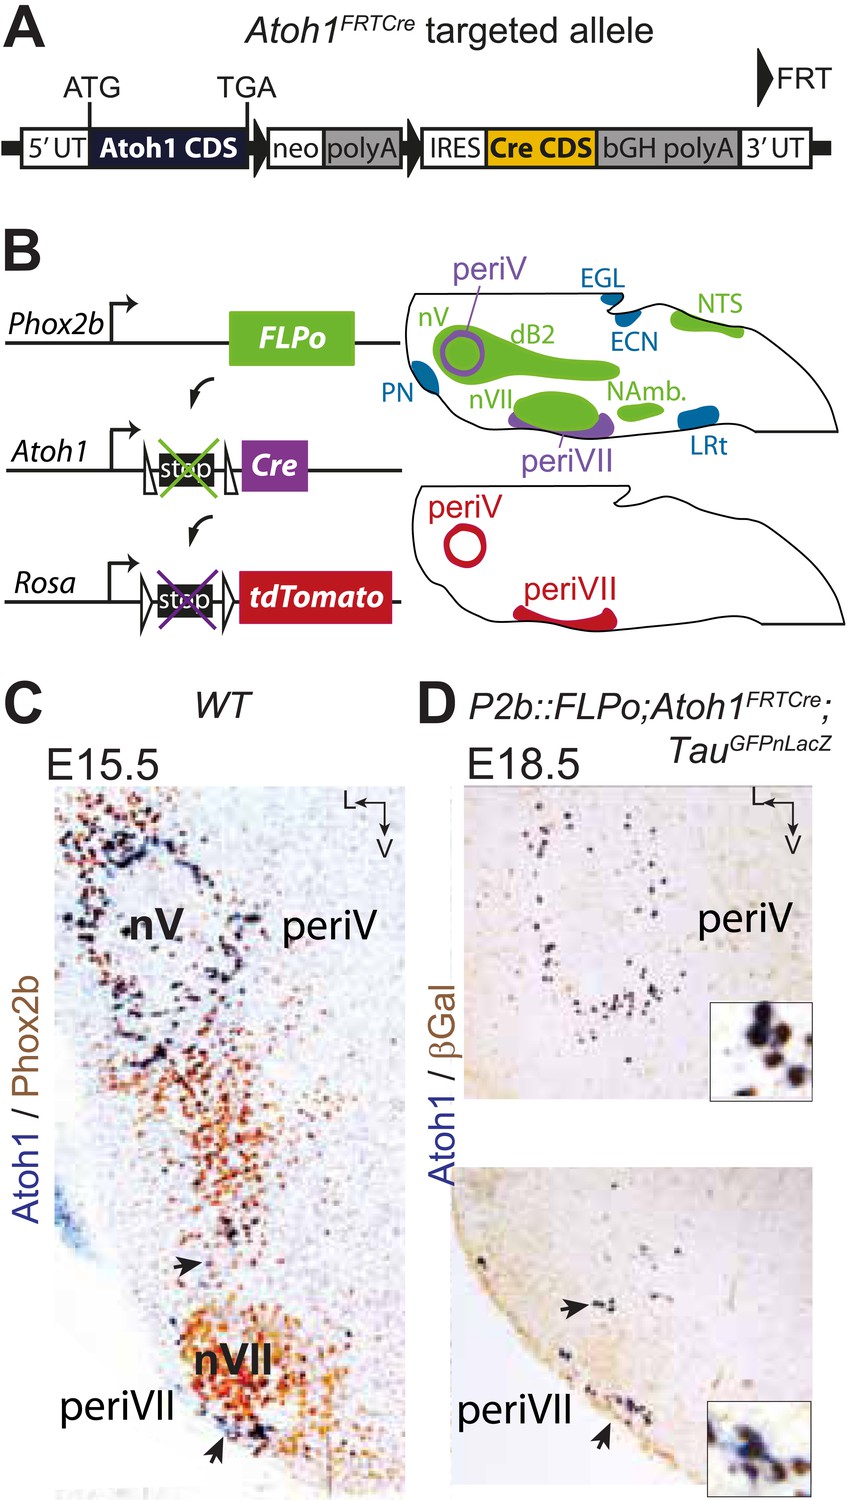
Targeting of Phox2bon/Atoh1on cells by intersectional genetics.
(A) Schematic of the Atoh1FRTCre allele generated by homologous recombination in ES cells. The targeted Atoh1 locus contains from 5′ to 3′ the Atoh1 CDS up to and including the stop codon, a neomycin resistance cassette with three consecutive SV40 polyadenylation sequences flanked by FRT sites, an IRES sequence, the Cre recombinase CDS (orange) followed by a bovine growth hormone polyadenylation sequence and the Atoh1 3′ UTR. FLP recombinase-mediated recombination will remove the neomycin cassette with the polyadenylation signals allowing for expression of Cre from the Atoh1 locus. (B) Left, schematic of the P2b::FLPo (top) and Atoh1FRTCre (middle) alleles and the Cre recombinase-responsive R26tdTomato indicator allele (bottom). Right, top, sagittal brainstem cartoon schematizing the structures with a history of Phox2b (green) or Atoh1 (blue) (Rose et al., 2009a and data not shown) expression and the intersectional population expressing or having expressed both (purple). Below, the periV and periVII cells that will express tdTomato in P2bFLPo;Atoh1FRTCre;R26tdTomato embryos (red). The cells expressing FLPo recombinase from the Phox2b promoter will activate Cre expression from the Atoh1 locus in the intersectional population, which in turn will activate tdTomato expression (or nuclear βgalactosidase expression if TauGFPnLacZ is used as indicator allele). EGL, external granular layer, ECN, external cuneate nucleus, LRt, lateral reticular nucleus, NAmb., nucleus ambiguus, NTS, nucleus of the solitary tract, PN, pontine nuclei. (C and D) Combined ISH for Atoh1 and IHC for Phox2b (C) or nuclear βgalactosidase (D) on coronal sections through the hindbrain from E15.5 wild-type (WT) (C) or E18.5 P2b::FLPo;Atoh1FRTCre;TauGFPnLacZ (D) embryos. The periV and periVII cells are the only cells in the brainstem co-expressing Phox2b and Atoh1 (C) and also the only cells with a history of both Phox2b and Atoh1expression (D). The arrows in panels C and D point to the periVII cells. The insets in panel D show close ups of periV (top panel) and periVII cells (bottom panel), double-labeled for Atoh1 and βgalactosidase.
Figure 5
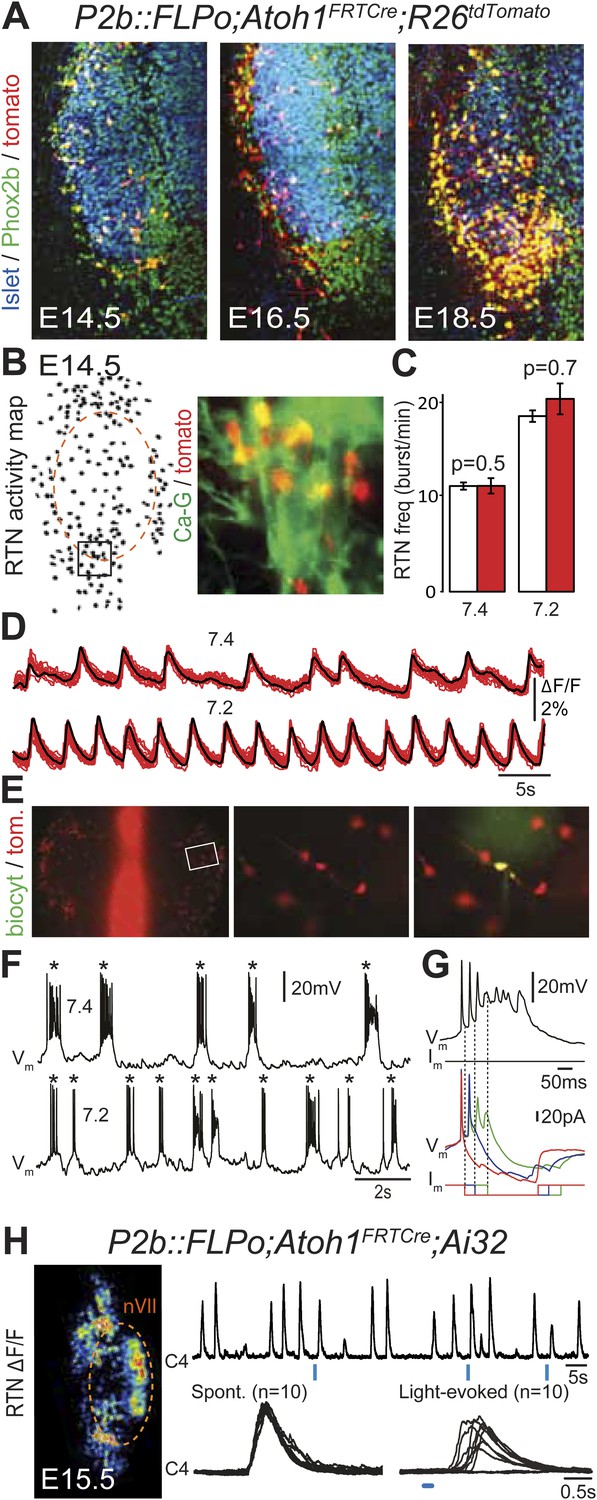
Functional characterization of Phox2bon/Atoh1on cells.
(A) Ventral view of triple immunofluorescence for Islet1,2, Phox2b and tdTomato over the facial area in Atoh1FRTCre;P2b::FLPo;R26tdTomato embryos showing Phox2bon/Atoh1on cells (yellow) at E14.5 (left), E16.5 (middle) and E18.5 (right). (B) RTN activity map and right, close up of the boxed area showing Phox2bon/Atoh1on cells (red) loaded with Calcium Green-1 AM (Ca-G) (yellow). (C) Histogram showing that the burst frequencies of the global population of oscillating RTN neurons (white bars, n = 27 preparations) are not significantly different from that of the tdTomato+ (thus Phox2bon/Atoh1on) cells in Atoh1FRTCre;P2b::FLPo;R26tdTomato embryos (red bars, n = 6 preparations) at pH7.4 (7.4) and pH7.2 (7.2). (D) Superimposed traces showing spontaneous rhythmic Ca-G fluorescence changes of 16 individual Phox2bon/Atoh1on cells (red traces) and their average (black trace) at pH7.4 (top, 7.4) and pH7.2 (bottom, 7.2). Note the frequency increase in low pH. (E) Left panel, ventral view of an E14.5 brainstem preparation showing Phox2bon/Atoh1on tdTomato+ RTN neurons (red) on either side of the midline (marked by the auto-fluorescence of the holding mesh) during an electrophysiology experiment. Middle panel, close up of the boxed area showing Phox2bon/Atoh1on cells (red) and right, one biocytin-filled Phox2bon/Atoh1on cell during whole-cell patch-clamp recording. (F) Top row, trace of the membrane potential trajectory of the biocytin-labeled cell in E showing spontaneous burst discharges of action potentials (indicated by *) at pH7.4 (7.4); bottom row, same trace at pH7.2 (7.2). Note the increased frequency of bursts at low pH. (G) Close up of a burst discharge (top) that can be curtailed by negative current pulses (bottom) applied 10 ms (red traces), 50 ms (blue traces) or 100 ms (green traces) after onset of the first action potential of the burst. (H) Photostimulation of Phox2bon/Atoh1on cells expressing ChR2 at E15.5 evokes C4 motor responses. Left panel, ΔF/F changes in the RTN and adjacent nVII (dotted line) following photostimulation of the RTN region. Right, at top, integrated activity of the C4 root showing spontaneous activity and bursts of activity evoked by light pulses (blue bars) triggered 4 s after a spontaneous burst. Bottom left, close up of a set of 10 superimposed spontaneous (Spont.) C4 bouts of activity and right, a corresponding set of light-evoked (Light-evoked) C4 responses, synchronized on the light pulse (blue bar), showing their variable latencies.
Figure 6
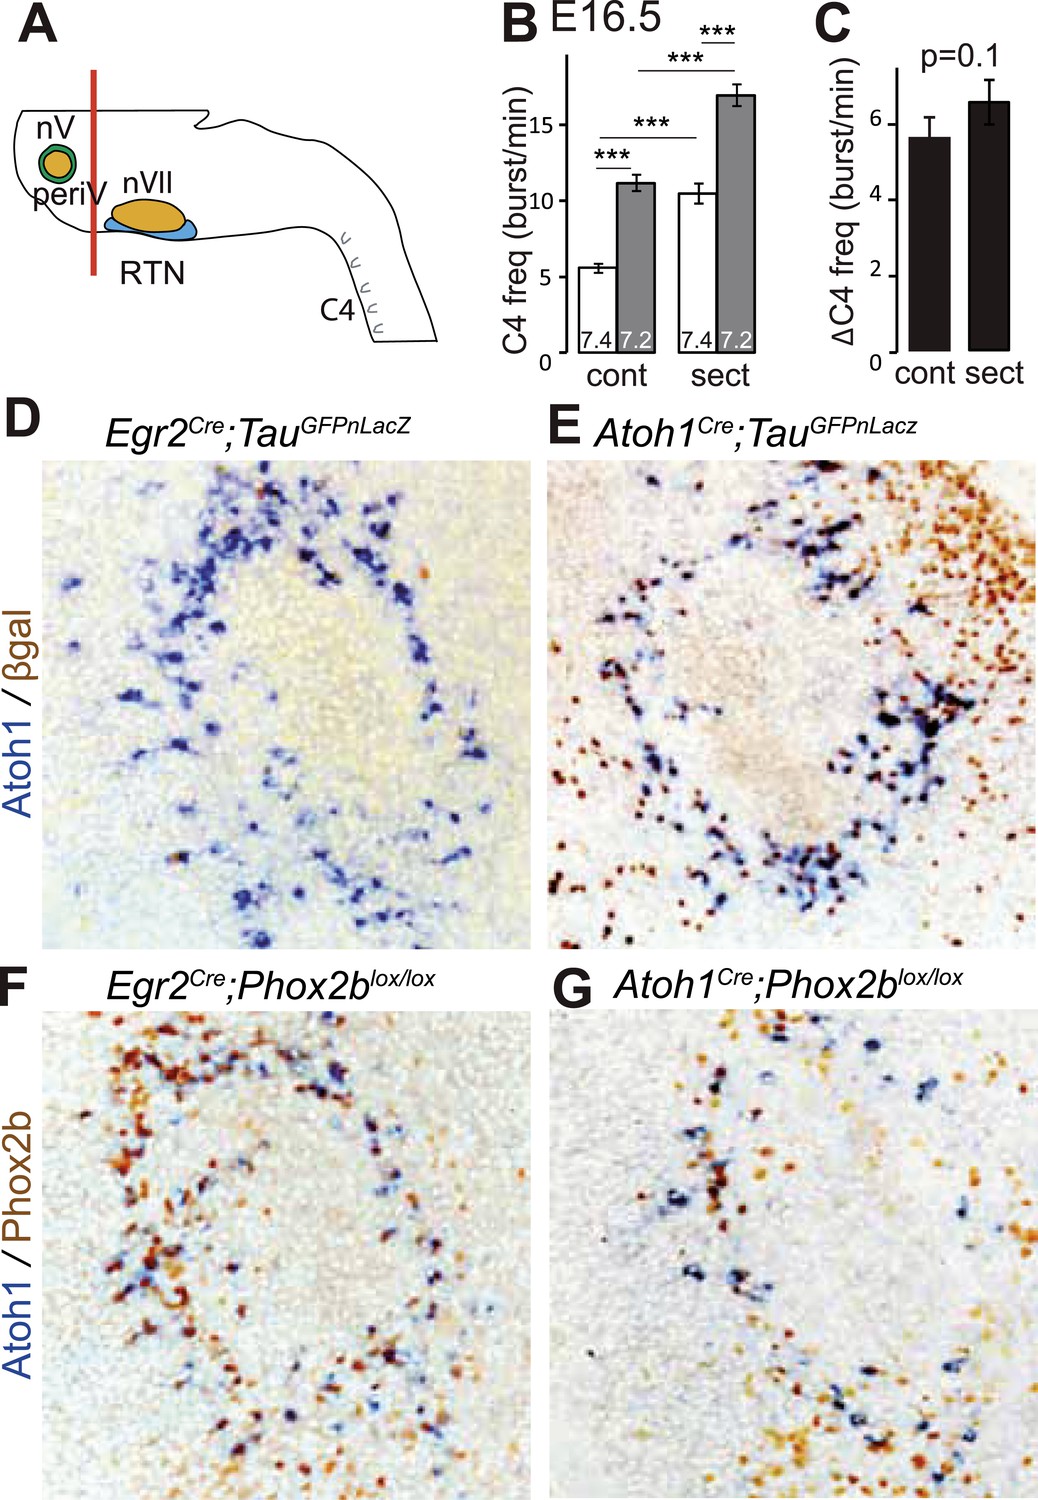
PeriV cells are not essential for the respiratory chemoreflex.
(A) Schematic of a standard brainstem-spinal cord preparation showing the level of the section (red line) to eliminate the pons. (B) Comparison of C4 burst frequencies before and after sectioning in E16.5 wild-type preparations in normal and low pH conditions. The section (sect) increases baseline (white bar) frequency but preserves the response to acidification (grey bar), ***p < 0.001. (C) The changes of C4 frequency (ΔC4) induced by the pH challenge before (cont) and after sectioning (sect) are not significantly different from each other. (D and E) Combined ISH for Atoh1 and IHC for nuclearly localized βgalactosidase on coronal sections through the E15.5 pons, in the indicated genotypes. With Egr2 as Cre driver, expression of the TauGFPnLacZ reporter allele is not activated in periV cells (D), but it is expressed there when Cre is provided by Atoh1cre (E). (F and G) Combined ISH for Atoh1 and IHC for Phox2b on coronal sections through the E15.5 pons in the indicated genotypes. In the presence of Egr2Cre, Phox2b expression by the Atoh1+ cells is preserved in Phox2blox/lox embryos (F), but not when Cre is provided by Atoh1Cre (G). PeriV cells are not in the Egr2 lineage and can thus not be affected in Egr2Cre;Phox2blox/lox or Egr2Cre;P2b27Alacki mice, in which the respiratory chemoreflex is abrogated.
Figure 7
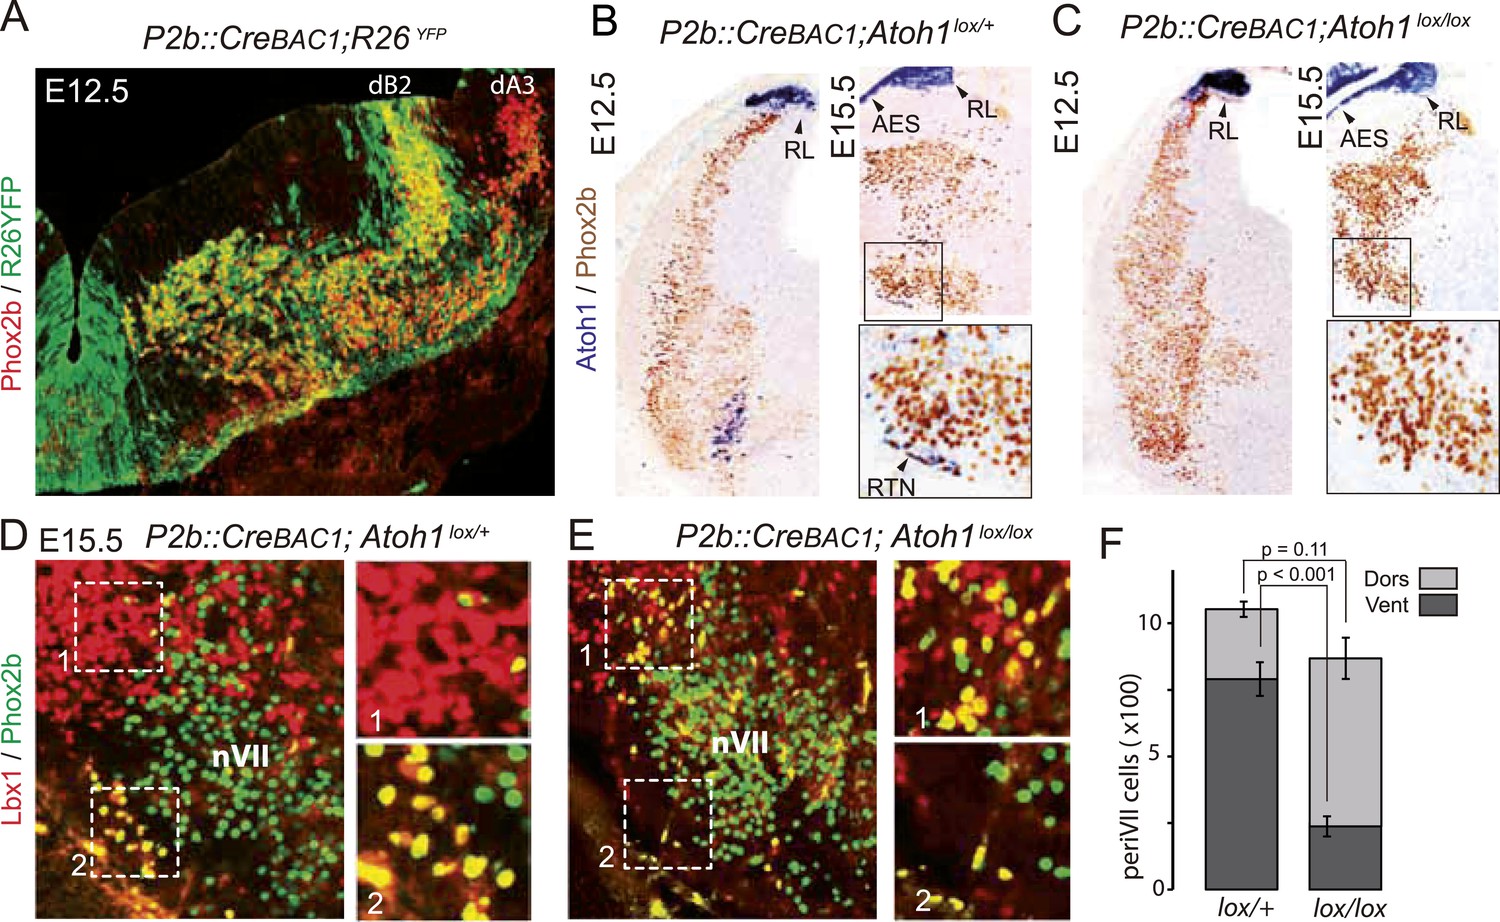
Selective removal of Atoh1 in RTN precursors produces a ventral to dorsal shift of periVII neurons.
(A) Combined Phox2b (red) and YFP (green) staining on a transverse section of an E12.5 P2b::CreBAC1;R26YFP (Srinivas et al., 2001) hindbrain showing efficient recombination of the reporter allele in dB2 progenitors. In the dA3 domain, where Phox2b and Cre are switched on postmitotically, newly born cells are still YFP− but express it during their ventral migration. (B and C) Combined Atoh1 ISH with a CDS probe of Atoh1 and Phox2b IHC on coronal hindbrain sections of P2b::CreBAC1;Atoh1lox/+ (B) or P2b::CreBAC1;Atoh1lox/lox embryos (C) at E15.5 or E12.5 as indicated. Cre recombinase expressed from the Phox2b promoter removes Atoh1 message in the RTN precursors but not in the rhombic lip (RL) or the cells of the anterior extramural stream (AES) of Atoh1lox/lox embryos. Higher magnifications of the boxed areas are shown below. (D and E) Immunofluorescence for Lbx1 (red) and Phox2b (green) on coronal E15.5 hindbrain sections of the indicated genotypes (dorsal at top, lateral on the left). The double-labeled periVII cells are in yellow, the insets show close ups corresponding to the boxed areas. The Lbx1+/Phox2b+ cells accumulate dorso-laterally of nVII in P2b::CreBAC1;Atoh1lox/lox mutants. (F) Quantification of the Lbx1+/Phox2b+ periVII cells at E15.5 located ventrally (Vent) or dorsally (Dors) of nVII. In P2b::CreBAC1;Atoh1lox/+ controls, 25 ± 2.3% of the periVII neurons are located dorso-laterally of nVII vs 75 ± 2.6% in P2b::CreBac1;Atoh1lox/lox mutants.
Figure 8

Functional consequences of selective inactivation of Atoh1 in Phox2bon cells.
(A and B) RTN activity maps and average population activity traces at E14.5 in control and P2b::CreBAC1;Atoh1lox/lox mutants at pH7.4 and pH7.2 showing absence of a functional RTN in the mutant. (C) Quantification of C4 burst frequencies in baseline (white bars) and low pH (gray bars) conditions in control and mutant E16.5 preparations. Baseline frequency dropped by 49% in the P2b::CreBac1;Atoh1lox/lox mutants (lox/lox) and increased at pH 7.2 by 51 ± 10% above the pH7.4 value vs 106 ± 17% in the controls (cont). (D) Corresponding change of C4 frequency (ΔC4) induced by a pH challenge in P2b::CreBAC1;Atoh1lox/lox (lox/lox) compared to control (cont) preparations. (E) Left panel, photostimulation of the RTN region at E15.5 evokes ΔF/F changes in the RTN and adjacent nVII (dotted line) in Vglut2::ChR2;P2b::CreBAC1;Atoh1lox/+ preparations. Right panel, above, integrated C4 activity showing spontaneous bursts and bursts evoked by light pulses (blue bars) triggered 4 s after a spontaneous burst. Bottom left, close-up of a set of 10 superimposed spontaneous (Spont.) C4 bouts of activity and right, a corresponding set of light-evoked (Evoked) C4 responses, synchronized on the light pulse (blue bar) that appeared with variable latencies after the stimulus. (F) In P2b::CreBAC1;Atoh1lox/lox mutants, ΔF/F responses to light are limited to a few cells in the RTN and nVII (left panel). Right panel, at top, integrated activity of C4 showing the reduced frequency of the C4 rhythm and systematic failures of photostimulation (blue bars) to evoke C4 responses; bottom, close-up of spontaneous C4 bouts of activity (Spont.) and lack of response to light (blue bar).
Figure 9
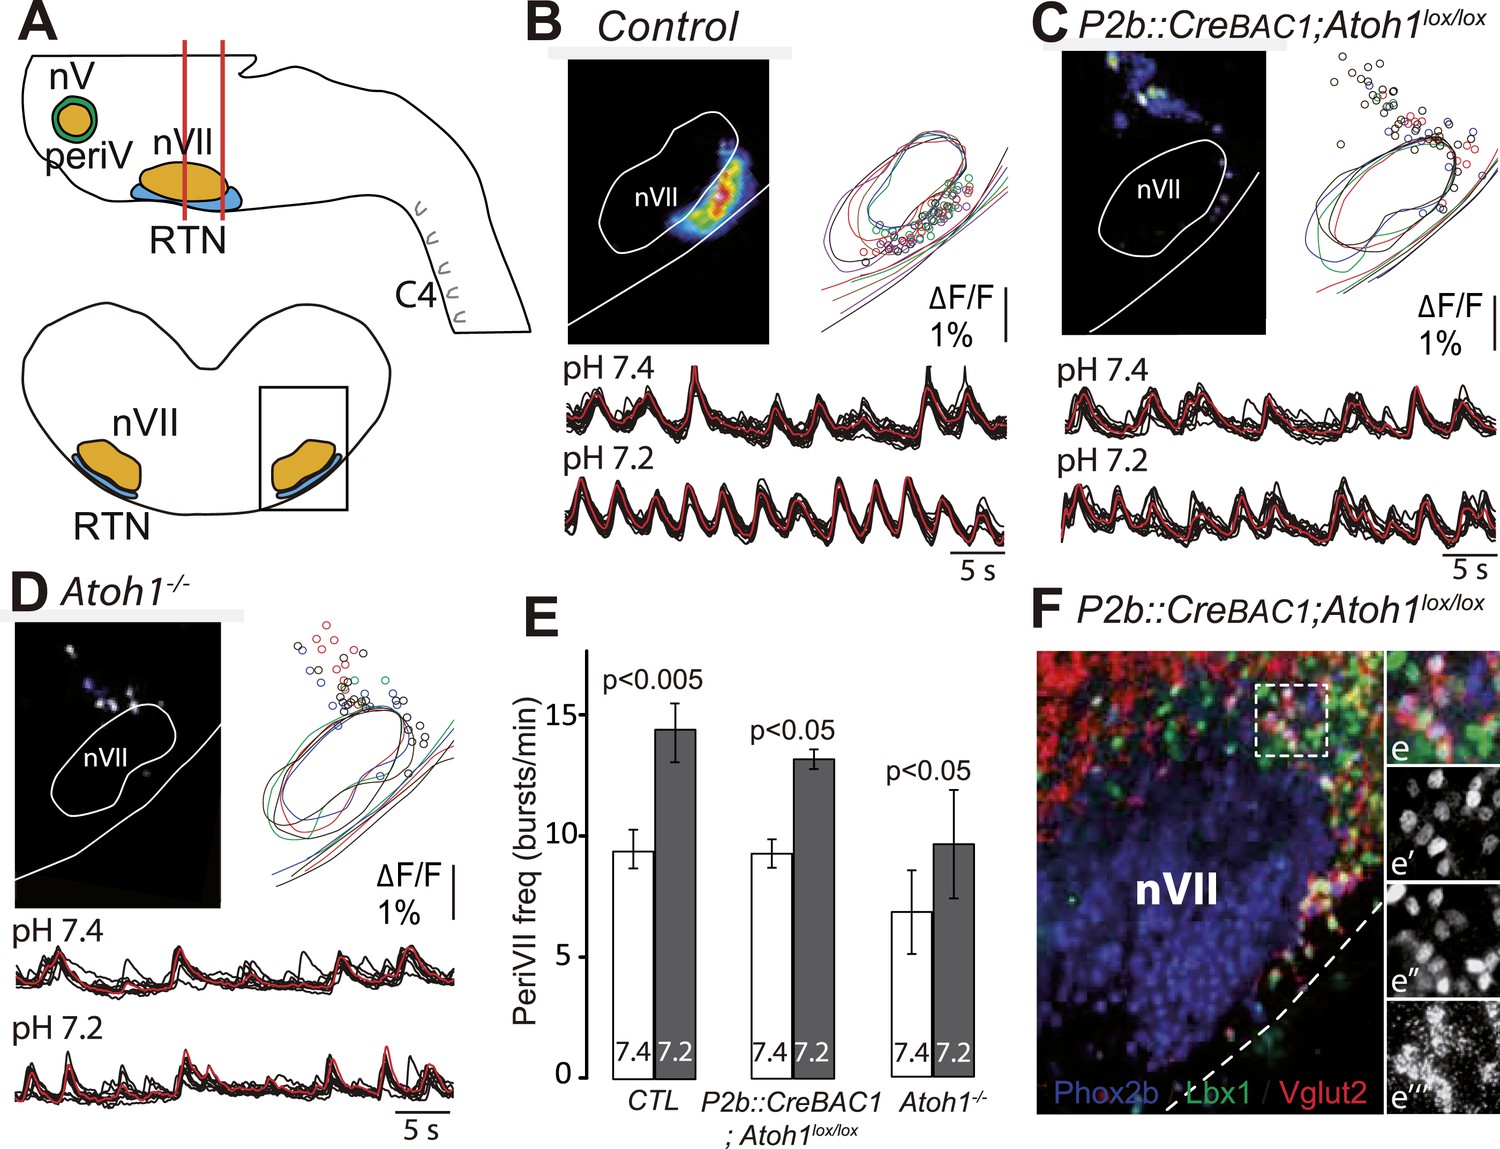
The dorsally misplaced periVII cells in P2b::CreBAC1;Atoh1lox/lox embryos are rhythmic and respond to a pH challenge.
(A) Cartoon of the brainstem (top) showing medullary slice preparation (delimited by vertical red lines) used for calcium imaging of dorsally misplaced mutant cells (bottom, black box). (B and C) Above, ΔF/F changes and activity maps and below, superimposed traces showing spontaneous rhythmic fluorescence changes (traces corresponding to individual periVII cells in black and average trace in red) at pH7.4 (top, 7.4) and pH7.2 (bottom, 7.2) in E15.5 transverse slices from control (B) or P2b::CreBAC1;Atoh1lox/lox (C) preparations. The rhythmic cells are found ventrally in the controls and are massively displaced dorsally in the mutants. (D) Same experiment for Atoh1−/− preparations, showing fewer rhythmic cells that are less well synchronized. In panels B–D, the matched colors of the circles and the outlines of nVII and the medullary surface represent individual experiments (B, n = 9; C, n = 5; D, n = 5). (E) Histograms showing that the frequency of the oscillations of periVII cell is not significantly different at pH7.4 (7.4, white bars) between controls (CTL) and P2b::CreBAC1;Atoh1lox/lox or Atoh1−/− mutants and is increased by acidification to pH7.2 (7.2, gray bars) in all cases. (F) Combined fluorescent ISH for Vglut2 (red) and immunofluorescent staining of Phox2b (blue) and Lbx1 (green) on coronal sections of an E15.5 P2b::CreBAC1;Atoh1lox/lox hindbrain showing Vglut2 expression by the dorsally misplaced Phox2b+/Lbx1+ cells; (e–e′′′), close ups of the boxed area showing the overlay (e), Phox2b (e′), Lbx1 (e′′) and Vglut2 (e′′′) expression.
Figure 10
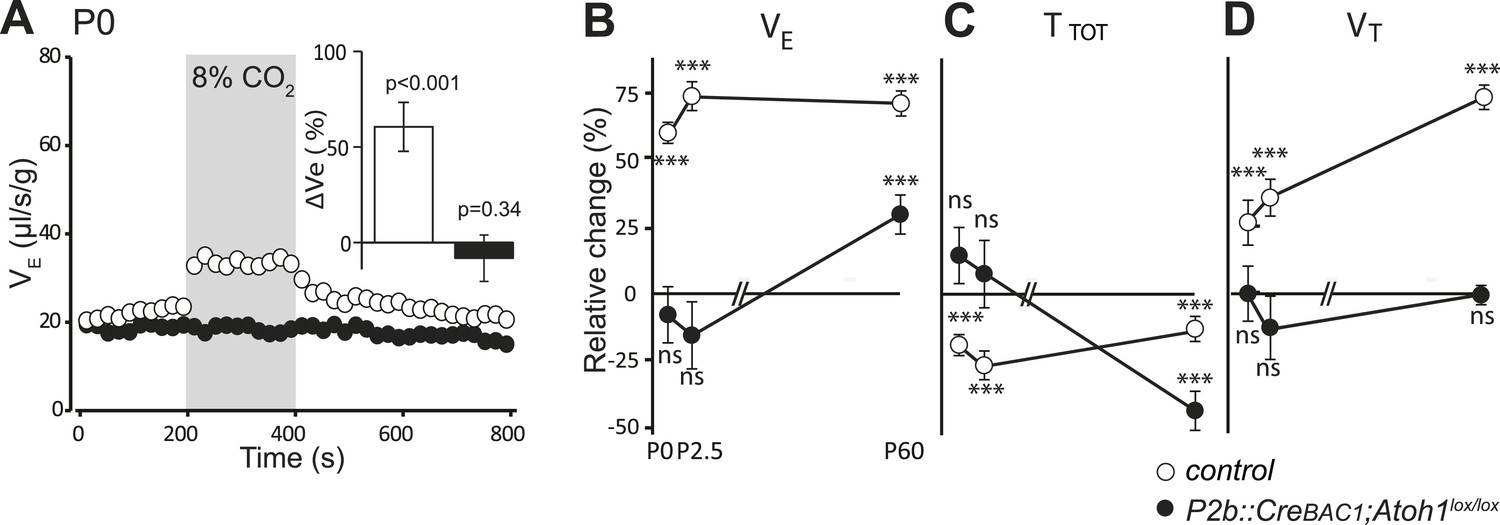
Defective CO2 chemosensitivity after inactivation of Atoh1 in Phox2bon cells.
(A) Plethysmographic recording of P0 pups. Shown are the mean values of VE in air or in response to 8% CO2 in P2b::CreBAC1;Atoh1lox/lox mutants (black circles) and controls (empty circles). Inset, ventilatory response to hypercapnia expressed as the percentage change relative to baseline for controls (white bar) and mutants (black bar). (B–D) Mean relative changes of ventilation (VE) (B), breath duration (TTOT) (C) and tidal volume (VT) (D) measured in P0 (control n = 31; mutant N = 13), P2.5 (n = 17; N = 9) and P60 (n = 19; N = 11) mice breathing normal or hypercapnic air (8% CO2). ***p < 0.001, n.s. = p > 0.05 (hypercapnic vs room air).
Figure 11

Loss of RTN neurons and the respiratory chemoreflex after selective inactivation of Phox2b in Atoh1on cells.
(A, B, F, G) Combined ISH for Atoh1 (blue) and IHC for Phox2b (brown) on coronal hindbrain sections from E15.5 (A and B) and E18.5 (F and G) embryos of the indicated genotypes. The insets show high magnifications corresponding to the boxed areas. (C and H) Counts of the Atoh1+ periVII cells in control (Atoh1Cre;Phox2blox/+) and mutant (Atoh1Cre;Phox2blox/lox) embryos at E15.5 (C) and E18.5 (H). Total periVII cells represent 66 ± 6% of the controls at E15.5 (n = 4) and drop to 38 ± 2% at E18.5 (n = 3), while most Atoh1+ cells have lost Phox2b expression already at E15.5. There was no ventral to dorsal shift of periVII cells in the Phox2b mutants (26 ± 2% and 21 ± 0.3% dorsally located cells in controls and mutants, respectively). (D) Quantification of C4 burst frequencies in baseline (white bar) and low pH (gray bar) conditions in control (cont) and Atoh1Cre;Phox2blox/lox (lox/lox) E16.5 preparations. Baseline frequency dropped by 56% in the Atoh1Cre;Phox2blox/lox mutants. It increased by 127% above the pH7.4 value in the mutants vs 135% in the controls. (E) Corresponding change of C4 frequency (ΔC4) induced by a pH challenge in Atoh1Cre;Phox2blox/lox (lox/lox) compared to control (cont) preparations. (I) Plethysmographic recording of P0 pups. Shown are the mean values of VE in air or in response to 8% CO2 in Atoh1Cre;Phox2blox/lox mutants (black circles) (n = 10) and controls (empty circles) (n = 10). The inset represents the ventilatory response to hypercapnia expressed as the percentage change relative to baseline for controls (white bar) and mutants (black bar) showing the lack of a significant effect of hypercapnia.
Figure 12
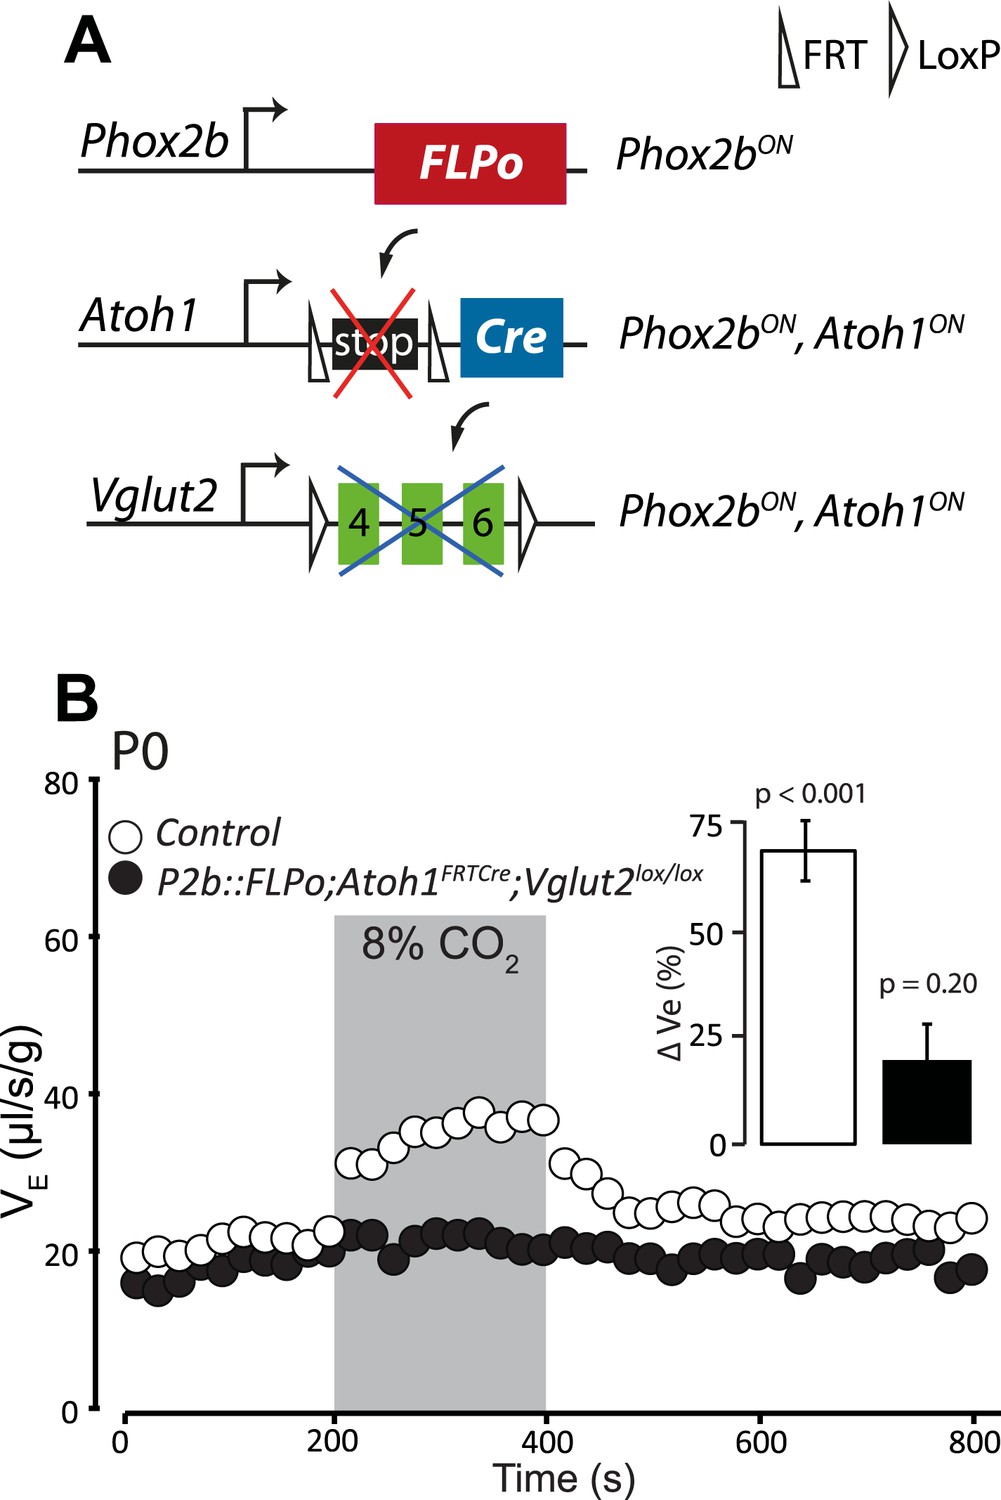
Disrupting the synaptic release of glutamate in Atoh1on/Phox2bon cells suppresses the CO2 response.
(A) Schematic of the P2b::FLPo (above) and Atoh1FRTCre (middle) alleles and the floxed Vglut2 locus (Wallen-Mackenzie et al., 2006) (below). The Phox2b lineage cells expressing FLPo recombinase from the Phox2b promoter will activate Cre expression from the Atoh1 locus selectively in Phox2bon/Atoh1on cells. Inactivation of the floxed Vglut2 locus will thus be restricted to Phox2bon/Atoh1on cells. (B) Plethysmographic recording of P0 Vglut2lox/lox;Atoh1FRTCre;P2b::FLPo pups showing slightly slowed-down baseline ventilation in air and lack of response to 8% CO2 (black circles) (n = 12) compared to controls (empty circles) (n = 9). The inset shows the ventilatory response to hypercapnia expressed as the percentage change of VE relative to baseline for mutants (black bar) and controls (white bar).
Author response image 1
Tables
Table 1
Relative changes (%) in breathing parameters in response to hypercapnia (8% CO2) measured by plethysmography in E18.5 or P0 pups of the indicated genotypes
| Genotypes | ΔVE | p-value | ΔTTOT | p-value | ΔVT | p-value | n |
|---|---|---|---|---|---|---|---|
| control | 60.9 ± 8.9 | <0.001 | −19.5 ± 2.8 | <0.001 | 27.5 ± 5.7 | <0.001 | 51 |
| Atoh1−/− | −3.7 ± 8.1 | 0.53 | 6.7 ± 10.4 | 0.58 | −1.3 ± 4.9 | 0.62 | 8 |
| P2b::CreBAC1;Atoh1lox/lox | −8.0 ± 12.8 | 0.35 | 14.6 ± 10.6 | 0.63 | 0.4 ± 10.9 | 0.55 | 13 |
| Atoh1Cre;Phox2blox/lox | 18.7 ± 13.5 | 0.91 | −1.9 ± 8.1 | 0.31 | 9.2 ± 9.2 | 0.45 | 10 |
| P2b::FLPo;Atoh1FRTCre;Vglut2lox/lox | 20.3 ± 8.6 | 0.20 | −3.6 ± 6.1 | 0.31 | 16.7 ± 9.2 | 0.25 | 12 |
Download links
A two-part list of links to download the article, or parts of the article, in various formats.
Downloads (link to download the article as PDF)
Open citations (links to open the citations from this article in various online reference manager services)
Cite this article (links to download the citations from this article in formats compatible with various reference manager tools)
The retrotrapezoid nucleus neurons expressing Atoh1 and Phox2b are essential for the respiratory response to CO2
eLife 4:e07051.
https://doi.org/10.7554/eLife.07051


