Integrating between-host transmission and within-host immunity to analyze the impact of varicella vaccination on zoster
- University of Antwerp, Belgium
- Hasselt University, Belgium
- University of New South Wales, Australia
Figures
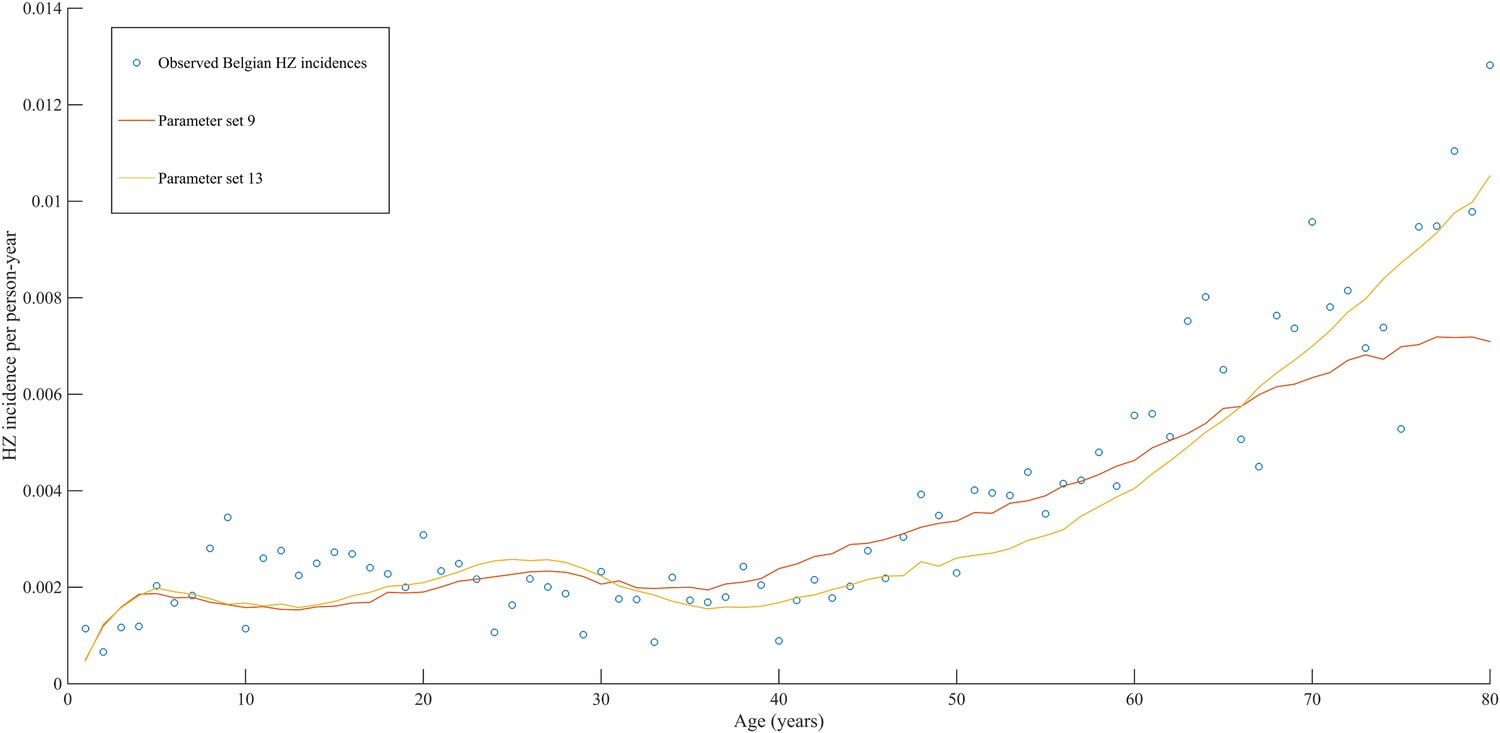
Figure 1

Observed (open circles) and simulated (continuous lines) Belgian herpes zoster (HZ) incidence data by age.
https://doi.org/10.7554/eLife.07116.004-
Figure 1—source data 1
Observed Belgian HZ incidence per age group and per person-year.
- https://doi.org/10.7554/eLife.07116.005
Figure 2 with 1 supplement
Observed (open circles) and simulated (continuous lines) Belgian HZ incidence data by age.
https://doi.org/10.7554/eLife.07116.006
Figure 2—figure supplement 1
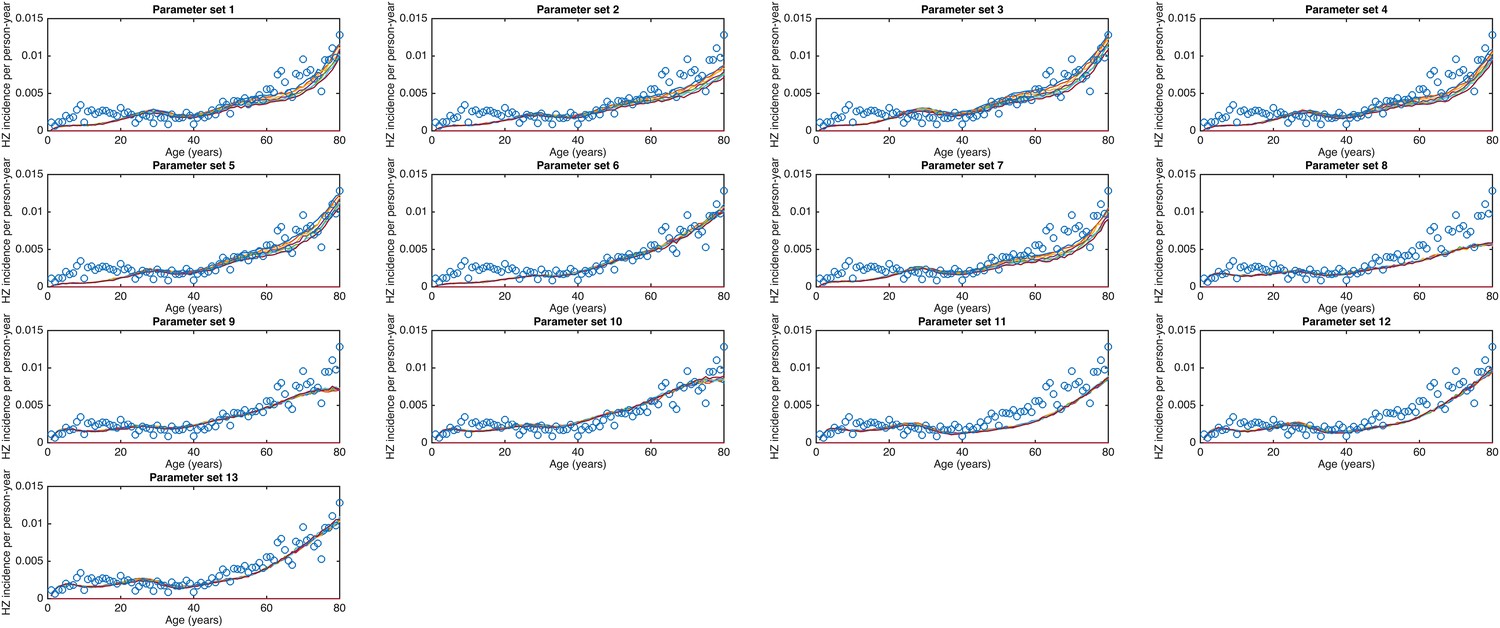
Observed (open circles) Belgian HZ incidence data by age and simulated HZ incidence data (continuous lines) for the 13 best parameter sets with a sensitivity analysis for the HZ infectiousness parameter (values: 0.03, 0.10, 0.17, 0.24, 0.31, 0.38 and 0.45) and three runs per parameter set.
https://doi.org/10.7554/eLife.07116.007
Figure 3
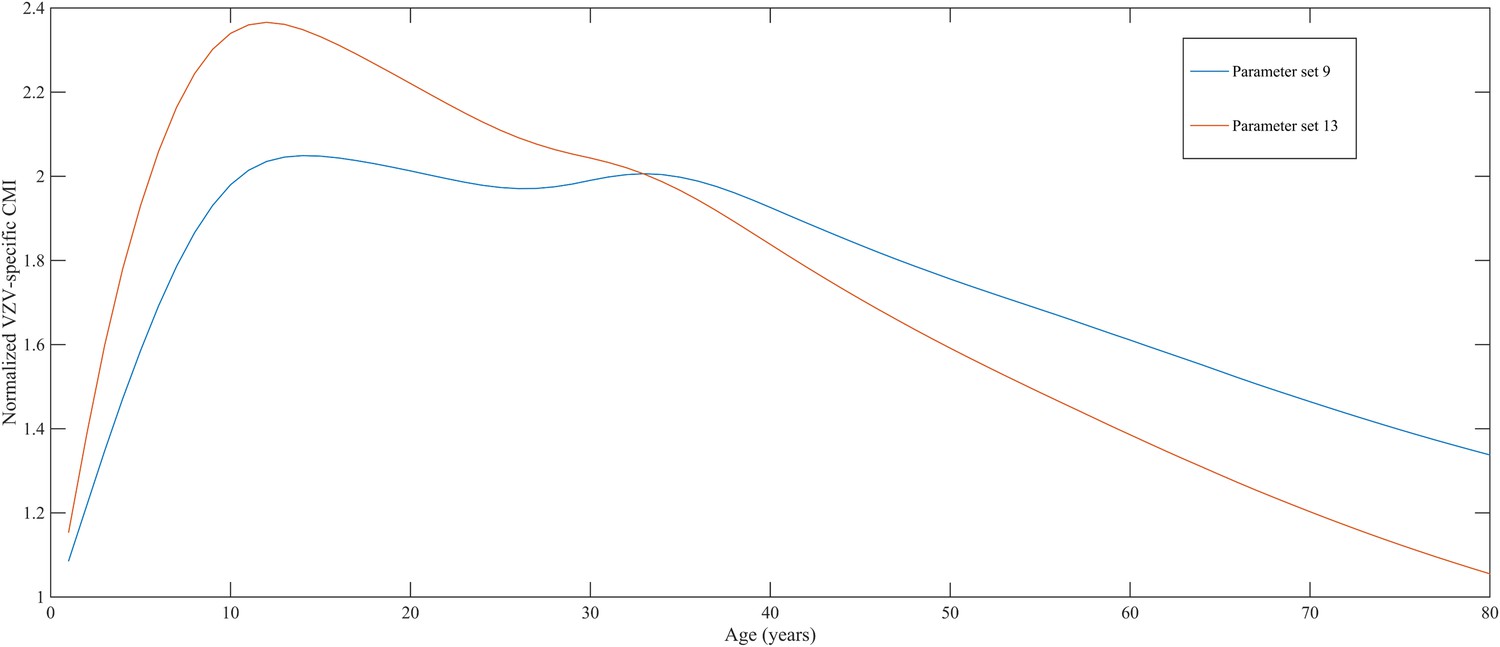
Normalized varicella-zoster virus (VZV)-specific CMI averaged over 80 simulation years and over all individuals for the two best parameter sets.
Caption: note that this figure shows average dynamics although some individuals will have VZV-specific CMI values below 1 (making them susceptible to HZ).
Figure 4
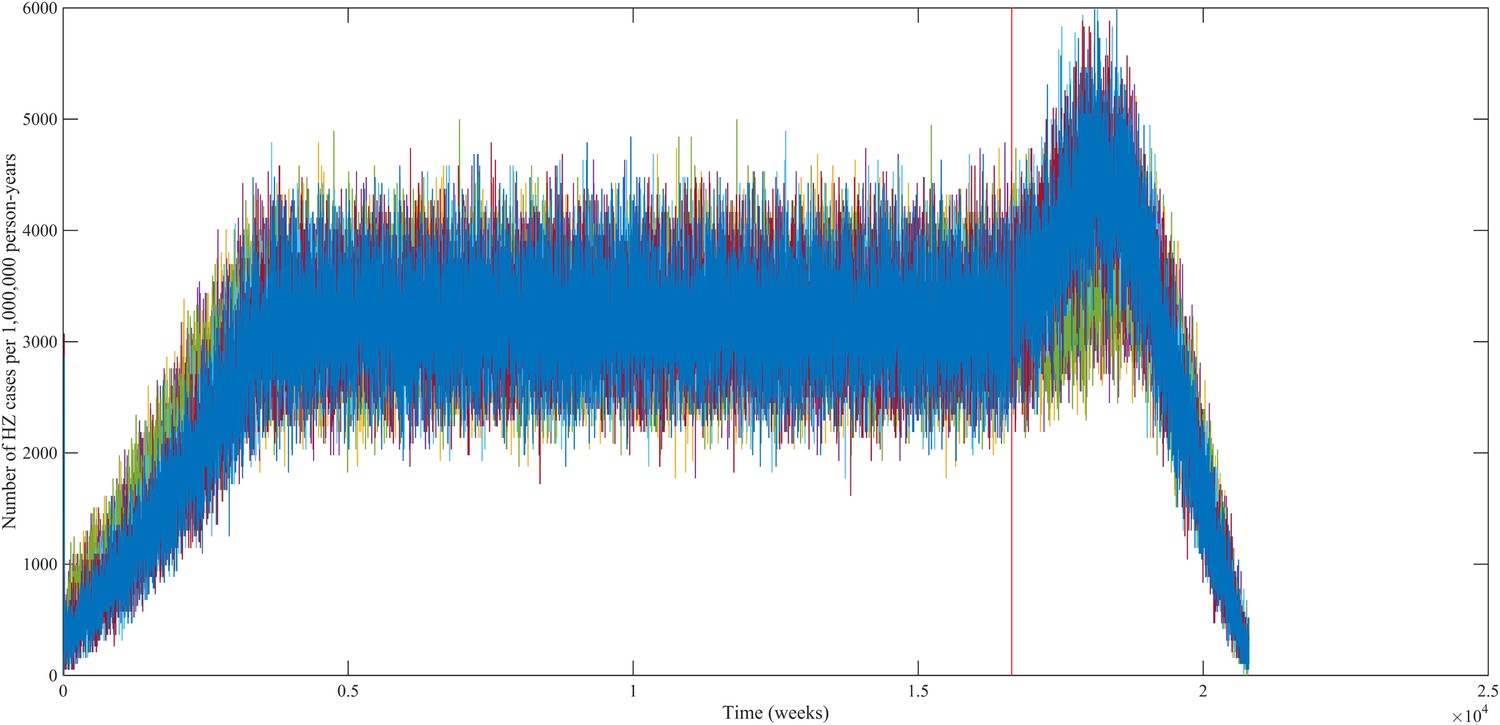
Predicted HZ incidence (aggregated for all ages) over time with a CP vaccine for 1 year olds using the best-fitting parameter sets.
The red line indicates the moment of CP vaccine introduction, which is assumed to be 100% effective.
Figure 5
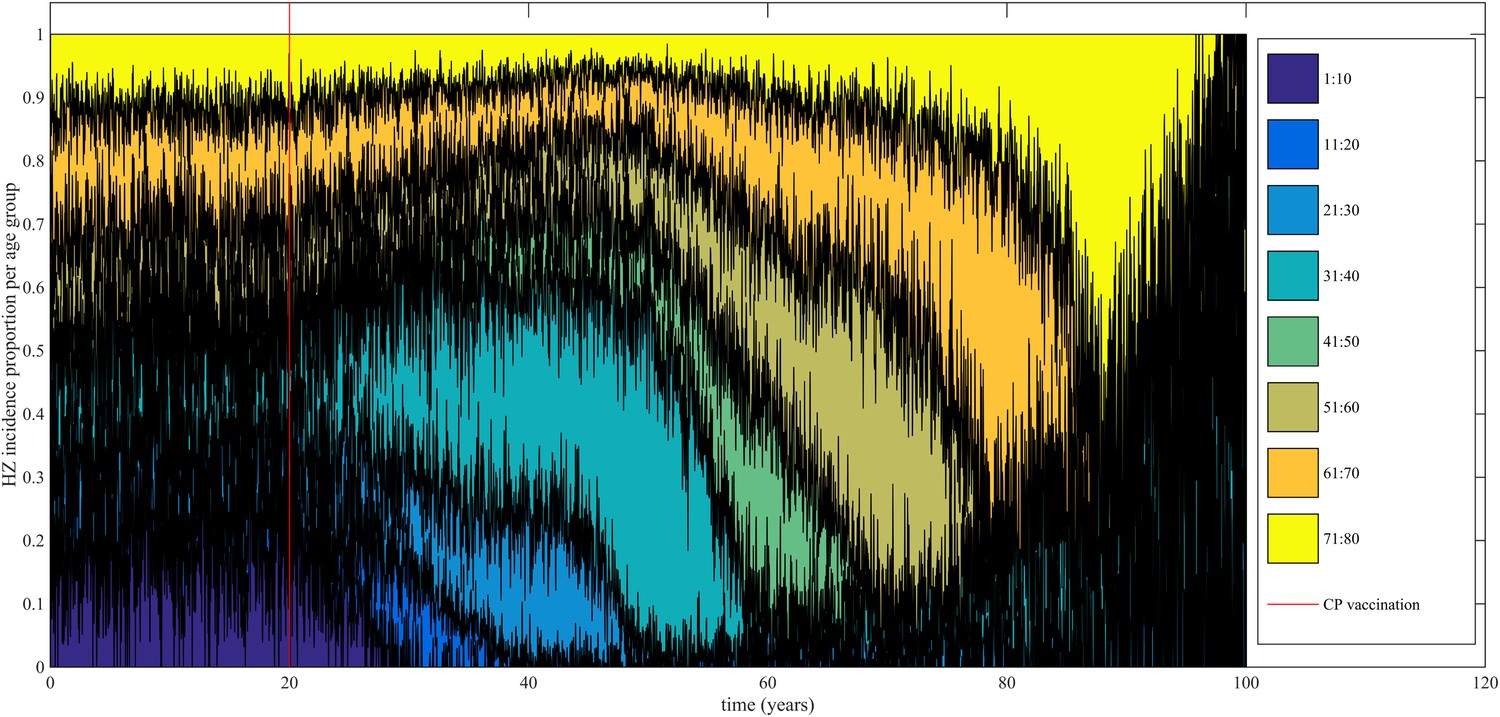
Time-evolution of the relative contribution to HZ incidence per age group before and after introduction of 100% effective varicella vaccination for 1 year olds.
https://doi.org/10.7554/eLife.07116.010
Figure 6

Simplified dynamics of VZV-CMI, VZV reactivation and boosting events as modeled.
The sequence of exogenous boosting and VZV reactivation can be switched.
Figure 7
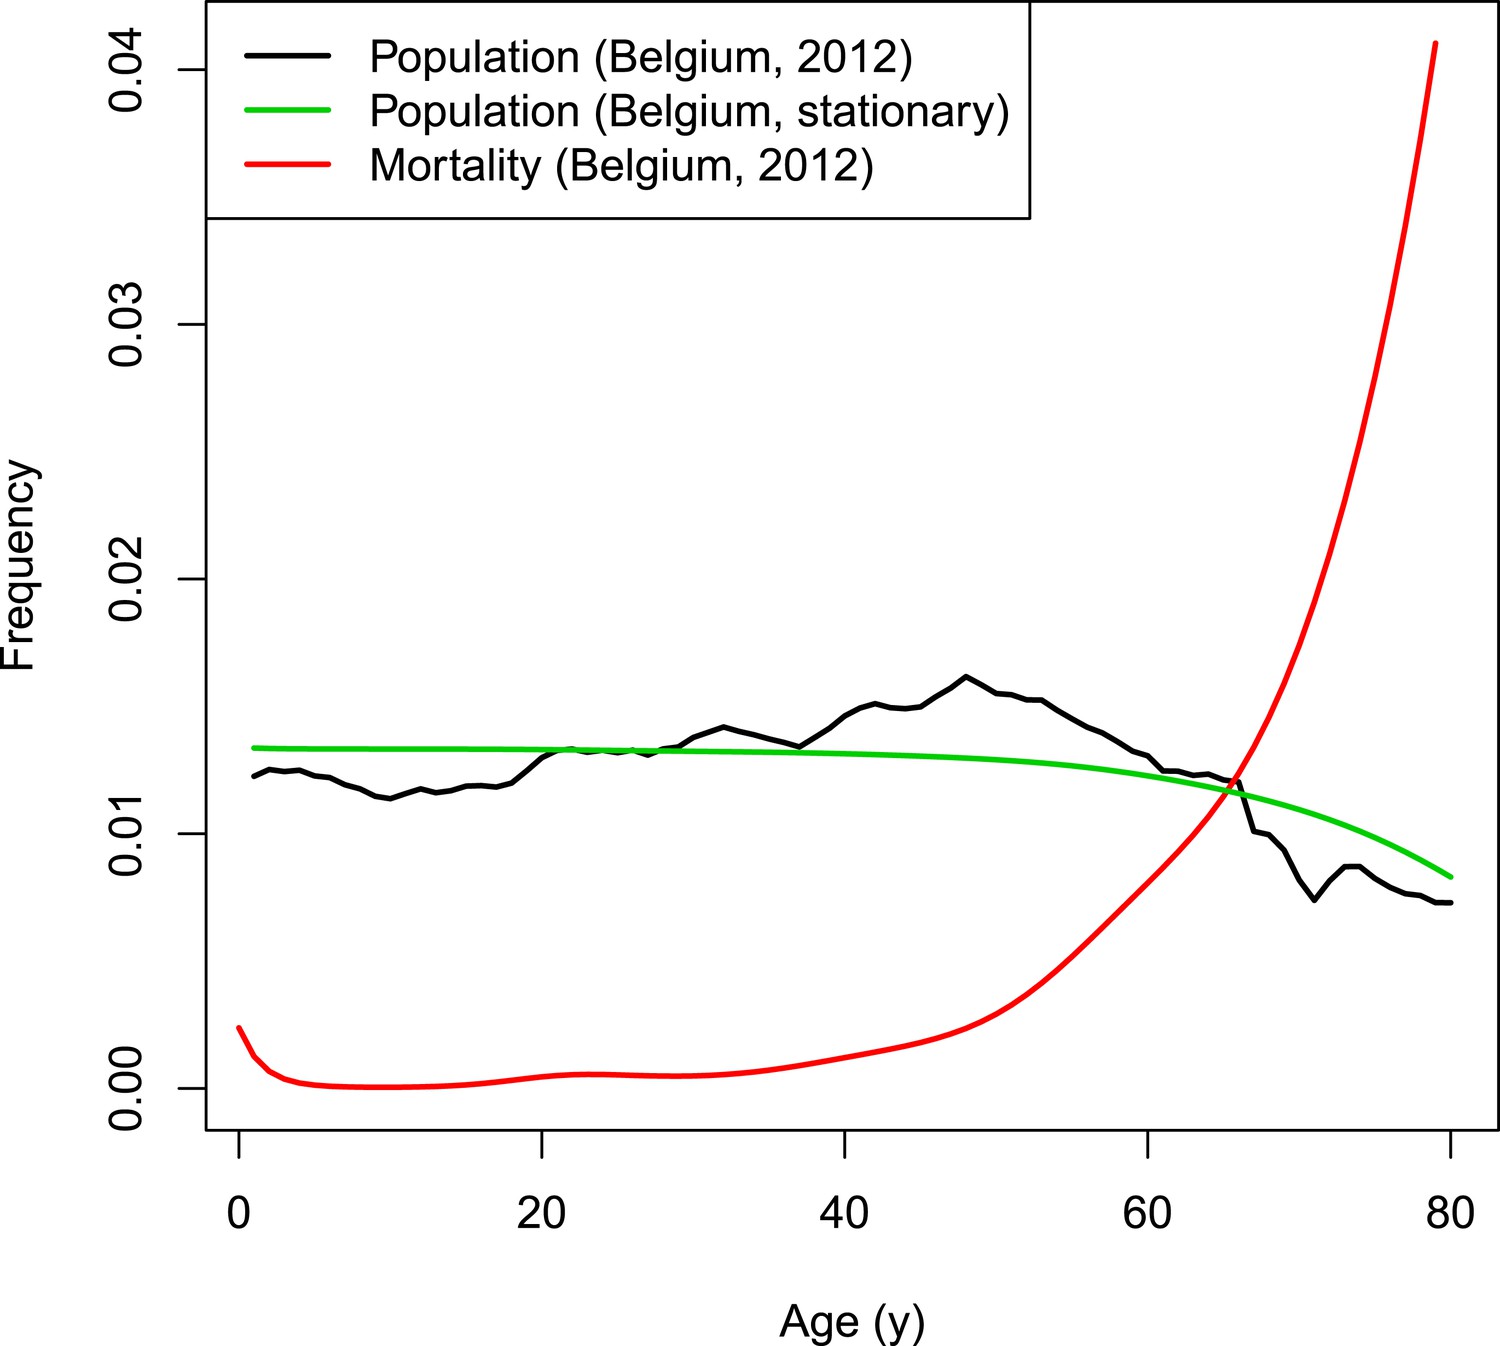
VZV IBM demography.
https://doi.org/10.7554/eLife.07116.012
Figure 8
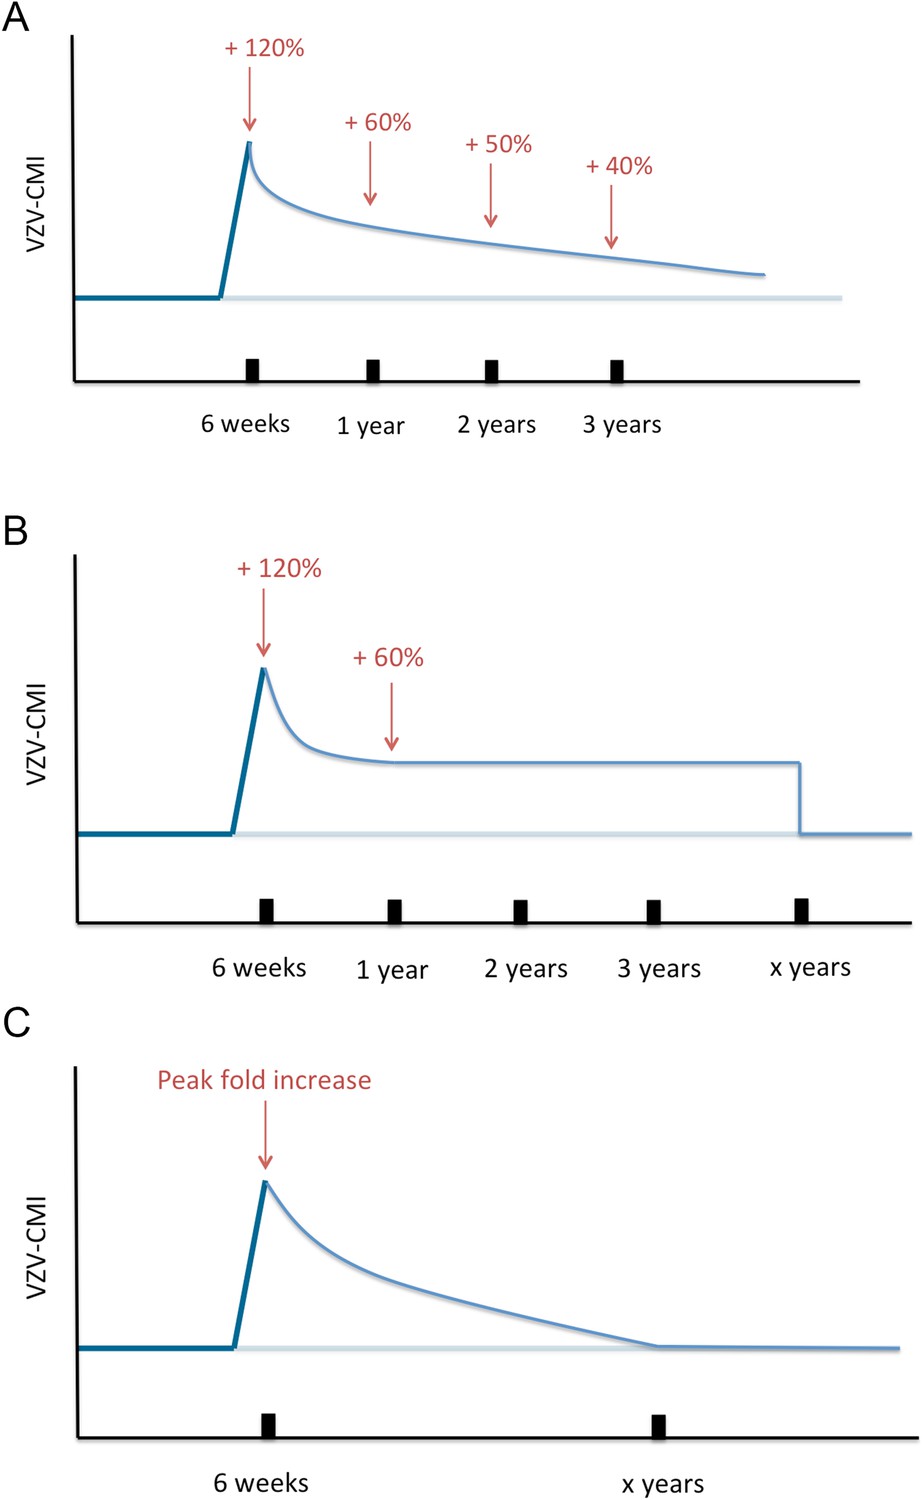
Three different boosting scenarios.
(A) Illustrates the exponential decline parameterized by a peak (+120%) at 6 weeks, (+60%) 1 year later, (50%) 2 years later and (+40%) 3 years later as presented by the Zostavax vaccine trial by Levin et al. (B) Illustrates the exponential decline from peak (+120%) to (+60%) 1 year later and constant for x years (as defined by the parameter set) after wards, as a modified interpretation of the results of the Zostavax vaccine trial by Levin et al. (C) Illustrates the increase to a peak value as defined by the parameter set that is followed by an exponential decline so that the pre-boosting value is reached after x years.
Figure 9
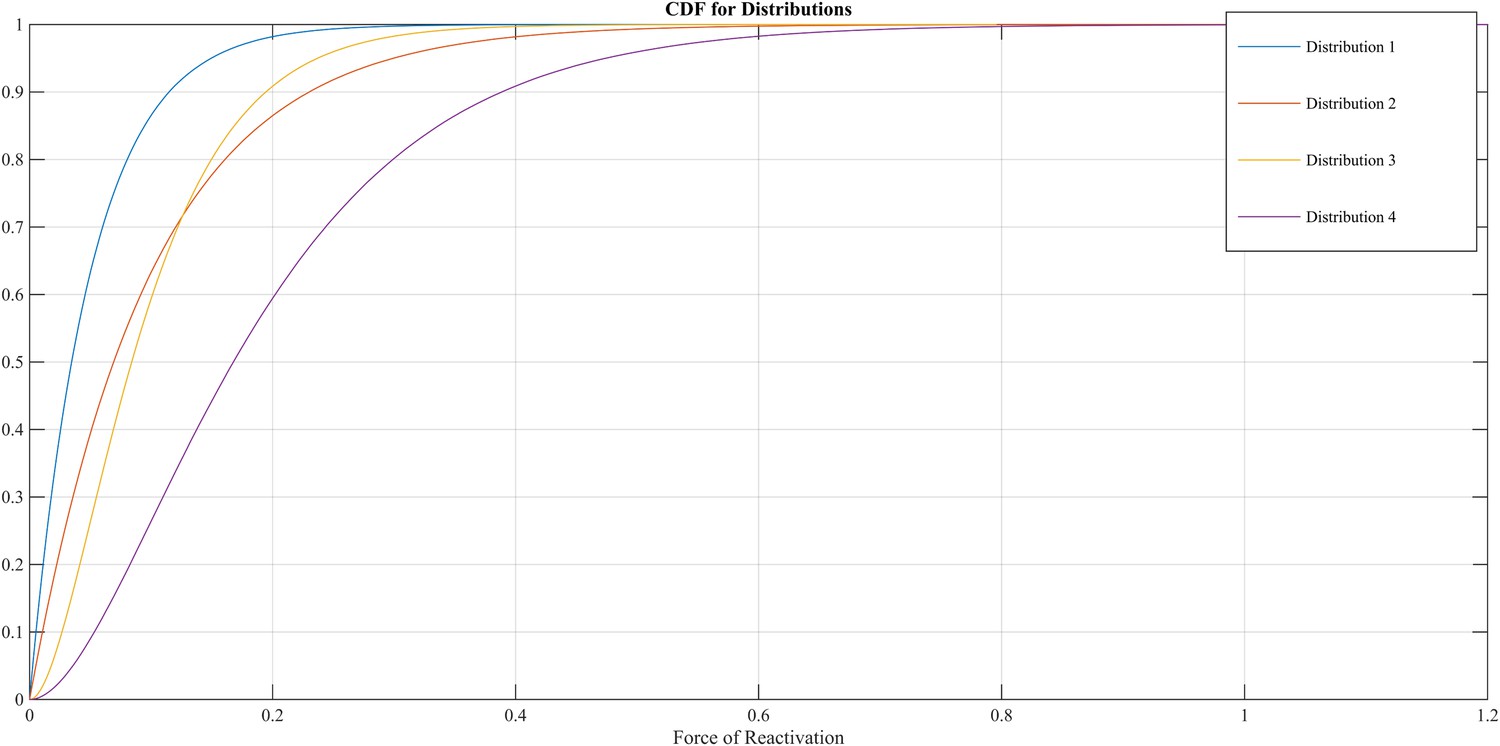
Different cumulative distribution functions (CDF) for Force of Reactivation (FoR).
https://doi.org/10.7554/eLife.07116.015Tables
Table 1
Best fitting parameter sets
| Parameter set | Deviance* | Annual waning rate (%) | Boosting scenario | Duration of boosting (years) | Peak fold increase following exogenous boosting | VZV weekly reactivation probability (%) | Distribution threshold VZV-CMI for HZ | Peak fold increase following endogenous boosting |
|---|---|---|---|---|---|---|---|---|
| Original Search (obtained after Step 2 in Table 1) | ||||||||
| 1 | 926 | 2.0 | 3 | 10 | 1.3 | 1.5 | 4 | 1 |
| 2 | 939 | 1.5 | 3 | 3 | 1.3 | 1.5 | 4 | 1 |
| 3 | 949 | 2.0 | 3 | 7 | 1.3 | 1.5 | 4 | 1 |
| 4 | 951 | 2.0 | 3 | 12 | 1.3 | 1.5 | 4 | 1 |
| 5 | 968 | 2.0 | 3 | 7 | 1.3 | 1.0 | 4 | 1 |
| 6 | 970 | 1.0 | 3 | 2 | 1.3 | 1.0 | 4 | 1 |
| 7 | 969 | 2.0 | 3 | 15 | 1.3 | 1.5 | 4 | 1 |
| 8 | 934 | 1.0 | 3 | 1 | 2.5 | 5.0 | 4 | 1 |
| Border search | ||||||||
| 9 | 751 | 1.0 | 3 | 1 | 2.8 | 5.0 | 4 | 1 |
| 10 | 799 | 1.0 | 3 | 1 | 3.1 | 5.0 | 4 | 1 |
| 11 | 965 | 1.5 | 3 | 2 | 3.4 | 5.0 | 4 | 1 |
| 12 | 804 | 1.5 | 3 | 2 | 3.7 | 5.0 | 4 | 1 |
| 13 | 722 | 1.5 | 3 | 2 | 4.0 | 5.0 | 4 | 1 |
-
*
Results shown are averaged results per parameter set.
-
VZV, varicella-zoster virus; HZ, herpes zoster.
Table 2
Initial parameter sets
| Parameters | Step 1 | Step 2 |
|---|---|---|
| Annual waning rate (%) | 2.0 | 0.5 |
| 3.0 | 1.0 | |
| 4.0 | 1.5 | |
| – | 2.0 | |
| – | 2.5 | |
| Boosting scenario | 1 | 3 |
| 2 | – | |
| 3 | – | |
| Duration of boosting (years) | 1 | 1 |
| 2 | 2 | |
| 4 | 3 | |
| 7 | 4 | |
| 12 | 5 | |
| – | 7 | |
| – | 10 | |
| – | 12 | |
| – | 15 | |
| Peak fold increase following exogenous boosting | 1 | 1.3 |
| 1.6 | 1.6 | |
| 2.2 | 1.9 | |
| – | 2.2 | |
| – | 2.5 | |
| VZV weekly reactivation probability (%) | 0.01 | 0.001 |
| 0.1 | 0.05 | |
| 0.3 | 0.01 | |
| 0.5 | 0.015 | |
| – | 0.1 | |
| – | 0.2 | |
| – | 0.3 | |
| – | 0.4 | |
| Distribution threshold VZV-CMI for HZ | 1 | 1 |
| 2 | 2 | |
| 3 | 4 | |
| 4 | – | |
| Peak fold increase following endogenous boosting | 1 | 1 |
| 1.4 | 1.2 | |
| 1.8 | – | |
| 2.2 | – |
Table 3
Step 2 parameter set selection
| Parameters | Best parameter sets + deviance +5% | Most prevalent parameters in Q2.5 |
|---|---|---|
| Annual waning rate (%) | 2.0 | 2.0 |
| Boosting scenario | 3 | 3 |
| Duration of exogenous boosting (years) | 1 | 1 |
| 4 | 2 | |
| – | 4 | |
| – | 7 | |
| – | 12 | |
| Peak fold increase following exogenous boosting | 1.6 | 1.6 |
| – | 2.2 | |
| VZV weekly reactivation probability (%) | 0.01 | 0.01 |
| 0.1 | 0.3 | |
| Distribution threshold VZV-CMI for HZ | 2 | 1 |
| 4 | 2 | |
| Peak fold increase following endogenous boosting | 1 | 1 |
Download links
A two-part list of links to download the article, or parts of the article, in various formats.
Downloads (link to download the article as PDF)
Open citations (links to open the citations from this article in various online reference manager services)
Cite this article (links to download the citations from this article in formats compatible with various reference manager tools)
Integrating between-host transmission and within-host immunity to analyze the impact of varicella vaccination on zoster
eLife 4:e07116.
https://doi.org/10.7554/eLife.07116


