Acoustic shadows help gleaning bats find prey, but may be defeated by prey acoustic camouflage on rough surfaces
- Queen Mary University of London, United Kingdom
- University of Bristol, United Kingdom
Figures
Figure 1
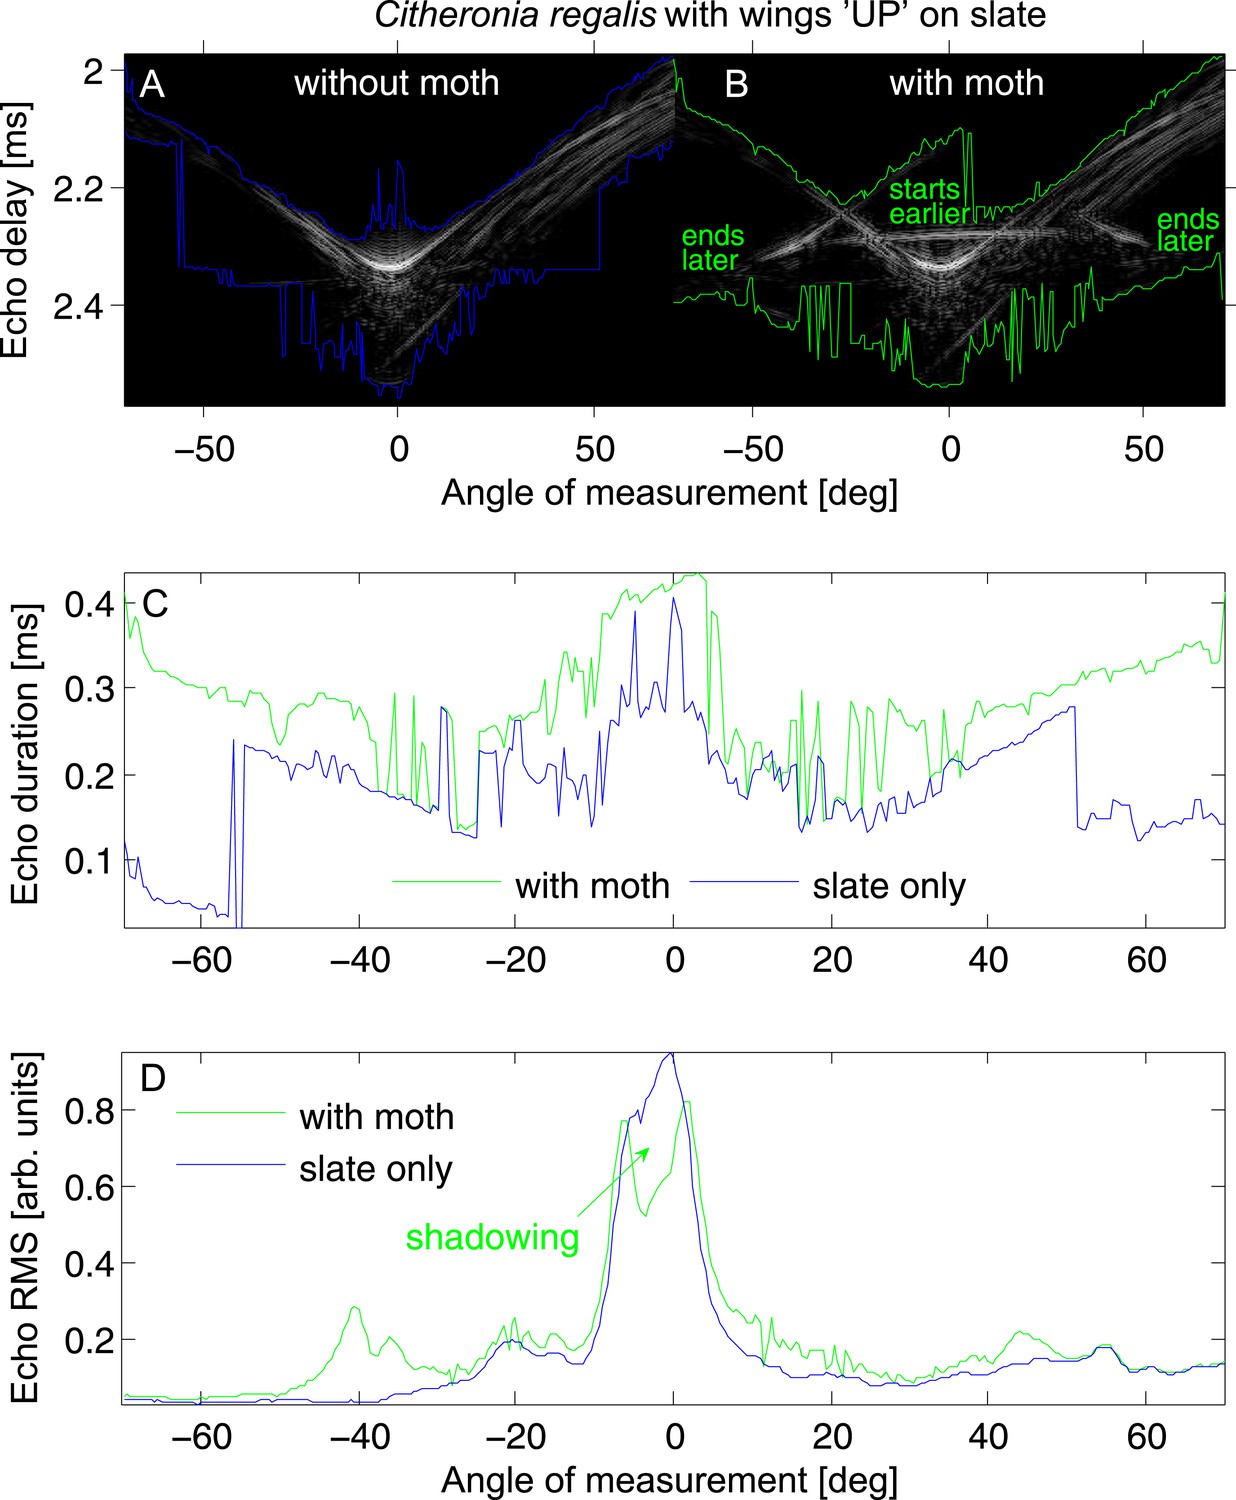
Echo cue examples for Citheronia regalis on slate with wings in ‘UP’ position.
(A and B) Envelope of the echo impulse response as a function of measurement angle, (A) slate only; (B) slate plus moth. Coloured lines indicate start (top lines) and end (bottom lines) of the echo. (C) Echo duration and (D) echo root mean square (RMS) as a function of measurement angle. Green lines: with moth, blue lines: without moth.
Figure 2
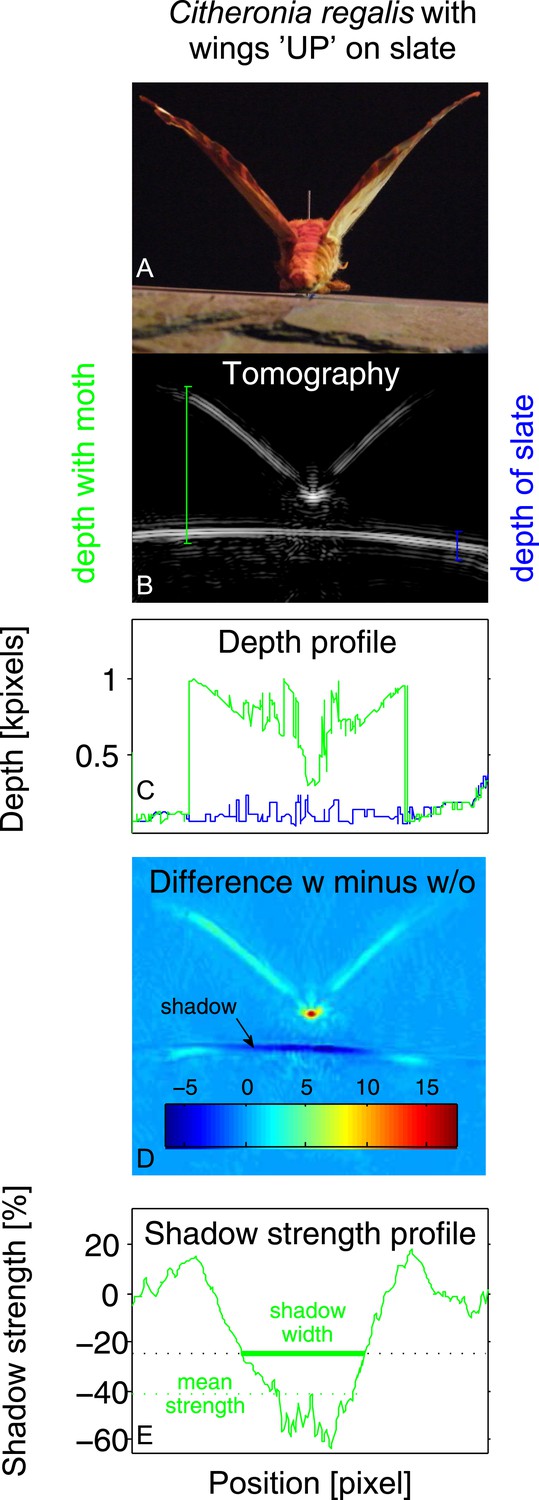
Example of tomography analysis for Citheronia regalis on slate with wings in ‘UP’ position.
(A) Photograph from rear of moth. (B) Tomography. Coloured vertical lines indicate example depth measurements (‘with moth’ in green; ‘without moth’ in blue). (C) Depth profile for substrate with (green) and without (blue) moth as a function of measurement angle. (D) Subtraction of tomographies with (w) and without (w/o) moth. Colour indicates absolute difference. (E) Strength of the shadow in percentage (%) difference to without moth as a function of measurement angle. Shadow size is measured as all angles where the shadow strength is at least 25% below the substrate without a moth. Overall shadow strength is the mean shadow strength over the entire shadow.
Figure 3
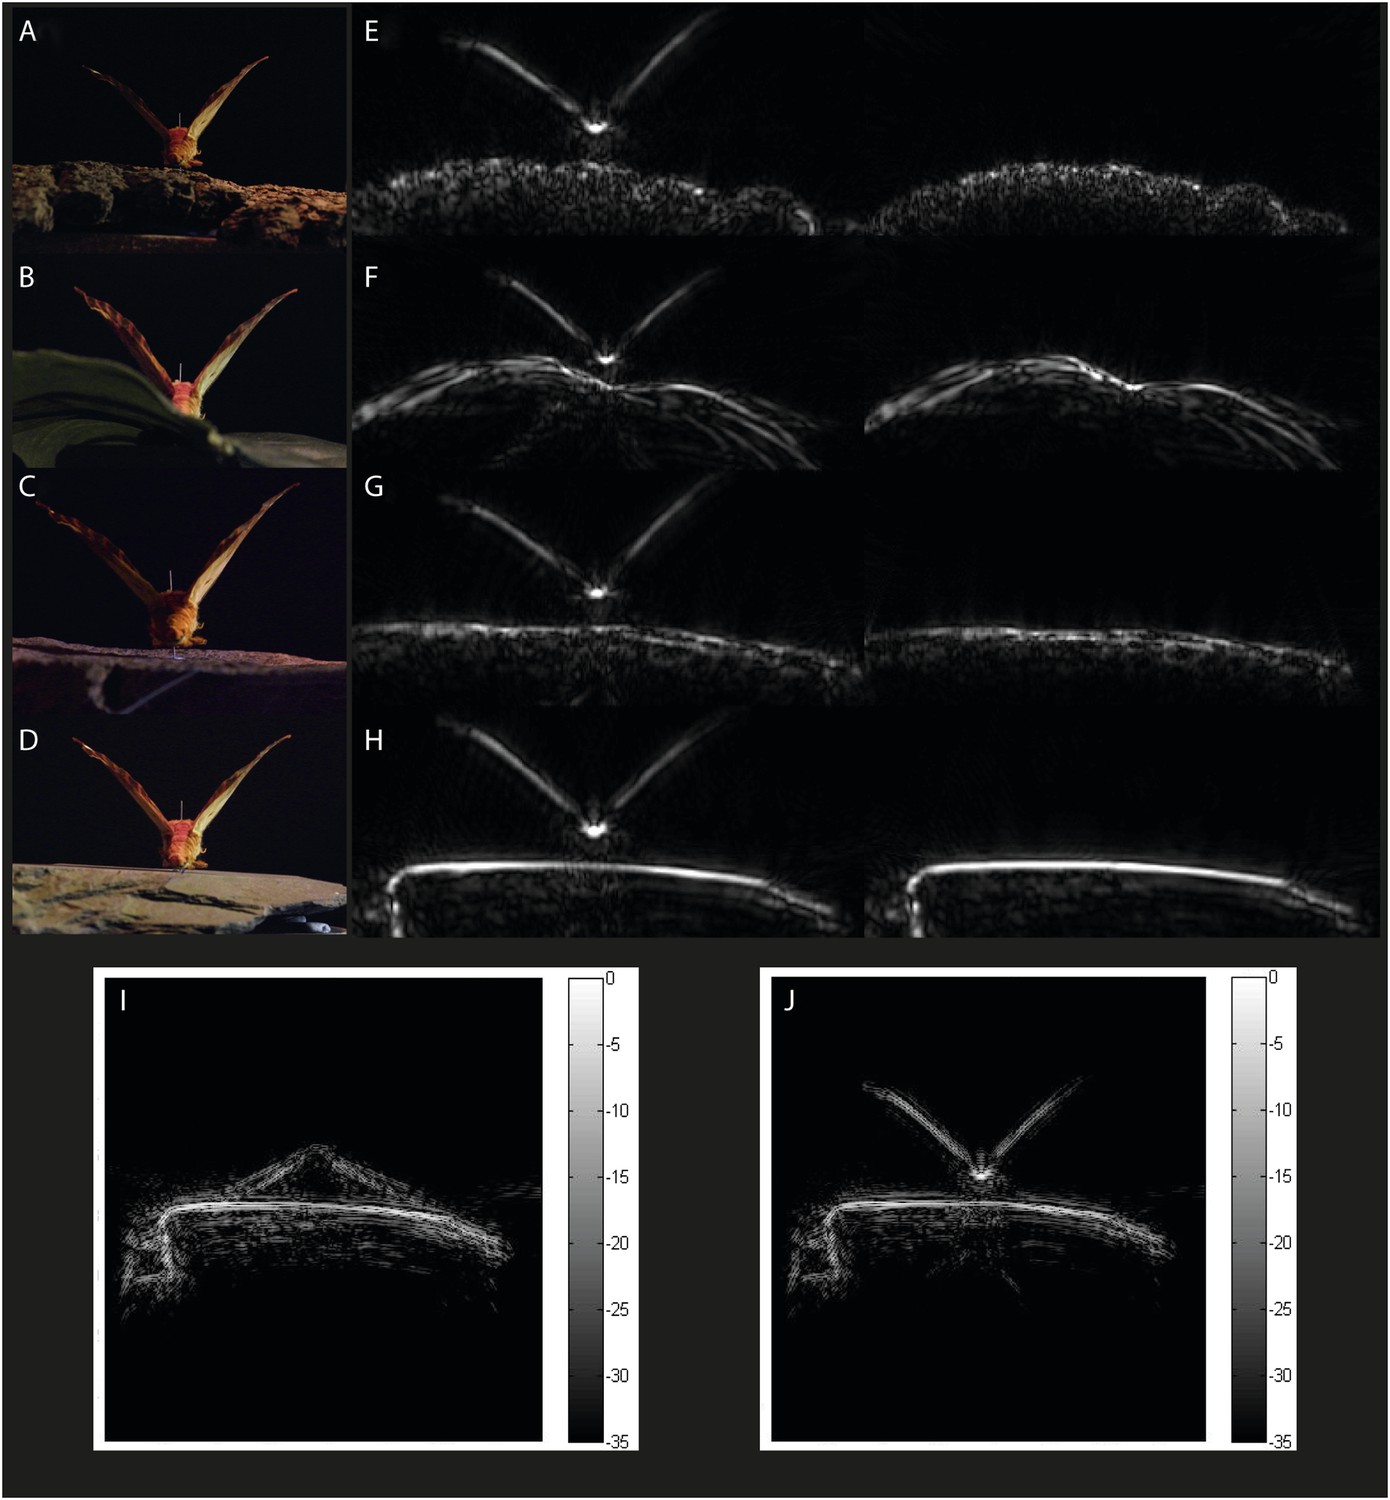
Example acoustic tomographies for Citheronia regalis.
Specimens were placed on one of four substrates (A) bark, (B) leaf, (C) limestone, and (D) slate, and we generated acoustic tomographies with and without the specimen (left and right in panels E–H, respectively). For each species, we generated tomographies with specimens that had their wings (I) FLAT and (J) UP.
Figure 4
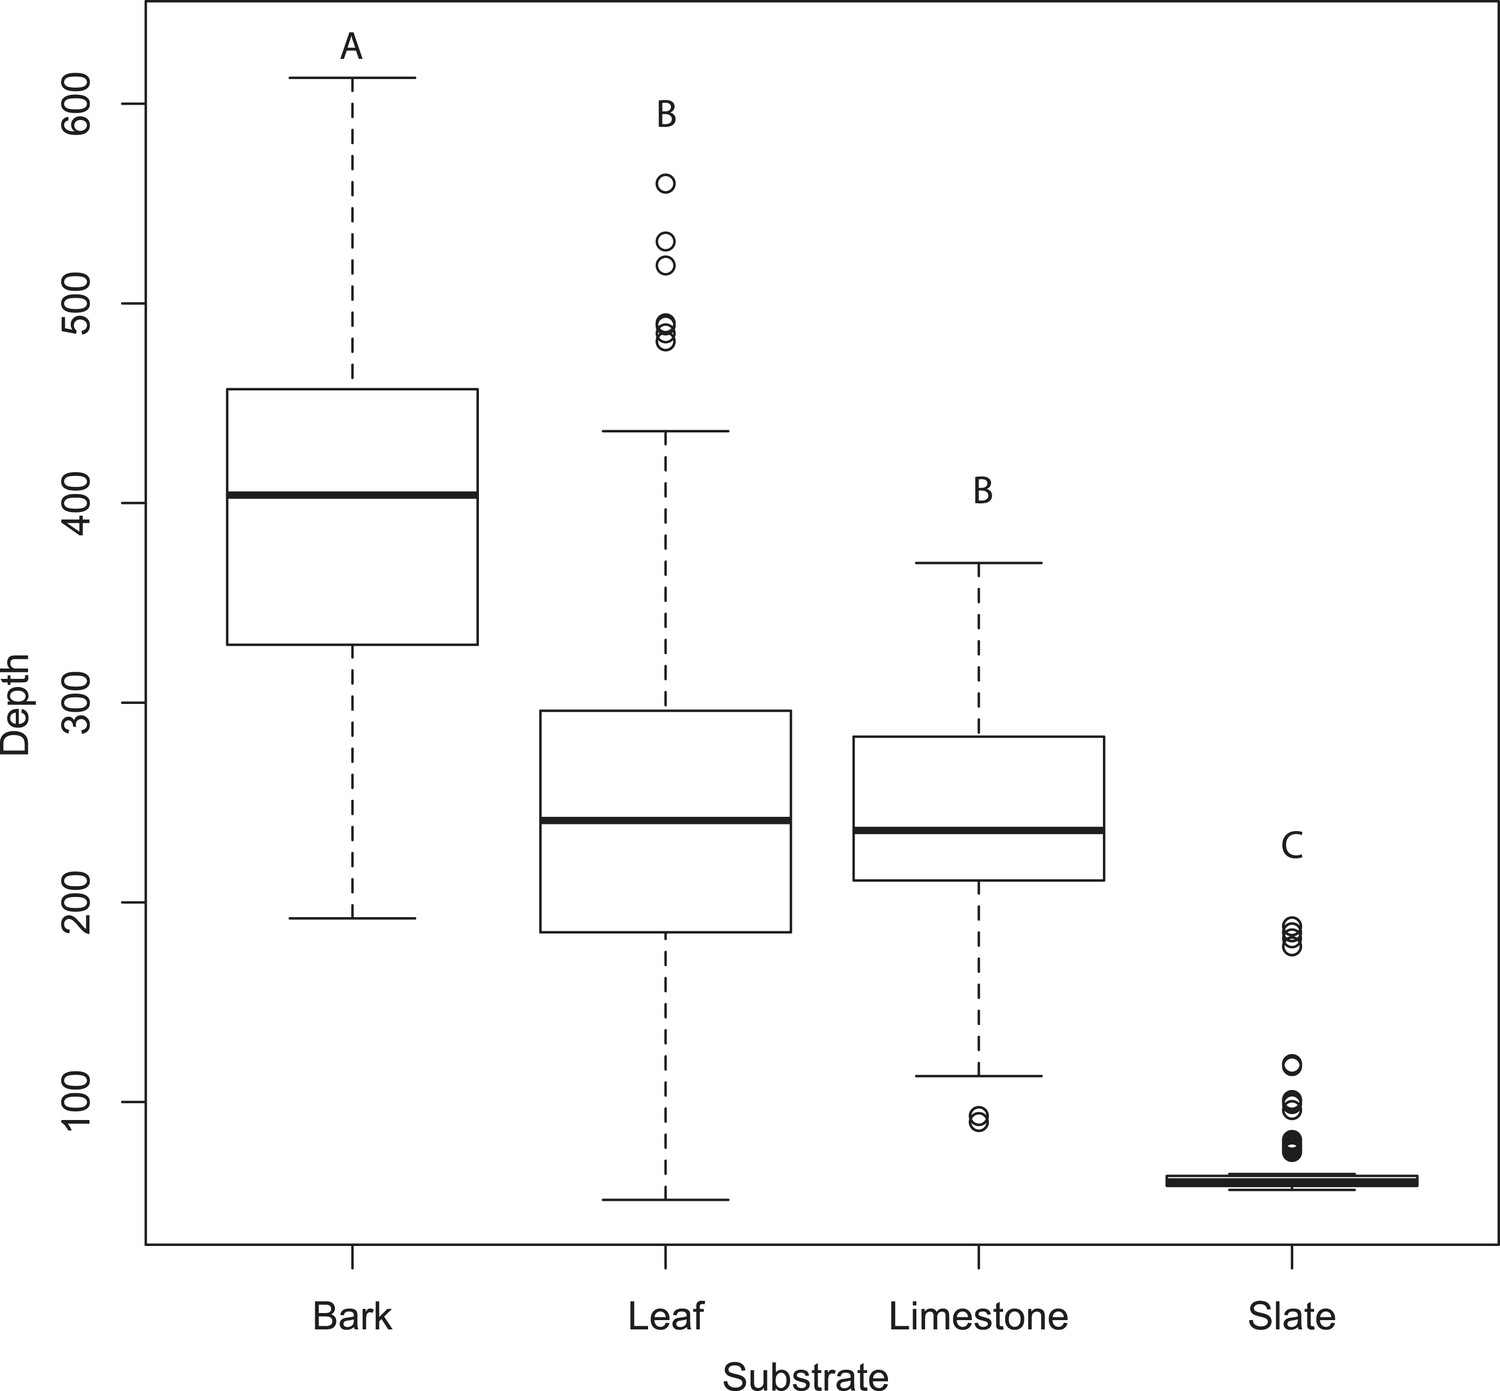
Tomographies indicate that substrate predicts mean depth profile with no moth present.
Slate presents the most acoustically ‘mirror-like’ surface with the most minimal depth profile. Letters indicate significant differences. See also Figure 4—source data 1.
-
Figure 4—source data 1
Depth measures for each substrate.
- https://doi.org/10.7554/eLife.07404.007
Figure 5
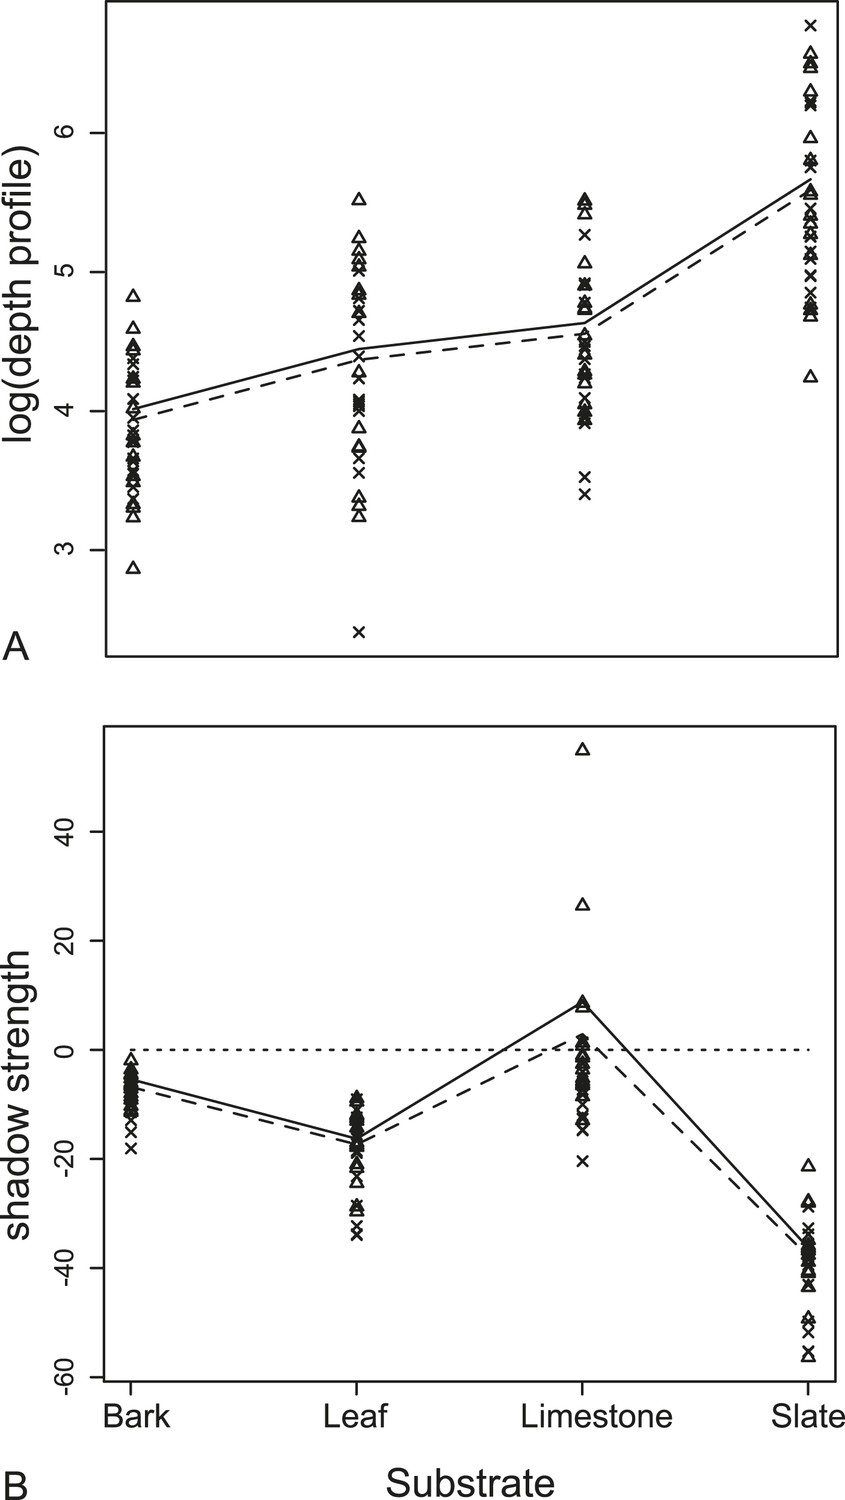
Measurements from acoustic tomographies.
(A) Wing orientation predicted mean depth with the UP position (triangles, solid lines) having a larger depth profile on all substrates than FLAT position (crosses, dashed lines). The biggest effect was of resting substrate with the smooth surface, slate, causing the largest depth profile for each moth. (B) There was a significant interaction between the orientation of the wings and the substrate on the measures of shadow strength (missing background). The largest effect of shadow strength was observed on smooth surfaces (leaf and slate). More negative values indicate more obvious missing substrate with zero being no change from substrate alone. See also Figure 5—source data 1.
-
Figure 5—source data 1
Shadow and depth measurements.
- https://doi.org/10.7554/eLife.07404.009
Figure 6 with 5 supplements
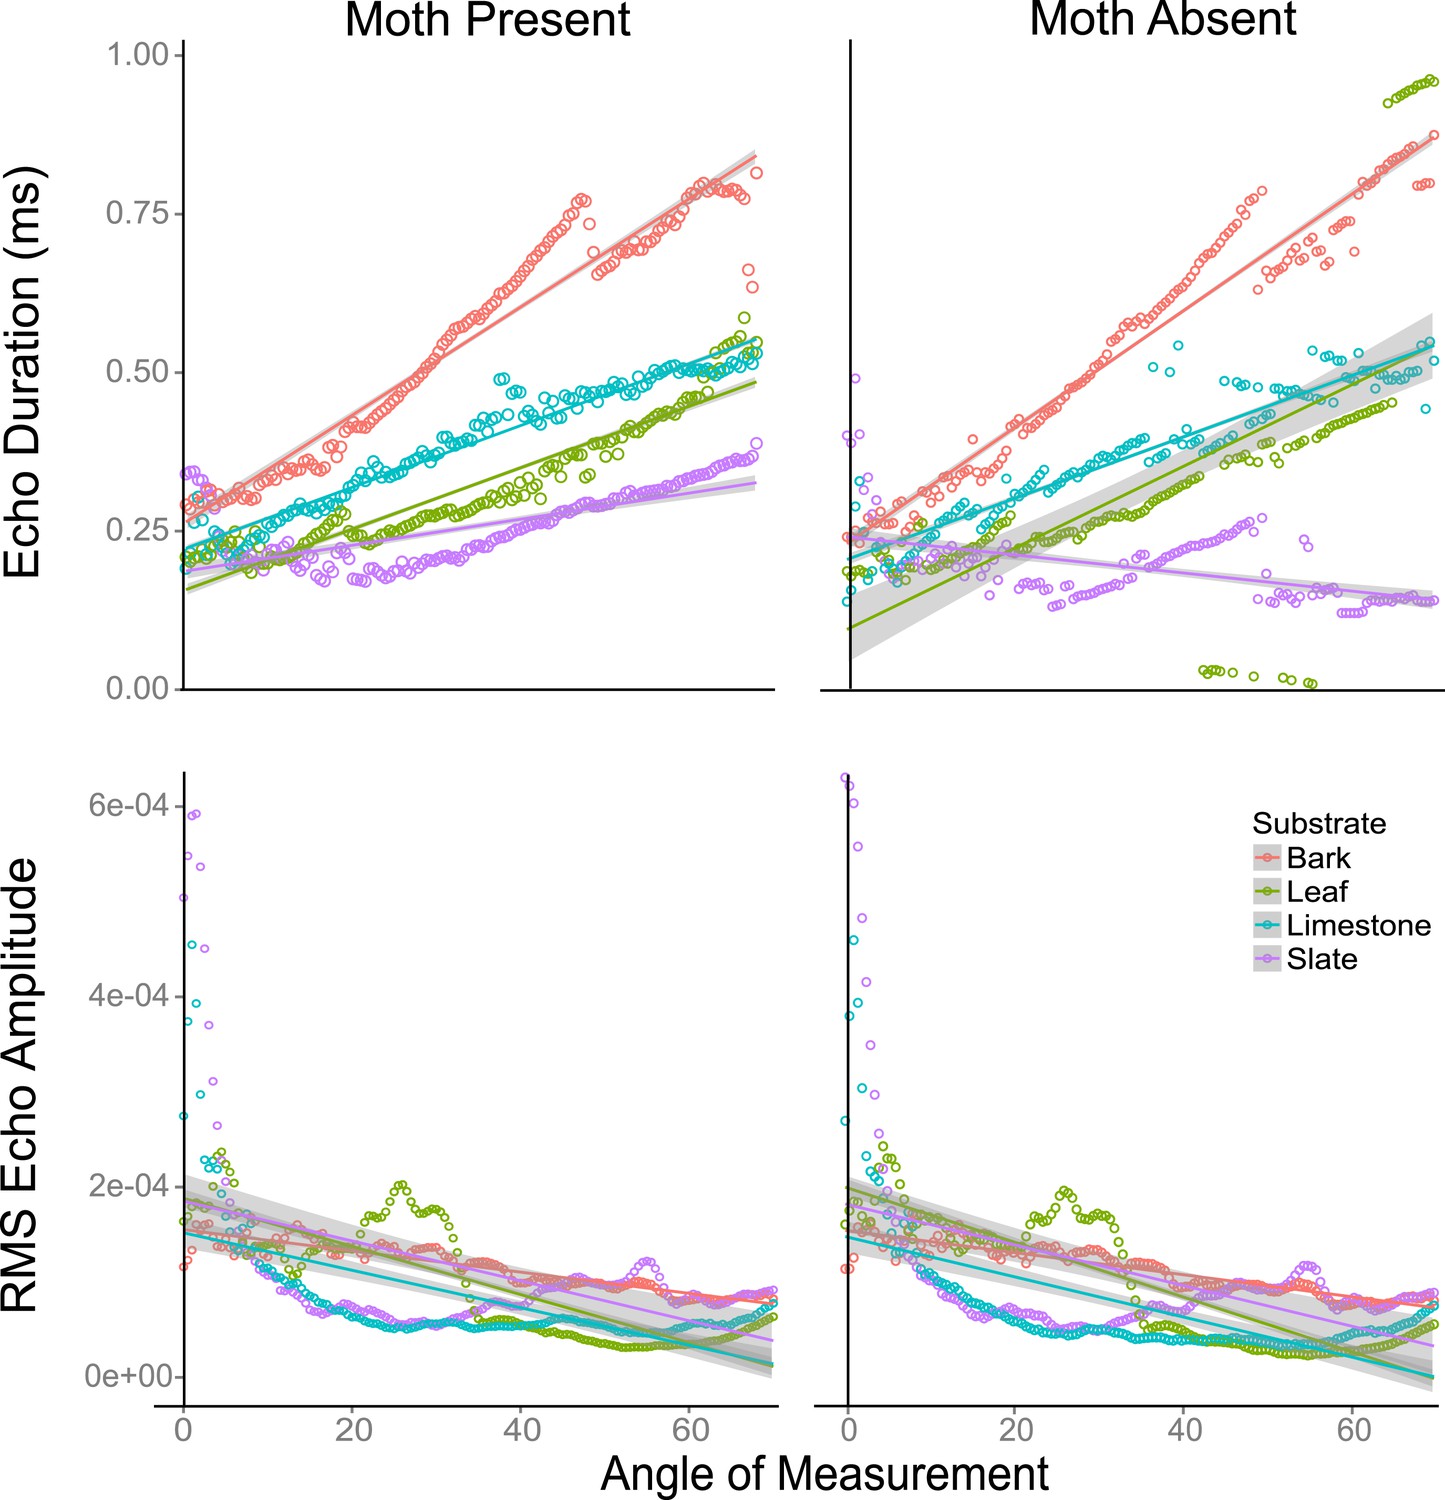
Echo duration and RMS echo amplitude log transformed as a function of angles 0–70° relative to the substrate surface for four substrates (slate, leaf, limestone, and bark) with moths present and absent.
On all substrates (except leaf without a moth), echo duration decreased towards an angle of incidence that is perpendicular to the substrate surface, with duration higher on substrates that are rougher (bark). Relative RMS echo amplitude increased towards angles perpendicular to the substrate. Smoother, that is, more mirror-like surfaces showed the greatest increase in RMS amplitude for frontal directions. See also Figure 6—figure supplements 1–5 and Figure 6—source data 1.
-
Figure 6—source data 1
RMS and Duration measurements.
- https://doi.org/10.7554/eLife.07404.011
-
Figure 6—source data 2
Data associated with Figure 6—figure supplements 1,4 and 5.
- https://doi.org/10.7554/eLife.07404.012
-
Figure 6—source data 3
Data associated with Figure 6—figure supplement 2.
- https://doi.org/10.7554/eLife.07404.013
-
Figure 6—source data 4
Data associated with Figure 6—figure supplement 3.
- https://doi.org/10.7554/eLife.07404.014
Figure 6—figure supplement 1
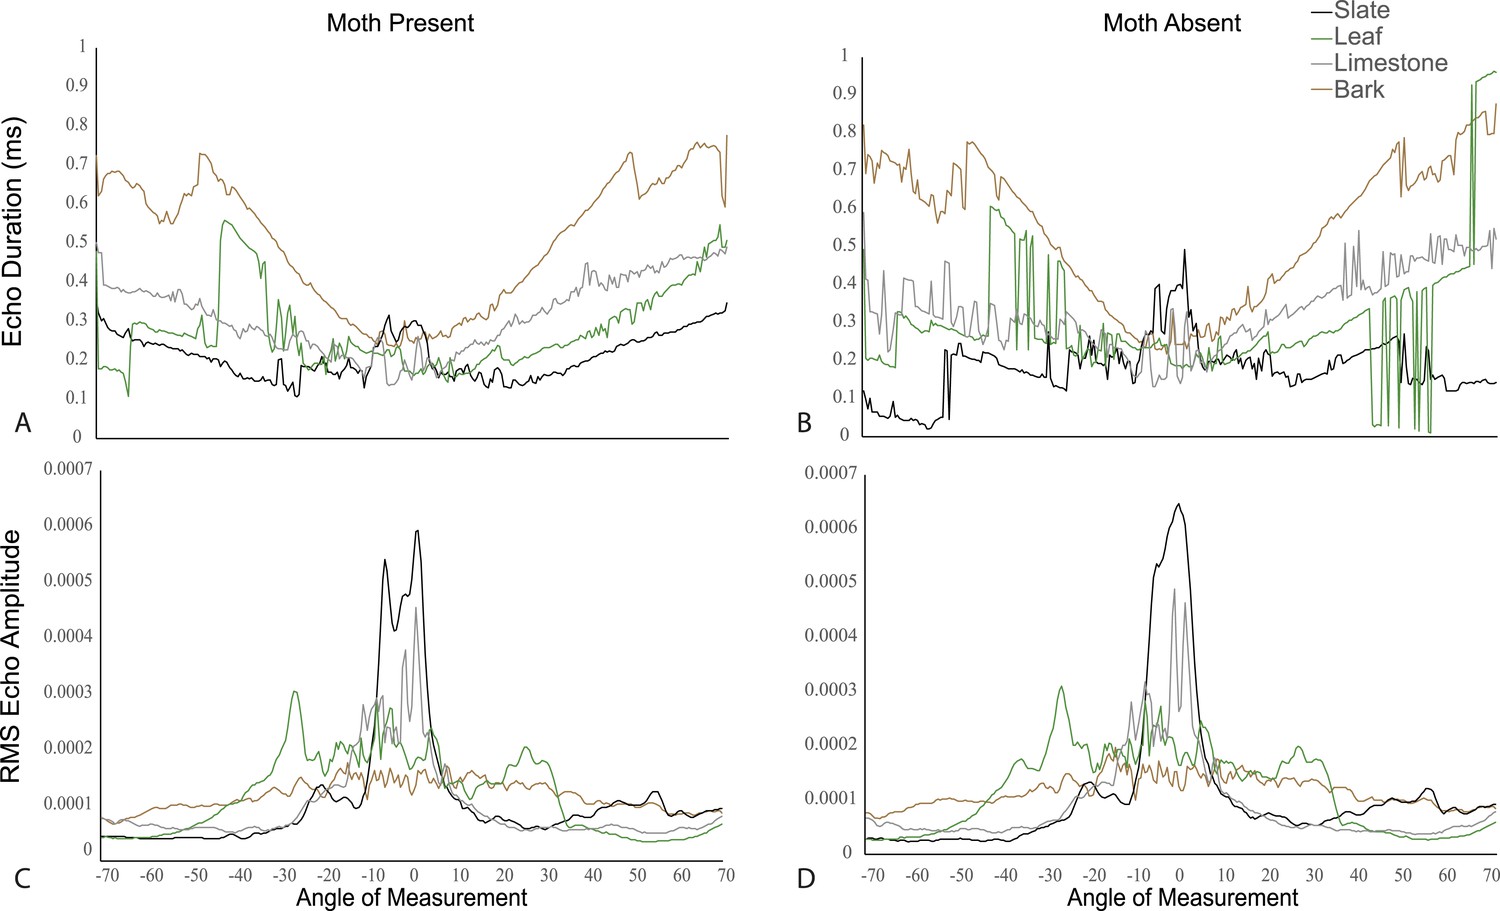
Echo duration (panels A and B) and RMS echo amplitude (panels C and D) as a function of angle relative to the substrate surface for four substrates (slate, leaf, limestone, and bark).
Panels A and C depict mean values of substrate echoes with moths present, and panels B and D show mean values without moths present. On all substrates, echo duration decreases towards an angle of incidence that is perpendicular to the substrate surface, with duration higher on substrates that are rougher (bark). Relative echo intensity (RMS) echo amplitude increases towards angles perpendicular to the substrate. Smoother, that is, more mirror-like surfaces show the greatest increase in RMS amplitude for frontal directions. See also Figure 6—source data 2.
Figure 6—figure supplement 2
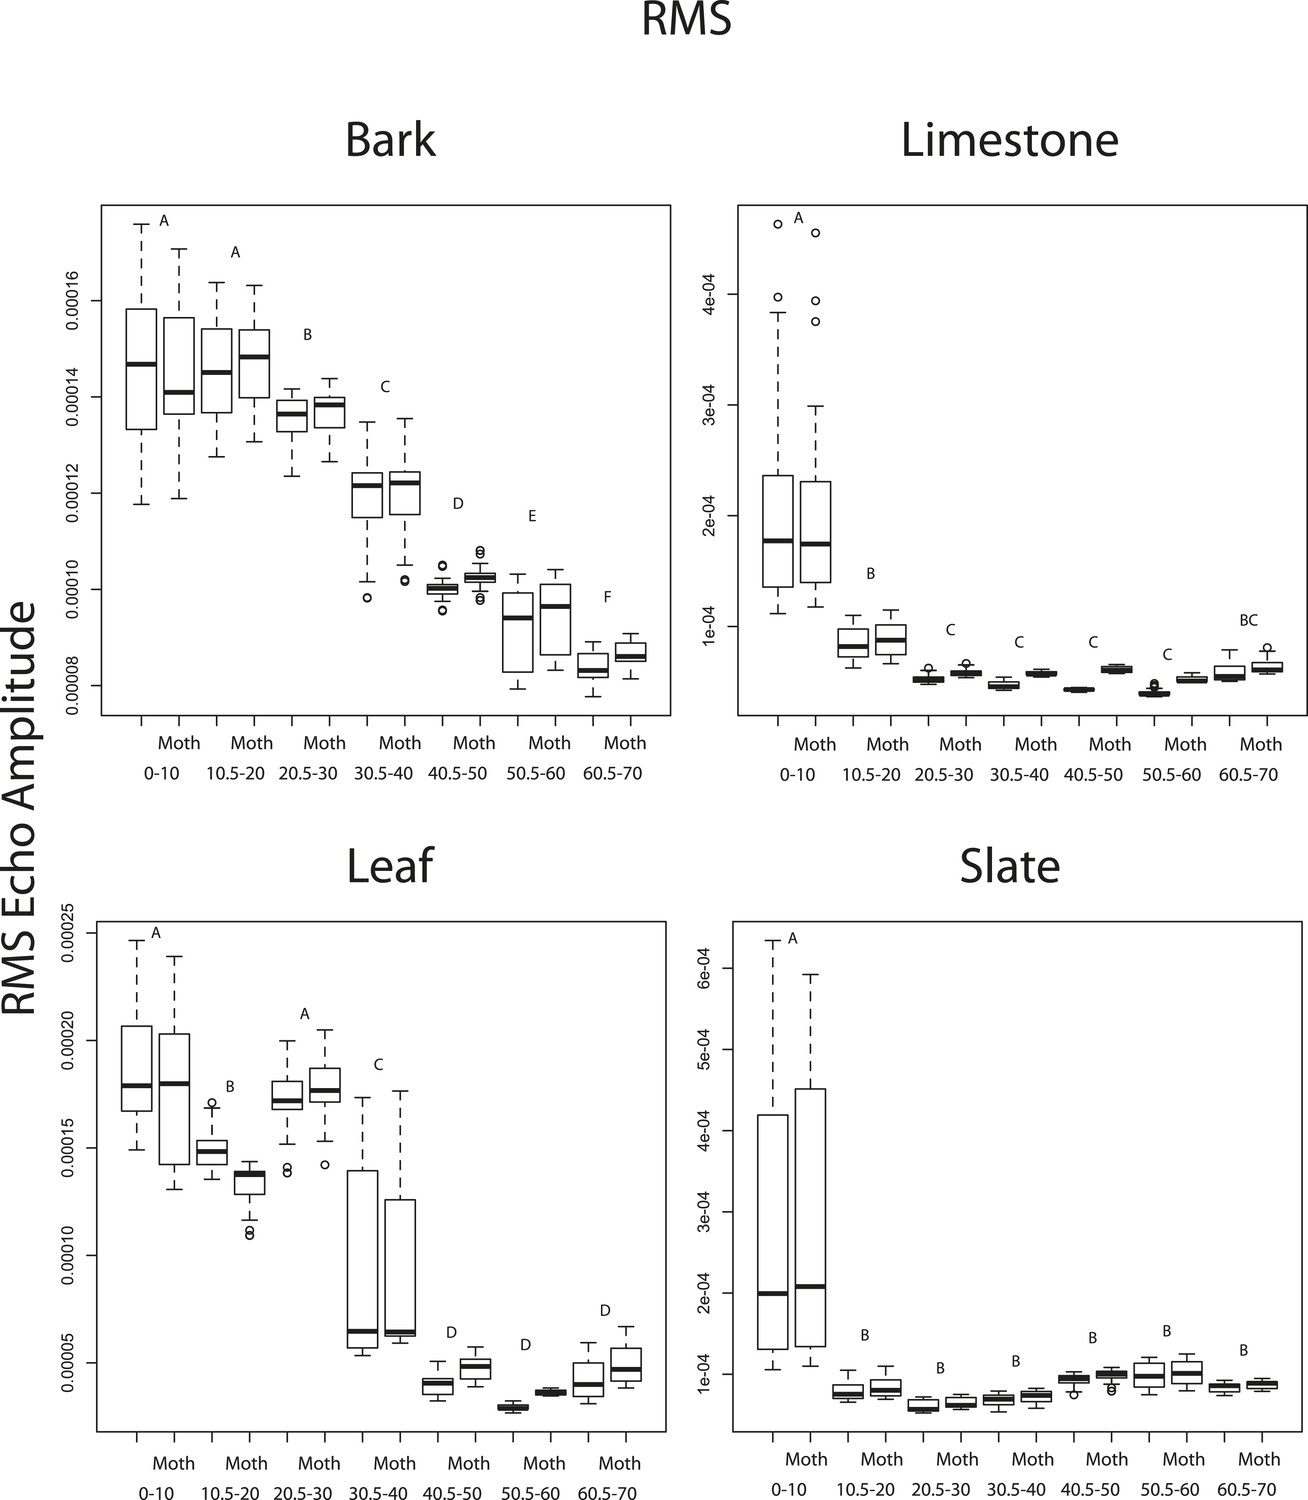
RMS echo amplitude as a function of 10° angle increments from 1 to 70° to the substrate surface for four substrates (bark, limestone, leaf, slate).
Paired boxplots show mean values without and with moths (Moth) present. There were no significant differences between pairs. Letters indicate significant values between angle increments. See also Figure 6—source data 3.
Figure 6—figure supplement 3
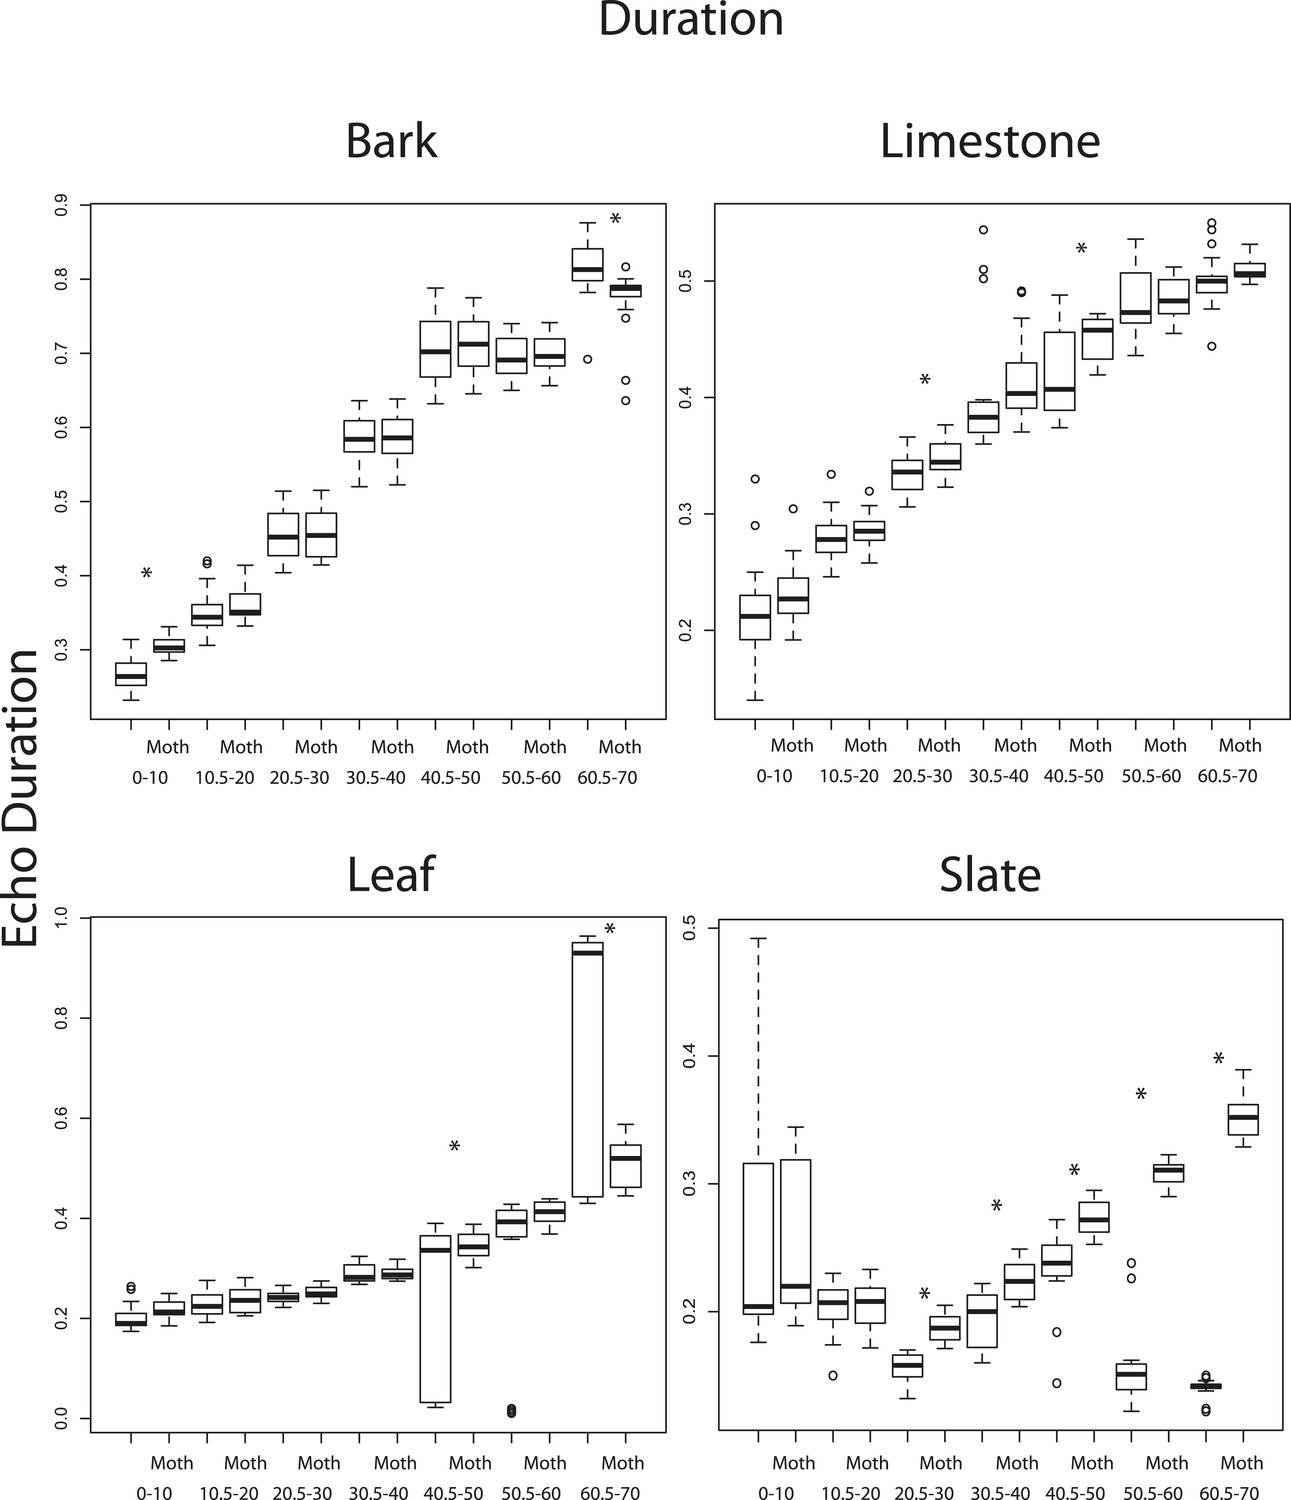
Duration as a function of 10° angle increments from 1 to 70° to the substrate surface for four substrates (bark, limestone, leaf, slate).
Paired boxplots show mean values without and with moths (Moth) present. Significant differences between duration pairs are indicated with an asterisk. See also Figure 6—source data 4.
Figure 6—figure supplement 4
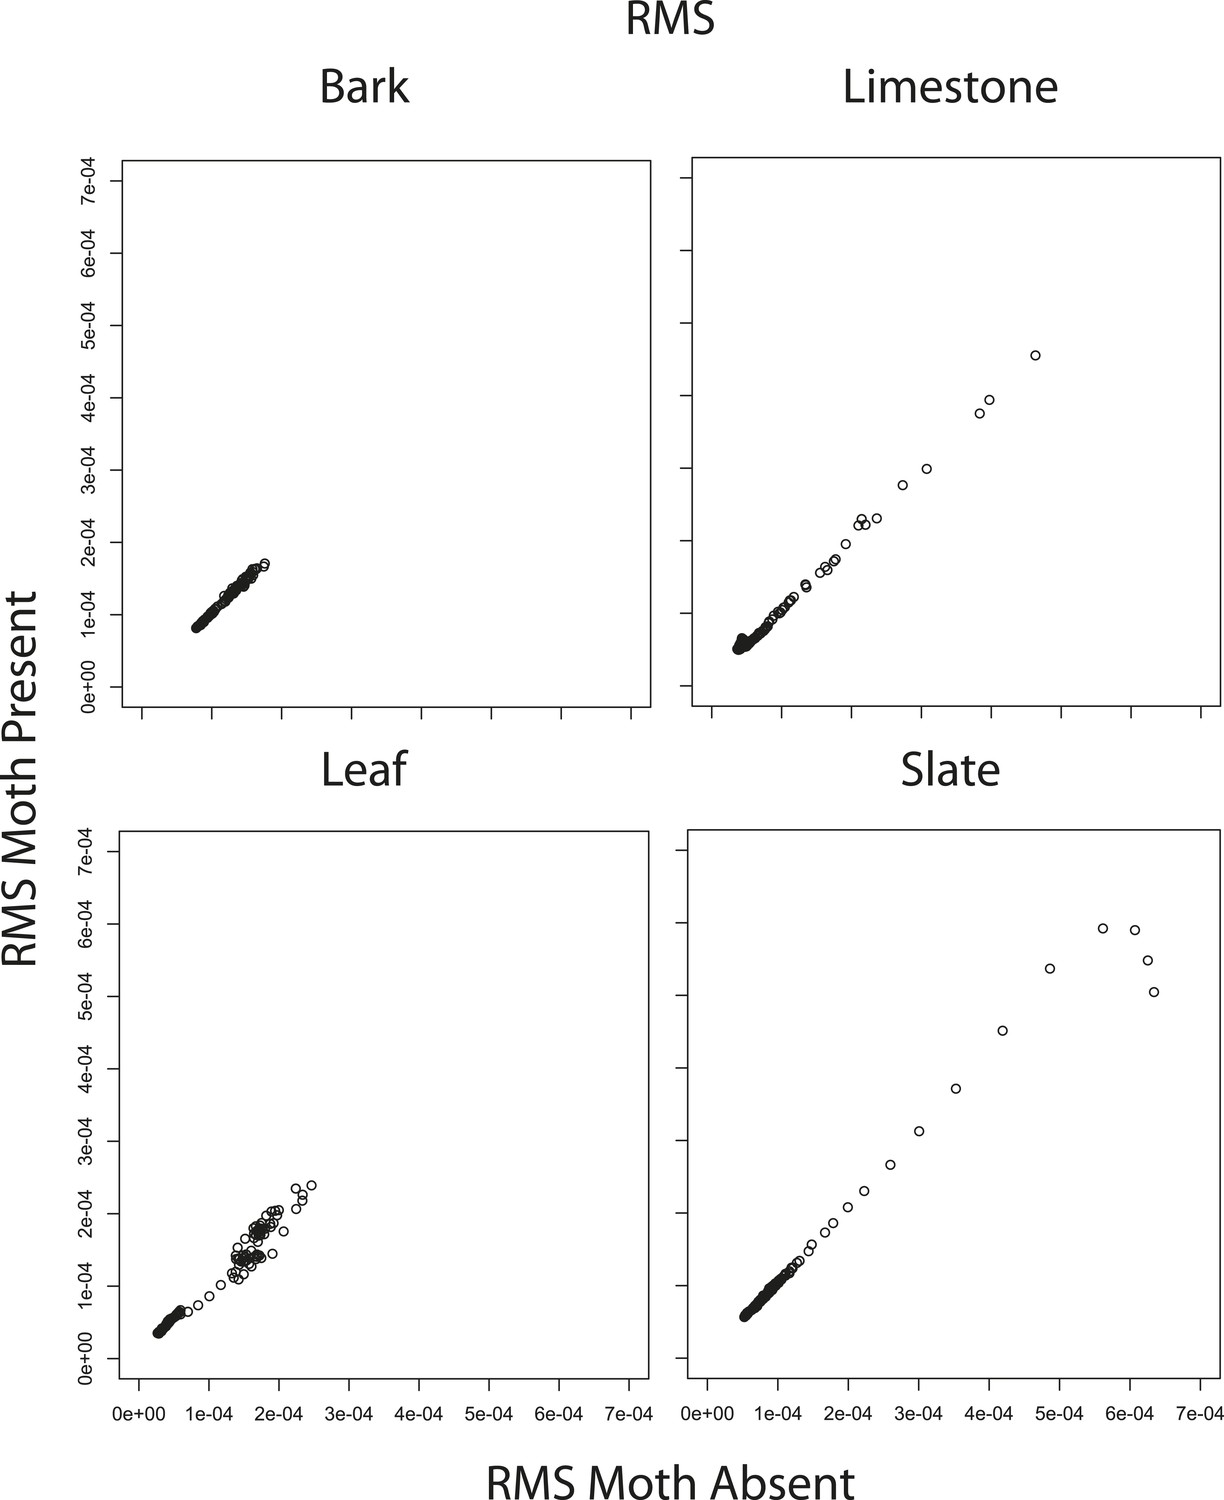
Correlations between mean RMS echo amplitude from 1 to 70° when moths were present vs when moths were absent.
RMS comparisons are significant (bark R = 1.0 p < 0.001, limestone R = 1.0, p < 0.001, leaf R = 0.98, p < 0.001, slate R = 0.99, p < 0.001). See also Figure 6—source data 1.
Figure 6—figure supplement 5
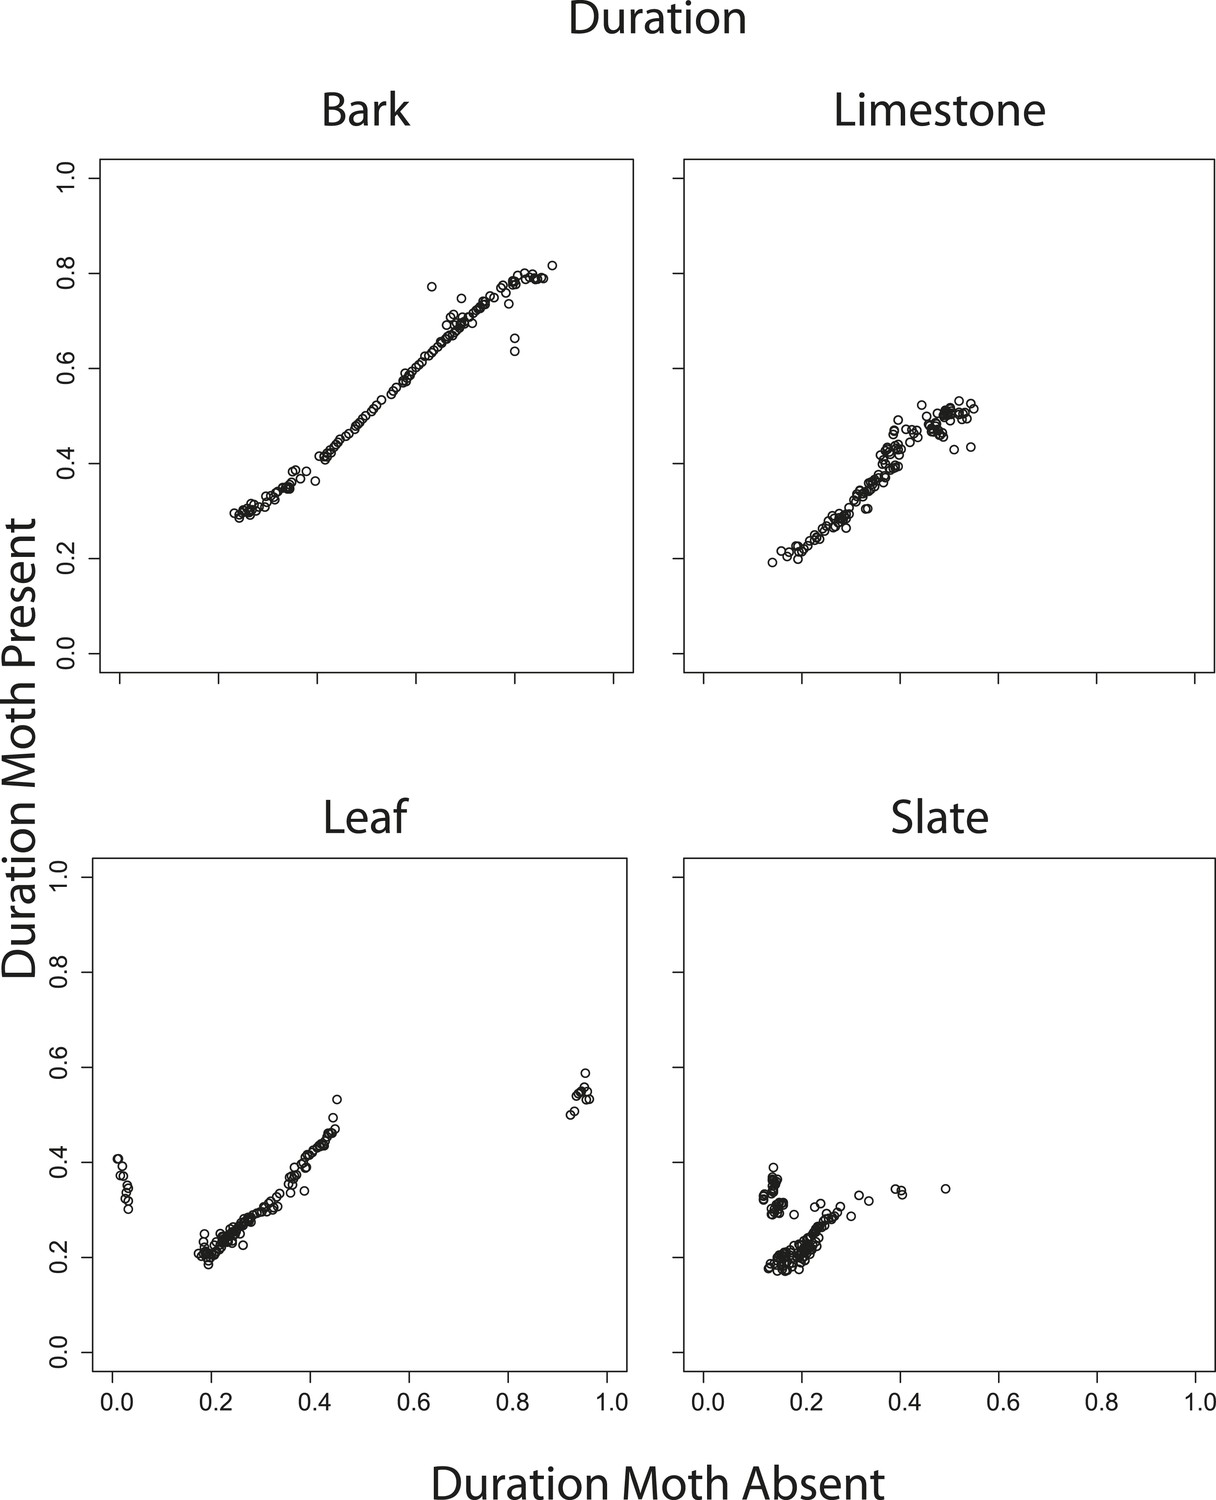
Correlations between mean duration from 1 to 70° when moths were present vs when moths were absent.
Duration comparisons are significant except for slate (bark R = 0.99 p < 0.001, limestone R = 0.96, p < 0.001, leaf R = 0.76, p < 0.001, slate R = 0.06, p = 0.50). See also Figure 6—source data 1.
Additional files
-
Supplementary file 1
Additional statistical details referring to all tests.
- https://doi.org/10.7554/eLife.07404.020
Download links
A two-part list of links to download the article, or parts of the article, in various formats.
Downloads (link to download the article as PDF)
Open citations (links to open the citations from this article in various online reference manager services)
Cite this article (links to download the citations from this article in formats compatible with various reference manager tools)
Acoustic shadows help gleaning bats find prey, but may be defeated by prey acoustic camouflage on rough surfaces
eLife 4:e07404.
https://doi.org/10.7554/eLife.07404


