Neural population dynamics in human motor cortex during movements in people with ALS
- Stanford University, United States
- Brown University, United States
- Center for Neurorestoration and Neurotechnology, Rehabilitation R and D Service, Department of VA Medical Center, United States
- Massachusetts General Hospital, United States
- Harvard Medical School, United States
- Neurosciences Program, United States
Figures
Figure 1

Neural population responses show rotational activity during movement epochs.
(A) Projections of the neural population response onto the first jPCA plane for a monkey during an arm-reaching task (monkey N, 108 conditions; adapted from Churchland et al., 2012). Each trace plots the first 200 ms of activity during the movement epoch for a given condition. Traces are colored based on the preparatory state projection onto jPC1. a.u., arbitrary units. (B) Projections for participant T6 during an 8-target center-out task controlled by index finger movements on a computer touchpad. Each trace plots the 250 ms of activity during the movement epoch (‘Materials and methods’) for a given condition. (C) Same as (B), for participant T7. Video 1 shows the evolution of the neural state over time for each participant.
Figure 2 with 2 supplements
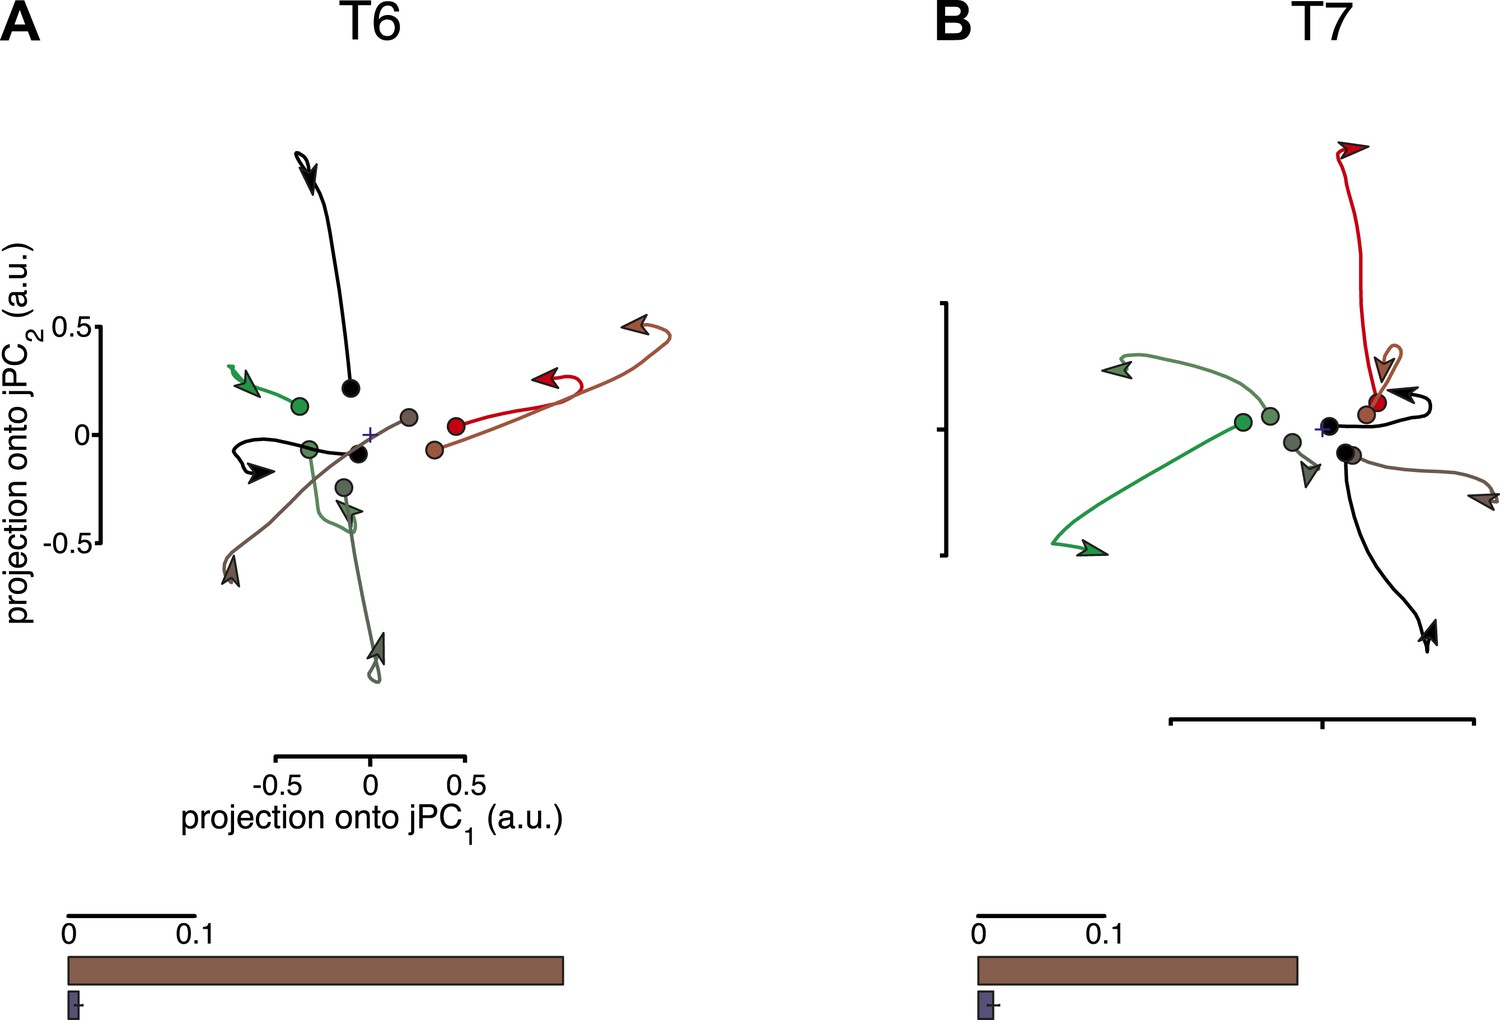
Rotational dynamics are not a by-product of the jPCA analysis method.
For each data set, neural responses were shuffled in a manner that preserved the complexity of individual response patterns on each electrode, but disrupted the structure of the data across electrodes. For each channel, the pattern of activity during the movement epoch was inverted for half the conditions (chosen at random). The inversion was performed around the initial time point, so that continuity with pre-movement activity was preserved. Performing jPCA on the shuffled responses did not reveal consistent rotational structure. (A, top) Projection of the population responses onto the first jPCA plane for a single shuffled trial (participant T6). (bottom) Fraction of variance of the change in neural state (6-D) explained by rotational activity for the original data set (brown) vs the shuffled data sets (blue). Error bar represents the standard deviation across 300 shuffle trials. (B) Same as (A), for participant T7. Two additional shuffle control analyses are presented in Figure 2—figure supplement 1 and Figure 2—figure supplement 2.
Figure 2—figure supplement 1

Results of the second shuffle control analysis.
This shuffle control was similar to the first, but the patterns of activity during the movement epoch were inverted for all conditions. (A) Projections of the neural population state for each data set after shuffling are shown. (B) The fraction of variance captured by the rotational model before and after shuffling. This manipulation would not be expected to remove all rotational structure, as the structure should merely be sign-inverted. However, this manipulation should remove any consistent relationship between the pre-movement activity and the phase of subsequent oscillations. Thus, this control is expected to disrupt the relationship between the rotational phase and its initial state.
Figure 2—figure supplement 2
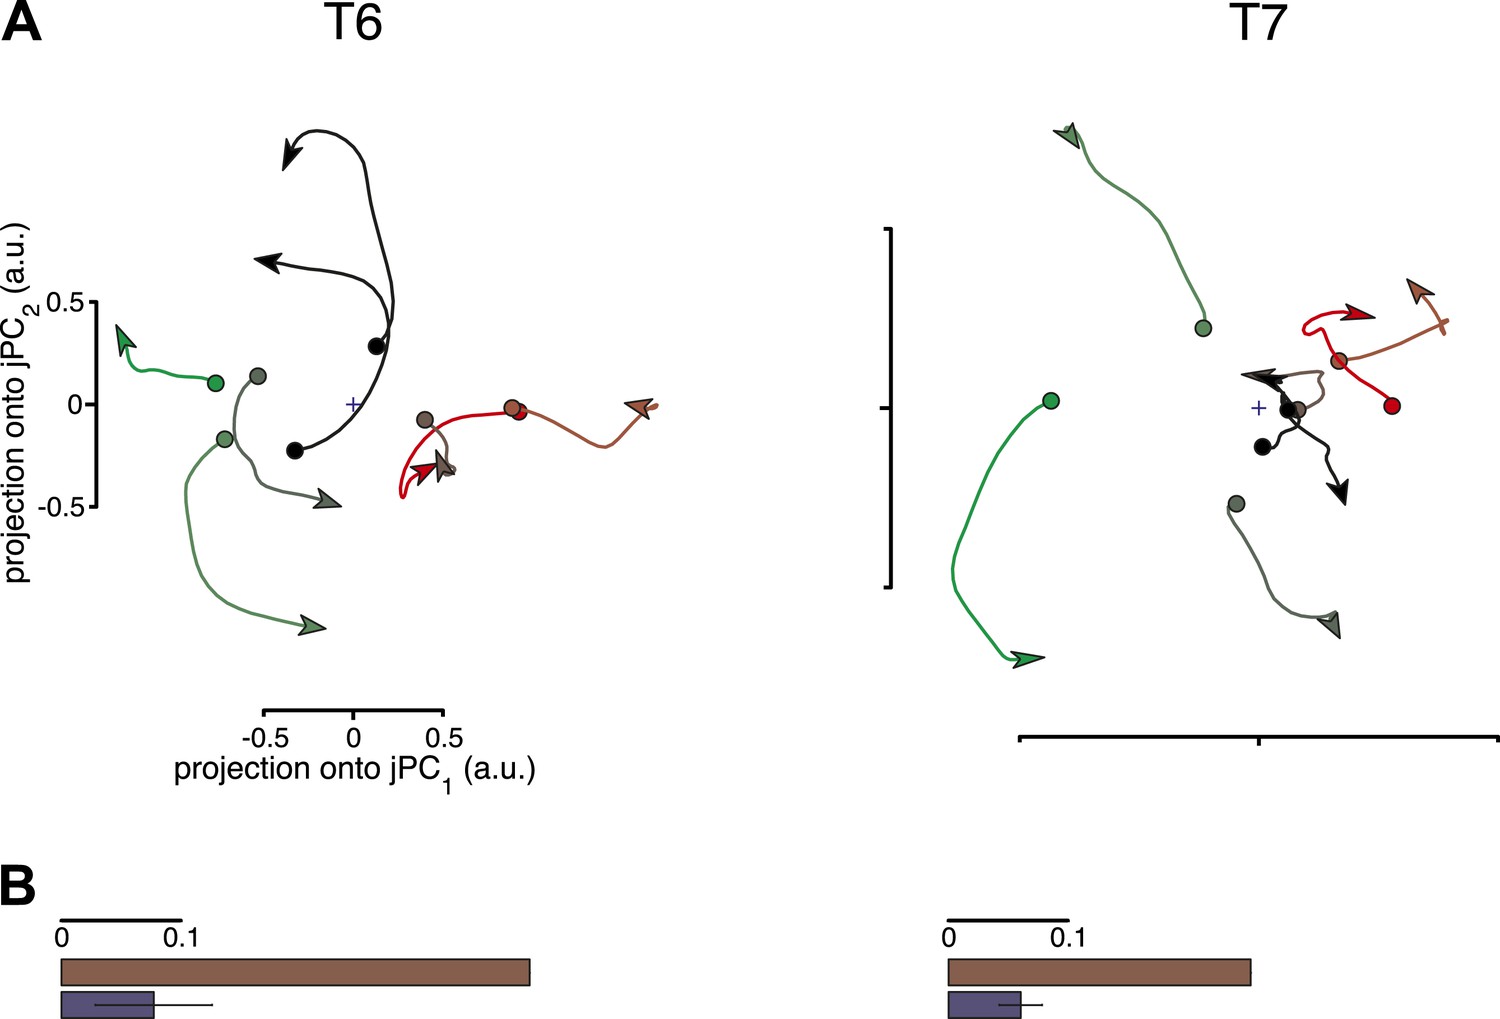
Results of the third shuffle control analysis.
In this shuffle control, activity during the movement epoch from one condition was randomly reassigned onto the pre-movement activity from another. The firing rate at the beginning of the movement epoch was appended to the firing rate at the end of the pre-movement period, to preserve continuity. For a given shuffle trial, the same reassignment was performed for all neurons. (A) Projections of the neural population state for each data set after a single shuffle trial. (B) The fraction of variance captured by the rotational model for the original data sets and 300 shuffle trials is shown (each shuffle trial tests a different random set of pairings of pre-movement and movement epoch activity). Error bars represent the standard deviation across shuffle trials. As with the second shuffle control, this manipulation is not expected to remove all rotational structure. While the relationship between rotational phase and the initial state is disrupted (as each condition's movement epoch activity is assigned to another condition's pre-movement activity), there is some likelihood that a given condition will be assigned an initial state similar to its own, allowing some rotational structure to be preserved by this manipulation.
Figure 3
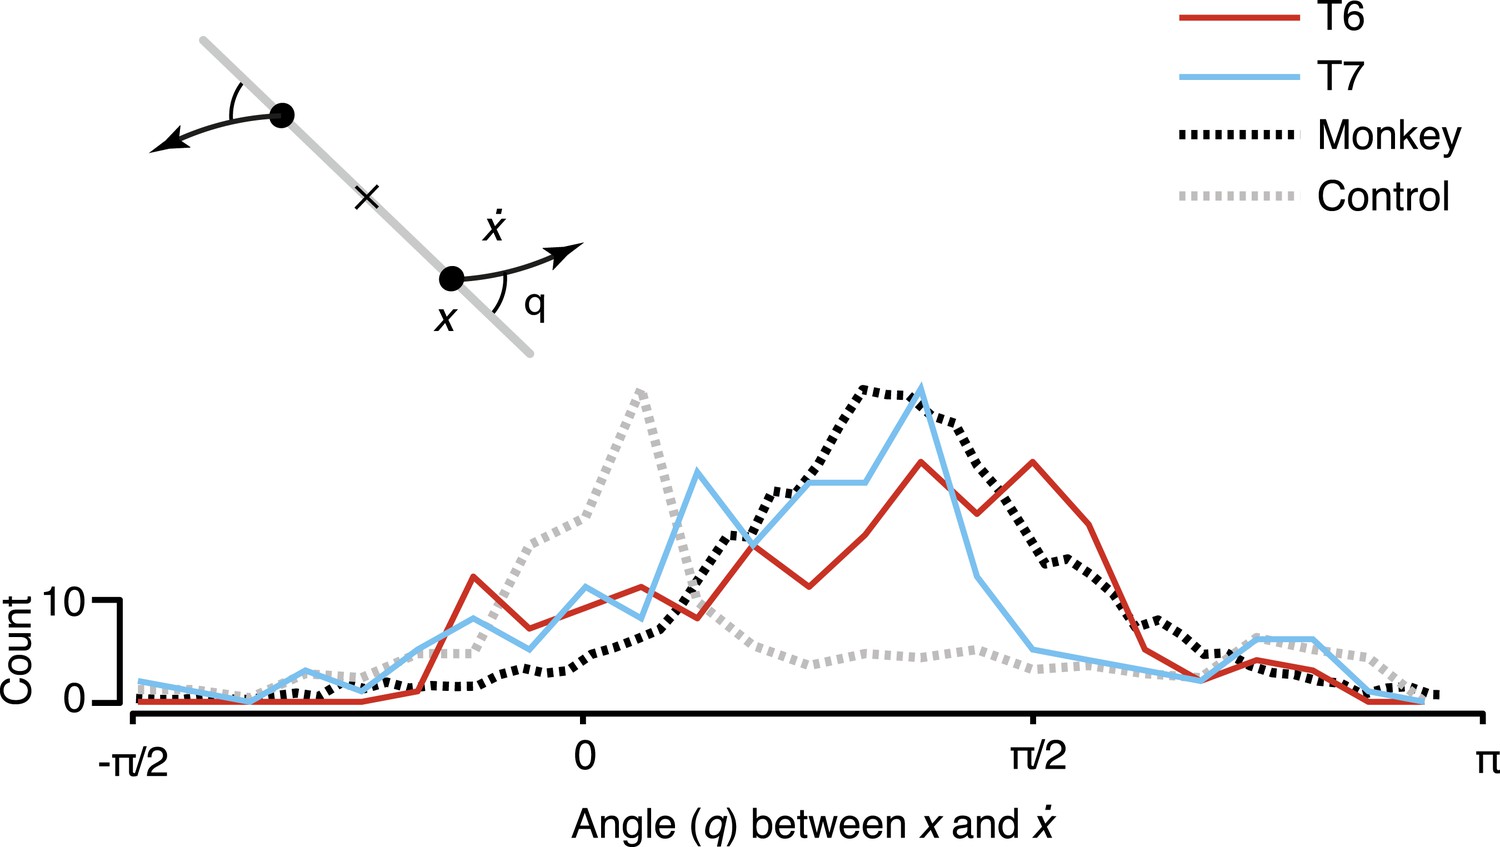
Consistency of the rotational dynamics across conditions.
Traces represent histograms of the angle, q, between the neural state, x, and its derivative, , for each time step. The angle was measured as illustrated schematically (inset) after projecting the data into the first jPCA plane. Purely rotatory activity results in angles near pi/2, while pure scaling/expansion results in angles near 0 or pi. Y-axis denotes scale for participant data (colored traces). For comparison, histograms for the example shuffle control data (Figure 2) and monkey composite data are shown in gray and black, respectively. These traces are normalized to match the participant data range (monkey data reproduced from Churchland et al., 2012).
Videos
Video 1
Neural population responses show rotational activity.
Video shows the evolution of the neural state over time in the first jPCA plane for participants T6 and T7. Low-dimensional projections were calculated as in Figure 1. Each colored trace represents one of 8 conditions. All times are relative to target onset (0 ms).
Download links
A two-part list of links to download the article, or parts of the article, in various formats.
Downloads (link to download the article as PDF)
Open citations (links to open the citations from this article in various online reference manager services)
Cite this article (links to download the citations from this article in formats compatible with various reference manager tools)
Neural population dynamics in human motor cortex during movements in people with ALS
eLife 4:e07436.
https://doi.org/10.7554/eLife.07436


