The CUL4-DDB1 ubiquitin ligase complex controls adult and embryonic stem cell differentiation and homeostasis
- New York University School of Medicine, United States
- University of Nebraska Medical Center, United States
- Sanford-Burnham Medical Research Institute, United States
- Howard Hughes Medical Institute, Columbia University, United States
Figures
Figure 1
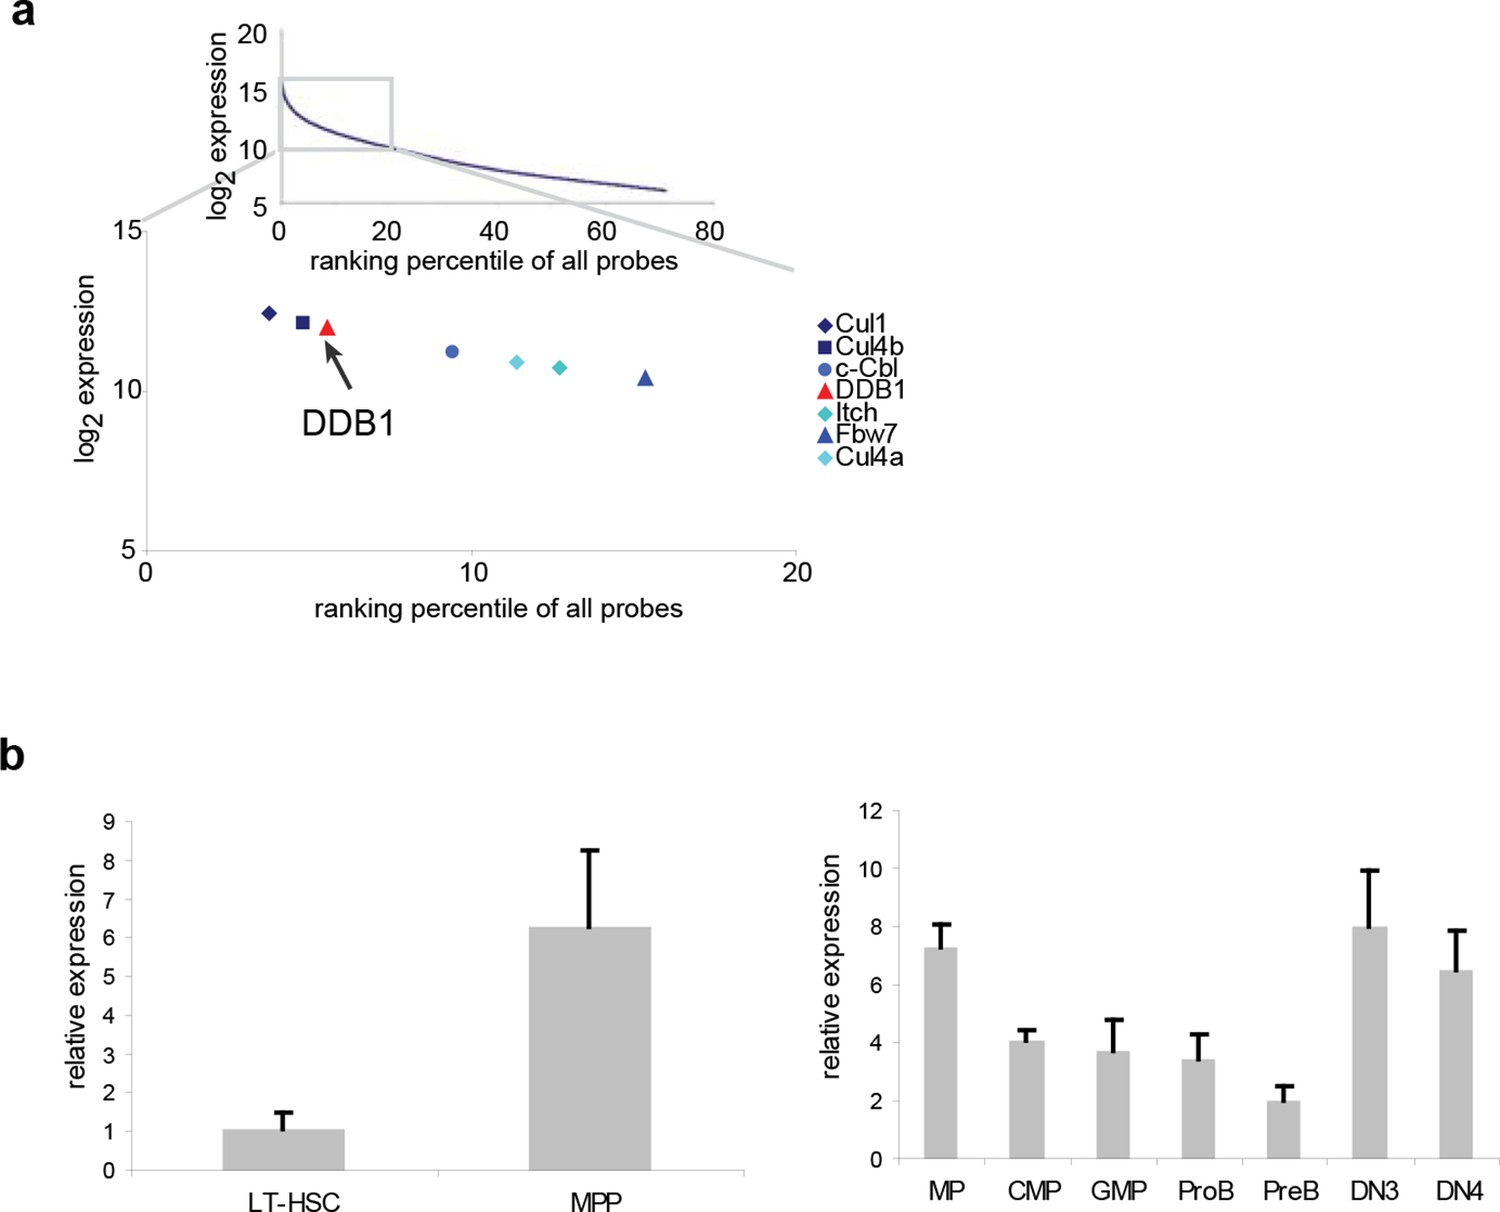
Ddb1 is highly expressed in the hematopoietic system.
(a) Expression ranking of Cul4-Ddb1 components in LSKs compared to all probes available in microarray. Microarray was performed on LSK cells. The expression value of all probes were ranked from high to low. (b) Quantitative PCR of Ddb1 in hematopoietic populations.
Figure 2
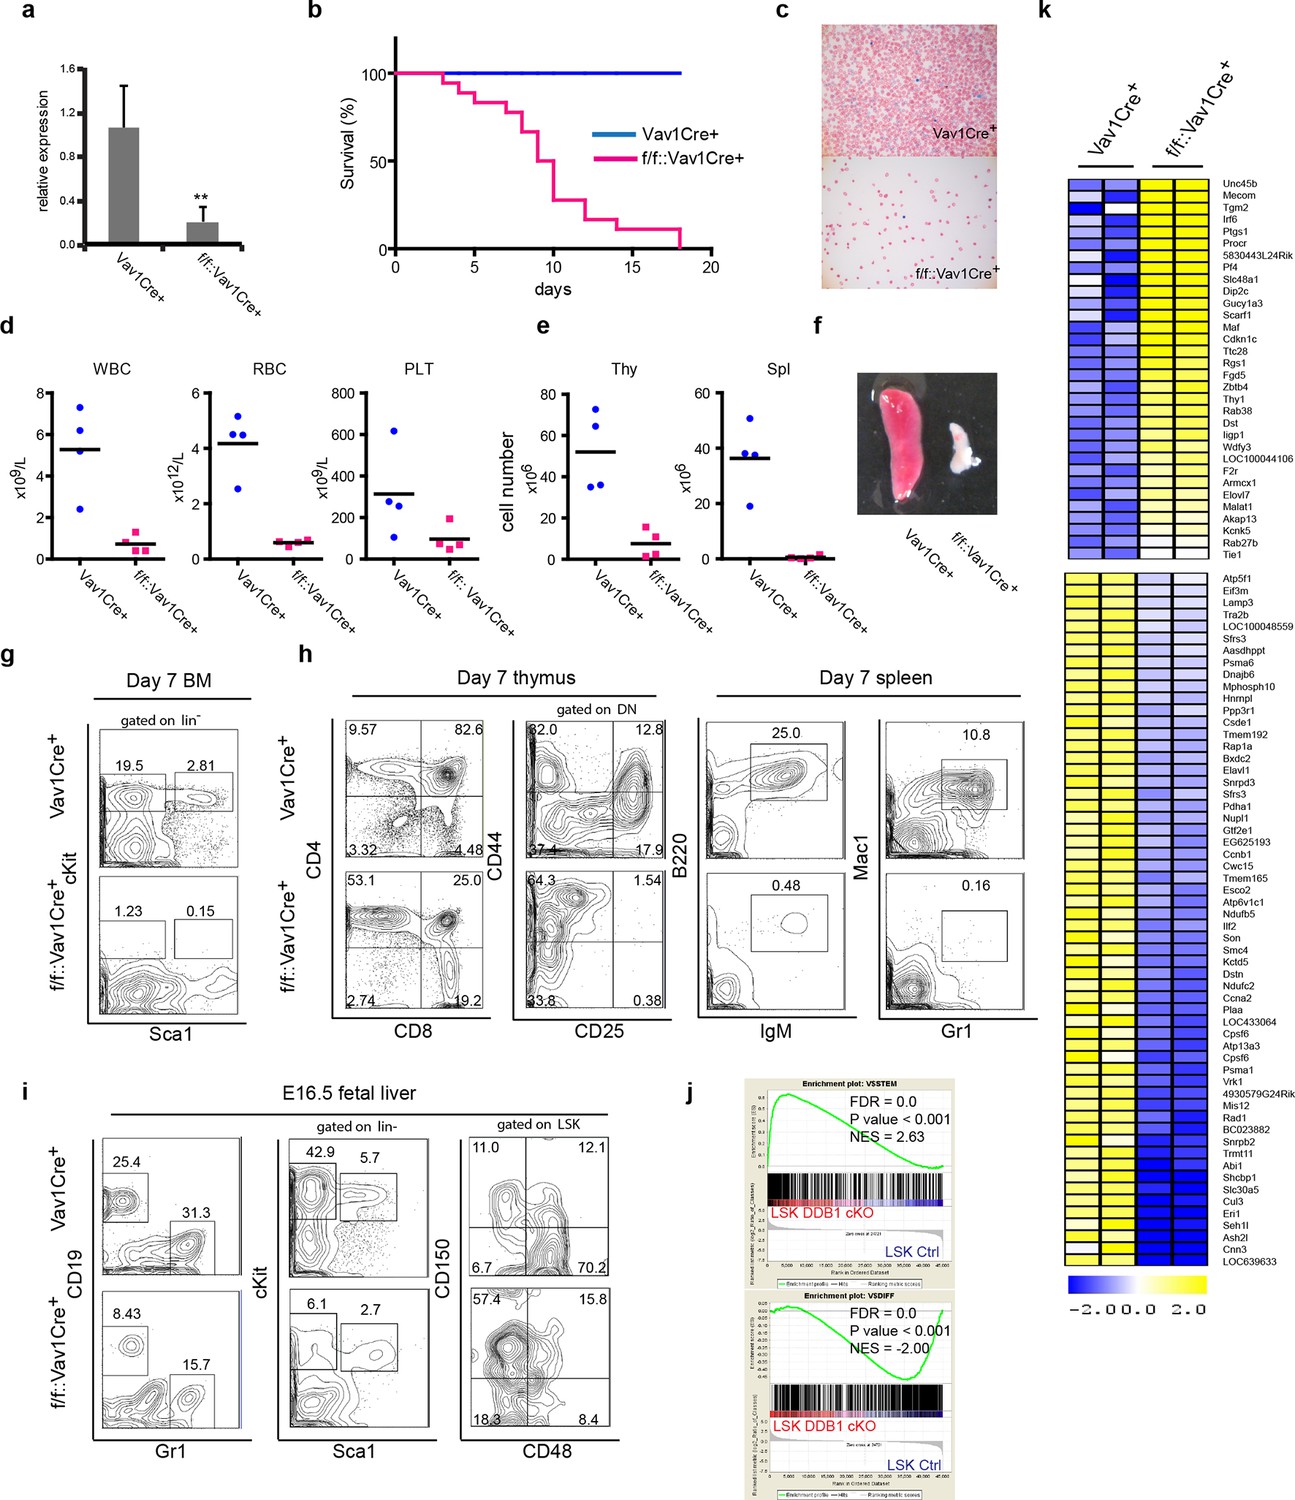
Abrogation of fetal hematopoiesis in Ddb1f/fVav1Cre+ mice.
(a) Quantitative PCR of Ddb1 in control and Ddb1f/f::Vav1Cre+ mice. (b) Survival curves of control and Ddb1f/f::Vav1Cre+ mice (n = 18 per group). (c) Giemsa staining of peripheral blood smears from 7-day old mice. (d) Peripheral blood counts in 7-day old mice (n = 4 per group). WBC: white blood cells (p=0.0054). RBC: red blood cells (p=0.0007). PLT: platelets (p=0.10). Black bar indicates average. (e) Total cell numbers in thymi (p=0.0050) and spleens (p=0.0016) of 7-day old mice (n = 4 per group). Black bar indicates average. (f) Representative pictures of spleens from 7-day old mice. (g) Representative FACS plots of bone marrow of 7-day old mice. (h) Representative FACS plots of thymi and spleens of 7-day old mice. (N=3). (i) Representative FACS plots of fetal livers at embryonic day 16.5. (n=3) (j) Gene set enrichment analysis (GSEA) of gene expression analysis performed on fetal LSKs at embryonic day 16.5. (k) Heatmap of gene expression analysis performed on fetal LSKs at embryonic day 16.5. *p<0.05. **p<0.01. ***p<0.001.
Figure 3
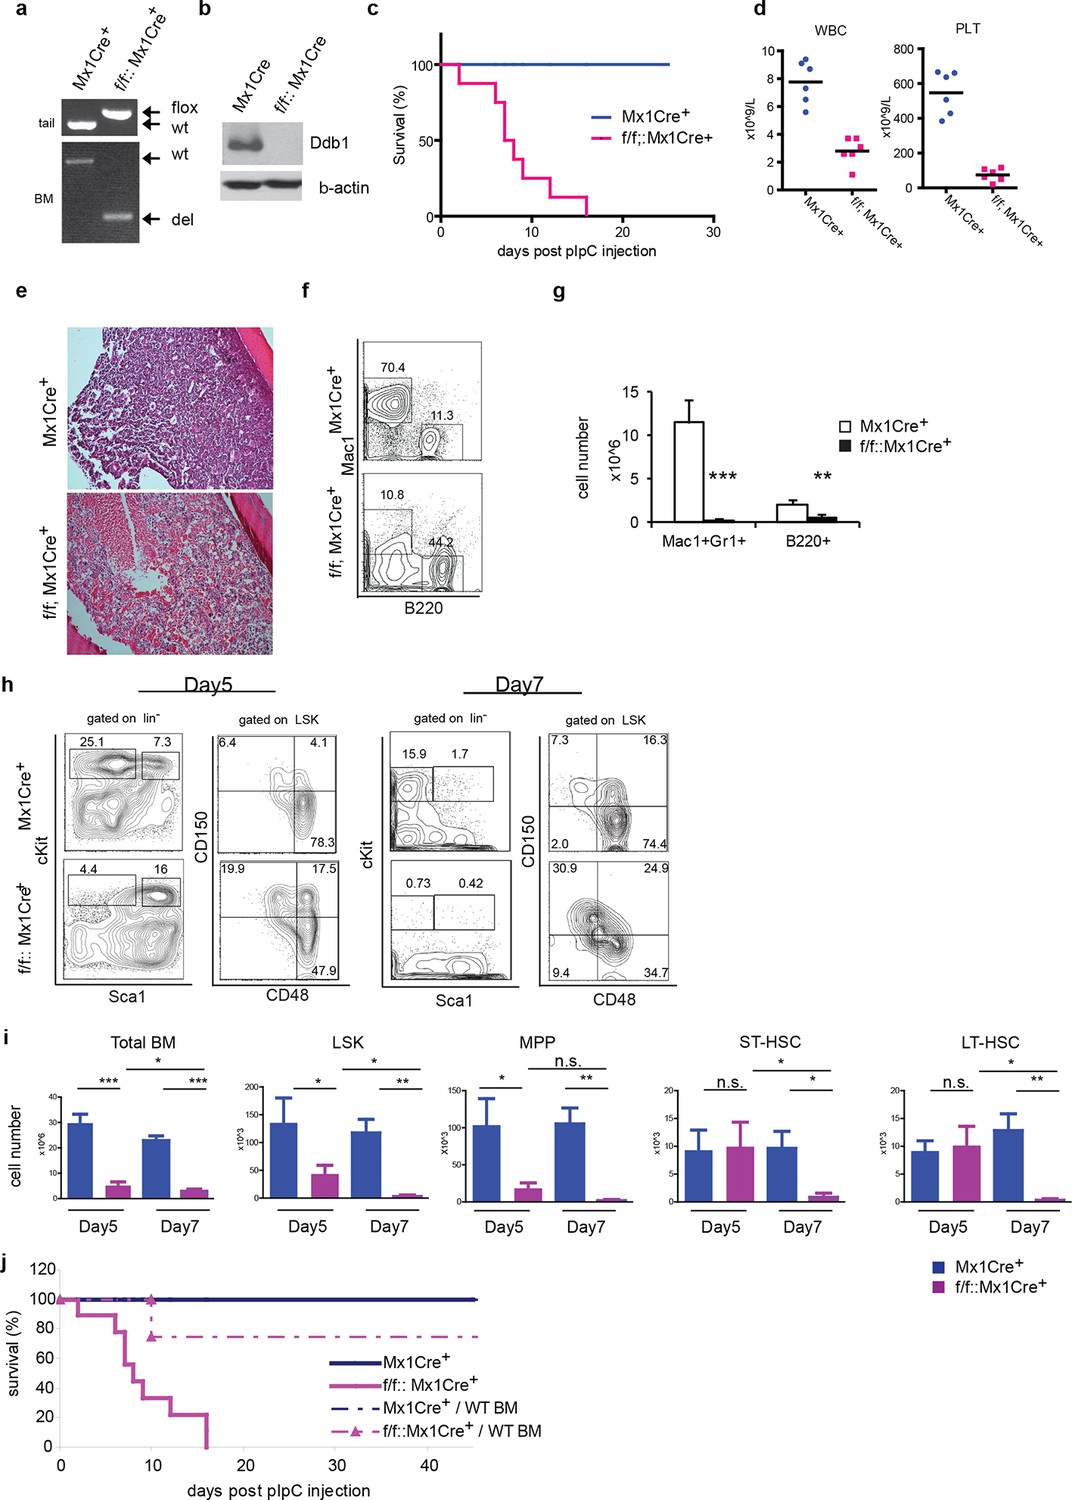
Deletion of Ddb1 in Ddb1f/f::Mx1Cre+ mice leads to bone marrow failure and acute lethality.
(a) PCR on genomic DNA from tail or polyI:C injected bone marrow to detect wild type (wt), “floxed” (flox) and recombined (del) alleles of Ddb1 locus. (b) Western blot of bone marrow cells from polyI:C injected animals. (c) Survival curve of mice after polyI:C injection (n = 8 per group). (d) Peripheral blood counts 7 days after polyI:C injection (n = 6 per group). (WBC and PLT p=<0.0001). Black bar indicates average. (e) H&E staining of tibia sections 7 days after polyI:C injection. (f) Representative FACS plots of bone marrow cells. (g) Cellularity of bone marrow 7 days after poly:C injection. N=5 per group. (h) Representative FACS plots of bone marrow cells after polyI:C injection. (i) Cell numbers of total bone marrow and stem and progenitor cell populations in mice after polyI:C injection (n = 5 per group). *p<0.05. **p<0.01. ***p<0.001. (j) Non-polyI:C injected Ddb1f/f::Mx1Cre+ mice were lethally irradiated and transplanted with wild type bone marrows. Eight weeks after engraftment, DDB1 deletion was induced by polyI:C injection. Survival of these chimera mice (N= 4 per group) was followed and compared to polyI:C injected Ddb1f/f::Mx1Cre+ mice.
Figure 4
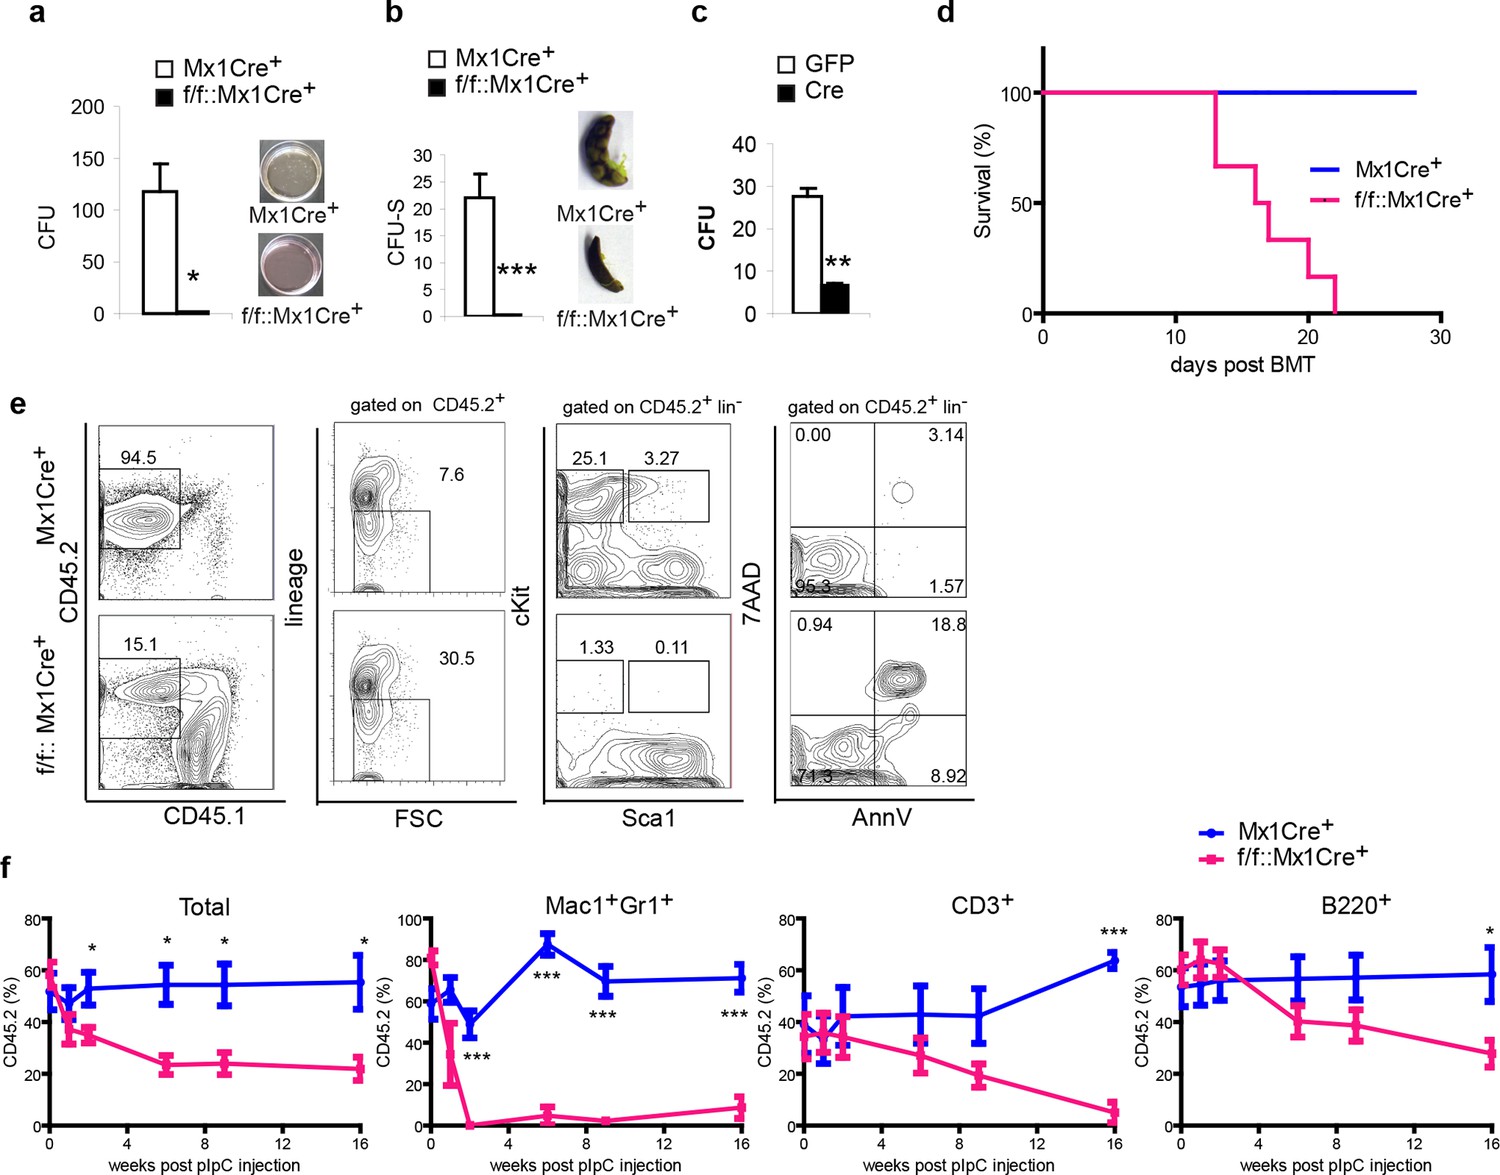
Ddb1 deletion impairs the differentiation of hematopoietic stem and progenitor cells.
(a) Colony numbers and representative images from methylcellulose assay with bone marrow cells from polyI:C injected mice. (b) Colony numbers and representative images from CFU-S assay with bone marrow cells from polyI:C injected mice. (c) Bone marrow progenitor cells of Ddb1f/f::Mx1Cre+ mice were infected with retrovirus expressing either control GFP or Cre recombinase. Colony numbers were scored in methylcellulose assays. (d) Survival curve of recipient mice after bone marrow transplantation (n = 6 per group). Donor cells were from Ddb1f/f::Mx1Cre+ or control mice injected with polyI:C. (e) Representative FACS plots of bone marrow cells in recipient mice 7 days post Ddb1 deletion. Donor cells were from non polyI:C injected mice, and Ddb1 deletion was induced in recipient mice 8 weeks after engraftment. (f) Chimerism of peripheral blood in recipient mice (n=5 per group). Donor cells were a mixture at 50:50 ratios of wild type CD45.1+ cells and Ddb1f/f::Mx1Cre+ CD45.2+ cells (or control CD45.2+ cells). Ddb1 deletion was induced in recipient mice 8 weeks after engraftment. *p<0.05. **p<0.01. ***p<0.001
Figure 5

Ddb1 deletion induces DNA damage and apoptosis in progenitor cells.
(a) TUNEL staining on tibia sections after polyI:C injection. (b) Percentage of AnnexinV+ cells gated on different populations after polyI:C injection. Western blot (c) and qPCR (d) in lineage negative bone marrows after polyI:C injection. (e) Histogram of intracellular γH2Ax staining gated on HSPC sub-populations and lineage positive cells after polyI:C injection. (f) Immunofluoresence staining of γH2Ax and 53BP1 on flow-sorted LSK cells after polyI:C injection. (g) Representative FACS plots of bone marrow cells 5 days post polyI:C injection. (h) Frequency and absolute number of progenitor cells (n = 4 per group). One of 2 independent experiments was shown. *p<0.05. **p<0.01. ***p<0.001. n.s. p>0.05. (i) Survival curves of control, Trp53-/-::Ddb1f/f::MxCre+ mice, and Ddb1f/f::MxCre+ mice (n = 5 per group, one independent experiment). Age matched littermates on a mixed 129xC57BL/6 background were used for g-i.
Figure 6
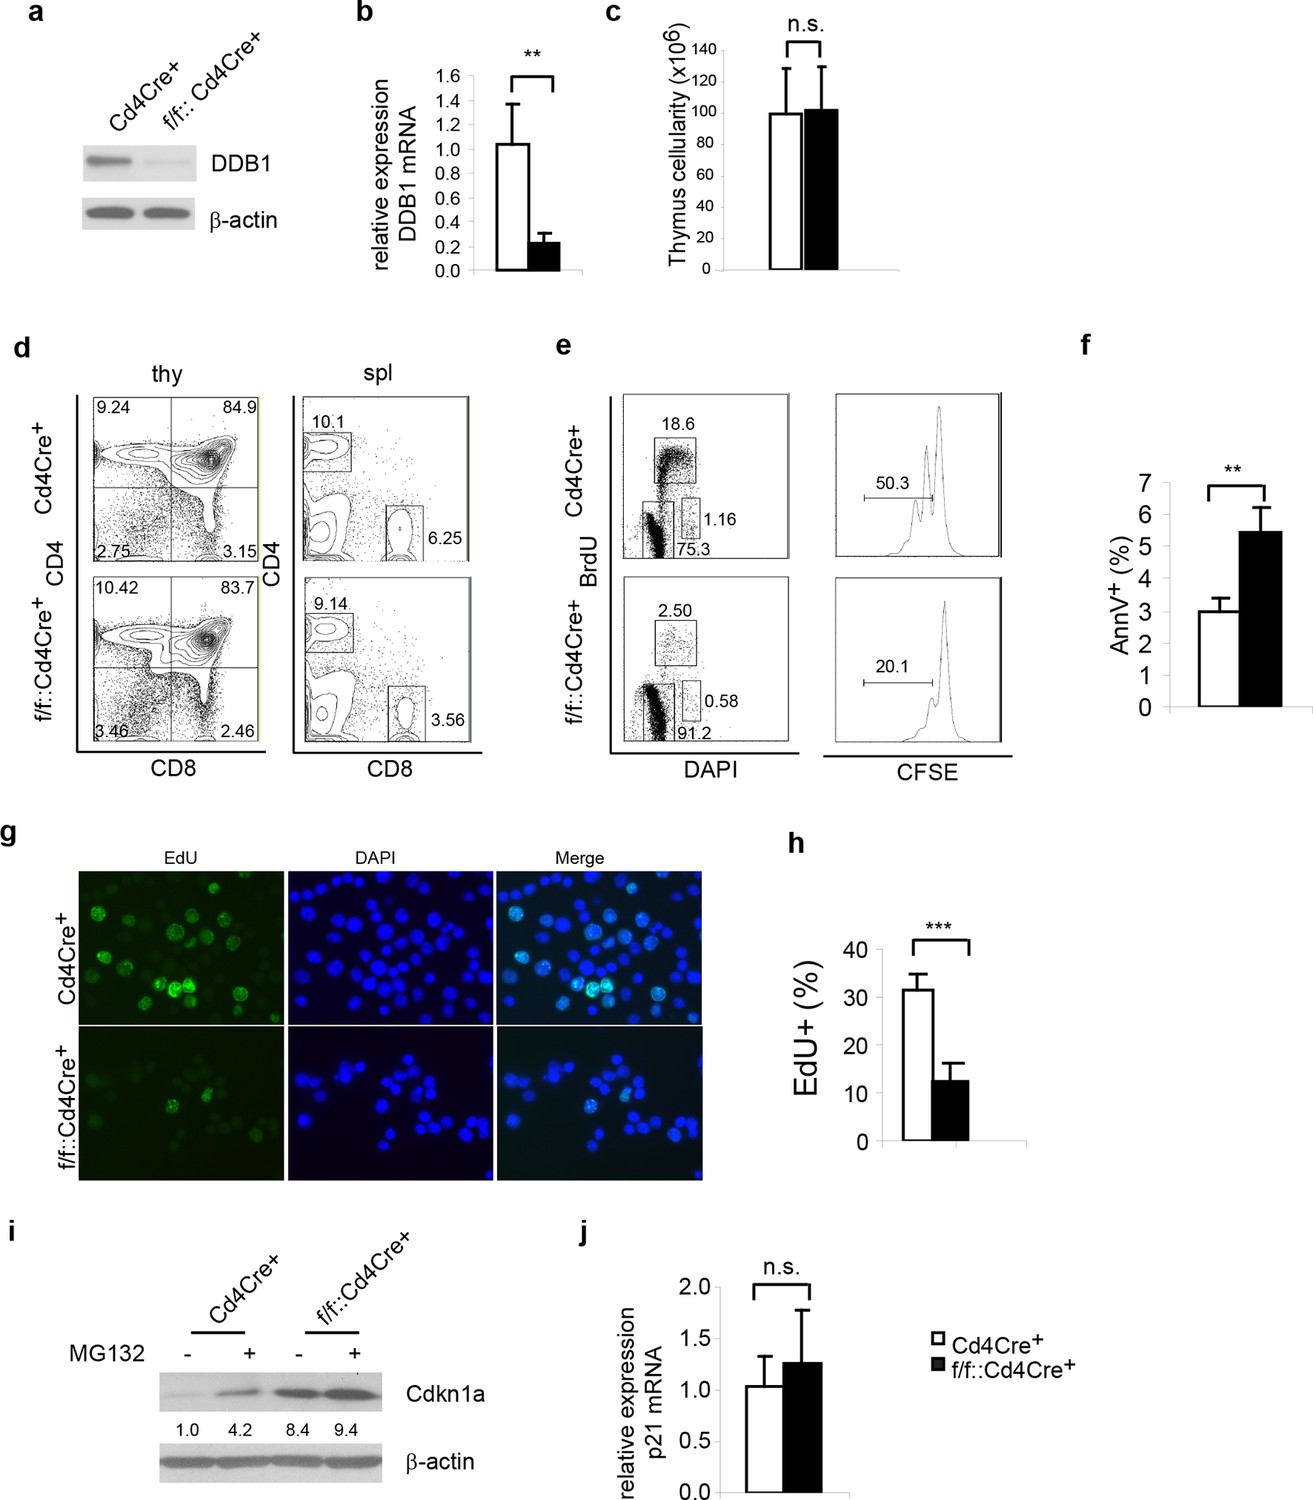
Ddb1 deletion is dispensable for mature T cells.
(a) Western blot of DDB1 expression in total thymocytes. (b) Relative Ddb1 mRNA expression in thymocytes. (c) Total cell number of thymus of 6-week old mice (n = 4). (d) Representative FACS plots of thymus and spleen. (e) Spleen CD4+ cells were sorted and stimulated with 1 μg/ml anti-CD3/CD28 in vitro. BrdU incorporation and CFSE dilution was analyzed. (Anti-CD3/CD28 treated CD4+ cells were stained for AnnexinV+ by FACS and percentage of AnnexinV+ cells was shown. (f) Anti-CD3/CD28 treated CD4+ cells were stained for AnnexinV+ by FACS and percentage of AnnexinV+ cells was shown. (g) Anti-CD3/CD28 treated CD4+ cells were labeled and stained with EdU. (h) Percentage of EdU+ cells was shown. More than 300 cells were included in each analysis. (i) Spleen CD4+ cells were treated with 10 μM MG132 for 2 hr and Western blot was performed. Relative Cdkn1acip1 protein levels normalized to β-actin were indicated below the corresponding lanes. (j) qPCR was performed on spleen CD4+ cell. Representative results of two independent experiments were shown. *p<0.05. **p<0.01. ***p<0.001. n.s. p>0.05.
Figure 7
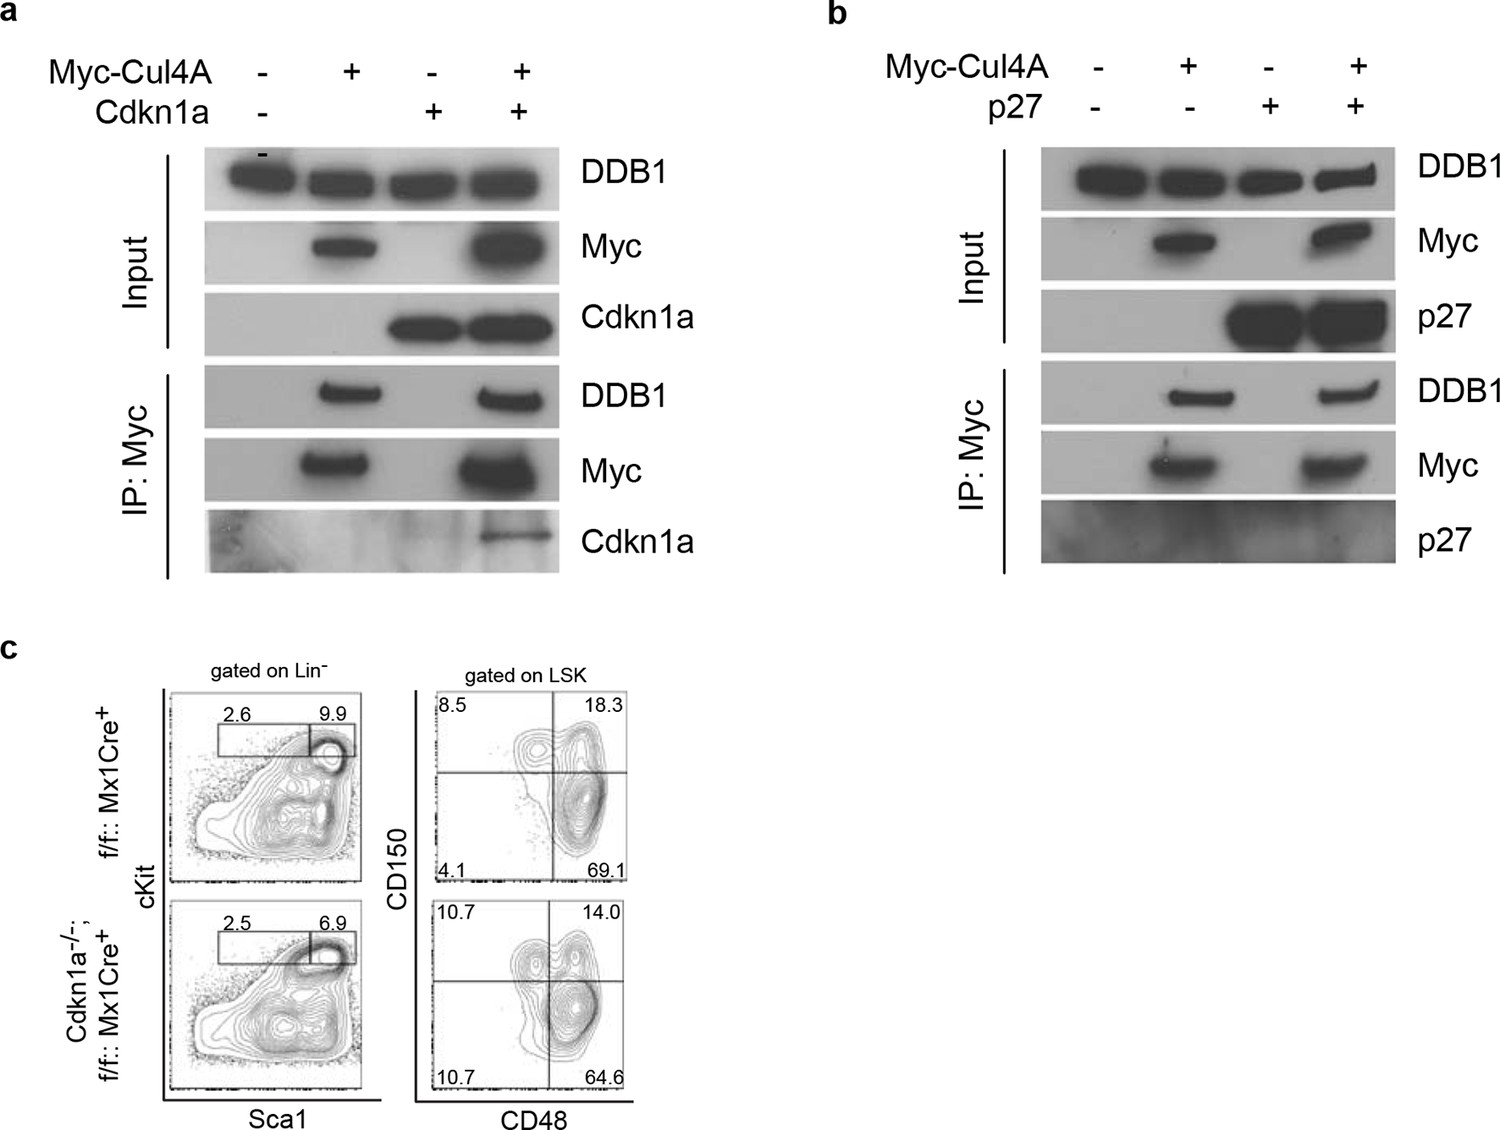
Interaction of Cdkn1acip1 but not p27kip1 with the Cul4-DDB1 complex
(a) 293T cells were transiently co-transfected with plasmids expressing Myc-tagged Cul4a and Cdkn1acip1. Forty-eight hours post transfection, cells were harvested and lysed. Protein lysates were immunoprecipitated with anti-Myc antibody, and Western blotted for Cdkn1acip1 and DDB1. (b) Similarly as described in (a), p27kip1 was tested for co-immunoprecipitation with the Cul4a-DDB1 complex. (c) Representative FACS analysis of bone marrows after polyI:C injection. Age matched littermates on a mixed 129xC57BL/6 background were used from 2 independent experiments (n = 3–4 per group).
Figure 8
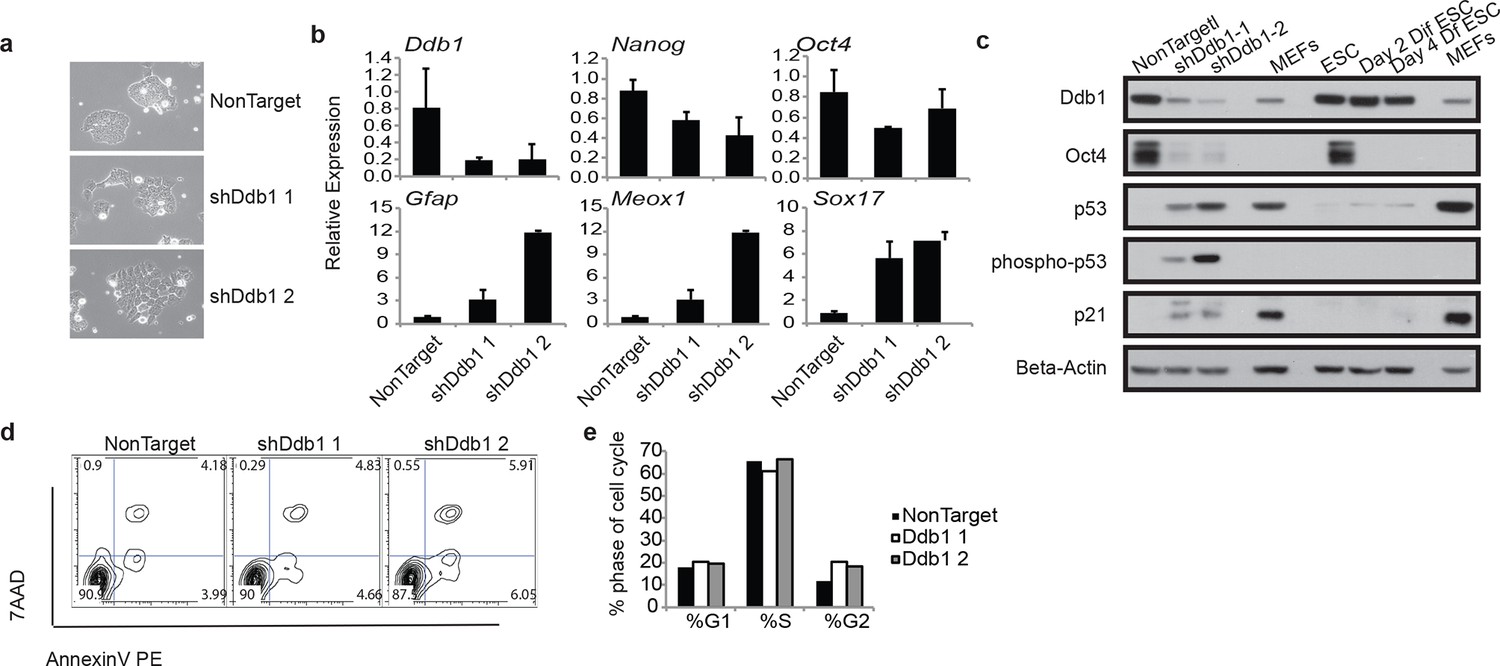
ESC loss of self-renewal after silencing of Ddb1
(a) Bright field picture of ESC colony 4 day post retroviral transfection. (b) Relative expression of pluripotency genes Oct4, and Nanog and genes representing endoderm (Sox17), mesoderm (Meox1) and ectoderm (GFAP) by qRT-PCR 4 days post selection. (c) Western blot of ESC 4 day post infection or differentiated in the presence of retinoic acid for up to 4 days. (d) Representative FACS blot of Annexin V positive cells. (n=3) n.s.: p>0.05. (e) Representative of cell cycle analysis. (n=3) n.s.: p>0.05.
Figure 9

Tagged expression of DDB1 in ESC.
(a) Western blot of DDB1 in different cell types. (b-c) Western blot of total protein and immunoprecipitated of tagged-DDB1 following Doxycycline induction in ESC (b) and HL-60 (c). (d) Silver staining of eluted tagged protein used for one mass spectrometry experiment in ESC.
Figure 10
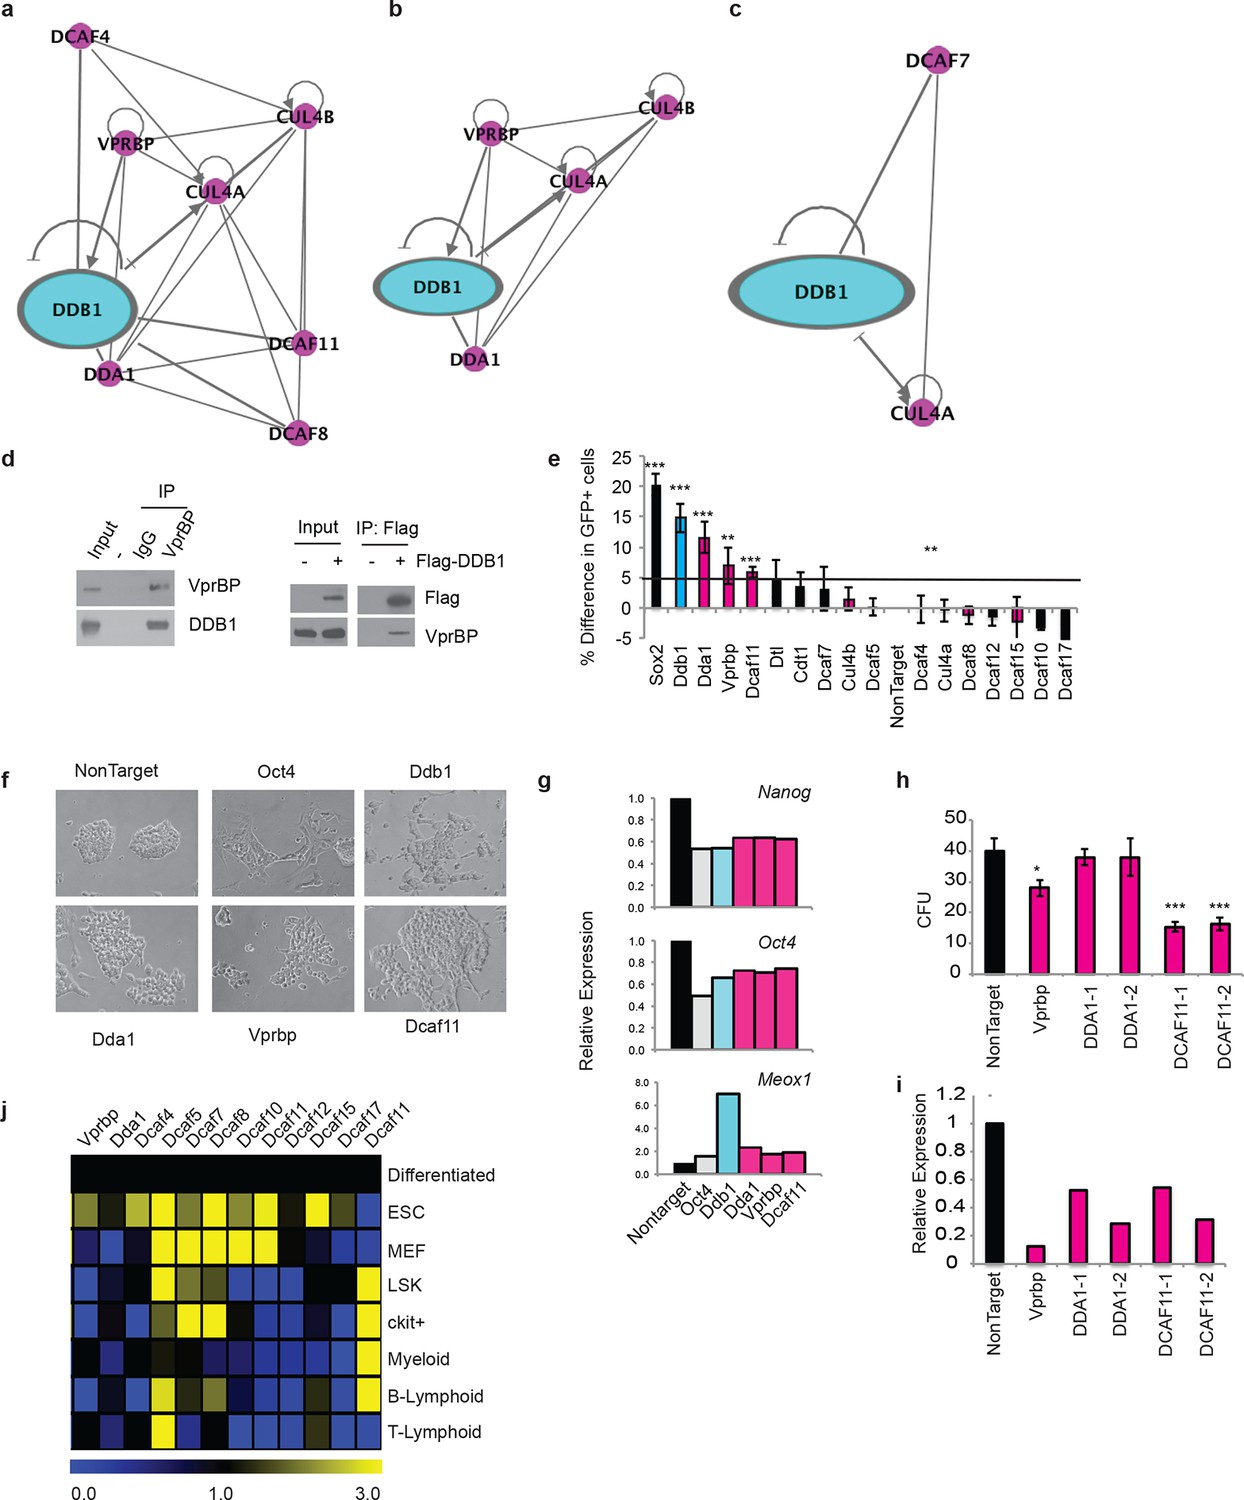
DDB1 interacts with VprBP and DCAF11 in ESC and are required for ESC self-renewal.
(a-c) Ingenuity generated network of protein interactions of CUL4-DDB1 complex in (a) ESC, (b) 293T, and (c) HL-60. pink; DDB1 associated proteins (d) (left) immunprecipitation in 293T of endogenous VprBP protein followed by blotting for DDB1. (right) Transfection of Flag-DDB1 in 293T followed by immunopercipitation. (e-g) Nanog-GFP ES cells were transfected with pools of siRNAs under conditions of self-renewal and analyzed by FACS 72 hrs post-transfcetion. (e) Nanog-GFP expression. (n=3) (pink= proteins identified in ESC mass spectrometry analysis; blue=DDB1) (f) Bright field images of ESC colonies. (g) Representative experiment of relative expression of Nanog, Oct4, and Meox1. (n=3) (h) colony-forming units of LSK transduced with shRNAs. (i) Representative experiment of relative expression of following shRNA silencing. (j) Quantitative PCR of DCAFs in ESC and hematopoietic populations. (Differentiated= ESC differentiated for 48 hrs with retinoic acid). *p<0.05. **p<0.01. ***p<0.001.
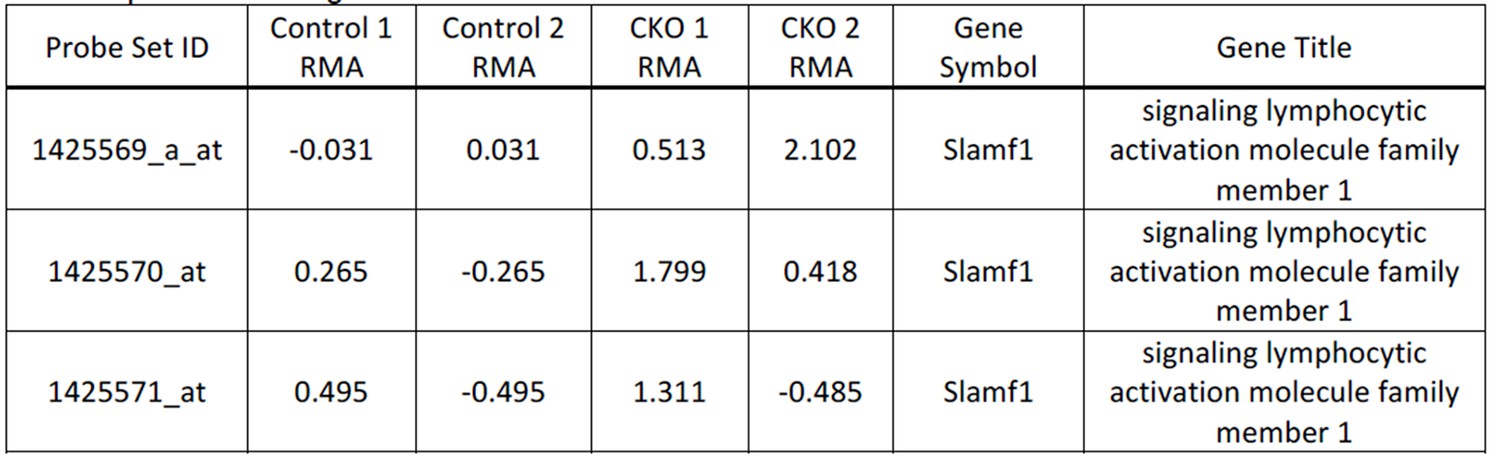
Author response image 1
Additional files
-
Supplementary file 1
DDB1 interacting proteins in ESC, 293T, and HL60 cells.
Mass spectrometry results for DDB1 interacting proteins in 3 different cell types, ESC, 293T, and HL60. Columns A) accession number either swiss-prot or ncbi; B) protein molecular weight; C) Gene Symbol; D) Gene name; E) # of peptides in control; and F) # of proteins in DDB1.
- https://doi.org/10.7554/eLife.07539.013
Download links
A two-part list of links to download the article, or parts of the article, in various formats.
Downloads (link to download the article as PDF)
Open citations (links to open the citations from this article in various online reference manager services)
Cite this article (links to download the citations from this article in formats compatible with various reference manager tools)
The CUL4-DDB1 ubiquitin ligase complex controls adult and embryonic stem cell differentiation and homeostasis
eLife 4:e07539.
https://doi.org/10.7554/eLife.07539


