CryoEM and computer simulations reveal a novel kinase conformational switch in bacterial chemotaxis signaling
- University of Illinois at Urbana-Champaign, United States
- University of Pittsburgh School of Medicine, United States
Decision letter
-
Axel T BrungerReviewing Editor; Stanford University, United States
eLife posts the editorial decision letter and author response on a selection of the published articles (subject to the approval of the authors). An edited version of the letter sent to the authors after peer review is shown, indicating the substantive concerns or comments; minor concerns are not usually shown. Reviewers have the opportunity to discuss the decision before the letter is sent (see review process). Similarly, the author response typically shows only responses to the major concerns raised by the reviewers.
Thank you for submitting your work entitled "CryoEM and Computer Simulations Reveal a Novel Kinase Conformational Switch in Bacterial Chemotaxis Signaling" for peer review at eLife. Your submission has been evaluated by Michael Marletta (Senior editor), a Reviewing editor, and three reviewers. There are several major issues that need to be addressed before a final decision can be made.
The reviewers have discussed the reviews with one another and the Reviewing editor has drafted this decision to help you prepare a revised submission.
Summary:
The manuscript describes the use of subtomogram averaging to determine the structure of a reconstituted chemotactic signaling array at intermediate-resolution.
A complex has been assembled on lipid monolayers between (1) the cytoplasmic domain of Tar chemotaxis receptor, (2) CheA, and (3) CheW. A cryo-tomography density map of the resulting crystalline patches has been obtained, and sub-tomogram averaging has been used to an estimated resolution of the core-signalling unit around 1.3 nm. Flexible-fitting molecular dynamics has been used to dock known crystal structures of these components into the density map. This model and the molecular dynamics simulations suggest a new conformational switch.
Overall, this study defines the reconstituted arrays at an unprecedented resolution and thereby confirms key features of the assembly that have been proposed in the past, but not previously visualized – such as the CheW rings and the P3 and P4 domain positioning. These are important contributions to the understanding of the array structure. However, there are major concerns about the anisotropic character of the EM data and the possible impact on the accuracy of the model. Moreover, the reliability and uniqueness of the fit of the model to the EM data must be assessed in order to judge the quality of the model.
The all-atom MD simulations, which are impressive in their size and duration, suggest a provocative dynamical model of kinase regulation, although the accompanying biochemical data are not highly supportive of the "dipping" mechanism, and further control experiments should be performed. Moreover, it is not entirely clear how these conformational changes are to be interpreted in terms of CheA activation and whether there are other relevant changes.
Reviewer #1:
Essential revisions:
1) The elegant combination of an in vitro reconstitution together with sub-tomogram averaging and molecular modeling is very impressive, but this reviewer has two substantial technical concerns: the data has been obtained by performing tomography on a monolayer sample. All of the unit-cells are equivalently oriented relative to the electron beam and during tomography are tilted through a limited angular range. As is also the case in 2D electron-crystallography experiments, this results in a missing cone of information in the final structure. The resolution of the structure is therefore lower in Z than in X, Y. This situation cannot be avoided for a monolayer sample. This anisotropic resolution has multiple implications: it will lead to apparent smearing of the structure in Z; it will influence the ability to place the subunits into the map, and especially to determine their Z-position; it will affect the MDFF. The authors only quote a single resolution suggesting this effect may not be considered. What is the resolution in Z? Does this allow reliable positioning of the structural models in Z? How reliable is this positioning? How was the anisotropic resolution taken into account in MDFF?
2) Knowing how the available structures have been placed into the EM map, and with what confidence the positions are determined, is essential for assessing the reliability of the final model. It is not clear to me how reliable these positions are. For example, the authors state that the four-helix bundle of the CheA-P3 bundle is clearly discerned to run parallel to the receptor. How clearly? Judging from the available supplementary movie, there is some room for varying this position, as there is for the position of the P5 domain, in particular in the Z direction. What is currently missing is an assessment of how reliable the subunit models are and how accurately the EM map determines their position and arrangement. Are any alternative arrangements possible? With what confidence can this arrangement be selected? How accurately can the domain positions and orientations be determined using an EM map of this resolution and these structural subunit models? How accurate do these initial positions need to be to interpret details after MDFF? One can imagine that with a 30 Å resolution structure, subsequent MDFF would not give a structure reliable to side-chain resolution, while with a 5 Å structure it would – what about at the resolution in this manuscript? In the end the authors go on to determine specific amino acid interactions and conformational changes, so it is important to clearly justify/demonstrate that this level of interpretation is reliable and unique given the input data.
3) Example data should be deposited in the EMDB.
Reviewer #2:
Minor revisions:
1) Various CheA domains are first referred to in the subsection “3D density maps of CheA2-timer and CheA2-hexamer”. It would be helpful if there had been a sentence or two first to introduce the structure of CheA, identifying the domains P1 to P5.
2) The authors rightly point out that the model agrees with previous structural studies, and they go on to validate, in cells, the conformational change that they propose for CheA. This should all be balanced by some discussion of what might be added by further improving the resolution. While docking known structures into EM maps at a resolution of ~1.2 nm is generally accepted as giving useful biological information, it generally is not accepted as giving a definitive final structure.
Reviewer #3:
Essential revisions:
1) The authors should provide more detail with respect to the uniqueness of the P4 positioning in the density maps. This is an important issue because the EM data here alone determines the P4 position and it does not draw on crystal structures, such as most of the other interfaces. The conformation of P4 is also critical to the dynamics simulations that follow. The domain fitting was done reasonably, however; on viewing the density, one wonders if other positions are also nearly as compatible. For example, do the fits converge if different starting conformations are used? Could some metric be given with respect to the goodness of fit? Also on this point, it appears that the nucleotide-free form on the P4 domain was taken, both for the modeling and the dynamics. ATP binding substantially affects the conformation of a large loop on the P4 domain surface. Does ATP-bound P4 give a similar fit as the nucleotide-free form?
2) There is cryoEM data that suggests the P1 and P2 associate quite strongly with the kinase core in the inhibited state (Briegel et al. 2013). If these regions indeed contact P4, they could alter its positioning and dynamics. This point should be noted.
3) This reviewer is concerned that the significance of the R297 salt bridge to stabilizing the dipped conformation is overstated. In the simulations, is 4 versus 2 instances of dipping significant for 27 copies? Also, although 3 of the 4 dwell times for the dipped conformation are indeed longer in the wt, the other one is similar to that seen in the mutant. Is the principle component associated with this motion the only one that shows a difference in occurrence between the wt and mutant trajectories? A more thorough assessment of this data would bring more confidence to the dipping result.
4) The use of "asymmetry" might be misleading to differentiate the conformational states. The term certainly describes the dipped state, however; the asymmetry may simply be a consequence of this being a rare event. The reader gets the impression that there are two states: one symmetric and one asymmetric; however, a dipped symmetric state may also be possible, just unlikely to be seen in the same dimer under the simulation conditions.
5) Little information is given with respect to the PCA in the dynamics trajectories (and there is no mention of it in the Methods section). Also, for a general biological scientist, the significance of Figure 5C will be lost without a better description of what is being represented. It would be useful to know what percent of the eigenvalues are represented by the first component and how many vectors represent a majority of the total motion. Also, the authors focus on this one dipping transition; are there no other significant conformational changes? The arrays are of great interest in part due to their cooperative behavior; one might expect such simulations to reveal recoupling across core particles. There is also data that changes in the P5-receptor interfaces are associated with activation (Piasta et al. 2013). Are any such motions observed? This should be commented on.
6) The cross-linking data supports proximity of the CheA receptor residues, but it does not provide much support for the dipping motion. Control sites would have to be investigated and relative rates of cross-linking determined, ideally for multiple positions. For example, the R394 self cross-link seems to form as readily as CheA-receptor cross-links. R394 self cross-links are not surprising given the symmetry in the trimers-of-dimers, nonetheless, these sites are ~15 Å apart. Furthermore, it is not clear why the N405 self cross-links also do not form, given that these residues are closer to each other than are copies of R394. The statement near the end of the second paragraph of the subsection “Biochemical validation of CheA conformational change in E. coli cells” is not accurate, given that the yields of the 394 self cross-links are quite different in the two experiments. Normalizing to this band, there is not much change between the 394/361 and 394/316 pairs. Even if the cross-linking is less for 316/394, it could mean that those resides are simply further apart in a dominant conformation or show reactivity differences (e.g. 405 vs. 394). There is also the question of what state the cells are in during cross-linking. The attractant serine is present during the experiment, but depending on the timing of the washes, the cells are likely adapted. How much of CheA is activated and how much is inhibited in these experiments? For only a few sites, as investigated here, it would be more powerful to detect an attractant depend effect on relative cross-linking of the reporters. As it stands, the cross-linking data primarily supports the general architecture, but does not make the dipping mechanism more compelling.
7) The cell swimming assays need more description and from Figure 6 alone, it is not clear what parameter is being graphed. "Swimming ability" itself is a misnomer, as the cells can likely swim fine, but can't alternate tumbling properly to migrate in soft agar. This should be explained in the text or figure legend. Do all the mutants form attractant rings at the migration fronts indicative of chemotaxis? Or do some just show spreading, a consequence of some CheA activation, but no regulation (pseudotaxis). Photographs of the swarm plates for key mutants (or those that show differences should be provided as figure supplements). Furthermore, simply measuring the swarm radius does not distinguish a mechanistic defect from an assembly defect. Can an assessment be made (perhaps using the reconstitution system) if the mutants form arrays like wt?
8) In the subsection “3D density maps of CheA2-timer and CheA2-hexamer“, second paragraph, the electron density is less in the CheW/P5 contacts between neighboring core signaling particles than within the core complex, but this does not necessarily mean that the interfaces are weaker; they may instead be more structurally variable, and, hence, averaged out. Consider a change of wording. It is also difficult to see in Figure 3A and 3C that there is less density in the P5/W contacts between core particles. In Figure 3, color P5 and W differently, and demark the interfaces 1 and 2 that are being referred to in the text.
9) This reviewer appreciates that the authors are being cautious with the interpretation of their data, but the reader is largely left to summarize what the findings mean for CheA activation. The mechanistic take home message should be more explicit.
[Editors' note: further revisions were requested prior to acceptance, as described below.]
Thank you for submitting your work entitled "CryoEM and Computer Simulations Reveal a Novel Kinase Conformational Switch in Bacterial Chemotaxis Signaling" for consideration by eLife. Your article has been reviewed by three peer reviewers, and the evaluation has been overseen by a Reviewing Editor and Michael Marletta as the Senior Editor.
The reviewers have discussed the reviews with one another and the Reviewing editor has drafted this decision to help you prepare a revised submission. The following comments need to be addressed before a final decision can be made.
Reviewer #1:
1) Anisotropic resolution of the map.
The authors present the angular distribution of the contributing subunits and argue that because is a good coverage of the tomography tilt range this concern can be disregarded. This is not a valid argument for two reasons. Firstly because the angular coverage is not good – high tilt angles are clearly underrepresented relative to low tilt angles, and this will cause a resolution anisotropy (it is not completeness of coverage, but uniformity of coverage that determines resolution anisotropy). Secondly, at high tilt the monolayer sample is much thicker and the projections have lower signal to noise. High and low tilts do not contribute equivalently to the final structure. This will also cause resolution anisotropy. I reiterate my initial concern – that the resolution of the structure is expected to be lower in Z than in X and Y. In the response to reviewers the authors show some isosurfaces with simulated wedges. It is not possible to sensibly assess the extent of anisotropic resolution from such images, and anyway, fitting is not based on isosurfaces, but on density. I am not persuaded that resolution anisotropy can be largely disregarded as the authors suggest.
This is not an unusual problem and it should not be difficult for the authors to address this issue better. They should be clear in the manuscript that there is resolution anisotropy and make an attempt to measure its extent (previous publications have used for example FSC within cones or 3DSSR to assess anisotropic resolution). The potential effect of this on fitting and MDFF should then be considered. Ideally, this would be taken into account during simulation, but the authors will probably consider this too much work. In that case they should write that this was not taken into account, and discuss what the potential influence might be on the reliability of domain positioning or on the simulations.
2) Reliability and uniqueness of fit.
This question was also asked by reviewer 3. How well does the EM density determine the position of the domains, in particular P4? From the authors response to reviewers it sounds like the position is not well defined, but that different positions still undergo dipping motions. I am still concerned that the orientation of P4 is not well defined by the EM map, that the starting orientation is critical to the MDFF analysis, and that this influences the interpretation of the dipping motion. The authors have access to the raw data and do not seem to be concerned by this. In that case they need to help the reader to assess the reliability of the model. Ideally by providing a metric for the goodness of fit, but minimally by an honest appraisal of the caveats, clearly and openly discussing the reliability of the fit, where alternative positions are possible, and how this might influence the interpretation. This should be in the main text of the manuscript.
Reviewer #2:
The revisions made in response to my comments are fully satisfactory.
Reviewer #3:
In their revised version of the manuscript, the authors have done a nice job of improving the paper and they have largely addressed my concerns. The one exception is the cross-linking studies. I still do not agree with the statement that "Taken together, our cross-linking experiments suggest that the CheA-P4 "dipped" conformation observed in silico is indeed sampled within the native chemosensory complex of E. coli." The inference here is that the cross-linking data supports the dipped conformation as a relevant state of the arrays. It may well be, but, the cross-linking data does not provide strong support for this supposition. Again, the only band to report on the dipped conformation (361/394) is quite weak, much weaker than the self 394-394 band. It's not uncommon to see some cross-linking between residues that are in proximity. In fact, I would be surprised if no cross-linking was observed, even if only the undipped conformation was represented. The authors can lean more on their mutagenesis data to support the dipped conformation, but I don't think the cross-linking makes the case.
https://doi.org/10.7554/eLife.08419.043Author response
[…] Overall, this study defines the reconstituted arrays at an unprecedented resolution and thereby confirms key features of the assembly that have been proposed in the past, but not previously visualized – such as the CheW rings and the P3 and P4 domain positioning. These are important contributions to the understanding of the array structure. However, there are major concerns about the anisotropic character of the EM data and the possible impact on the accuracy of the model.
Because our monolayer samples are not flat like 2D crystals, but are rather wavy, the angular distribution of contributing subunits is very well sampled (Figure 3—figure supplement 1B and C, see Reviewer #1, point 1), thus anisotropic resolution of the density map is not a significant concern. Nonetheless, we tested the effect of missing cone on the density map. As you can see in Author response image 1, there is little density distortion, with a cone semi-angle of ~12°, a conservative estimate for the sampling in this study (Author response image 1, green mesh), thus its impact on the accuracy of the model docking is minimal.
Author response image 1
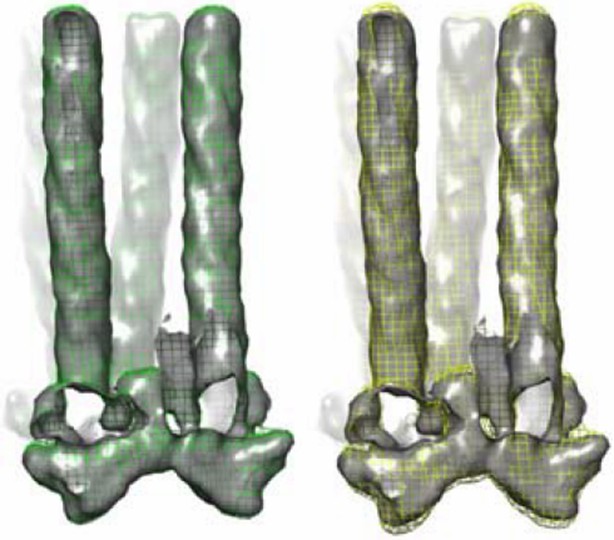
Effect of missing cone on the tomography density map.
Shown in gray solid surface, the ideal density map without missing cone, and maps with different amount of missing cone applied (colored meshes). Left, green mesh 12° cone (this study, Figure 3–figure supplement 1). Right, yellow mesh, 30° cone as would be found in other typical tomography studies. Density maps are all contoured at 1.5σ.
Moreover, the reliability and uniqueness of the fit of the model to the EM data must be assessed in order to judge the quality of the model.
We would like to clarify that the unit cell model used in the bulk of our MD simulation was built heuristically, utilizing existing X-ray structures to best preserve the known interaction interfaces and only indirectly using the density maps to provide loose constraints on portions of the model in which previous data did not exist, in particular the position of the CheA P4 domains. This seems to have been a major source of confusion and concern for the reviewers, and we apologize for not making it clearer. We have revised the Methods section to include detailed steps on how the MD models were generated with a new Figure 4—figure supplement 2. Nevertheless, we carried out additional equilibrium simulations of the MDFF-refined CheA2-trimer model, which exhibit qualitatively the same structural and dynamical features, including the presence of several CheA P4 dips, as shown in the new Figure 4—figure supplement 5 (See Reviewer #1, Point 2 and Reviewer #3, Point 1). Moreover, to test the uniqueness of our model fit, we carried out several additional fitting experiments for comparison, obtaining virtually identical models (See Reviewer #3, Point 1 and Author response image 2).
Author response image 2
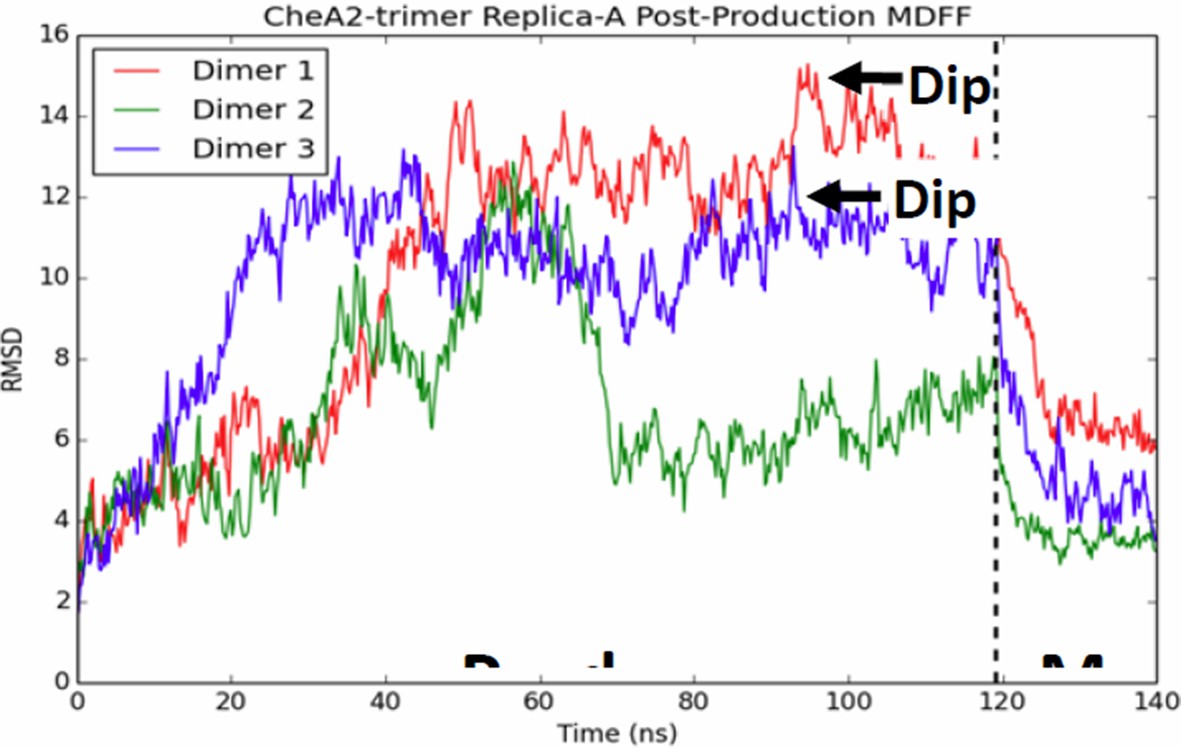
CheA dimers from multiple initial conformations converge to same fitted model.
Red, blue, and green traces track RMSD of CheA dimers as measured from the initial MDFF-refined model. Though, the dimer conformations diversity during the 120 ns production run, a 20 ns MDFF simulations returns them to their initial MDFF-refined state.
The all-atom MD simulations, which are impressive in their size and duration, suggest a provocative dynamical model of kinase regulation, although the accompanying biochemical data are not highly supportive of the "dipping" mechanism, and further control experiments should be performed.
We designed three cross-linking pairs for the predicted interactions based on the MD model: the interaction only in the dipping state and those only in the undipped state. The cross-linking results agree very well with model prediction, supporting our computational model as well as confirming the existence of a novel dipping state (See Reviewer #3, Point 6). We have included additional control experiments as presented in Figure 5.
We also believe this first plausible model with sufficient details of the basic chemotaxis core-signaling unit will be valuable for researchers in the field to further test and investigate the function and mechanisms of the bacterial chemotaxis signaling.
Moreover, it is not entirely clear how these conformational changes are to be interpreted in terms of CheA activation and whether there are other relevant changes.
We have added discussions on the P4 conformation in terms of CheA activation (Discussion). The dipping motion observed in MD simulation warrants further in depth investigation, such as how these conformational changes are related to CheA activation. This is beyond the scope of this study.
Detailed responses to all points raised by the individual reviewers are provided below.
Reviewer #1:
Essential revisions:1) The elegant combination of an in vitro reconstitution together with sub-tomogram averaging and molecular modeling is very impressive, but this reviewer has two substantial technical concerns: the data has been obtained by performing tomography on a monolayer sample. All of the unit-cells are equivalently oriented relative to the electron beam and during tomography are tilted through a limited angular range. As is also the case in 2D electron-crystallography experiments, this results in a missing cone of information in the final structure. The resolution of the structure is therefore lower in Z than in X, Y. This situation cannot be avoided for a monolayer sample. This anisotropic resolution has multiple implications: it will lead to apparent smearing of the structure in Z; it will influence the ability to place the subunits into the map, and especially to determine their Z-position; it will affect the MDFF. The authors only quote a single resolution suggesting this effect may not be considered. What is the resolution in Z? Does this allow reliable positioning of the structural models in Z? How reliable is this positioning? How was the anisotropic resolution taken into account in MDFF?
We thank the reviewer for the positive remark, and agree with the reviewer that a perfectly oriented sample, such as 2D crystal, has a substantial anisotropic resolution (poorer in Z) with a missing cone of information in the final structure. However, our monolayer samples are not rigid like 2D crystals, but are quite wavy on the cryoEM grids. The angles between the normal of the monolayer and the electron beam can be as much as 15°. On top of this, there is additional specimen pre-tilt ranging 0-10°, in addition to a tomography tilt range ± 70°. The overall angular distribution of all the subunits contributing to the averaged map is presented in a new Figure 3—figure supplement 1B and C for the in-plane rotation and maximum tilt angle, respectively. The plot shows a near uniform distribution of in-plane angles, and a very good coverage of the tomography tilt range, therefore, concerns with missing cone and anisotropic resolution, as well as its impact on the reliability of positioning of MDFF model can be largely disregarded (see overall critique point #1, Author response image 1).
2) Knowing how the available structures have been placed into the EM map, and with what confidence the positions are determined, is essential for assessing the reliability of the final model. It is not clear to me how reliable these positions are. For example, the authors state that the four-helix bundle of the CheA-P3 bundle is clearly discerned to run parallel to the receptor. How clearly? Judging from the available supplementary movie, there is some room for varying this position, as there is for the position of the P5 domain, in particular in the Z direction. What is currently missing is an assessment of how reliable the subunit models are and how accurately the EM map determines their position and arrangement. Are any alternative arrangements possible? With what confidence can this arrangement be selected? How accurately can the domain positions and orientations be determined using an EM map of this resolution and these structural subunit models? How accurate do these initial positions need to be to interpret details after MDFF? One can imagine that with a 30 Å resolution structure, subsequent MDFF would not give a structure reliable to side-chain resolution, while with a 5 Å structure it would – what about at the resolution in this manuscript? In the end the authors go on to determine specific amino acid interactions and conformational changes, so it is important to clearly justify/demonstrate that this level of interpretation is reliable and unique given the input data.
We understand the reviewer’s concerns and have taken a number of steps to better characterize to what degree our models are unique and robust. These steps are discussed in more detail below (also see Reviewer #3, Point 1) and the modeling procedures used in this study, including “how” the available structures were placed in the EM maps, are summarized in a new supplemental figure (Figure 4—figure supplement 3). Here, we will address some of the reviewer’s more general concerns.
Regarding how reliably the EM map determines the positions and arrangement of the protein components involved in the model, we can only strictly state that our MDFF model is reliable up to a resolution equal to that of the lowest resolution piece used in its construction, that is our 12.7 Å density map. Nevertheless, this resolution places tight constraints on the overall positioning and tertiary structure of the proteins involved. In addition, we would like to highlight that the proteins were not docked into the EM map in one-by-one but rather heuristically-constructed, full subunit pieces were docked to best preserve known interfaces (e.g., receptors within receptor TOD from 1QU7, CheA-P5/CheW interfaces from 4JPB, receptor/CheW and receptor/CheA-P5 from NMR, etc.). Assuming the correctness of these previously-characterized interfaces, no other global arrangements are possible. To illustrate this we conducted additional MDFF simulations on the MDFF-refined CheA2-trimer model increasing the coupling of the model to the map by an order of magnitude – a regime in which the density-derived forces overwhelm the electrostatic forces between atoms.
Concerning the interpretation of structural details after MDFF, the reviewer is indeed correct that at the resolutions of the maps present in this study, no side-chain information is present and, hence, MDFF cannot directly bias the structures at the side-chain level. However, we would like to highlight that the strength of the MDFF methodology is the “flexibility” of its fitting. This flexibility arises from the use of the chemically-based MD force field, which adds much additional information to help refine the model’s side chain orientations and interactions during the fitting procedure. Unfortunately, there currently are no robust methods for assessing the “accuracy” (that is, how closely the model matches the “true” structure) of a model derived via the fitting of high-resolution structures into lower-resolution EM maps, especially those with resolution lower than 8 Å. Indeed, this is an area of active research in the field (Xu, X. P., & Volkmann, N. (2015) Arch. Biochem. Biophys.; Schröder, G. F. (2015) C.O.S.B.). Rather, validation of the reliability of a model may still be given in terms of its “precision”, that is the qualitative reproducibility of the model’s key predictions. Importantly, we subsequently carried out extensive, all-atom MD simulations on multiple models and using many independent simulations and demonstrated that the key discovery of this study, namely the dipping conformational dynamics of the CheA kinase domain, is reproduced in multiple simulations of both heuristically- and MDFF-derived models. We then successfully confirmed a number of our model’s predictions in the biochemical experiments, the best test of reliability.
Finally, the authors would also like to note that while the CheA P3 and P5 domains may appear in the supplementary movie to have more room for varying their positions, this appearance is a consequence of the chosen isosurface used to illustrate a rough envelope of the electron density. This envelope can appear tighter or more diffuse depending on the isosurface value chosen. The MDFF biasing force, on the other hand, is based on the actual three-dimensional volumetric density, not the envelope.
3) Example data should be deposited in the EMDB.
The EM maps were deposited in EMDB under accession code EMD-6319 for the CheA2-trimer and EMD-6320 for the CheA2-hexamer, at the time when the manuscript was submitted. The EM map-associated MD model of the T. maritima core-signaling unit was also deposited in PDB database under accession code 3JA6.
Reviewer #2:
Minor revisions:
1) Various CheA domains are first referred to in the subsection “3D density maps of CheA2-timer and CheA2-hexamer”. It would be helpful if there had been a sentence or two first to introduce the structure of CheA, identifying the domains P1 to P5.
We thank the reviewer’s suggestion and have included a sentence to introduce the structure of CheA, identifying the domains P1 to P5 (“CheA is a multi-domain protein, consisting of five separate and functionally distinct domains (P1-P5): P1-phosphoryl transfer domain, P2-substrate binding domain, P3-dimerization domain, P4-kinase domain and P5-regulatory domain”).
2) The authors rightly point out that the model agrees with previous structural studies, and they go on to validate, in cells, the conformational change that they propose for CheA. This should all be balanced by some discussion of what might be added by further improving the resolution. While docking known structures into EM maps at a resolution of ~1.2 nm is generally accepted as giving useful biological information, it generally is not accepted as giving a definitive final structure.
We appreciate the reviewer’s comments and have added a discussion regarding what one might expect from modeling efforts utilizing higher resolution EM maps (“By further improving the resolution of our cryoET to better than 8Å and by using the novel lipid-monolayer system described here, an atomic homology model for E. coli can be derived, which would greatly facilitate the use of the wealth of existing biochemical and biophysical data and permit directly transferrable structural and dynamical predictions”).
Reviewer #3:
Essential revisions:1) The authors should provide more detail with respect to the uniqueness of the P4 positioning in the density maps. This is an important issue because the EM data here alone determines the P4 position and it does not draw on crystal structures, such as most of the other interfaces. The conformation of P4 is also critical to the dynamics simulations that follow. The domain fitting was done reasonably, however; on viewing the density, one wonders if other positions are also nearly as compatible. For example, do the fits converge if different starting conformations are used? Could some metric be given with respect to the goodness of fit? Also on this point, it appears that the nucleotide-free form on the P4 domain was taken, both for the modeling and the dynamics. ATP binding substantially affects the conformation of a large loop on the P4 domain surface. Does ATP-bound P4 give a similar fit as the nucleotide-free form?
We thank the reviewer for the well-thought-out questions regarding the overall quality and uniqueness of our models. We have added additional text and figures, as described below, to address the reviewer’s concerns.
To address the uniqueness of the positioning of the CheA P4 domain and its effect on the observed P4 dynamics, we have carried out an additional series of extensive simulations of the MDFF-refined CheA2-trimer model (Figure 4—figure supplement 3B and Supplementary file 1) for comparison with the dynamics observed in the heuristically-derived unit cell model. As the MDFF refinement procedure affected, in particular, the positioning of the P4 domains relative to the rest of the CheA dimer molecules and receptor tips, and hence their interactions with neighboring proteins, the two models provided different CheA dimer initial conditions from which to seed further simulations. In particular, the MDFF fitting procedure gave rise to a CheA dimer model with an RMSD from the heuristically modeled CheA dimer of ~5.3 Å. Nevertheless, both models exhibited multiple dipping events (Figure 4 and Figure 4—figure supplement 5) demonstrating that the ability of the P4 domain to undergo the dipping motion does not depend on a more precise placement of the P4 domains than our density maps have provided.
In addition, to address the convergence of the MDFF fit, we conducted two additional MDFF simulation on CheA2-trimer model in which the CheA molecules exhibited a mix of P4 conformations. For this purpose we selected as initial conformations two of the ten CheA2-trimer replicas (subsequent to the ~120 ns production simulation) in which one or more of the CheA molecules exhibited dipped or “intermediate” P4 conformations. Author response image 2 depicts, for one of those MDFF simulations, the RMSD of each CheA dimer in the CheA2-trimer (as measured from the initial MDFF-refined CheA dimer model) over the course of the ~120 ns production simulations and 20 ns post-production simulation. Hence, we show that the MDFF fitting of CheA dimers starting from diverse initial configurations all converge on to essentially the same model.
Finally, the reviewer is correct that the nucleotide-free form of CheA was selected for this initial study. In general, maps of resolution less than 1 nm cannot be used to discern differences in secondary structure (Schröder, G. F. (2015). COSB, 31, 20-27). Regarding the structural effects of nucleotide binding on the local structure of the P4 domain because both conformations inhabit essentially the same volume, we cannot, at the current resolution of our maps (>=12.7Å), discriminate with MDFF the difference in conformation of the loop in the nucleotide-free P4 (e.g. PDB 1B3Q) and nucleotide-bound P4 (e.g., PDB 1I58 or 1I5D).
2) There is cryoEM data that suggests the P1 and P2 associate quite strongly with the kinase core in the inhibited state (Briegel et al. 2013). If these regions indeed contact P4, they could alter its positioning and dynamics. This point should be noted.
This was indeed carefully considered when we docked the models. We now have a preliminary density map lacking the P1-P2 domains in the CheA. The map with CheA P345 is very similar to the map with CheA full length (Author response image 3), further suggesting the density corresponds to the P4 domain. The P1-P2 domains are likely very flexible and the densities have been averaged out. The main differences between this study and the previous one (Briegel et al. 2013) are 1) the map resolution is better in this study and number of subunits contributing to the final structure is in a great excess; 2) our density map is from wt receptor, likely in the adapted state, while the other study is in the inhibited state.
Author response image 3
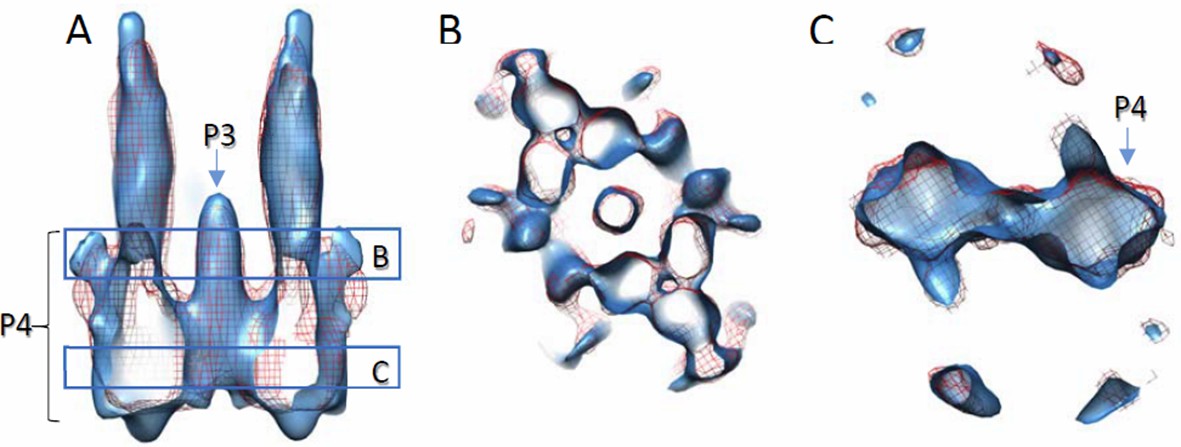
Comparison of density maps containing full-length wt CheA and wt CheA-P345.
Densities are contoured at 2σ. Solid blue, with wt CheA-P345; red mesh, with full-length wt CheA. The density with CheA-P345 appears elongated along the Z direction, due to the missing wedge effect and limited amount of data. (A) Side view of the volume slab. (B and C) Top views of volume slabs at the height indicated in A.
3) This reviewer is concerned that the significance of the R297 salt bridge to stabilizing the dipped conformation is overstated. In the simulations, is 4 versus 2 instances of dipping significant for 27 copies? Also, although 3 of the 4 dwell times for the dipped conformation are indeed longer in the wt, the other one is similar to that seen in the mutant. Is the principle component associated with this motion the only one that shows a difference in occurrence between the wt and mutant trajectories? A more thorough assessment of this data would bring more confidence to the dipping result.
We thank the reviewer for this careful observation. After performing additional experiments described below, we agree that while the R297/E397 interaction clearly stabilizes the “dipped” state in silico as signified by an increased dwell time and is also critical for proper signaling in vivo, this does not necessarily mean that it is the stabilization of the “dipped” state that makes the interaction critical for proper signaling. For example, one could imagine the interaction being related to a Class I model given the spatial relationship with this pair and R354/E392 examined in a recent NMR study. On the other hand, it could also be that the rearrangement of P4 is important to bring into register binding sites for P1 in support of a class II model, or some combination of the two. We have altered the main text to clarify that the R297/E397 contact is necessary for signaling and correlated to the “dipped” state, but softened the correlation between the two ideas.
To address this concern experimentally, we extended both our wild-type and R297A mutant unit cell simulation by 50%, from 300 ns each to 450 ns each, in order to improve our sampling. We did not observe any additional stabilized dipping events in the wild-type simulations (Figure 4C, top). Moreover, in the R297A mutant simulations, one of the dipping CheA P4s underwent an additional dip-return event (Figure 4C, bottom), further closing the gap between the sheer number of dipping events observed in the two models. Hence, in light of the new data, we agree with the reviewer that our proposal that the R297/E397 contact may help promote the dipping conformation change is not well supported. We have removed this notion from the main text. On the other hand, our suggestion that the R297/E397 contact may help stabilize the dipping conformation seems to be reinforced by our extended simulations. In particular, in the wild-type simulations, the three (of the four total) dipping CheA dimers in which the R297/E397 contact was formed (Figure 4C, top, red, blue, green traces) maintain this conformation, while the dimer that did not form the R297/E397 contact (yellow trace) returned to the bulk. In addition, both dipping CheA dimers in the R297A mutant simulations, which are of course unable to from the R297/E397 salt bridge, quickly return to the bulk (Figure 4C, bottom, red, blue traces), including the P4 domain, which undergoes two dip-return events (blue trace). Hence, we feel the suggestion of the stabilizing nature of the R297/E397 contact is reasonable in light of the comparative in silicodata. It remains to be determined if the stabilization of the “dipped” state is the primary role of R297 in signaling, or if this is an ancillary effect.
Finally, regarding the differences between the PC projections of the wt and R297A mutant CheA dimer populations, the authors wish to point out that the PCA was constructed to highlight the dip for the purpose of tracking the CheA dimer conformations. Hence, the difference between the CheA dimer dynamics of the two models is most readily observed in the first principal component, which captures a large percent (41%) of this dipping motion. Though the second PC also describes a large portion of the total variance (31%), the two models do not differ significantly from each other in this dimension.
4) The use of "asymmetry" might be misleading to differentiate the conformational states. The term certainly describes the dipped state, however; the asymmetry may simply be a consequence of this being a rare event. The reader gets the impression that there are two states: one symmetric and one asymmetric; however, a dipped symmetric state may also be possible, just unlikely to be seen in the same dimer under the simulation conditions.
We agree with the reviewer and have changed the term "asymmetry" to "dipped".
5) Little information is given with respect to the PCA in the dynamics trajectories (and there is no mention of it in the Methods section). Also, for a general biological scientist, the significance of Figure 5C will be lost without a better description of what is being represented. It would be useful to know what percent of the eigenvalues are represented by the first component and how many vectors represent a majority of the total motion. Also, the authors focus on this one dipping transition; are there no other significant conformational changes? The arrays are of great interest in part due to their cooperative behavior; one might expect such simulations to reveal recoupling across core particles. There is also data that changes in the P5-receptor interfaces are associated with activation (Piasta et al. 2013). Are any such motions observed? This should be commented on.
We appreciate the reviewer’s comments and have added to the Methods section an entry entitled “Simulation Analysis” to describe the PCA procedure in more detail. In that section the fractional variances of the first three modes are given, in particular, the first component is shown to describe roughly 42% of the total motion. In addition, a more detailed main-text discussion of the PCA results was added to better describe their significance (subsection “A conformational change of the CheA kinase domain”, last paragraph). Regarding the observation of “other” significant conformation changes, we agree with the reviewer that our model and methods should be able to provide useful information regarding general motions of the array, including those potentially relevant to its cooperative nature. Indeed, we have sought to develop the first plausible all-atom model for asking these kinds of structural questions and have deposited this model in the PDB database for review and use by other researchers in the field. In this study, however, we have chosen to focus our investigation on a large-scale dipping motion of the CheA-P4 domain. Additional investigation will be necessary to test the full extent of our model’s predictability in other areas of signaling and function, in particular the P5-receptor interface mentioned by the reviewer is of active interest to us.
6) The cross-linking data supports proximity of the CheA receptor residues, but it does not provide much support for the dipping motion. Control sites would have to be investigated and relative rates of cross-linking determined, ideally for multiple positions. For example, the R394 self cross-link seems to form as readily as CheA-receptor cross-links. R394 self cross-links are not surprising given the symmetry in the trimers-of-dimers, nonetheless, these sites are ~15 Å apart. Furthermore, it is not clear why the N405 self cross-links also do not form, given that these residues are closer to each other than are copies of R394. The statement near the end of the second paragraph of the subsection “Biochemical validation of CheA conformational change in E. coli cells” is not accurate, given that the yields of the 394 self cross-links are quite different in the two experiments. Normalizing to this band, there is not much change between the 394/361 and 394/316 pairs. Even if the cross-linking is less for 316/394, it could mean that those resides are simply further apart in a dominant conformation or show reactivity differences (e.g. 405 vs. 394). There is also the question of what state the cells are in during cross-linking. The attractant serine is present during the experiment, but depending on the timing of the washes, the cells are likely adapted. How much of CheA is activated and how much is inhibited in these experiments? For only a few sites, as investigated here, it would be more powerful to detect an attractant depend effect on relative cross-linking of the reporters. As it stands, the cross-linking data primarily supports the general architecture, but does not make the dipping mechanism more compelling.
Although cross-linking experiments cannot catch the dynamic motion of dipping, the data support the appearance of a new interaction interface upon P4 dipping (by close proximity of the CheA – receptor residues), that otherwise would not be formed. Although limited in number, we tested the sites for three scenarios: exists in both states as positive control (I304/N405); only in the undipped state (D316/R394); and only in dipped state (E361/R394), along with necessary negative controls. Regarding the different cross-linking yields (R394) in two different experiments, we have repeated all the cross-linking in a single experimental setting, and updated the Figure 5B (previously Figure 6B) with new data. Additional controls were also added in Figure 5B.
We agree with the reviewer that low cross-linking intensity could mean that the residues are farther apart in a dominant conformation or show reactivity differences, in addition to low frequency of the conformation occurs. We have changed the discussion accordingly to reflect this (subsection “Biochemical validation of CheA conformational change in E. coli cells”, second paragraph).
Regarding the question about the state of the cells during cross-linking, the experiments were carried out in the presence of serine, and the cells are most likely adapted. What we measure is the ensemble of the bacterial population likely containing both activated and inhibited CheA. We don’t know how much CheA is in each state. We would like to point out that one of the major goals of this study is to put outa first plausible model with sufficient details of the basic chemotaxis core-signaling unit for researchers in the field. The cross-linking data support our computational model and the probable novel dipping state. It would be beyond the scope of this study to further detect signaling events with relative cross-linking of the reporters, and define the mechanisms of the dipping conformation. We will certainly follow up the leads and continue our investigation in this respect. Nevertheless, following the reviewer’s suggestions, we carried out the experiments to test the effect of serine on the existing cross-linking pairs under two different conditions: 1) cells were grown in the presence of serine, followed by cross-linking with or without serine washout; 2) cells were grown in the absence or presence of serine, followed by cross-linking. In both cases, the changes in the extent of cross-linking are not substantial or conclusive. A more thorough future investigation is needed.
7) The cell swimming assays need more description and from Figure 6 alone, it is not clear what parameter is being graphed. "Swimming ability" itself is a misnomer, as the cells can likely swim fine, but can't alternate tumbling properly to migrate in soft agar. This should be explained in the text or figure legend. Do all the mutants form attractant rings at the migration fronts indicative of chemotaxis? Or do some just show spreading, a consequence of some CheA activation, but no regulation (pseudotaxis). Photographs of the swarm plates for key mutants (or those that show differences should be provided as figure supplements). Furthermore, simply measuring the swarm radius does not distinguish a mechanistic defect from an assembly defect. Can an assessment be made (perhaps using the reconstitution system) if the mutants form arrays like wt?
We appreciate the reviewer’s comments. We have added detailed description of cell swimming assays in the Methods section (subsection “Soft agar Assays”). We also included the photographs of the representative soft agar plates for key mutants with controls in the revised Figure 5. Furthermore, we carried cryoEM analysis of the E. coli cells carrying these mutants and show that these cells are functional in forming chemotaxis clusters. These results are included in the new Figure 5—figure supplement 1.
8) In the subsection “3D density maps of CheA2-timer and CheA2-hexamer“, second paragraph, the electron density is less in the CheW/P5 contacts between neighboring core signaling particles than within the core complex, but this does not necessarily mean that the interfaces are weaker; they may instead be more structurally variable, and, hence, averaged out. Consider a change of wording. It is also difficult to see in Figure 3A and 3C that there is less density in the P5/W contacts between core particles. In Figure 3, color P5 and W differently, and demark the interfaces 1 and 2 that are being referred to in the text.
We agree with the reviewer’s point and changed the wording in the revised manuscript accordingly. We have clearly marked the interfaces 1 and 2 with arrows accordingly in Figure 3A and 3C, and used a darker surface color to display these interfaces.
9) This reviewer appreciates that the authors are being cautious with the interpretation of their data, but the reader is largely left to summarize what the findings mean for CheA activation. The mechanistic take home message should be more explicit.
We thank reviewer’s suggestion. We have added additional discussion on the implication of our findings (Discussion).
[Editors' note: further revisions were requested prior to acceptance, as described below.]
Reviewer #1:
1) Anisotropic resolution of the map.The authors present the angular distribution of the contributing subunits and argue that because is a good coverage of the tomography tilt range this concern can be disregarded. This is not a valid argument for two reasons. Firstly because the angular coverage is not good – high tilt angles are clearly underrepresented relative to low tilt angles, and this will cause a resolution anisotropy (it is not completeness of coverage, but uniformity of coverage that determines resolution anisotropy). Secondly, at high tilt the monolayer sample is much thicker and the projections have lower signal to noise. High and low tilts do not contribute equivalently to the final structure. This will also cause resolution anisotropy. I reiterate my initial concern – that the resolution of the structure is expected to be lower in Z than in X and Y. In the response to reviewers the authors show some isosurfaces with simulated wedges. It is not possible to sensibly assess the extent of anisotropic resolution from such images, and anyway, fitting is not based on isosurfaces, but on density. I am not persuaded that resolution anisotropy can be largely disregarded as the authors suggest.This is not an unusual problem and it should not be difficult for the authors to address this issue better. They should be clear in the manuscript that there is resolution anisotropy and make an attempt to measure its extent (previous publications have used for example FSC within cones or 3DSSR to assess anisotropic resolution). The potential effect of this on fitting and MDFF should then be considered. Ideally, this would be taken into account during simulation, but the authors will probably consider this too much work. In that case they should write that this was not taken into account, and discuss what the potential influence might be on the reliability of domain positioning or on the simulations.
We agree with the reviewer that the resolution of the structure is poorer in Z than in X and Y. To assess the degree of anisotropy in resolution, we calculated conical Fourier shell correlations as suggested by the reviewer (see Author response image 4). The overall resolution (FSC=0.143) is 11.3 Å (calculated from the same map with an updated mask to include just the CheA2-trimers, while the previous FSC was calculated using an extended mask), and the resolution in Z direction is 15.8 Å. We have revised the manuscript to include this in Figure 3—figure supplement 1A. We further repeated the MDFF exercise, taking anisotropic resolution into account during simulation by using the anisotropic FSC low-pass filtered map. The resulting MDFF model ((Author response image 4B, orange) is similar to the previous one (Author response image 4B, yellow), with an overall RMSD of 2.78Å. The map and MDFF model deposited at PDB and EMDB are being updated.
Author response image 4
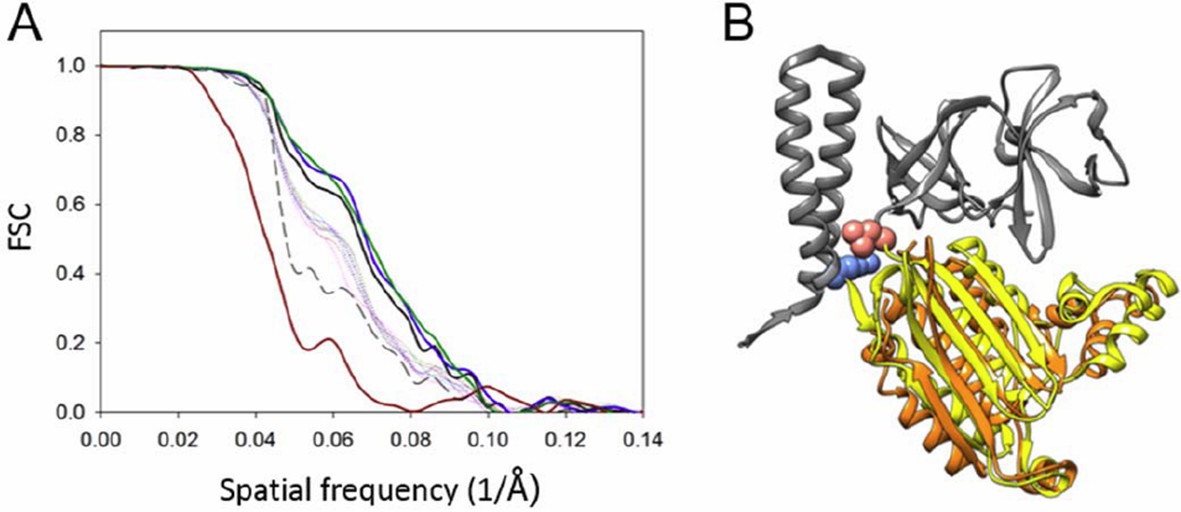
Resolution anisotropy.
(A) Gold-standard Fourier shell correlation (FSC) of the CheA2-trimer density map. The overall FSC of the map is plotted as a solid black line. The FSC curves for the conical Fourier shells along the X, Y, and Z directions are in solid green, blue and dark-red, respectively, and along the 10 other directions are in dotted lines. The previous FSC (dashed black line) was calculated from the same map but with a more extended mask. (B) MDFF model of the CheA-P4 domain from the anisotropic FSC filtered density map (orange), overlapped with the previous MDFF model (yellow). The pink and light blue spheres indicate the P3-C and P5-N termini, respectively. CheA-P3 and CheA-P5 domains are in gray.
2) Reliability and uniqueness of fit.This question was also asked by reviewer 3. How well does the EM density determine the position of the domains, in particular P4? From the authors response to reviewers it sounds like the position is not well defined, but that different positions still undergo dipping motions. I am still concerned that the orientation of P4 is not well defined by the EM map, that the starting orientation is critical to the MDFF analysis, and that this influences the interpretation of the dipping motion. The authors have access to the raw data and do not seem to be concerned by this. In that case they need to help the reader to assess the reliability of the model. Ideally by providing a metric for the goodness of fit, but minimally by an honest appraisal of the caveats, clearly and openly discussing the reliability of the fit, where alternative positions are possible, and how this might influence the interpretation. This should be in the main text of the manuscript.
We appreciate the reviewer’s comment and carried out additional docking exercises. We fit the CheA-P4 domain via rigid-body transformations starting from 10,000 random angular orientations and up to 20Å shifts from the center of the mass, to generate a metric for the goodness of fit. This fitting resulted in 23 distinct classes (separated by 3° and 3Å), as shown in Author response image 5A. The class of best fit (Author response image 5B, panel 1, with highest cross correlation and highest number of contributing fit) is similar to the MDFF model (Author response image 5B, Panel 10 with overlay). In addition to the best fit, one other possible fit is #5 (Author response image 5B, panel 5), given the proximity of the N and C termini of P4 to the P3 and P5 domain. This fit is less probable compared to the best fit, considering that it has a lower cross-correlation value, a much lower occupancy with ~ 1/3 the number of contributing fits, and the positions of P4-N and C termini are reversed (flipped), making it hard to connect the P3 and P5 termini with short linkers. In the revised manuscript, we have included the fitting metric and a discussion on the possible alternative P4 positions that might influence the interpretation (subsection “All-atom model of the T. maritima chemosensory array”, Figure 3—figure supplement 3).
Author response image 5

A metric for the goodness of fit for the docking of the CheA-P4 domain.
(A) Distribution of 23 classes of fits for the P4 domain starting from random orientations. (B) The models from the top 9 highest cross-correlation classes are shown in panels 1-9, with the cross-correlation values and number of contributing fits (%) indicated below. These 9 classes constitute 90.1% of total fits. Panel 10 is an overlay of the #1 fit (blue) with the MDFF model (orange). The red and blue spheres indicate the N and C termini of P4, respectively. The corresponding connecting termini from P3 and P5 are in light blue and pink, respectively. P3 and P5 domains are in gray.
Reviewer #3:
In their revised version of the manuscript, the authors have done a nice job of improving the paper and they have largely addressed my concerns. The one exception is the cross-linking studies. I still do not agree with the statement that "Taken together, our cross-linking experiments suggest that the CheA-P4 "dipped" conformation observed in silico is indeed sampled within the native chemosensory complex of E. coli." The inference here is that the cross-linking data supports the dipped conformation as a relevant state of the arrays. It may well be, but, the cross-linking data does not provide strong support for this supposition. Again, the only band to report on the dipped conformation (361/394) is quite weak, much weaker than the self 394-394 band. It's not uncommon to see some cross-linking between residues that are in proximity. In fact, I would be surprised if no cross-linking was observed, even if only the undipped conformation was represented. The authors can lean more on their mutagenesis data to support the dipped conformation, but I don't think the cross-linking makes the case.
We appreciate the reviewer’s comments. We have revised the manuscript to tone down the inference from the cross-linking experiments and changed the statement to “suggesting that the CheA-P4 "dipped" conformation observed in silico may have been sampled within the native chemosensory complex of E. coli” (subsection “Biochemical validation of CheA conformational change in E. coli cells”, second paragraph).
https://doi.org/10.7554/eLife.08419.044Download links
A two-part list of links to download the article, or parts of the article, in various formats.
Downloads (link to download the article as PDF)
Open citations (links to open the citations from this article in various online reference manager services)
Cite this article (links to download the citations from this article in formats compatible with various reference manager tools)
CryoEM and computer simulations reveal a novel kinase conformational switch in bacterial chemotaxis signaling
eLife 4:e08419.
https://doi.org/10.7554/eLife.08419


