Suppression of transcriptional drift extends C. elegans lifespan by postponing the onset of mortality
- The Scripps Research Institute, United States
- University of Cologne, Germany
- Indiana University School of Medicine, United States
Figures
Figure 1 with 1 supplement
Transcriptional drift-variance increases with age.
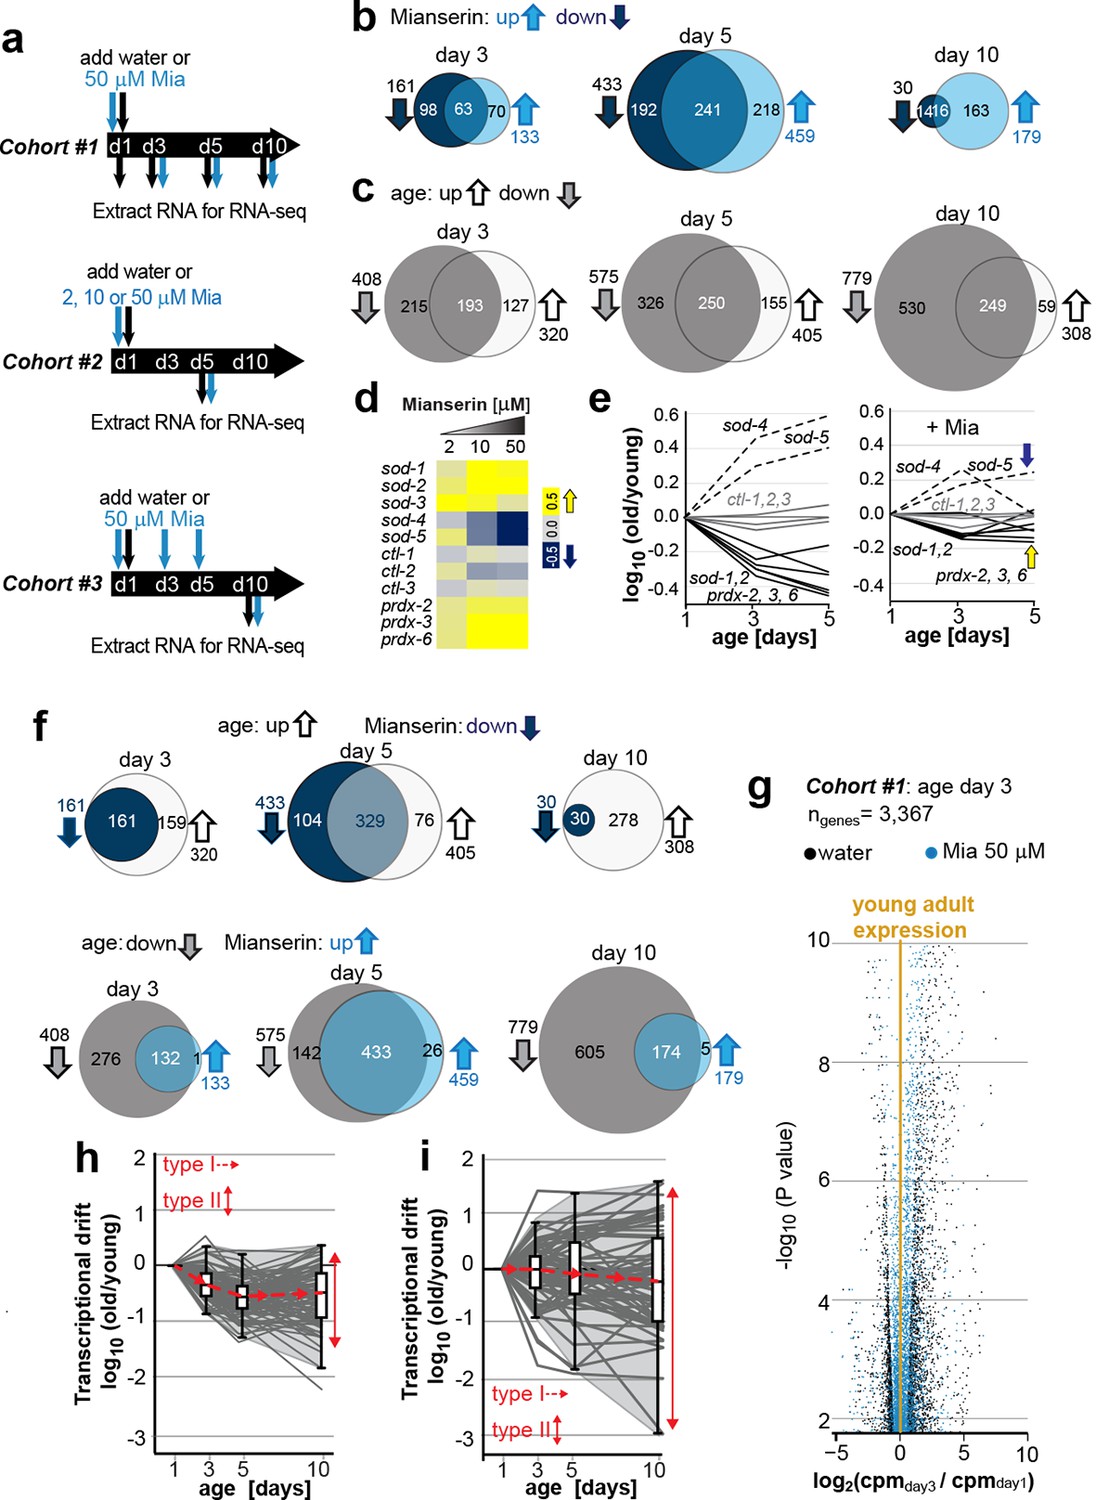
(a) Schematic of RNA-seq experiment. In cohort #1, water or mianserin was added on day 1 of adulthood and RNA samples were harvested on day 1 (water only), day 3 (d3), day 5 (d5) and day 10 (d10). In cohort #2, animals were treated with water or increasing concentrations of mianserin (2, 10 or 50 µM) on day 1 (d1) and RNA was harvested on day 5 (d5) for RNA-seq. In cohort #3, water or 50 µM mianserin was added on day 1, day 3, and day 5, and RNA was harvested on day 10 (d10) for RNA-seq. (b) Venn diagrams of the number of GOs enriched for genes that decrease expression with mianserin (down, dark blue circle) increase expression with mianserin (up, light blue circle) or are enriched for both (intersection). (c) Venn diagrams of the number of GOs enriched for genes that decrease expression with age (down, gray circle) increase expression with age (up, white circle) or are enriched for both (intersection). (d) Heat map depicting log2 changes in gene expression for oxidative stress genes elicited by increasing concentrations of mianserin (yellow, increased expression; blue, decreased expression) (e) Mianserin decreases expression of redox genes that increase with age and increases expression of genes that decrease with age. (f) Mianserin reverts age-associated changes on the level of GOs. Venn diagrams of the number of GOs enriched for genes that decrease expression with mianserin (down, dark blue circle) and increase with age (up, white circle) or vice versa (down with age, gray circle; up with mianserin, light blue circle). (g) Mianserin reverts age-associated changes on the level of individual genes. Volcano plot shows the negative log10 of P-values as a function of log2 fold changes of 3,367 genes that significantly change expression from day 1 to day 3 in samples of water-treated control animals (black) or samples from age-matched mianserin-treated animals (50 µM, blue). As animals age, gene expression levels change (“drift”) away from levels observed in young adults (yellow line). Mianserin treatment attenuates age-associated gene expression changes preserving expression levels as seen in young adults. (h) Drift-plot shows log fold change (old/young) as a function of age for each gene involved in oxidative phosphorylation (gray lines. KEGG: cel 04142). Superimposed are Tukey-style box-plots to graph the increases in drift-variance across the entire pathway. Gene expression changes are classified into type I, which describes activation or repression of the entire pathway and into type II, which describes changes among genes relative to each other (drift-variances), see red arrows. (i) Drift-plot for lysosomal genes (KEGG: cel 00190). See Figure 1—source data 1–5, Figure 1—figure supplement 1 and Table 1 for additional information on data-sets. Also see Methods section for transcriptional drift calculation in each figure panel.
-
Figure 1—source data 1
RNA-seq gene expression data.
- https://doi.org/10.7554/eLife.08833.004
-
Figure 1—source data 2
Gene ontologies changing in response to mianserin treatment.
- https://doi.org/10.7554/eLife.08833.005
-
Figure 1—source data 3
Gene ontologies changing in response to age.
- https://doi.org/10.7554/eLife.08833.006
-
Figure 1—source data 4
Differentially expressed genes in response to age.
- https://doi.org/10.7554/eLife.08833.007
-
Figure 1—source data 5
Differentially expressed genes in response to mianserin treatment.
- https://doi.org/10.7554/eLife.08833.008
Figure 1—figure supplement 1
This figure relates to Figure 1 in main text.
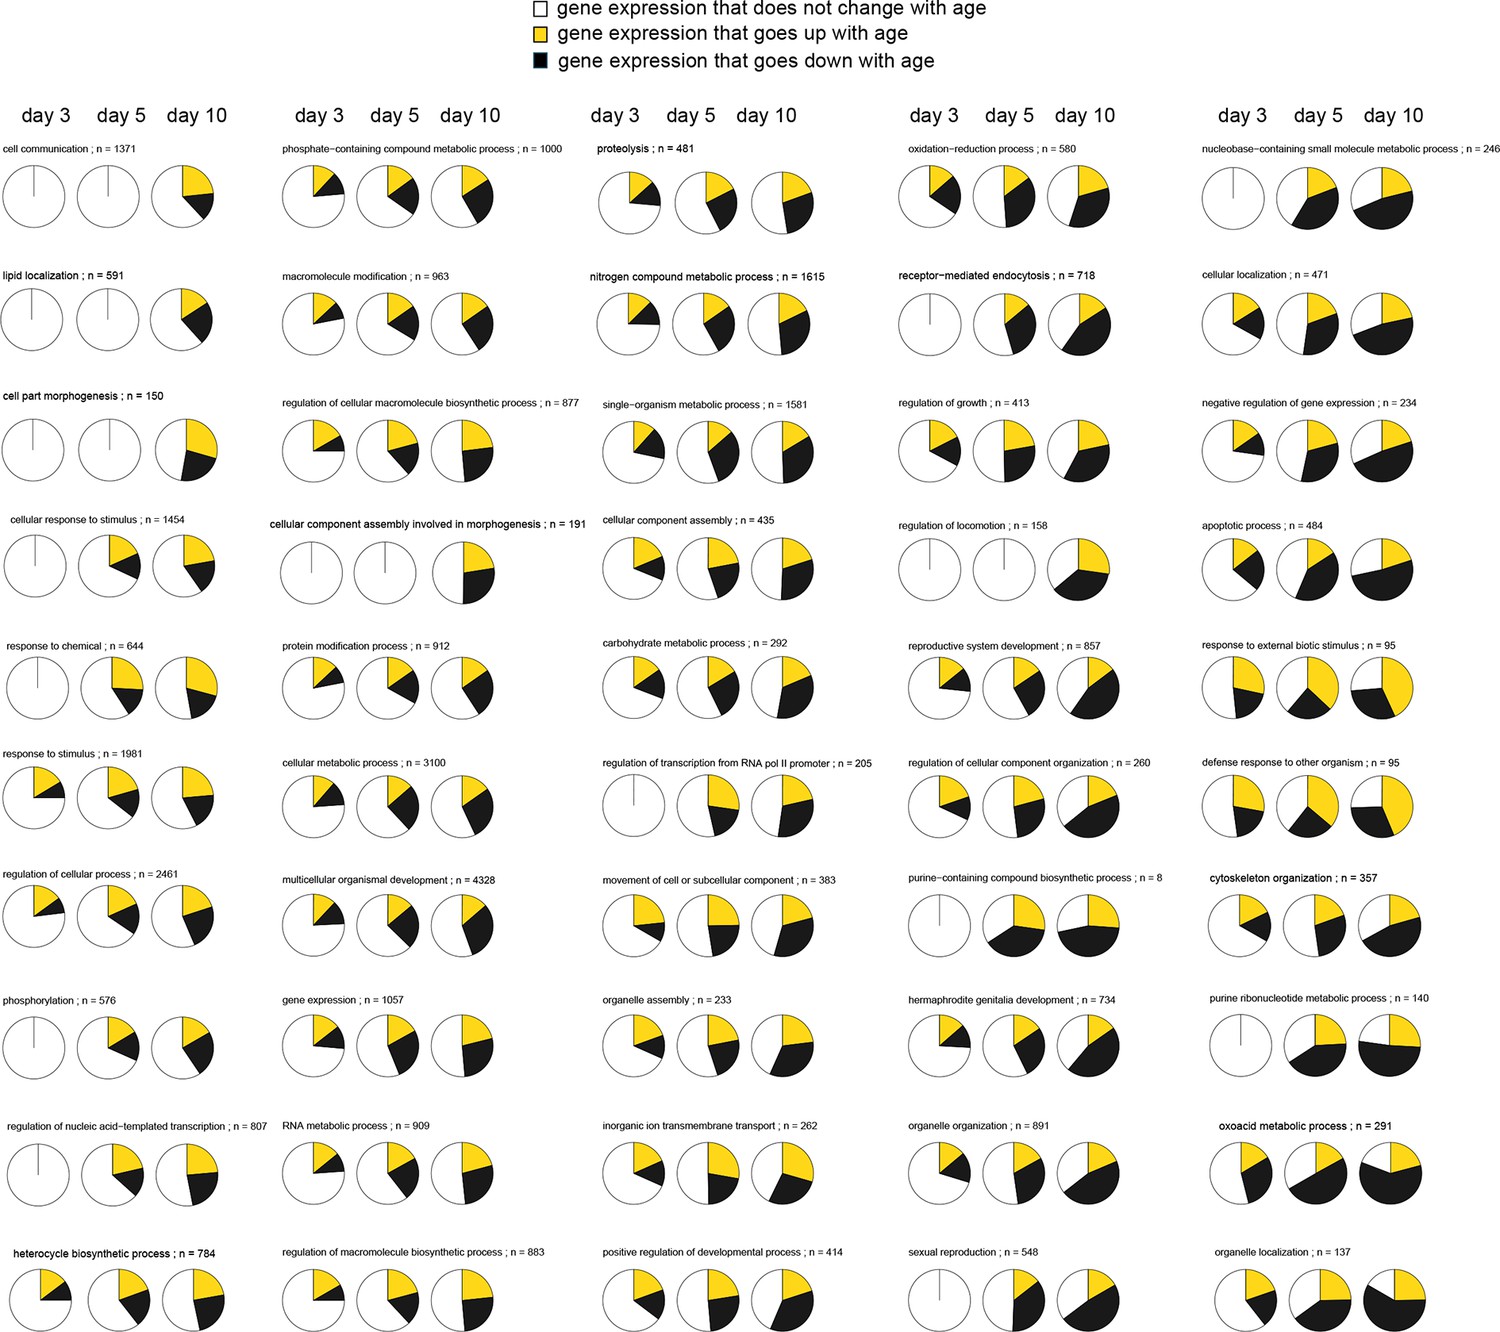
Expression patterns of GO annotations are disrupted with age. Representative pie charts show a cross-section of 50 out of 249 GO annotations enriched for genes that change in opposing direction as animals age (day 3, 5, and 10). The fraction of genes whose expression increase with age (yellow), the fraction of genes whose expression decrease with age (black), and the fraction of genes that maintain the expression seen in young day 1 adults (white) are shown. GOs are sorted and represented in the figure, starting with GOs that show the least disruption in the upper left, and the GO’s with the most extreme changes in the lower right. As animals’ age progresses from day 3, 5 to 10, more and more genes change expression in opposing directions disrupting the transcriptional stoichiometry observed in young day 1 animals. None of these 50 pie charts, as is, allows any statements on how the functional states of the physiological processes they represent change with age. The GO names and number of genes (n) belonging to each GO are shown.
Figure 2 with 2 supplements

Transcriptional drift-variance is attenuated by two longevity paradigms.
(a) Drift-plots show that mianserin attenuates increasing drift-variance with age. Note that drift-variance in 10-day-old mianserin-treated animals is the same as in untreated 3-day-old control animals (dotted red line). (b) Drift-plots show that increasing concentrations of mianserin cause drift-variance to decrease. Drift-variance was measured on day 5 by RNA-seq. (c) Corresponding to b, lifespan curves show that increasing concentrations of mianserin leads to a dose-dependent increase in survival. (d) Drift-plots show that initiating mianserin treatment at later ages reduces (d3) or abolishes (d5) its effect on transcriptional drift. Drift-variance was measured on day 10 by RNA-seq. (e) Corresponding to d, lifespan curves show initiating mianserin treatment at later ages reduces (d3) or abolishes (d5) its effect on lifespan. (f) Log-fold change of xenobiotic gene expression on day 10 when mianserin was added on day 1 or day 5, compared to control animals treated with water on day 1. Adding mianserin on day 1 or day 5 leads to comparable changes. (g) Drift-plots show daf-2 RNAi attenuates increasing drift-variance with age in a manner dependent on daf-16. Left: vector control, middle: daf-2 RNAi, right: daf-16/daf-2 RNAi. P-values for transcriptional drift plots are calculated by robust Levene’s test, which compare variances and not mean values. ***P<0.001. All error bars show drift-variance. See Figure 2—figure supplement 1–2 for additional information on calculating drift-variance and Table 2. Also, see Methods section for transcriptional drift calculation in each figure panel.
Figure 2—figure supplement 1

This figure relates to Figure 1c, d and Figure 5a,b in main text.
(a) Relationship of (a) fold-changes in gene expression as measured by qRT-PCR to b) RNA-seq counts to (c) transcriptional drift and (d) drift-variance plots. Fold-changes in gene expression in older (day 5) animals by mianserin are mostly caused by mianserin preserving the expression levels seen in young animals, thus leading to small drift-variances for groups of genes. (e) Additional transcriptional drift plots for aging C. elegans based on GEO data-sets GSE21784 and GSE46051. Transcriptional drift increases continuously up until at least day 20 towards the end of the lifespan. (f) Transcriptional drift is observed across the entire transcriptome. Random sub-sampling generating ten sets of ~1,000 genes and plotting their drift-variance shows that transcriptional drift is a phenomenon present across the entire transcriptome and is not driven by small subsets of genes.
Figure 2—figure supplement 2

Egg RNA does not affect drift-variance.
(a) DIC photomicrograph of eggs obtained from FUDR (120 µM final) treated animals. Eggs are terminally arrested around the ventral closure (“bean stage”, 400–500 nuclei) and show a shrunken cell mass. Birefringent gut granules are observed in the middle of the eggs. Images were taken ~48 hr after FUDR treatment. (Scale bar = 20 µm). (b) Number of adult worms that produce eggs 24 hr after FUDR treatment. Of the 298 worms evaluated, all of the animals developed germline with eggs inside. (c) Treatment with FUDR dramatically reduces the RNA content in eggs. Total RNA was extracted from FUDR-treated whole wt (N2) worms, from eggs isolated from FUDR-treated N2 worms after ~28 hr of FUDR treatment and from eggs from non-FUDR-treated N2 worms (the same time point as the RNA-seq young reference),. ***P<0.001, comparison between whole worms and eggs treated with FUDR, unpaired t-test, n=3, Error bars S.E.M; ##P<0.01, comparison between eggs treated with FUDR and no FUDR, unpaired t-test, n=3, Error bars S.E.M. (d) Electrophoresis of RNA extracted from whole worms or eggs isolated from FUDR treated animals. Same number of animals used for each sample. Comparison of equal volumes (10 µl) of total RNA loaded from FUDR-treated whole worms and eggs isolated from FUDR-treated animals, resolved in an agarose gel. (e) Original drift plot from Figure 2a is shown again for comparison. Note that box in the middle of the drift plot, which is a Tukey-plot, represents the interquartile mean, or 50% of the transcriptome that changes less with age. As drift is also observed in the interquartile mean, drift is not driven by extreme outliers, but by the majority of the genes across the entire transcriptome. (f) Drift plot generated from our data-set only including genes that were also detected in the CF512 sterile strain data-set from (Murphy et al., 2003). (g) Drift plot generated after removing 7,292 genes involved in egg-related functions detected from an eggs-only RNA-seq data-set (Osborne Nishimura et al., 2015). (h) DIC photomicrograph of eggs obtained from untreated and FUDR-treated animals carrying the Pgcy-8::GFP reporter for AFD neurons. (i) Fluorescence microscopy images show AFD neurons in eggs derived from untreated adults (left panel, white arrows) but not in eggs obtained from FUDR-treated adults (middle panel), confirming that FUDR treated eggs do not progress past the “bean stage”. FUDR does not inhibit Pgcy-8::GFP expression in adults (right panel). (j) Overlay of h and i. (k) Drift plots using our data-set including only the genes that are highly enriched in AFD, ASE or NSM neurons (Etchberger et al., 2007; Spencer et al., 2014). As FUDR arrests embryonic development before the birth of these neurons, the drift-plots cannot be influenced by RNA derived from eggs. Explanations for Figure 2—figure supplement 2 In the experiments presented in the main manuscript, we used FUDR to sterilize the animals from which we subsequently extracted RNA for RNA-seq. Thus, our samples contained fractions of egg RNA. The following control experiments and analysis show that the fraction of RNA in our samples coming from eggs is small and does not influence the phenomenon of transcriptional drift and its attenuation by mianserin. We first isolated eggs from FUDR-treated and untreated animals. FUDR treatment causes the cell mass inside the eggs to shrink and to terminally arrest at around bean stage (400–500 nuclei) (Figure 2—figure supplement 2a). FUDR-treated animals all contained similar numbers of eggs 24 hr after FUDR treatement (n=298) (Figure 2—figure supplement 2b) Note that many of the reported FUDR side-effects such as a lack of germline are not observed in 96-well liquid culture (Gomez-Amaro et al., 2015). Extracting RNA from whole worms or eggs isolated from whole worms showed that FUDR-treated eggs contained 5 times less RNA compared to untreated eggs. The fraction of RNA originating from the eggs in FUDR-treated worms was roughly ~5% (Figure 2—figure supplement 2c,d). We next asked whether this fraction could in anyway influence the phenomenon of transcriptional drift. The original plots (Figure 2a, or Figure 2—figure supplement 2e) of the entire transcriptome show that drift-variance increases in the interquartile mean (boxes) showing that it is not driven by a set of outlier genes, making it unlikely that the 5% fraction would influence drift-variance (Krzywinski and Altman, 2014). Nevertheless, to test possible interference, we calculated drift plots for various subsets of our data excluding transcrips expressed in eggs. The Murphy data were derived from CF512 (sterile) animals and thus any genes detected do not originate from eggs. We therefore excluded all genes not detected by Murphy et al from our data-set and recalculated drift. The resulting drift plot still shows a dramatic increase in drift-variance and attenuation by mianserin (Figure 2—figure supplement 2f). A potential problem with the approach used in Figure 2—figure supplement 2f is that it only removed eggs/germline genes that are specific for eggs but that it did not remove genes that are present in both eggs and soma. We therefore removed all genes that were identified in C. elegans eggs by RNA-seq from our data-set to plot Figure 2—figure supplement 2g (Osborne Nishimura et al., 2015). Of the 7,700 transcripts identified in eggs, 7,200 were present in our data-set. Note that this approach removes all ubiquitously expressed genes like ribosomal, mitochondrial and similar housekeeping genes that are present in both embryos and soma. Even though this operation removes only 7,200 out of 19,196 individual genes present in the data-set, these 7,200 genes account for 73% of total mRNA counts. Despite this dramatic reduction in overall mRNA transcripts, the drift plot combining the remaining 11, 904 genes (mostly low expressing genes) confirms an increase in drift-variance with age that is suppressed by mianserin (Figure 2—figure supplement 2g). To identify gene-sets that cannot possibly originate from the FUDR-treated eggs we exploited the specific arrest in embryonic development caused by FUDR. The DIC images suggested that FUDR arrests embryonic development before the birth of AFD, ASE and NSM neurons. If so, genes in our data-set that are specifically expressed in these neurons have to originate from the adult somatic tissue. To test that FUDR treatment prevents the birth of these neurons, we imaged eggs of C. elegans carrying a Pgcy-8::GFP transgene (AFD marker) (Figure 2—figure supplement 2h, i, j). Eggs from untreated animals showed a clear expression of the marker while FUDR-treated eggs did not (Figure 2—figure supplement 2i, j (n>100)). FUDR did not repress the expression of the Pgcy-8::GFP transgene in adults, showing that the lack of a Pgcy-8::GFP signal in FUDR-treated eggs is due to an arrest before the neurons are born and not due to inhibition of the reporter expression by FUDR. As AFD neurons are born before ASE and NSM neurons, these results suggested that none of these three neurons are present in FUDR-treated eggs (Sulston et al., 1983). After having established the absence of AFD, ASE and NSM neurons in eggs derived from FUDR treated animals, we then used the published gene-sets that are highly enriched in these three neuron types (AFD, ASE, NSM) to construct drift-plots (Etchberger et al., 2007; Spencer et al., 2014). Even for these highly restricted sets of genes, drift-variance dramatically increased with age and was repressed by mianserin. Taken together, these results show that the RNA contamination from FUDR-treated eggs is minimal and that this residual amount does not influence our results.
Figure 3

Preserving low drift-variances in redox pathways preserves redox capacity into old age.
(a) Model for the occurrence of transcriptional drift with age. Genes belonging to the same pathway appropriately respond to a stimulus but subsequently fail to return to steady-state levels. Repeated stimuli compound this effect leading to increases in transcriptional drift. If multiple genes within a pathway have propensity to drift in one or the other direction drift-variance increases with age. (b) Drift-plots show increases in drift-variance in multiple KEGG or GO annotations associated with redox processes. P-values compare variance, not mean, n: No. of genes in each category. *P<0.05, **P<0.01, ***P<0.001, Levene’s test. Error bars; drift-variance (c) Fold increase in survival of N2 wild-type (wt) mianserin treated vs. untreated animals when challenged with paraquat at different ages. The protective effect of mianserin increases with age. *P<0.05, t-test, Error bars: S.E.M. (d) Fold increase in survival of wt (N2) treated vs. untreated animals when challenged with paraquat on day 10. Delaying mianserin treatment into later life reduces its protective effect. *P<0.05, t-test, Error bars: S.E.M. (e) Linear regression of log fold-changes in gene expression with age for genes previously shown to change upon oxidative stress. Genes upregulated in response to oxidative stress (n=252) increase with age, and genes downregulated in response to oxidative stress decrease (n=88) with age. Mianserin attenuates age-associated expression changes in oxidative stress genes in the direction indicated by blue arrows. Shading: 95% confidence interval. ***P<0.001, Wilcoxon rank-sum test. See Tables 3–5 for detailed statistics and Methods section for transcriptional drift calculation in each figure panel.
Figure 4 with 1 supplement
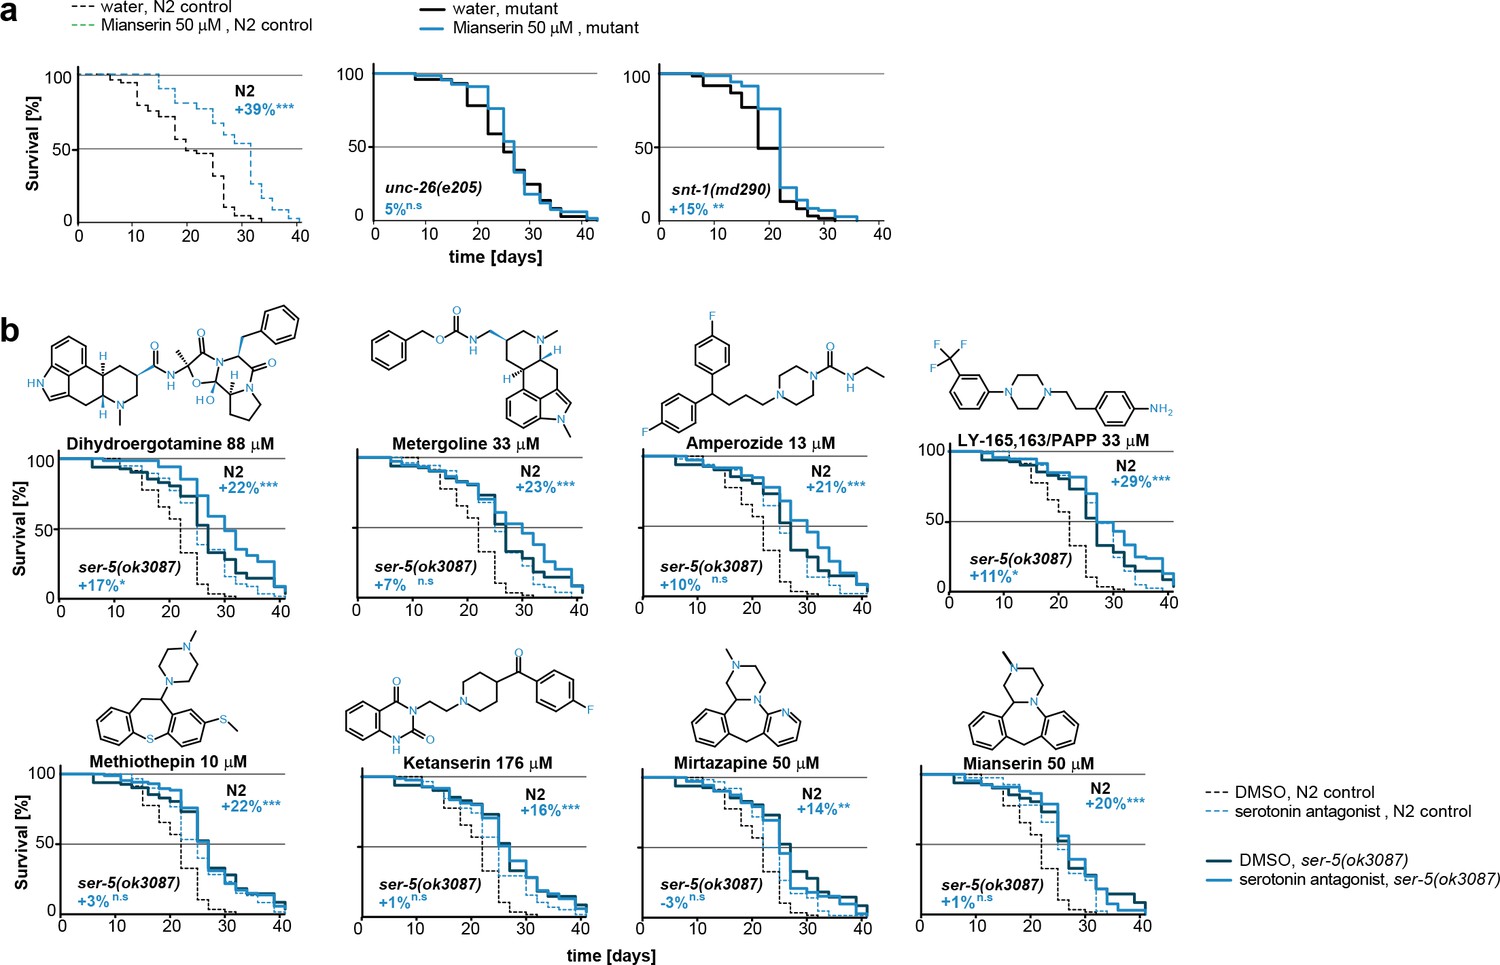
Preserving redox capacity into old age requires the serotonin receptor SER-5.
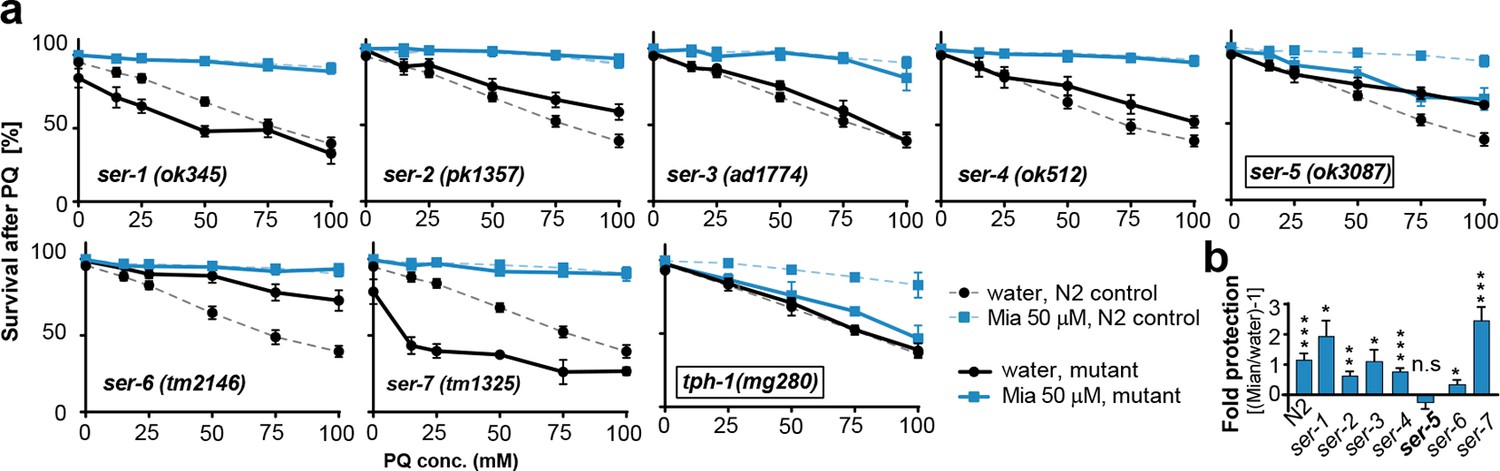
(a) Survival of wt (dotted lines) or serotonin receptor mutants and serotonin synthesis mutant (bold lines) treated with water (black) or mianserin (blue) on day 1, followed by increasing concentrations of paraquat on day 5. (b) Bar graph shows fold protection as a ratio of survival of mianserin-treated vs. water-treated GPCR mutant animals ((Mia/water)-1). *P<0.05, **P<0.01, ***P<0.001, n.s., not significant, t-test; Error bars: S.E.M. See Figure 4—figure supplement 1, and Tables 6 and 7 for detailed statistics.
Figure 4—figure supplement 1
This figure relates to Figure 4a in main text.
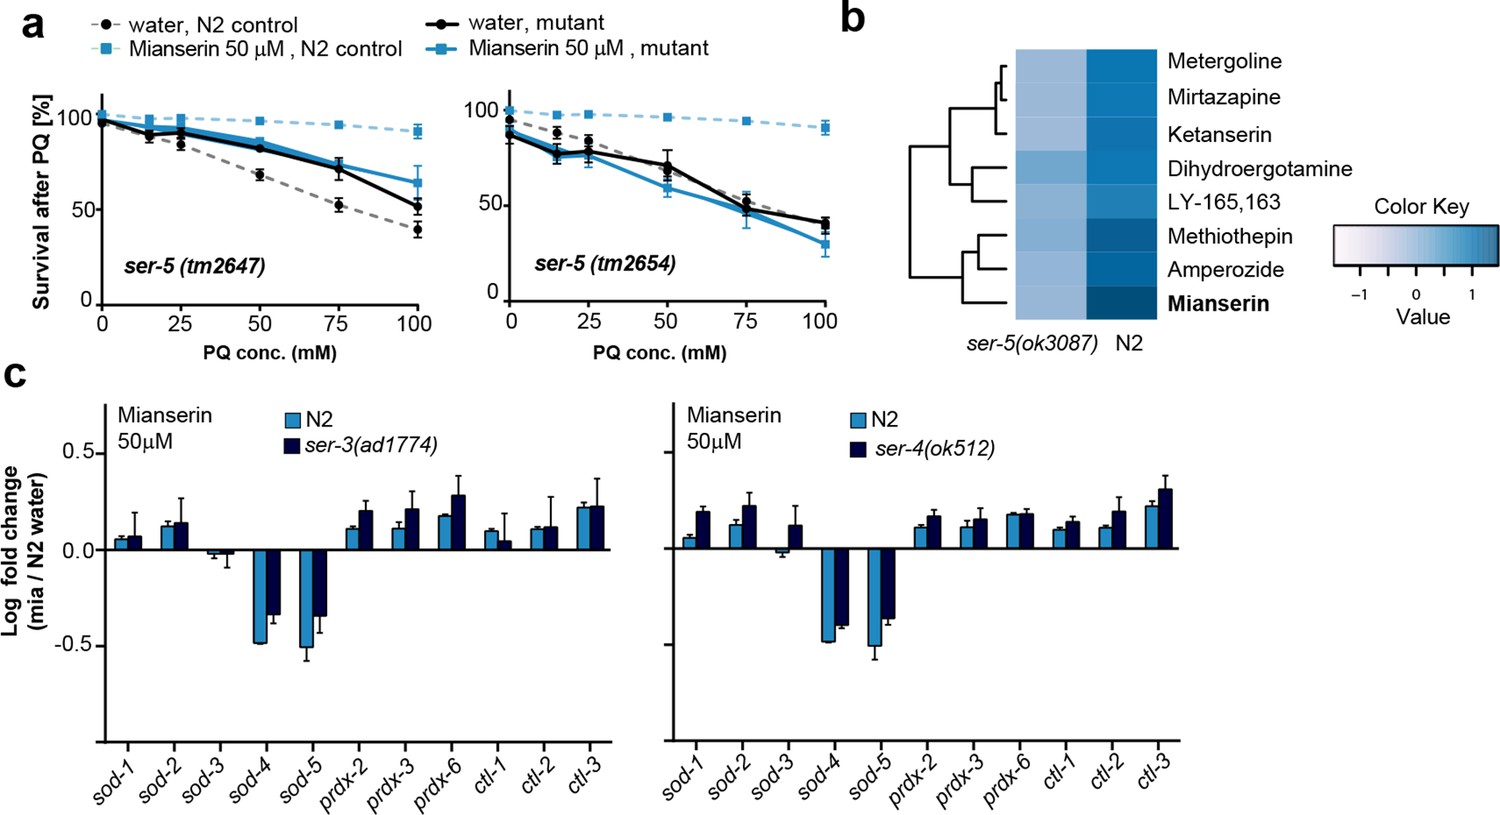
(a) Survival of wt and two independent alleles of ser-5 mutants, ser-5(tm2647) or ser-5(tm2654), treated with water or mianserin on day 1, followed by increasing concentrations of paraquat on day 5 of adulthood. (b) Hierarchical clustering of fold change [serotonin antagonist/DMSO] in protection of wt (N2) and ser-5 mutant animals, when treated with DMSO or serotonin antagonists on day 1 followed by paraquat on day 5, shows the degree of similarity in protection between 8 structurally different serotonin antagonists (left) and the requirement of ser-5 for these antagonists to protect from oxidative stress. (c) Bar graphs quantifying transcriptional drift by qRT-PCR (log fold-changes in gene expression) in 5-day-old N2 and ser-3(ad1774) animals (left panel), and N2 and ser-4(ok512) animals (right panel) treated with mianserin, relative to water-treated N2, determined by qRT-PCR. Mianserin treatment of ser-3(ad1774) and ser-4(ok512) strains result in a drift pattern, similar to those seen in N2. Thus, these receptors are neither required for drift-attenuation in redox genes, nor for the age-associated increase in oxidative stress resistance (Figure 4). Error bars: S.E.M. For detailed statistics, see Tables 6 and 7.
Figure 5 with 1 supplement

Mianserin attenuates drift-variance in peripheral tissues via SER-5.
(a) Bar graphs quantifying transcriptional drift (log fold-changes in gene expression) as measured by qRT-PCR in 5-day-old N2 and ser-5(ok3087) animals treated with mianserin, relative to water-treated N2. Mianserin treatment increases expression of genes drifting down with age and decreases expression of genes drifting up with age in N2, but not in ser-5(ok3087) mutants. (See 5b). *P<0.05, **P<0.01, ***P<0.001,t-test; Error bars: S.E.M. (b) Log fold-change in gene expression as a function of age for stress response genes shown in a. Blue arrows indicate how mianserin treatment corrects age-associated changes in gene expression toward an expression pattern as seen in young adults. (c) Bar graphs quantifying log fold-changes in gene expression in 1-day-old N2 and ser-5(ok3087) animals treated with paraquat, relative to water-treated N2 animals. N2 and ser-5(ok3087) show an identical response to paraquat. (d) Mianserin treatment on day 1 of adulthood enhances transcription of sod and hsp-16.x genes in response to an 8h paraquat treatment on day 5 in wt (N2) animals compared to water treated controls. In contrast, mianserin treatment of ser-5(ok3087) animals did not enhance transcription of sod and hsp-16.x genes. mRNA levels of genes were evaluated by qRT-PCR and plotted as fold induction (PQ/water) (Y-axis) for each gene. (e) Survival plot of mianserin-treated and untreated N2 and ser-5(ok3087) animals. ***P<0.001, *P<0.05, Mantel–Haenszel version of the log-rank test. f) Percent increase in lifespan as a function of mianserin concentration. Mutations in ser-5 or synaptic components rendered the animals partially or completely resistant to mianserin-induced lifespan extension. See Figure 5—figure supplement 1 for additional data, and Table 8 for detailed statistics.
Figure 5—figure supplement 1
This figure relates to Figure 5e in main text.
(a) Kaplan-Meier graphs for lifespan of wt (dotted line) and synaptic mutant animals treated with water (black) or mianserin (blue). Synaptic transmission is required for mianserin-induced lifespan extension. For detailed statistics, see Table 8. (b) Kaplan-Meier graphs for lifespan of wt (dotted lines), ser-5(ok3087), (solid lines) treated with DMSO or serotonin antagonists namely: Dihydroergotamine, Metergoline, Amperozide, Methiothepin, Ketanserin, Mirtazapine, LY-165,163/PAPP or mianserin, on day 1 of adulthood. All 8 serotonergic antagonists completely or partially depend on ser-5.
Figure 6 with 1 supplement
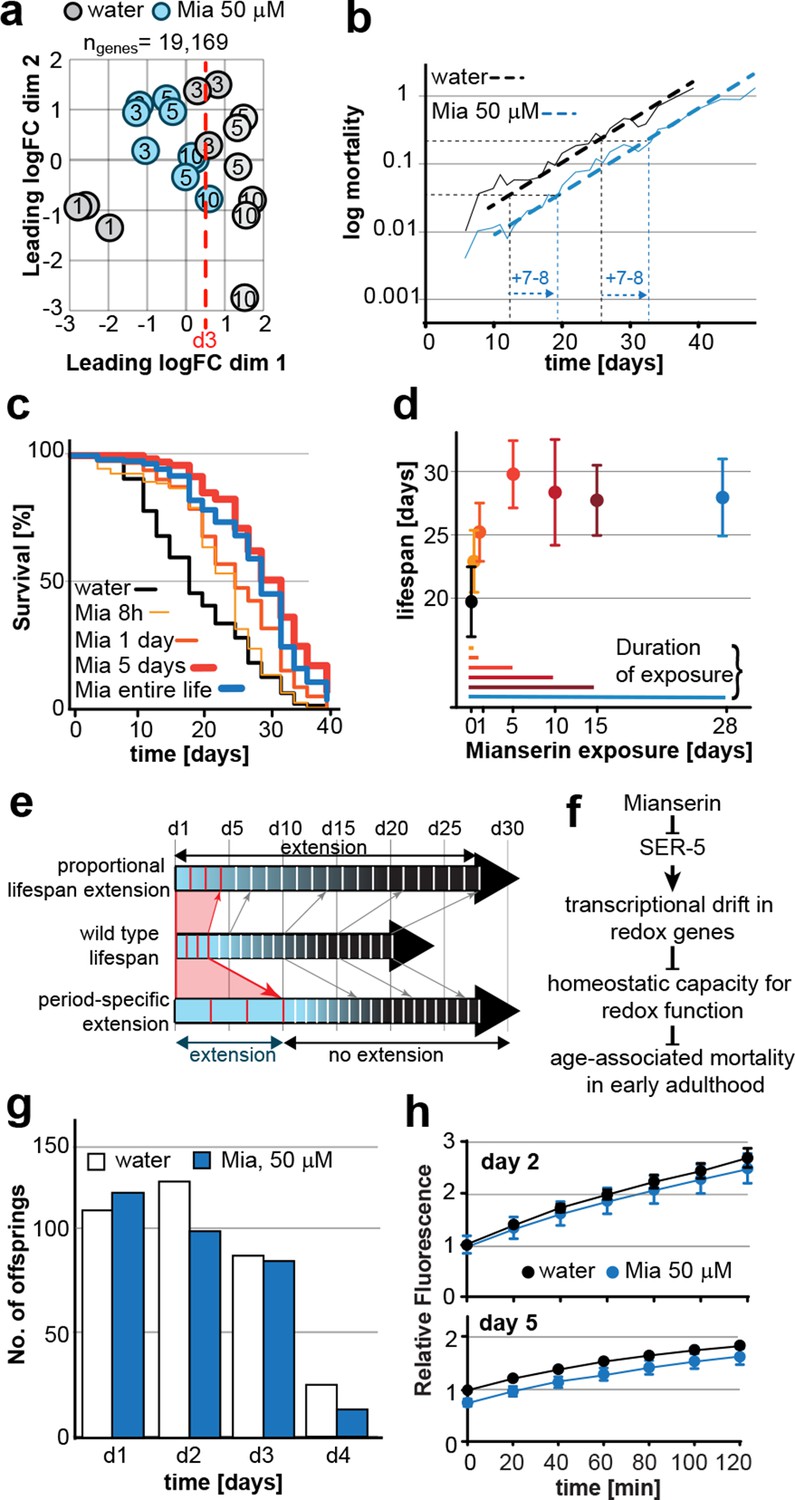
Mianserin extends lifespan by specifically slowing age-associated changes in early adulthood.
(a) PCA plot of RNA-seq data. Each circle represents one RNA-seq sample with the age, in days, indicated. Mianserin-treated day 10 samples show the same transcriptional age as untreated day 3 animals, dotted red line. (b) Mortality curves (moving average) constructed using Gompertz equation for lifespan experiments from 15 independent experiments of ~100 animals each treated with water or mianserin 50 µM (n>1500 total for each condition). Mianserin treatment causes a 7–8 day parallel shift in log mortality as compared to the water-treated animals. (c) Survival of wt animals treated with mianserin for 8 hr, 1 day, 5 days or throughout life was determined and compared to water treated control animals. Removing mianserin after 8 hr or 1 day lessens its effect on lifespan, while removing mianserin on day 5 or maintaining treatment throughout life showed a comparable effect. (d) Mean survival of wt animals treated with water or mianserin for 8 hr, 1 day, 5, 10, 15 days or throughout life was plotted as a function of mianserin exposure in days. Mianserin treatment for 5 to 10 days was required and sufficient for an optimal lifespan extension. (e) Distinct modes of lifespan extension: Proportional lifespan extension leads to a proportional extension across life whereas period-specific lifespan extension leads to a reduced rate of age-associated degeneration during a specific period only. Mianserin reduces the rate of age-associated changes in early adulthood, thereby postponing mortality levels by 7–8 days causing a ‘period-specific lifespan extension’. (f) Model for how mianserin modulates age-associated mortality in early adulthood. Blocking serotonergic signaling via SER-5 decreases transcriptional drift-variance with age in redox genes, leading to preserved homeostatic capacity in redox function, which subsequently delays age-associated mortality. (g) Mianserin does not affect reproductive longevity. Wt animals were treated with water or mianserin (50 µM) on day 1 followed by counting the number of viable eggs laid by them on day 1, day 2, day 3 and day 4. h) Chymotrypsin-like 26S proteasome activity measured from wt animals treated with water or mianserin (50 µM) on day 1 followed by proteasome activity assay on day 2 (upper panel) or day 5 (lower panel). Mianserin treatment does not lead to an increase in proteasome activity, unlike long lived germline-less animals. Error bars S.E.M. See Figure 6—figure supplement 1 for additional data and detailed statistics.
Figure 6—figure supplement 1
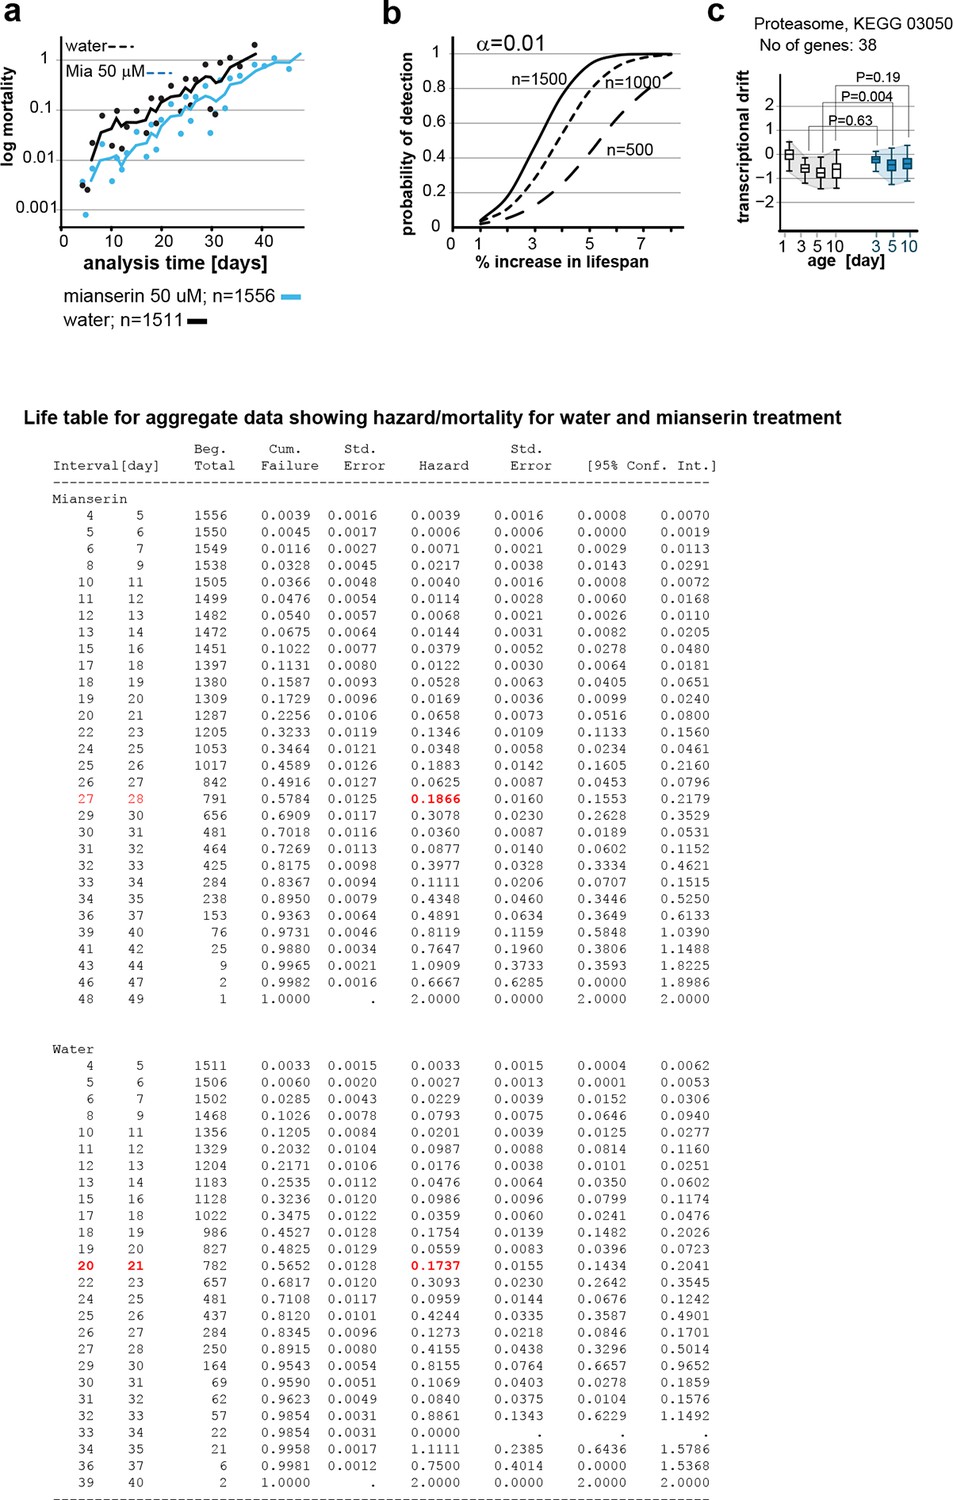
This figure relates to figure 6 in main text.
(a) Mortality curves constructed using Gompertz equation for lifespan experiments of wt (N2) animals from 15 independent experiments of ~100 animals each treated with water or mianserin 50 µM (n>1500 total for each condition). The shift in log mortality as a function of time with mianserin treatment is parallel to the water-treated animals. See table below for aggregate data showing hazard/mortality for water and mianserin treatment. (b) Power of detection for 500, 1000 and 1500 animals in each cohort as used in Figure 6b (α=0.01). Monte-Carlo simulations based on a parametric model derived from our data were used to determine the power of detection. A lifespan extension of 1 day corresponds to a 5% increase in lifespan. (c) Drift-plots show changes in drift-variance in proteasome pathway (KEGG annotation: 03050) associated with 38 genes involved in proteasome activity in animals treated with water or mianserin (50 µM) on day 1 and harvested on day 3, 5 and 10. Attenuation patterns of drift-variance with mianserin treatment corresponds functionally to changes in proteasome activity on day 2 and day 5 (See panel a). Mianserin slightly increases transcriptional drift on day 5 and slightly reduces proteasome activity function. P-values compare variance, not mean, **P<0.01, Levene’s test. Error bars; drift-variance.
Figure 7
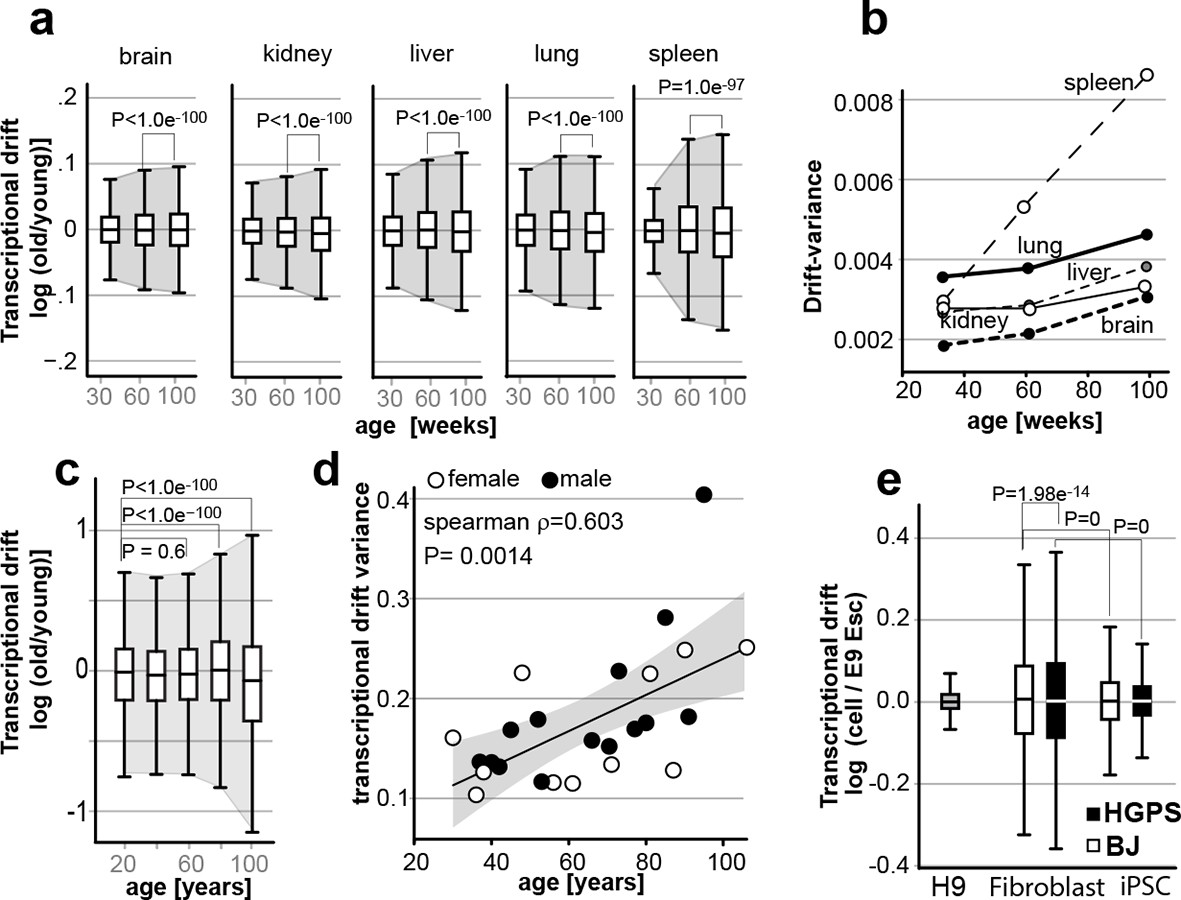
Transcriptional drift-variance increases with age in various species.
(a) Transcriptional drift-variance in gene expression from different mouse tissues aged 13 to 130 weeks. Drift-plots show an increase in drift-variance with age in mouse brain, kidney, liver, lung and spleen (b) Drift-variance plotted as a function of age for different organs. To obtain drift-variance values for young animals, a single transcriptome was set aside and used a reference. (c) Drift-plot for gene expression from 32 human brains (frontal cortex) plotted as a function of age in years. Data binned in 20-year increments. (d) Drift-variance plotted as a function of age in years for individuals. Each dot corresponds to one brain sample (frontal cortex). Shading indicates 95% confidence interval (ρ=0.603, P=0.0014). (e) Drift plots show a higher transcriptional drift-variance in BJ fibroblasts (BJ) and fibroblasts from Hutchinson Gilford progeria syndrome (HGPS), when compared to H9 embryonic stem cells. Reprogramming the BJ and HGPS cells to induced pluripotent stem cells (iPSCs) leads to a partial reversal of the transcriptional drift-variance to a lower variance corresponding to the young phenotype of the iPSCs. See Figure 2—figure supplement 1 for additional information on transcriptional drift calculation, and Methods section for transcriptional drift calculation in each figure panel.
Tables
Table 1
GO annotations enriched for genes upregulated by mianserin during all ages, assessed by RNA-seq (day 3, 5 and 10).
| GO | Enriched P-value |
|---|---|
| response to stimulus | 4.47E-08 |
| response to stress | 5.83E-05 |
| response to xenobiotic stimulus | 3.25E-07 |
| defense response | 4.66E-05 |
| innate immune response | 1.56E-02 |
| immune response | 1.62E-02 |
| immune system process | 1.62E-02 |
| aging | 6.63E-05 |
| multicellular organismal aging | 6.63E-05 |
| determination of adult lifespan | 6.63E-05 |
-
Note: No process was specifically downregulated for all three ages.
Table 2
Survival data for lifespan of RNA-seq experimental cohorts.
| Strain | Treatment | Treatment added on [day] | Conc. [µM] | Change in lifespan [%] Expt.1/ Expt.2/ Expt.3 | P-value Expt.1/ Expt.2/ Expt.3 | Mean Lifespan [days] Expt.1/ Expt.2/ Expt.3 | Number of animals Expt.1/ Expt.2/ Expt.3 |
|---|---|---|---|---|---|---|---|
| N2 | Water | d1 | 0 | 19.33/ 17.2/ 20.45 | 132/ 149/ 130 | ||
| N2 | Mia | d1 | 2 | +7/ +12/ -4 | 0.20/ 0.04/ 0.25 | 20.64/ 19.23/ 19.67 | 125/ 133/ 151 |
| N2 | Mia | d1 | 10 | +30/ +16/ +6 | 2.5E-07/ 3.7E-03/ 0.55 | 25.09/ 19.92/ 21.74 | 94/ 138/ 136 |
| N2 | Mia | d1 | 50 | +46/ +39/ +25 | 1.1E-19/ 1.9E-15/ 2.8E-08 | 28.25/ 23.92/ 25.63 | 95/ 131/ 125 |
| N2 | Mia | d3 | 50 | +15/ +14/ +1 | 2.0E-03/ 9.3E-04/ 0.29 | 22.23/ 19.69/ 20.75 | 121/ 134/ 152 |
| N2 | Mia | d5 | 50 | -8/ +8/ -2 | 0.18/ 0.06/ 0.84 | 17.79/ 18.52/ 20.13 | 123/ 151/ 139 |
-
Summary of all lifespan experiments performed in parallel for cohorts 1 and 2 of the RNA-seq studies in Figure 2c,e. The treatments, water or mianserin, at the indicated concentrations (conc.) were added on indicated day (D) of adulthood and lifespan (days) was scored until 95% of animals were dead in all tested conditions. All values (Change in lifespan [%], P-values) were calculated for the pairwise comparison between mianserin-treated and water-treated animals of the same condition, in 3 independent experiments (expts.). Statistical analysis was performed using the Mantel–Haenszel version of the log-rank test. Mean lifespan [days] and number of animals in each experiment are indicated.
Table 3
Gene ontology (GO) pathways of relevance to this study that are differentially regulated by mianserin.
| KEGG / GO ID | KEGG / GO Term | Number of Genes observed | Levene’s test for variance (Difference in transcriptional drift- variance) Water D1 vs. water Dx | Levene’s test for variance (Difference in transcriptional drift- variance) water Dy vs. mianserin Dy |
|---|---|---|---|---|
| Transcriptome | 19,196 | D3 : P < 1.0E-100 D5 : P < 1.0E-100 D10: P < 1.0E-100 | D3 : P < 1.0E-100 D5 : P < 1.0E-100 D10: P < 1.0E-100 | |
| KEGG:Cel00030 | Pentose phosphate pathway | 17 | D3 : P = 0.0096 D10: P <1.0E-5 | D3 : P <1.0E-4 D10: P = 0.01 |
| GO: 0006979 | Response to oxidative stress | 67 | D3 : P <1.0E-10 D10: P <1.0E-16 | D3 : P <1.0E-4 D10: P = 0.001 |
| GO: 0045454 | Cell redox homeostasis | 52 | D3 : P <1.0E-6 D10: P <1.0E-10 | D3 : P <1.0E-4 D10: P = 0.029 |
| GO: 006749 | Glutathione metabolism | 13 | D3 : P <1.0E-4 D10: P <1.0E-7 | D3 : P =0.041 D10: P <1.0E-4 |
| GO: 0007186 | G-protein coupled receptor signaling | 335 | D3 : P <1.0E-24 D10: P < 1.0E-100 | D3 : P <1.0E-4 D10: P <1.0E-4 |
| GO: 0016209 | Antioxidant activity | 34 | D3 : P <1.0E-8 D10: P <1.0E-10 | D3 : P = 0.002 D10: P = 0.06 |
-
Summary of gene changes with RNA-seq transcriptome analysis in Figure 3b.
-
GO ID is the Gene Ontology identification number.
-
GO Term is the Gene Ontology term for the biological process.
-
Dx = age in days for the animals indicated, compared with D1 water-treated animals.
-
Dy = age in days for water- and mianserin-treated animals, compared on the same day of age indicated.
Table 4
Survival data for paraquat stress resistance assays.
| Strain | Treatment | Conc.[µM] | Treatment added [day] | PQ 100 mM, added [day] | Survival after PQ [%] (expt. 1) | Survival after PQ [%] (expt. 2) | Survival after PQ [%] (expt. 3) | Mean, Survival after PQ [%] | S.D., Survival after PQ [%] | P-value | No. of wells | Total no. of animals |
|---|---|---|---|---|---|---|---|---|---|---|---|---|
| N2 | Water | 0 | d1 | d3 | 70.0 | 43.1 | 62.2 | 58.4 | 13.9 | 48 | 450 | |
| N2 | Mia | 50 | d1 | d3 | 87.3 | 47.9 | 53.9 | 63.0 | 21.3 | 7.72E-01 | 48 | 390 |
| N2 | Water | 0 | d1 | d5 | 55.8 | 56.2 | 66.1 | 59.3 | 5.8 | 48 | 436 | |
| N2 | Mia | 50 | d1 | d5 | 95.5 | 96.1 | 92.0 | 94.5 | 2.2 | 4.24E-03 | 48 | 435 |
| N2 | Water | 0 | d1 | d10 | 63.3 | 37.4 | 41.7 | 47.5 | 13.9 | 48 | 400 | |
| N2 | Mia | 50 | d1 | d10 | 91.9 | 82.1 | 85.4 | 86.4 | 5.0 | 2.85E-02 | 48 | 390 |
-
Summary of all stress resistance assays performed in Figure 3c. The treatments, water or mianserin (Mia), at the indicated concentrations (conc.) were added on day 1 of adulthood. Paraquat (PQ) was added to a final conc. of 100 mM on day 3 (d3), day 5 (d5) or day 10 (d10) and survival after PQ [%] was calculated 24 hr after the respective PQ addition. Mean and standard deviation (S.D.) of survival after PQ [%] were calculated from 3 independent experiments (expts.). P-values were calculated between water and mianserin-treatments on the same day of PQ addition, using unpaired t-test. The total number of wells and animals from which data were collected are indicated.
Table 5
Survival data for paraquat stress resistance assays, mianserin added on different days.
| Strain | Treatment | Conc. [µM] | Treatment added day | PQ 100 mM, added day | Survival [%] (expt. 1) | Survival [%] (expt. 2) | Survival [%] (expt. 3) | Mean, Survival [%] | S.D., Survival [%] | P-value | No. of wells | Total no. of animals |
|---|---|---|---|---|---|---|---|---|---|---|---|---|
| N2 | Water | 0 | d1 | d10 | 63.30 | 37.44 | 41.72 | 47.48 | 13.86 | 48 | 400 | |
| N2 | Mia | 50 | d1 | d10 | 91.85 | 82.05 | 85.38 | 86.43 | 4.97 | 2.85E-02 | 48 | 390 |
| N2 | Water | 0 | d3 | d10 | 63.97 | 41.25 | 38.35 | 47.85 | 14.02 | 48 | 403 | |
| N2 | Mia | 50 | d3 | d10 | 78.52 | 66.22 | 73.62 | 72.79 | 6.19 | 0.074 | 48 | 378 |
| N2 | Water | 0 | d5 | d10 | 57.31 | 43.83 | 42.57 | 47.90 | 8.16 | 48 | 387 | |
| N2 | Mia | 50 | d5 | d10 | 68.63 | 50.58 | 58.62 | 59.28 | 9.04 | 0.18 | 48 | 398 |
-
Summary of all stress resistance assays performed in Figure 3d. The treatments, water or mianserin (Mia), at the indicated concentrations (conc.) were added on day 1 (D1), day 3 (D3) or day 5 (D5) of adulthood. 100mM Paraquat (PQ) was added on day 10 (D10) and survival [%] was calculated after 24 hr. Mean and standard deviation (S.D) of survival [%] were calculated from 3 independent experiments (expts.). P-value calculated between water and mianserin-treatments using t-test. The total number of wells and animals from which data were collected are indicated.
Table 6
Survival data for paraquat stress resistance assays.
| Strain | Treatment | Conc. [µM] | PQ conc. [mM] | Survival after PQ [%] (expt. 1) | Survival after PQ [%] (expt. 2) | Survival after PQ [%] (expt. 3) | Survival after PQ [%] (expt. 4) | Survival after PQ [%] (expt. 5) | Survival after PQ [%] (expt. 6) | Mean, Survival after PQ [%] | S.D., Survival after PQ [%] | P-value | No. of wells | Total no. of animals |
|---|---|---|---|---|---|---|---|---|---|---|---|---|---|---|
| N2 | Water | 0 | 0 | 89.9 | 98.9 | 95.8 | 98.2 | 93.9 | 93.2 | 95.0 | 3.4 | 48 | 548 | |
| Water | 0 | 15 | 76.4 | 88 | 82 | 95.3 | 95.5 | 91.7 | 88.2 | 7.7 | 48 | 578 | ||
| Water | 0 | 25 | 74.2 | 91.3 | 80 | 92.9 | 85.1 | 80.4 | 84.0 | 7.2 | 48 | 531 | ||
| Water | 0 | 50 | 66.2 | 67.8 | 63.8 | 81.9 | 61.6 | 67.8 | 68.2 | 7.1 | 48 | 530 | ||
| Water | 0 | 75 | 50.1 | 61.1 | 44.1 | 64.6 | 42.4 | 51.8 | 52.4 | 8.9 | 48 | 545 | ||
| Water | 0 | 100 | 36.2 | 34.4 | 35.5 | 53.5 | 23 | 54.7 | 39.6 | 12.3 | 48 | 503 | ||
| Mia | 50 | 0 | 100 | 100 | 99.5 | 100 | 100 | 99.2 | 99.8 | 0.3 | 1.71E-02 | 48 | 556 | |
| Mia | 50 | 15 | 100 | 98.2 | 87.6 | 100 | 98.8 | 100 | 97.4 | 4.9 | 3.52E-02 | 48 | 523 | |
| Mia | 50 | 25 | 96.2 | 98.8 | 95 | 98.4 | 100 | 98.2 | 97.8 | 1.8 | 4.54E-03 | 48 | 529 | |
| Mia | 50 | 50 | 95 | 95.9 | 94.5 | 95.3 | 99 | 98.2 | 96.3 | 1.8 | 1.19E-04 | 48 | 536 | |
| Mia | 50 | 75 | 98.9 | 89.3 | 89.4 | 92.6 | 97.5 | 98.1 | 94.3 | 4.4 | 1.29E-05 | 48 | 516 | |
| Mia | 50 | 100 | 97.6 | 90.8 | 90.7 | 69.8 | 93.9 | 95.6 | 89.7 | 10.1 | 1.95E-05 | 48 | 539 | |
| ser-1 (ok345) | Water | 0 | 0 | 92 | 71.3 | 89.2 | 84.2 | 11.2 | 24 | 228 | ||||
| Water | 0 | 15 | 73.3 | 57.9 | 81.8 | 71.0 | 12.1 | 24 | 187 | |||||
| Water | 0 | 25 | 71.3 | 55.9 | 67.8 | 65.0 | 8.1 | 24 | 209 | |||||
| Water | 0 | 50 | 54.8 | 46.4 | 42.6 | 47.9 | 6.2 | 24 | 213 | |||||
| Water | 0 | 75 | 39.4 | 56.3 | 50.7 | 48.8 | 8.6 | 24 | 213 | |||||
| Water | 0 | 100 | 24.2 | 27.3 | 46.6 | 32.7 | 12.1 | 24 | 224 | |||||
| Mia | 50 | 0 | 100 | 100 | 100 | 100 | 0.0 | 0.13 | 24 | 215 | ||||
| Mia | 50 | 15 | 98.8 | 97.7 | 97.6 | 98.0 | 0.7 | 0.06 | 24 | 211 | ||||
| Mia | 50 | 25 | 97.9 | 94.2 | 98.4 | 96.8 | 2.3 | 1.51E-02 | 24 | 194 | ||||
| Mia | 50 | 50 | 94.8 | 95.4 | 97 | 95.7 | 1.1 | 4.52E-03 | 24 | 224 | ||||
| Mia | 50 | 75 | 93.9 | 89.9 | 92.4 | 92.1 | 2.0 | 9.87E-03 | 24 | 232 | ||||
| Mia | 50 | 100 | 87.4 | 89.6 | 89.5 | 88.8 | 1.2 | 1.45E-02 | 24 | 234 | ||||
| ser-2 (pk1357) | Water | 0 | 0 | 100 | 100 | 95.5 | 100 | 98.9 | 2.3 | 32 | 278 | |||
| Water | 0 | 15 | 88 | 97.5 | 73.7 | 92.2 | 87.9 | 10.2 | 32 | 239 | ||||
| Water | 0 | 25 | 90.3 | 100 | 83 | 83.2 | 89.1 | 8.0 | 32 | 206 | ||||
| Water | 0 | 50 | 76.7 | 87.2 | 73.7 | 62.7 | 75.1 | 10.1 | 32 | 254 | ||||
| Water | 0 | 75 | 73.9 | 73.2 | 65.2 | 53 | 66.3 | 9.7 | 32 | 220 | ||||
| Water | 0 | 100 | 72 | 59.6 | 54.4 | 47.7 | 58.4 | 10.3 | 32 | 220 | ||||
| Mia | 50 | 0 | 98.9 | 100 | 100 | 100 | 99.7 | 0.6 | 0.51 | 32 | 231 | |||
| Mia | 50 | 15 | 100 | 100 | 100 | 100 | 100 | 0.0 | 0.10 | 32 | 255 | |||
| Mia | 50 | 25 | 98.9 | 100 | 98.9 | 96.9 | 98.7 | 1.3 | 0.10 | 32 | 228 | |||
| Mia | 50 | 50 | 100 | 100 | 95.5 | 96.9 | 98.1 | 2.3 | 1.71E-02 | 32 | 243 | |||
| Mia | 50 | 75 | 98.9 | 95 | 96.8 | 91.8 | 95.6 | 3.0 | 6.35E-03 | 32 | 245 | |||
| Mia | 50 | 100 | 97 | 88.7 | 92.3 | 95.4 | 93.4 | 3.7 | 3.80E-03 | 32 | 210 | |||
| ser-3 (ad1774) | Water | 0 | 0 | 100 | 100 | 92.6 | 97.5 | 4.3 | 24 | 176 | ||||
| Water | 0 | 15 | 89 | 88.5 | 86.8 | 88.1 | 1.2 | 24 | 174 | |||||
| Water | 0 | 25 | 90.5 | 85.4 | 85.2 | 87.0 | 3.0 | 24 | 216 | |||||
| Water | 0 | 50 | 81.3 | 74 | 72.1 | 75.8 | 4.9 | 24 | 176 | |||||
| Water | 0 | 75 | 70.8 | 48.6 | 58.9 | 59.4 | 11.1 | 24 | 169 | |||||
| Water | 0 | 100 | 43.7 | 46.5 | 30.1 | 40.1 | 8.8 | 24 | 140 | |||||
| Mia | 50 | 0 | 98.2 | 100 | 95.8 | 98.0 | 2.1 | 0.88 | 24 | 176 | ||||
| Mia | 50 | 15 | 98.9 | 100 | 98.4 | 99.1 | 0.8 | 3.25E-04 | 24 | 228 | ||||
| Mia | 50 | 25 | 93.8 | 100 | 90.2 | 94.7 | 5.0 | 0.10 | 24 | 173 | ||||
| Mia | 50 | 50 | 98.1 | 100 | 93.8 | 97.3 | 3.2 | 4.97E-03 | 24 | 174 | ||||
| Mia | 50 | 75 | 92.4 | 95 | 91.8 | 93.1 | 1.7 | 3.20E-02 | 24 | 197 | ||||
| Mia | 50 | 100 | 93.4 | 65.6 | 82.8 | 80.6 | 14.0 | 1.92E-02 | 24 | 180 | ||||
| ser-4 (ok512)water | 0 | 0 | 100 | 87.6 | 100 | 98.6 | 96.6 | 6.0 | 32 | 249 | ||||
| Water | 0 | 15 | 100 | 72.6 | 91.3 | 84.4 | 87.1 | 11.6 | 32 | 262 | ||||
| Water | 0 | 25 | 98.2 | 67.9 | 72.5 | 85.5 | 81.0 | 13.7 | 32 | 224 | ||||
| Water | 0 | 50 | 88 | 67.1 | 83.3 | 63.5 | 75.5 | 12.0 | 32 | 229 | ||||
| Water | 0 | 75 | 69 | 47.2 | 75.8 | 61.4 | 63.4 | 12.3 | 32 | 225 | ||||
| Water | 0 | 100 | 56.3 | 48.3 | 60 | 43.2 | 52.0 | 7.6 | 32 | 204 | ||||
| Mia | 50 | 0 | 100 | 95.9 | 100 | 100 | 99.0 | 2.1 | 0.49 | 32 | 212 | |||
| Mia | 50 | 15 | 96.9 | 97.2 | 97.5 | 97.7 | 97.3 | 0.4 | 0.21 | 32 | 228 | |||
| Mia | 50 | 25 | 97.5 | 100 | 91.7 | 95.5 | 96.2 | 3.5 | 0.11 | 32 | 230 | |||
| Mia | 50 | 50 | 93.8 | 96.8 | 96.4 | 95.3 | 95.6 | 1.3 | 4.31E-02 | 32 | 261 | |||
| Mia | 50 | 75 | 100 | 91.5 | 88.1 | 96.5 | 94.0 | 5.3 | 9.66E-03 | 32 | 227 | |||
| Mia | 50 | 100 | 96.9 | 86.5 | 90.3 | 89 | 90.7 | 4.4 | 3.75E-04 | 32 | 252 | |||
| ser-5 (ok3087) | Water | 0 | 0 | 98.8 | 92.2 | 99 | 96.7 | 3.9 | 24 | 206 | ||||
| Water | 0 | 15 | 91.1 | 83.6 | 85.5 | 86.7 | 3.9 | 24 | 230 | |||||
| Water | 0 | 25 | 86.2 | 71.6 | 88.2 | 82.0 | 9.1 | 24 | 222 | |||||
| Water | 0 | 50 | 83.2 | 67.5 | 75.9 | 75.5 | 7.9 | 24 | 222 | |||||
| Water | 0 | 75 | 68.4 | 64 | 77 | 69.8 | 6.6 | 24 | 216 | |||||
| Water | 0 | 100 | 65.1 | 58.2 | 62.9 | 62.1 | 3.5 | 24 | 232 | |||||
| Mia | 50 | 0 | 98.6 | 93.9 | 99.2 | 97.2 | 2.9 | 0.85 | 24 | 248 | ||||
| Mia | 50 | 15 | 96.2 | 92.9 | 97.4 | 95.5 | 2.3 | 3.90E-02 | 24 | 221 | ||||
| Mia | 50 | 25 | 95 | 78.4 | 90.9 | 88.1 | 8.6 | 0.45 | 24 | 184 | ||||
| Mia | 50 | 50 | 89.5 | 77.4 | 82.9 | 83.3 | 6.1 | 0.25 | 24 | 219 | ||||
| Mia | 50 | 75 | 73.2 | 55.7 | 72.5 | 67.1 | 9.9 | 0.72 | 24 | 213 | ||||
| Mia | 50 | 100 | 64 | 54.6 | 79.4 | 66.0 | 12.5 | 0.65 | 24 | 200 | ||||
| ser-5 (tm2647) | Water | 0 | 0 | 97.2 | 97.3 | 96.9 | 97.1 | 0.2 | 24 | 248 | ||||
| Water | 0 | 15 | 88.8 | 91.2 | 87.3 | 89.1 | 2.0 | 24 | 230 | |||||
| Water | 0 | 25 | 94.4 | 89.9 | 85.8 | 90.0 | 4.3 | 24 | 227 | |||||
| Water | 0 | 50 | 79.5 | 84.6 | 81.7 | 81.9 | 2.6 | 24 | 228 | |||||
| Water | 0 | 75 | 79.9 | 73.5 | 60.2 | 71.2 | 10.0 | 24 | 248 | |||||
| Water | 0 | 100 | 51.6 | 59 | 44.1 | 51.6 | 7.5 | 24 | 224 | |||||
| Mia | 50 | 0 | 96.7 | 99.2 | 94.3 | 96.7 | 2.5 | 0.80 | 24 | 233 | ||||
| Mia | 50 | 15 | 96.7 | 88.4 | 95 | 93.4 | 4.4 | 0.23 | 24 | 246 | ||||
| Mia | 50 | 25 | 97.2 | 88.5 | 92.4 | 92.7 | 4.4 | 0.49 | 24 | 187 | ||||
| Mia | 50 | 50 | 83.7 | 87.8 | 85.4 | 85.6 | 2.1 | 0.13 | 24 | 234 | ||||
| Mia | 50 | 75 | 69.7 | 77.3 | 73.5 | 73.5 | 3.8 | 0.74 | 24 | 203 | ||||
| Mia | 50 | 100 | 46.4 | 75.1 | 70.3 | 63.9 | 15.4 | 0.30 | 24 | 196 | ||||
| ser-5 (tm2654) | Water | 0 | 0 | 81.5 | 96.3 | 83.4 | 87.1 | 8.1 | 24 | 232 | ||||
| Water | 0 | 15 | 68.8 | 86.6 | 75.9 | 77.1 | 9.0 | 24 | 223 | |||||
| Water | 0 | 25 | 77.1 | 89.1 | 69.1 | 78.4 | 10.1 | 24 | 226 | |||||
| Water | 0 | 50 | 55.2 | 79.8 | 78.4 | 71.1 | 13.8 | 24 | 254 | |||||
| Water | 0 | 75 | 47.5 | 42.5 | 55.3 | 48.4 | 6.5 | 24 | 209 | |||||
| Water | 0 | 100 | 41.2 | 36 | 45.8 | 41.0 | 4.9 | 24 | 215 | |||||
| Mia | 50 | 0 | 83.7 | 96.3 | 90.4 | 90.1 | 6.3 | 0.63 | 24 | 232 | ||||
| Mia | 50 | 15 | 73.7 | 70.3 | 82.6 | 75.5 | 6.4 | 0.82 | 24 | 232 | ||||
| Mia | 50 | 25 | 66.9 | 73.7 | 88.2 | 76.3 | 10.9 | 0.81 | 24 | 184 | ||||
| Mia | 50 | 50 | 54.5 | 68.8 | 54.6 | 59.3 | 8.2 | 0.29 | 24 | 200 | ||||
| Mia | 50 | 75 | 34.9 | 41.9 | 66.5 | 47.8 | 16.6 | 0.95 | 24 | 227 | ||||
| Mia | 50 | 100 | 18.2 | 30.6 | 40.7 | 29.8 | 11.3 | 0.22 | 24 | 187 | ||||
| ser-6 (tm2146) | Water | 0 | 0 | 98.9 | 96.9 | 98.6 | 100 | 98.6 | 1.3 | 32 | 230 | |||
| Water | 0 | 15 | 95.1 | 89.6 | 96.5 | 93.7 | 3.6 | 32 | 260 | |||||
| Water | 0 | 25 | 97.7 | 87.5 | 90.3 | 84.8 | 90.1 | 5.6 | 32 | 221 | ||||
| Water | 0 | 50 | 95.3 | 97.5 | 84.8 | 78.1 | 88.9 | 9.1 | 32 | 256 | ||||
| Water | 0 | 75 | 84.8 | 87.1 | 77 | 63.5 | 78.1 | 10.6 | 32 | 265 | ||||
| Water | 0 | 100 | 82.4 | 78.1 | 77.9 | 53 | 72.9 | 13.4 | 32 | 253 | ||||
| Mia | 50 | 0 | 100 | 93.3 | 100 | 96.9 | 97.6 | 3.2 | 0.57 | 32 | 278 | |||
| Mia | 50 | 15 | 98.8 | 96.4 | 92.4 | 95.9 | 3.2 | 0.49 | 32 | 230 | ||||
| Mia | 50 | 25 | 97.9 | 97.5 | 96.4 | 91.3 | 95.8 | 3.0 | 0.14 | 32 | 190 | |||
| Mia | 50 | 50 | 100 | 100 | 88.6 | 92.5 | 95.3 | 5.7 | 0.29 | 32 | 252 | |||
| Mia | 50 | 75 | 92.2 | 100 | 88.5 | 88.9 | 92.4 | 5.3 | 0.07 | 32 | 242 | |||
| Mia | 50 | 100 | 95.6 | 91.3 | 93.4 | 95.7 | 94.0 | 2.1 | 4.92E-02 | 32 | 221 | |||
| ser-7 (tm1325) | Water | 0 | 0 | 68.1 | 73.3 | 94.5 | 78.6 | 14.0 | 24 | 200 | ||||
| Water | 0 | 15 | 48.1 | 49.6 | 32.4 | 43.4 | 9.5 | 24 | 142 | |||||
| Water | 0 | 25 | 45.7 | 42.9 | 30.9 | 39.8 | 7.9 | 24 | 152 | |||||
| Water | 0 | 50 | 38 | 37.8 | 36.5 | 37.4 | 0.8 | 24 | 152 | |||||
| Water | 0 | 75 | 16.4 | 20.2 | 41.8 | 26.1 | 13.7 | 24 | 160 | |||||
| Water | 0 | 100 | 25.1 | 23.2 | 31.6 | 26.6 | 4.4 | 24 | 134 | |||||
| Mia | 50 | 0 | 98.8 | 98.9 | 100 | 99.2 | 0.7 | 0.13 | 24 | 217 | ||||
| Mia | 50 | 15 | 95.8 | 93.8 | 97.2 | 95.6 | 1.7 | 9.18E-03 | 24 | 212 | ||||
| Mia | 50 | 25 | 100 | 93.4 | 97.4 | 96.9 | 3.3 | 2.25E-03 | 24 | 193 | ||||
| Mia | 50 | 50 | 88.5 | 92 | 94.6 | 91.7 | 3.1 | 5.30E-04 | 24 | 179 | ||||
| Mia | 50 | 75 | 91.3 | 92.4 | 89.4 | 91.0 | 1.5 | 1.37E-02 | 24 | 189 | ||||
| Mia | 50 | 100 | 96.9 | 91.7 | 81.6 | 90.1 | 7.8 | 8.94E-04 | 24 | 186 | ||||
| tph-1 (mg280) | Water | 0 | 0 | 97.2 | 96.1 | 98.2 | 97.2 | 1.1 | 24 | 148 | ||||
| Water | 0 | 25 | 66.9 | 67.8 | 76 | 70.2 | 5.0 | 24 | 156 | |||||
| Water | 0 | 50 | 52 | 47.1 | 56.9 | 52.0 | 4.9 | 24 | 164 | |||||
| Water | 0 | 75 | 32.2 | 34.6 | 48 | 38.3 | 8.5 | 24 | 148 | |||||
| Water | 0 | 100 | 12.2 | 6.7 | 42.3 | 20.4 | 19.2 | 24 | 169 | |||||
| Mia | 50 | 0 | 94.3 | 100 | 96.9 | 97.1 | 2.9 | 0.96 | 24 | 161 | ||||
| Mia | 50 | 25 | 90.4 | 58.7 | 78.6 | 75.9 | 16.0 | 0.61 | 24 | 159 | ||||
| Mia | 50 | 50 | 64.8 | 61.7 | 69 | 65.2 | 3.7 | 2.33E-02 | 24 | 158 | ||||
| Mia | 50 | 75 | 52.9 | 28.9 | 57.9 | 46.6 | 15.5 | 0.47 | 24 | 143 | ||||
| Mia | 50 | 100 | 8.7 | 1.8 | 40.6 | 17.0 | 20.7 | 0.85 | 24 | 150 |
-
Summary of all stress resistance assays performed in Figure 4a. The treatments, water or mianserin (50 µM), with their indicated concentrations (conc.) were added on day 1 of adulthood. Paraquat (PQ) was added in the concentration range of 0 to 100 mM on day 5 and survival after PQ [%] was calculated 24 hr later. Mean and standard deviation (S.D.) of survival after PQ [%] were calculated from 3 to 6 independent experiments (expts.). P-values were calculated between water and mianserin-treatments at the same PQ conc., using t-test. The total number of wells and animals from which data were collected are indicated.
Table 7
Summary of oxidative stress protection by serotonin antagonists.
| Strain name | Fold change in survival after PQ [(Drug/DMSO) -1] Expt.1 | Fold change in survival after PQ [(Drug/DMSO) -1] Expt.2 | Fold change in survival after PQ [(Drug/DMSO) -1] Expt.3 | Fold change in survival after PQ [(Drug/DMSO) -1] Expt.4 | Fold change in survival after PQ [(Drug/DMSO) -1] Expt.5 | Fold change in survival after PQ [(Drug/DMSO) -1] Expt.6 | Fold change in survival after PQ [(Drug/DMSO) -1] Expt.7 | Mean, Fold change in survival after PQ | S.D., Fold change in survival after PQ | P-value |
|---|---|---|---|---|---|---|---|---|---|---|
| Dihydroergotamine 88 µM | ||||||||||
| N2 | 0.62 | 0.70 | 0.79 | 0.19 | 1.75 | 1.43 | 0.91 | 0.57 | ||
| ser-5(ok3087) | 0.45 | 0.15 | 0.10 | 0.23 | 0.19 | 3.49E-02 | ||||
| Metergoline 33 µM | ||||||||||
| N2 | 0.54 | 0.57 | 0.68 | 0.94 | 1.24 | 1.67 | 0.94 | 0.44 | ||
| ser-5(ok3087) | -0.05 | -0.27 | -0.11 | -0.12 | -0.13 | 0.09 | 1.50E-03 | |||
| Amperozide 13 µM | ||||||||||
| N2 | 0.93 | 0.74 | 0.99 | 0.92 | 2.49 | 0.89 | 1.16 | 0.66 | ||
| ser-5(ok3087) | 0.30 | 0.03 | -0.58 | -0.09 | 0.45 | 1.63E-02 | ||||
| Methiothepin 10 µM | ||||||||||
| N2 | 0.80 | 1.08 | 0.95 | 0.36 | 0.77 | 2.94 | 1.39 | 1.19 | 0.89 | |
| ser-5(ok3087) | 0.07 | 0.10 | 0.16 | -0.01 | 0.08 | 0.08 | 1.24E-02 | |||
| Ketanserin 176 µM | ||||||||||
| N2 | 0.63 | 0.59 | 1.13 | 1.38 | 0.42 | 1.71 | 0.98 | 0.51 | ||
| ser-5(ok3087) | -0.41 | -0.14 | 0.01 | -0.07 | -0.15 | 0.18 | 1.91E-03 | |||
| Mirtazapine 50 µM | ||||||||||
| N2 | 0.8 | 0.7 | 1.1 | 0.4 | 1.0 | 0.8 | 1.5 | 0.89 | 0.35 | |
| ser-5(ok3087) | 0.0 | -0.1 | -0.1 | -0.2 | -0.11 | 0.07 | 1.92E-04 | |||
| LY-165,163 33/PAPP µM | ||||||||||
| N2 | 0.48 | 0.49 | 1.00 | 0.94 | 0.53 | 1.40 | 0.81 | 0.37 | ||
| ser-5(ok3087) | -0.03 | 0.35 | -0.07 | -0.16 | 0.02 | 0.23 | 3.19E-03 | |||
| Mianserin 50 µM | ||||||||||
| N2 | 1.10 | 1.11 | 1.18 | 0.53 | 3.24 | 1.60 | 1.46 | 0.94 | ||
| ser-5(ok3087) | 0.14 | -0.18 | -0.26 | -0.10 | 0.21 | 4.49E-02 | ||||
-
Summary of all stress resistance assays performed in Figure 4—figure supplement 1b. The treatments, DMSO or serotonin antagonists, with their indicated concentrations (conc.) were added on day 1 of adulthood. Paraquat (PQ) (100 mM) was added on day 5 and survival after PQ [%] was calculated 24 hr later. Mean and standard deviation (S.D.) of survival after PQ [%] were calculated from 3 to 7 independent experiments (expts.). P-values were calculated between N2 and mutant strains for fold change values with indicated small molecule treatments using t-test.
Table 8
Summary of all lifespan data for mianserin.
| Cumulative statistics | Statistics of individual expts. | |||||||||
|---|---|---|---|---|---|---|---|---|---|---|
| Strain | Small molecule | No. of expts. | Mean lifespan [days] (+Mia/+water) | change in lifespan [%] | S.E.M. | No. of animals (+Mia/+water) | Mean lifespan (days) (+Mia/+water) | change in lifespan [%] | P-value | No. of animals (+Mia/+water) |
| N2 | Mia | 12 | 26.7/19.8 | +35 | ± 7 | 642/577 | 26.4/19.8 | +34 | 1.67E-08 | 77/59 |
| 25.5/21.5 | +19 | 6.85E-07 | 113/94 | |||||||
| 28.1/20.1 | +40 | 3.71E-14 | 95/104 | |||||||
| 30.6/19.0 | +64 | 3.17E-15 | 57/50 | |||||||
| 26.8/21.5 | +25 | 1.87E-11 | 149/145 | |||||||
| 22.6/16.6 | +27 | 1.61E-23 | 151/125 | |||||||
| snt-1 (md290) | Mia | 3 | 20.9/18.2 | +15 | ± 2 | 236/231 | 23.3/19.9 | +17 | 1.84E-05 | 86/90 |
| 17.3/15.4 | +12 | 1.18E-02 | 79/80 | |||||||
| 22.1/19.3 | +15 | 2.4E-03 | 71/61 | |||||||
| unc-26 (e205) | Mia | 3 | 25.0/26.7 | -7 | ± 7 | 135/165 | 27.8/26.9 | +3 | 0.53 | 54/68 |
| 22.2/26.5 | -16 | 4.52E-02 | 14/24 | |||||||
| 26.5/25.3 | +5 | 0.52 | 67/73 | |||||||
| ser-5 (ok3087) | Mia | 3 | 23.4/22.2 | +5 | ± 5 | 496/458 | 23.6/20.6 | +15 | 4.19E-02 | 152/144 |
| 26.4/26.2 | +1 | 0.85 | 174/144 | |||||||
| 20.1/19.8 | -1 | 0.25 | 170/170 | |||||||
-
Summary of all lifespan experiments performed in Figure 5e,f and Figure 5—figure supplement 1a. N2 and mutant strains were treated with 50 µM mianserin (Mia) on day 1 and lifespan [days] was scored until 95% of animals were dead in all tested conditions. Cumulative statistics and statistics of individual experiments are shown. Mean lifespan [days], change in lifespan [%] and S.E.M. for mianserin-treated (+Mia) and water-treated (+water) animals from multiple, independent experiments (expts.) are shown. Change in lifespan [%] and P-values for individual experiments were calculated using the Mantel–Haenszel version of the log-rank test. Number of animals in individual experiments and all experiments combined are shown.
Table 9
List of small molecules and chemicals used in this study with information
| Molecule name | CAS number | Catalog number | Manufacturer |
|---|---|---|---|
| Mianserin HCl | 21535-47-7 | 0997 | Tocris |
| Mirtazapine | 85650-52-8 | M3368 | LKT Laboratories |
| Dihydroergotamine mesylate | 6190-39-2 | 0475 | Tocris/R&D systems |
| LY-165,163/PAPP | 1814-64-8 | S009 | Sigma |
| Mirtazapine | 61337-67-5 | M3368 | LKT labs |
| Metergoline | 17692-51-2 | M3668 | Sigma |
| Ketanserin tartarate | 83846-83-7 | S006 | Sigma |
| Methiothepin mesylate | 74611-28-2 | M149 | Sigma |
| Amperozide HCl | 86725-37-3 | 2746 | Tocris/R&D systems |
| Paraquat (Methyl viologen) | 1910-42-5 | AC227320010 | Acros Organics |
| FUDR | 50-91-9 | F0503 | Sigma-Aldrich |
| DMSO | 67-68-5 | 472301 | Sigma-Aldrich |
Table 10
List of mutant and fluorescent strains outcrossed and used in this study.
| Strain name | Genotype | No.of times outcrossed | Gene name | Transgene | Allele | Parent strain(s) |
|---|---|---|---|---|---|---|
| VV78 | unc-26 (e205) IV | 4 | unc-26 | e205 | CB205 | |
| VV80 | snt-1 (md290) II | 4 | snt-1 | md290 | NM204 | |
| MT15434 | tph-1 (mg280) II | 4 | tph-1 | mg280 | MT15434 | |
| DA1814 | ser-1 (ok345) X | 10 | ser-1 | ok345 | DA1814 | |
| OH313 | ser-2 (pk1357) X | 4 | ser-2 | pk1357 | OH313 | |
| DA1774 | ser-3 (ad1774) I | 3 | ser-3 | ad1774 | DA1774 | |
| AQ866 | ser-4 (ok512) III | 5 | ser-4 | ok512 | AQ866 | |
| VV130 | ser-5(ok3087) I | 4 | ser-5 | ok3087 | RB2277 | |
| FX2647 | ser-5 (tm2647) I | 0 | ser-5 | tm2647 | FX2647 | |
| FX2654 | ser-5 (tm2654) I | 0 | ser-5 | tm2654 | FX2654 | |
| FX2146 | ser-6 (tm2146) IV | 0 | ser-6 | tm2146 | FX2146 | |
| DA2100 | ser-7 (tm1325) X | 10 | ser-7 | tm1325 | DA2100 |
Table 11
List of oligos used for qRT-PCR
| Gene name | qRT-PCR forward primer (5’-3’) | qRT-PCR reverse primer (5’-3’) |
|---|---|---|
| sod-1 | CGTAGGCGATCTAGGAAATGTG | AACAACCATAGATCGGCCAACG |
| sod-2 | TTCAACCGATCACAGGAGTC | GCTCCAAATCAGCATAGTCG |
| sod-3 | ATGGACACTATTAAGCGCGA | GCCTTGAACCGCAATAGTG |
| sod-4 | ATGTGGAACTATCGGAATTGTG | GGTTGAGATTGTGTAACTGGA |
| sod-5 | ATGGAGACTCAACCGATGG | GACCACGGAATCTCTTCCT |
| ctl-1 | AATGGATACGGAGCGCATAC | AACCTTGAGCAGGCTTGAAA |
| ctl-2 | TGATTACCCACTGATCGAGG | GCGGATTGTTCAACCTCAG |
| ctl-3 | CAATCTAACGGTCAACGACAC | CATTGGATGTGGTGAGCAG |
| prdx-2 | CATTCCAGTTCTCGCTGAC | ATGATGAAGAGTCCACGGA |
| prdx-3 | GTTCCGTTCTCTTGGAGCTG | CTTGTTGAAATCAGCGAGCA |
| prdx-6 | GGAGAACAATGGCTGATGC | ATCTGAACATGGCGTTTGC |
| hsp-16.1 | ACCACTATTTCCGTCCAGCT | TGACGTTCCATCTGAGCCAT |
| hsp-16.11 | ACCACTATTTCCGTCCAGCT | TGACGTTCCATCTGAGCCAT |
| hsp-16.2 | TCGATTGAAGCGCCAAAGAA | TCTCTTCGACGATTGCCTGT |
| hsp-16.41 | TCTTGGACGAACTCACTGGA | TCTTGGACGAACTCACTGGA |
| hsp-16.48 | CTCATGCTCCGTTCTCCATT | GAGTTGTGATCAGCATTTCTCCA |
| hsp-16.49 | CTCATGCTCCGTTCTCCATT | GAGTTGTGATCAGCATTTCTCCA |
| crn-3 | GAATGCACTCATGAACAAAGTC | TAATGTTCGACTGATGAACCG |
| rcq-5 | GATGTTAGAGCTGTAATTCACTGG | ATCTCTTCCAGCTCTTCCG |
| rpl-6 | TTCACCAAGGACACTAGCG | GACAGTCTTGGAATGTCCGA |
Download links
A two-part list of links to download the article, or parts of the article, in various formats.
Downloads (link to download the article as PDF)
Open citations (links to open the citations from this article in various online reference manager services)
Cite this article (links to download the citations from this article in formats compatible with various reference manager tools)
Suppression of transcriptional drift extends C. elegans lifespan by postponing the onset of mortality
eLife 4:e08833.
https://doi.org/10.7554/eLife.08833


