Signaling cascades and the importance of moonlight in coral broadcast mass spawning
- Australian Institute of Marine Science, Australia
- The University of Queensland, Australia
- Tel Aviv University, Israel
- Bar-Ilan University, Israel
Figures
Figure 1 with 2 supplements

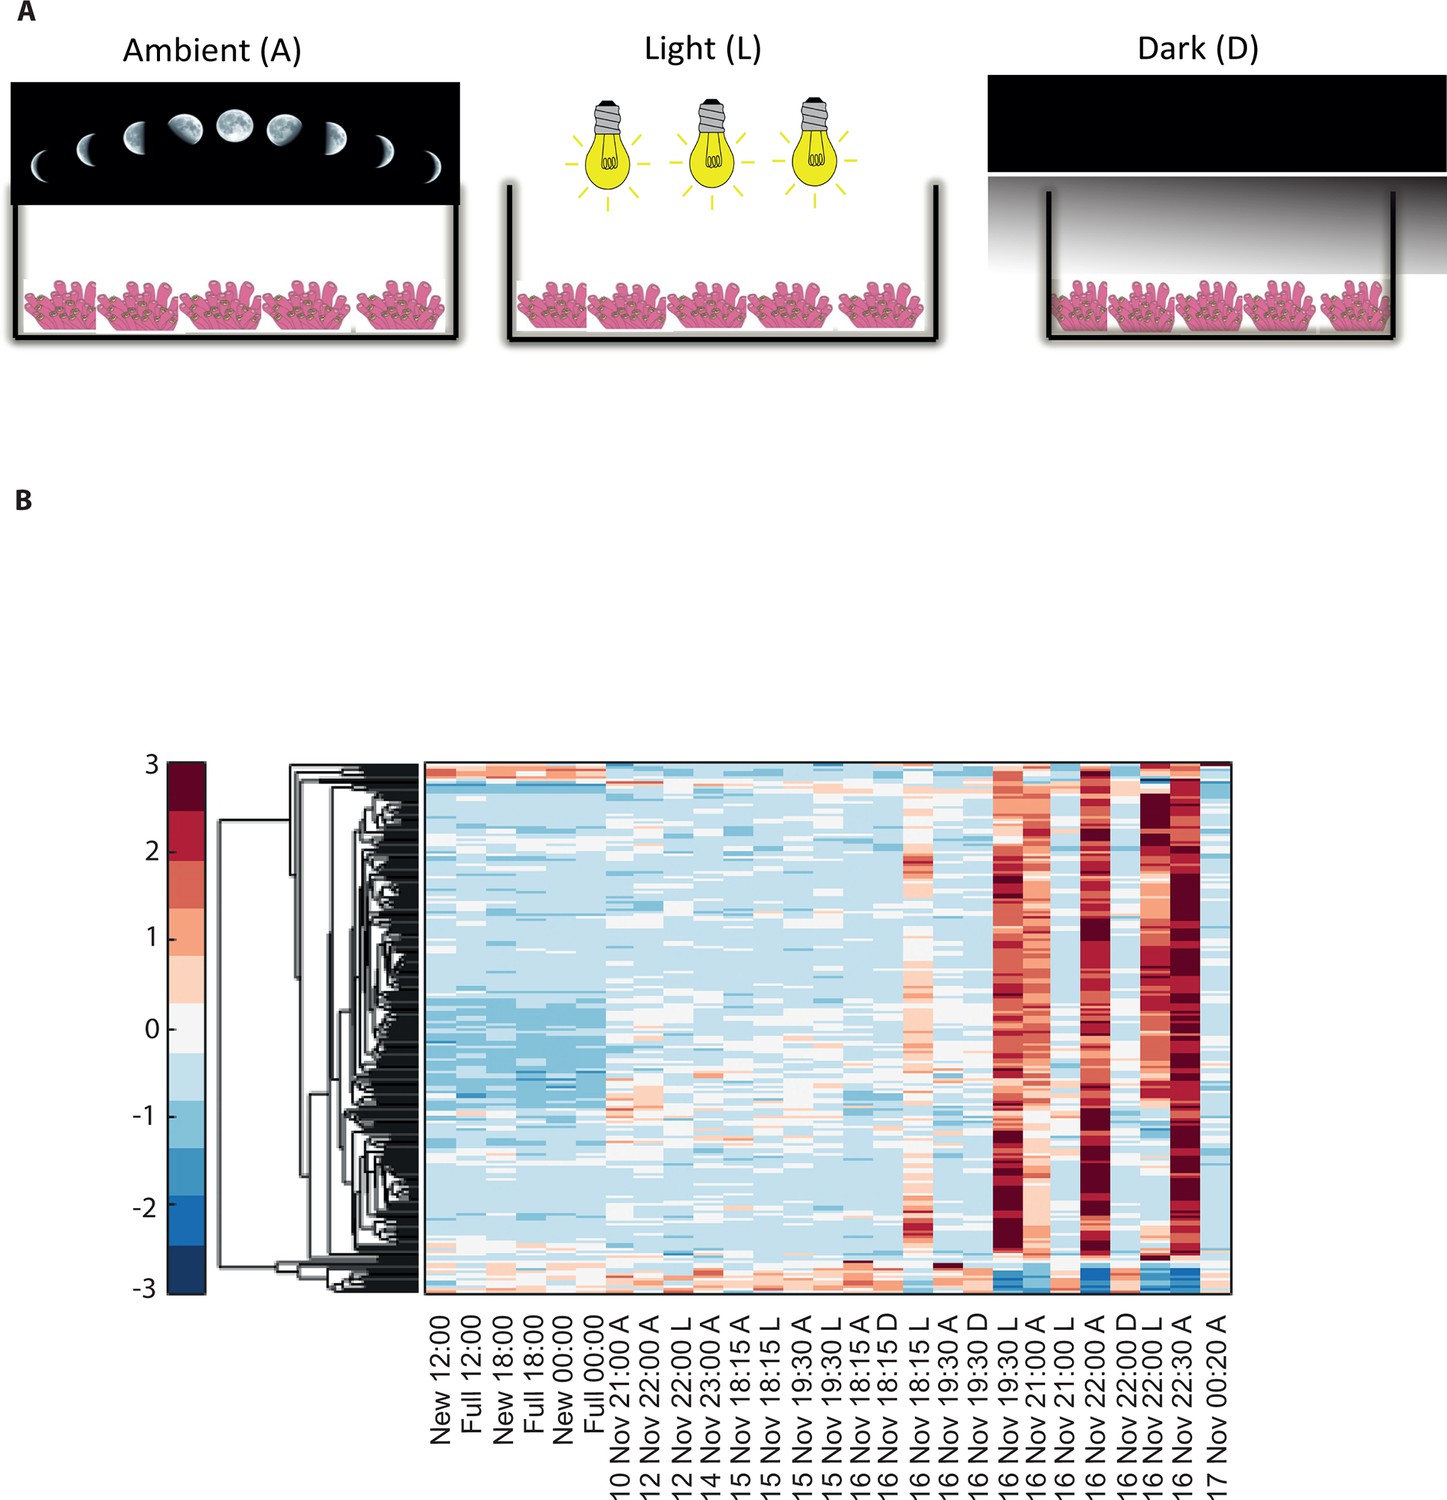
Changes in gene expression during mass spawning of the coral, Acropora millepora.
(A) A. millepora colony releasing gametes. (B) Schematic representing the sampling regime of coral branches from A. millepora colonies (colonies were sampled for 8 days leading up to the spawning night, during the spawning night and 1 day following the spawning event), blue arrows indicate timing of experiment start, full moon and observed spawning. Additionally, colonies were sampled prior to the November spawning month (the colonies were sampled at 12:00, 18:00 and 24:00 in August on new moon and full moon days). (C) Hierarchical clustering of A. millepora gene expression data for the 184 coral transcripts that were only variable during the spawning day using sampling points in August and November. ‘New’ and ‘Full’ denote new moon and full moon conditions, respectively.
Figure 1—figure supplement 1
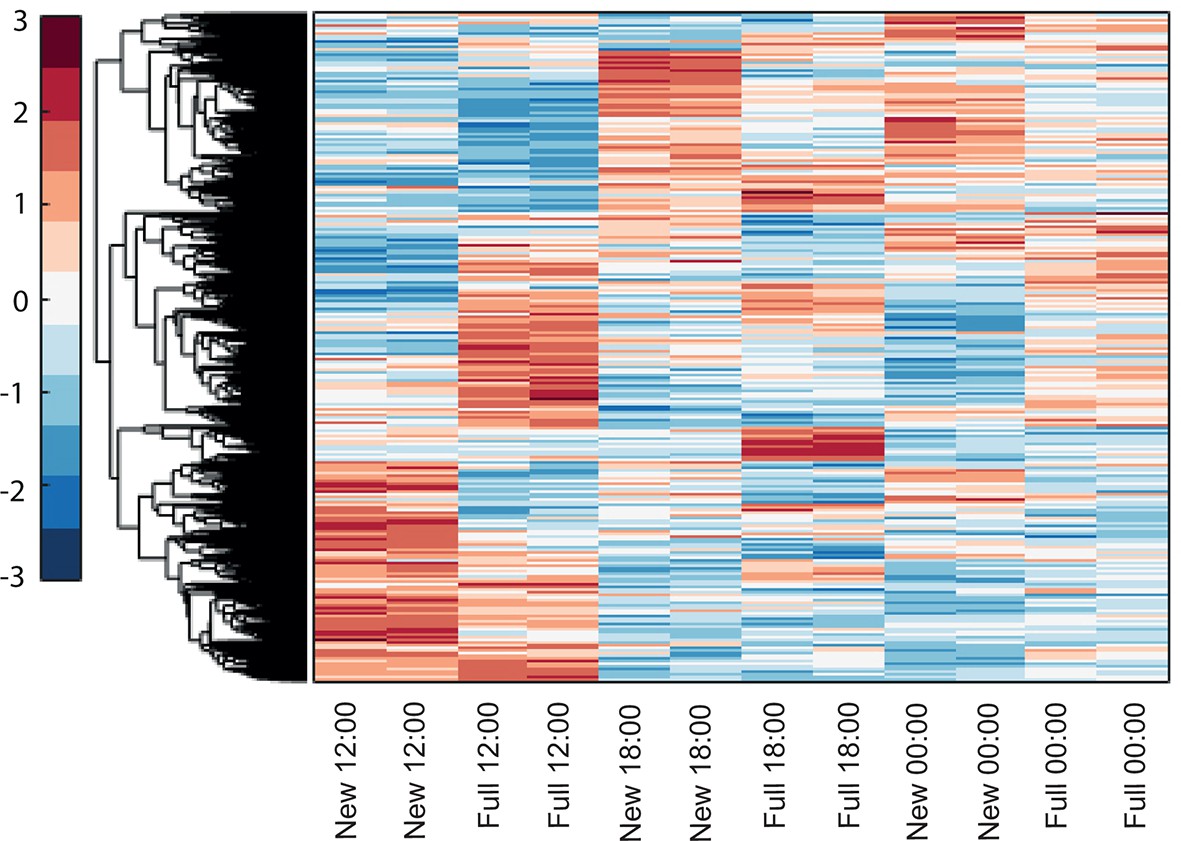
Hierarchical clustering of Acropora millepora gene expression during full moon versus new moon days at 12:00, 18:00 and 00:00.
‘New’ and ‘full’ refers to new moon and full moon days, respectively.
Figure 1—figure supplement 2
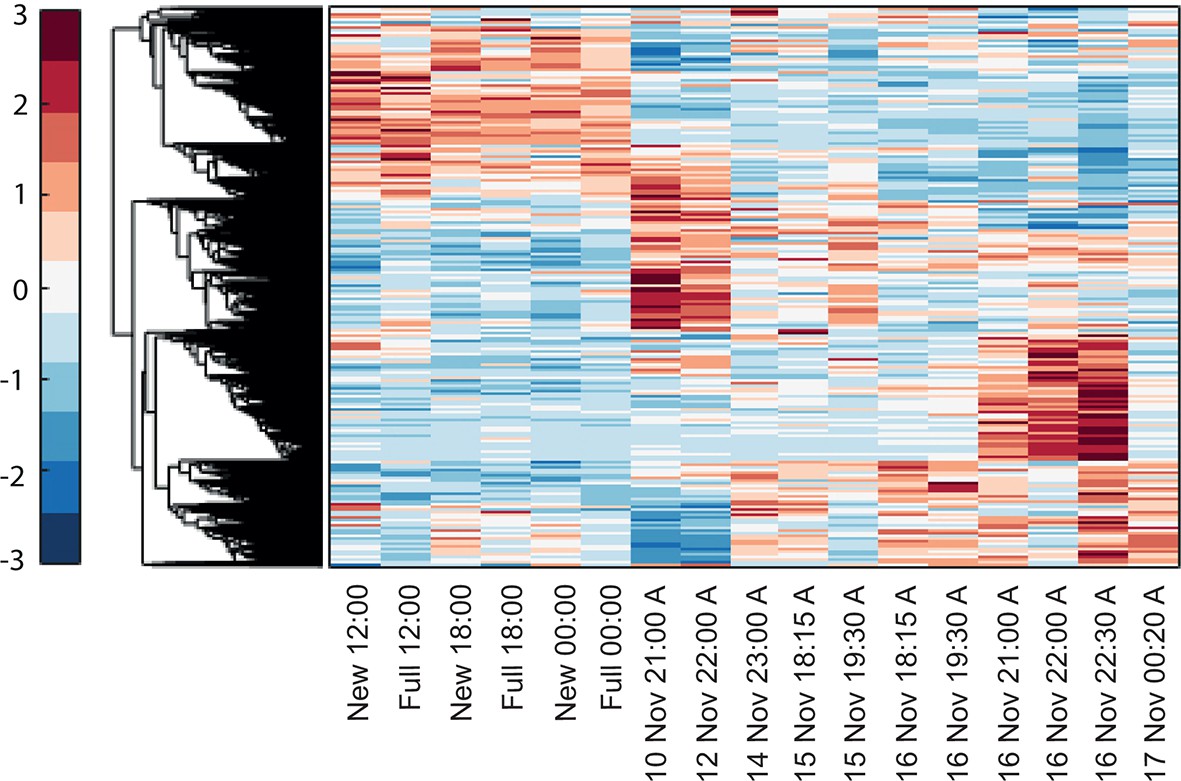
Hierarchical clustering of the expression patterns of genes that are both expressed and non-constant (Materials and methods), indicates that a sizable number of genes are highly variable only on the spawning day.
New and full denotes New moon and full moon conditions and A denotes ambient treatment.
Figure 2 with 3 supplements
Disrupting synchronized mass spawning in the coral, Acropora millepora.
(A) Beginning 8 days prior to the spawning night, A. millepora colonies were exposed to one of the following treatments: ambient (A), in which colonies were exposed to natural day and night cycles with full exposure to moon light; light (L), in which colonies were exposed to natural daylight during the day and artificial photosynthetically active radiation (PAR) light (~5 µmol quanta m-2 s-1) at sunset every day for ~6 hrs (between 18:15 and 24:00) and then left in the dark until sunrise; or dark (D), in which colonies were exposed to natural daylight during the day and left in the dark from 18:15 to sunrise. (B) Hierarchical clustering of A. millepora gene expression data for the 184 coral transcripts that were only variable during the spawning night, depicting gene expression changes between treatments A, L and D denote ambient, light and dark treatments, respectively.
Figure 2—figure supplement 1
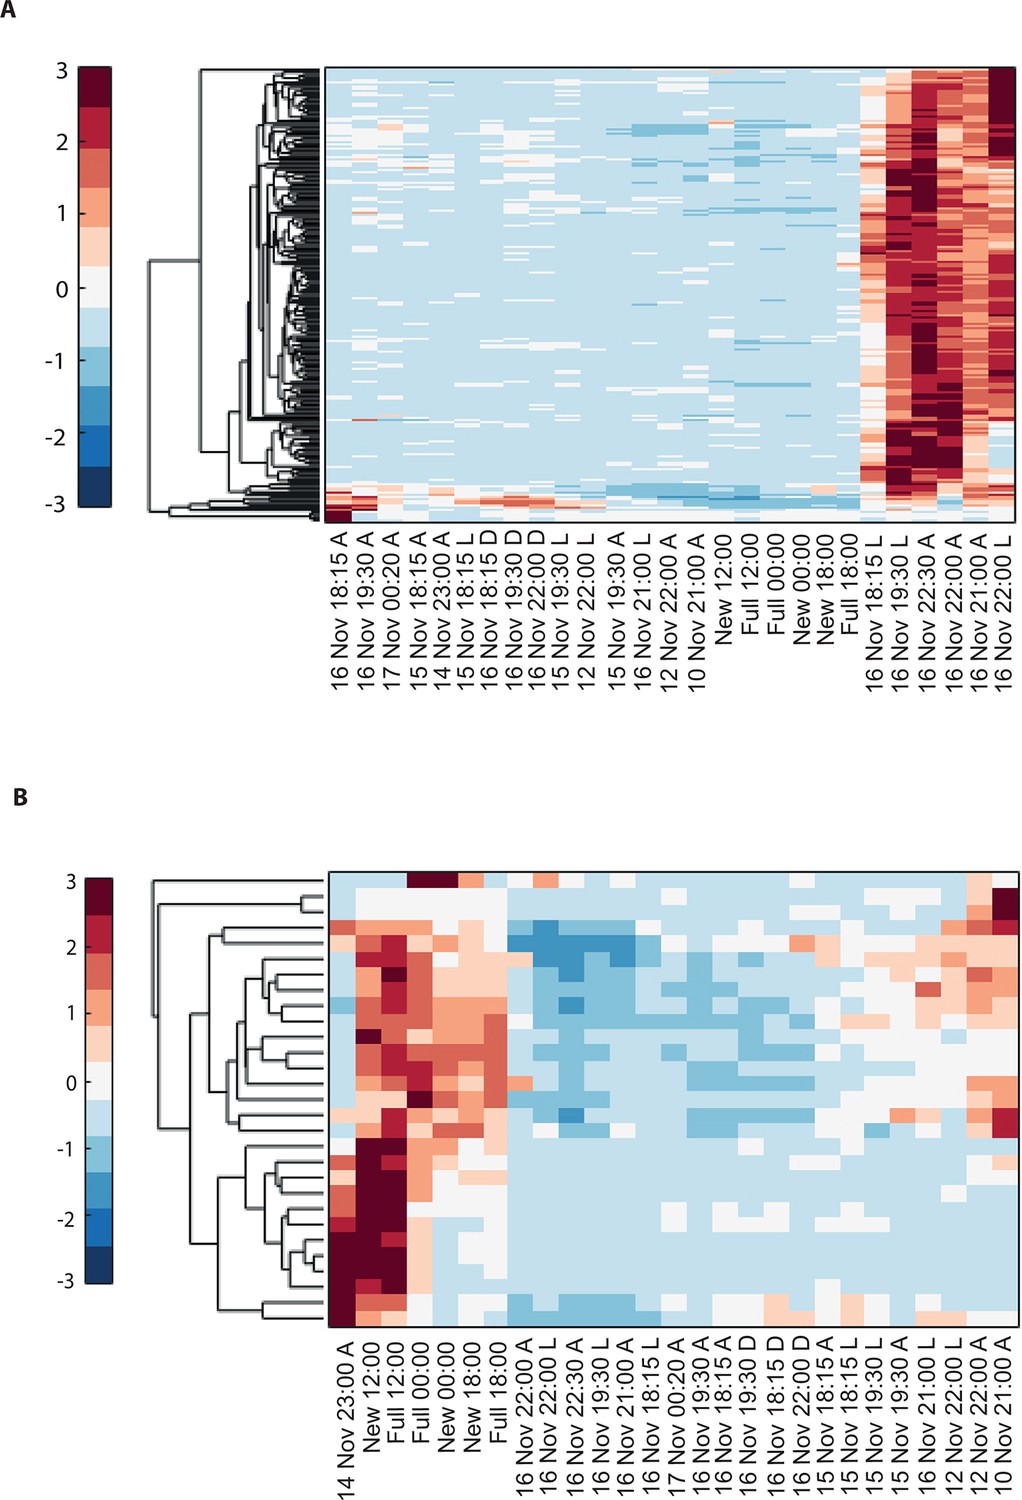
Hierarchical clustering of Acropora millepora gene expression data for (A) the 177 coral transcripts that were up-regulated and (B) the 29 coral transcripts that were down-regulated during the spawning night.
A, L and D denote ambient, light and dark treatments, respectively.
Figure 2—figure supplement 2
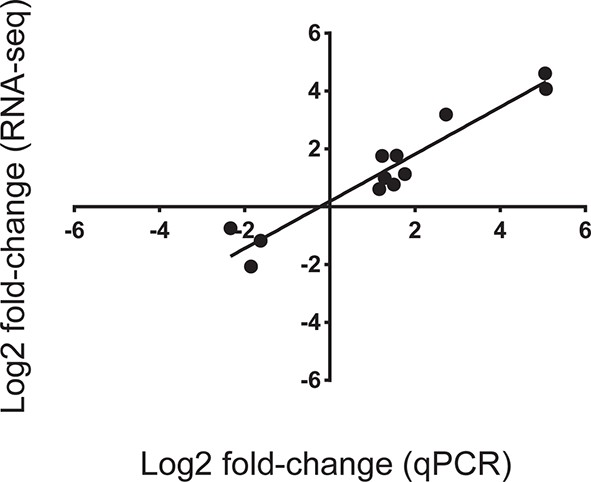
Correlation of gene expression Log2 fold change between values obtained from RNA-seq analysis and expression values obtained using quantitative PCR (qPCR).
Twelve genes were arbitrarily chosen based on either high up- or down-regulation in corals sampled on the spawning night in ambient conditions at 22:00 versus ambient corals on the spawning night at 19:30. Gene expression measured by qPCR and RNA-seq was closely correlated (r2 = 0.92; p<0.0001).
Figure 2—figure supplement 3
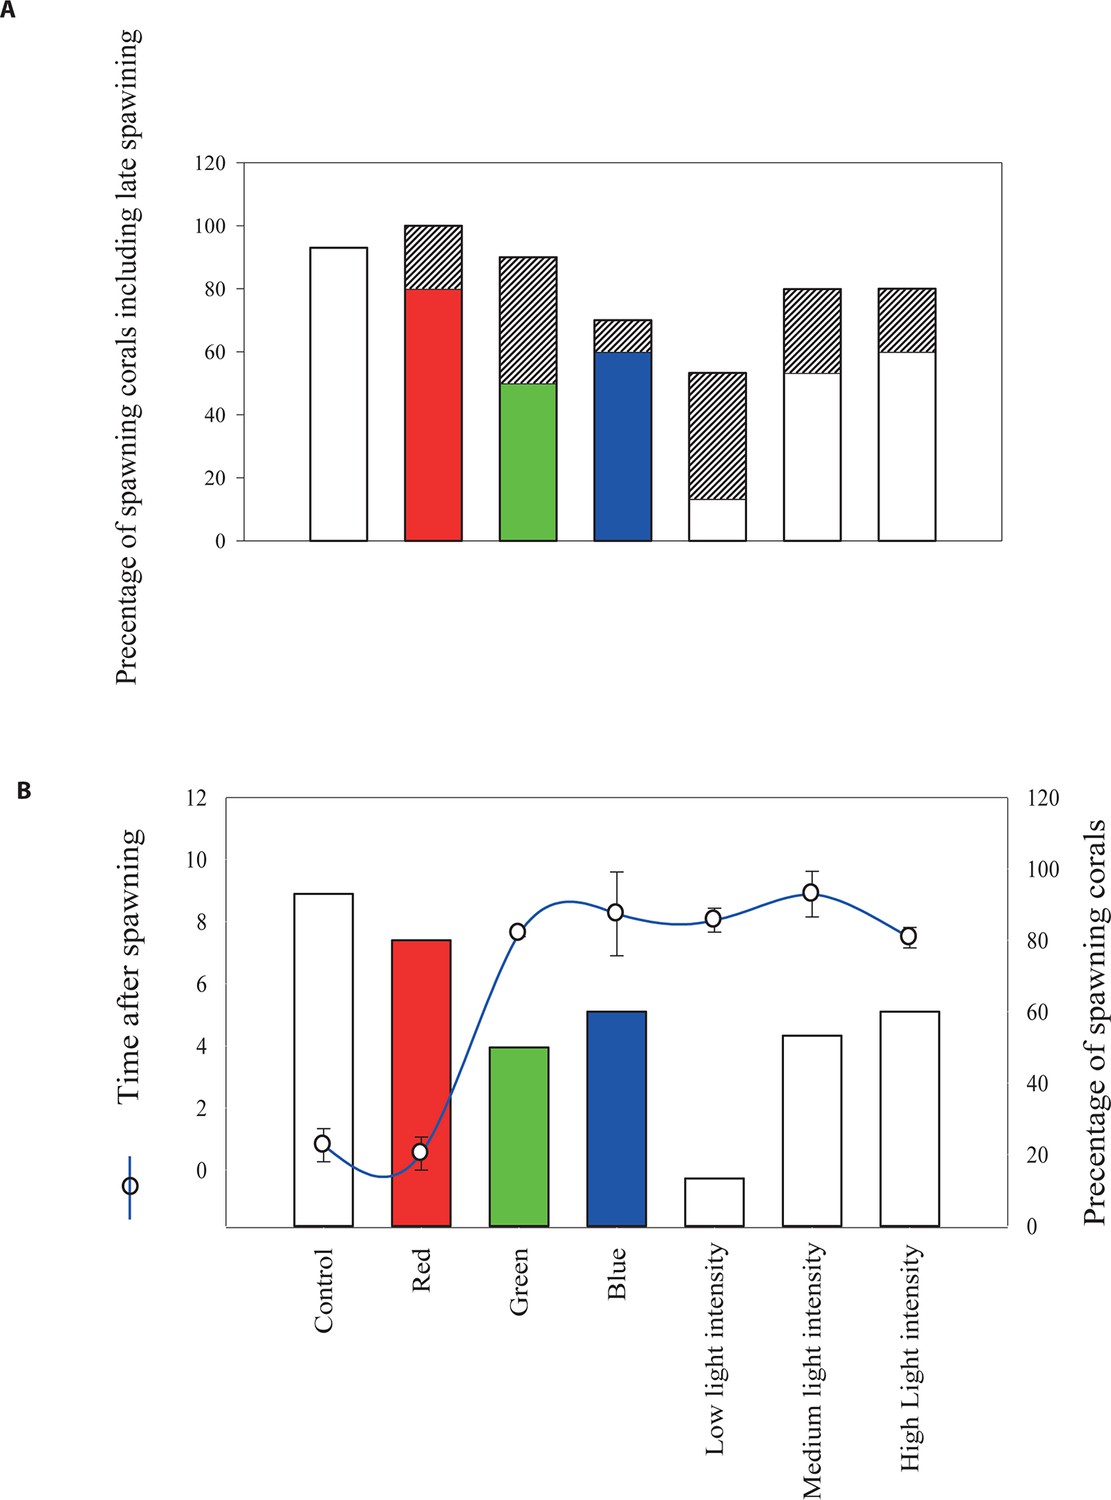
The effect of light quantity and quality on the timing of broadcast spawning in the coral Acropora millepora at Heron Island.
(A) Represents the percentage of corals that released gametes on the night of the spawning and the percentage of late spawners (shaded area), as compared to the control corals and corals monitored at the field reef site. (B) Represents the percentages of colonies which released gametes on the night of the spawning November 13, 2006 and the phase shift (blue line) that is number of hours in the timing of spawning from the control group due to the different light treatments. Total number of colonies was N =90, one-way ANOVA followed by post hoc Tamhane test showed significant differences between the groups with regard to the phase shift in the spawning time and the light and color treatments, p < 0.01.
Figure 3
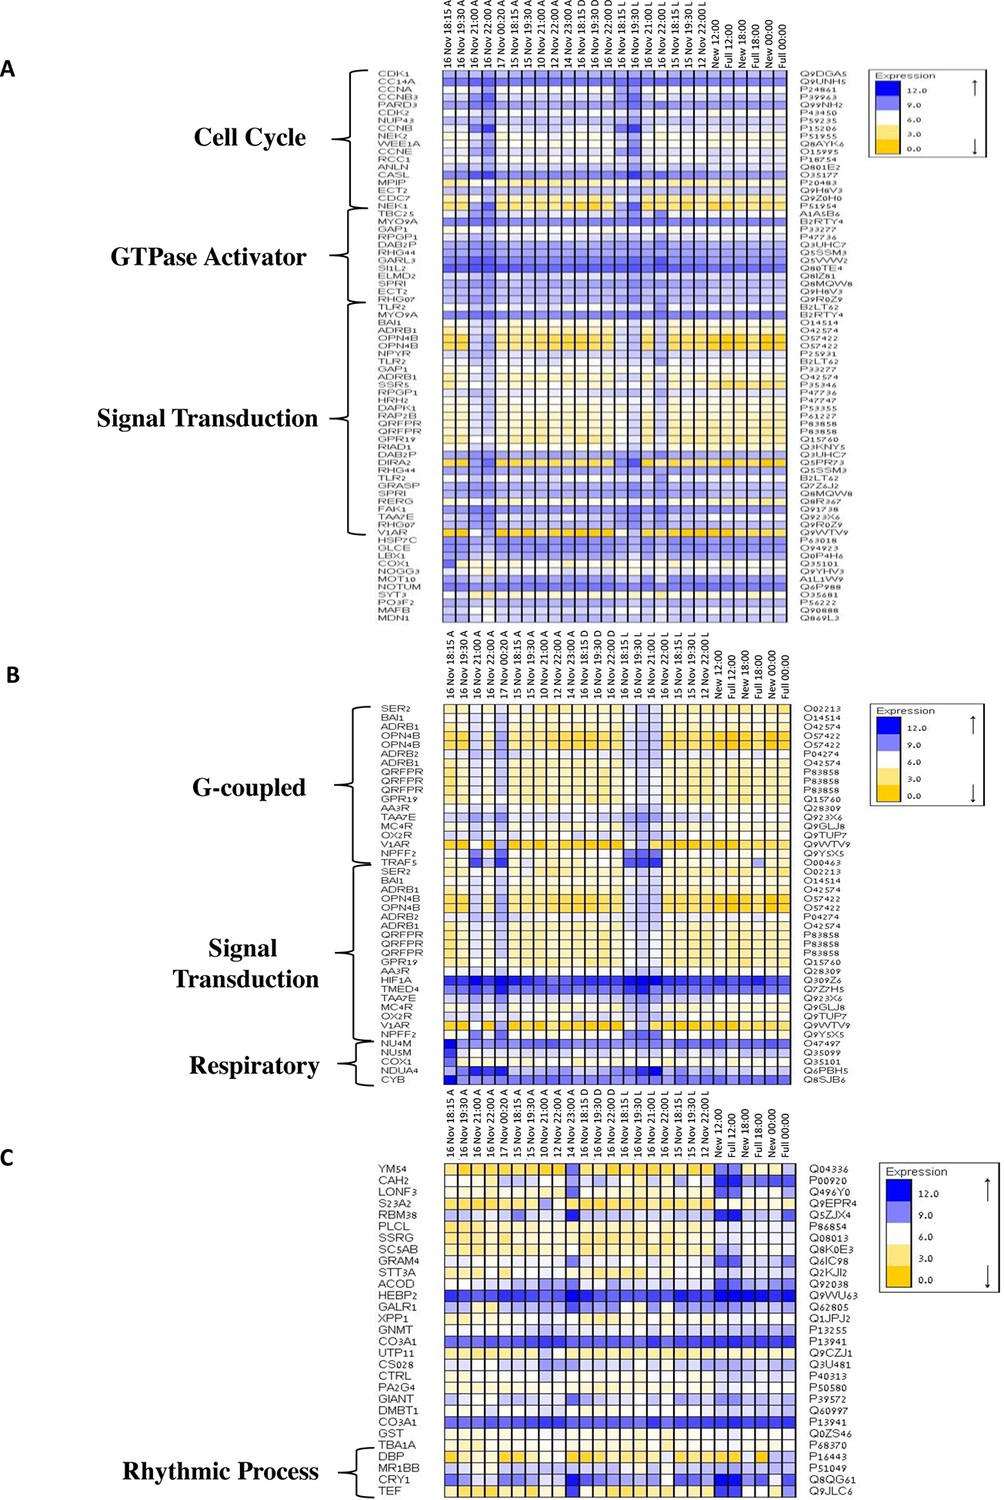
Gene ontology enrichment analysis for Acropora millepora gene variability during mass spawning.
Gene enrichments (false discovery rate<0.1) across GO categories are shown. GOseq was used to test for enriched GO categories of genes that were (A) variable during spawning, (B) up-regulated during spawning or (C) down-regulated during spawning. The left and right identifiers represent the gene names and UniProt accession numbers, respectively.
Figure 4
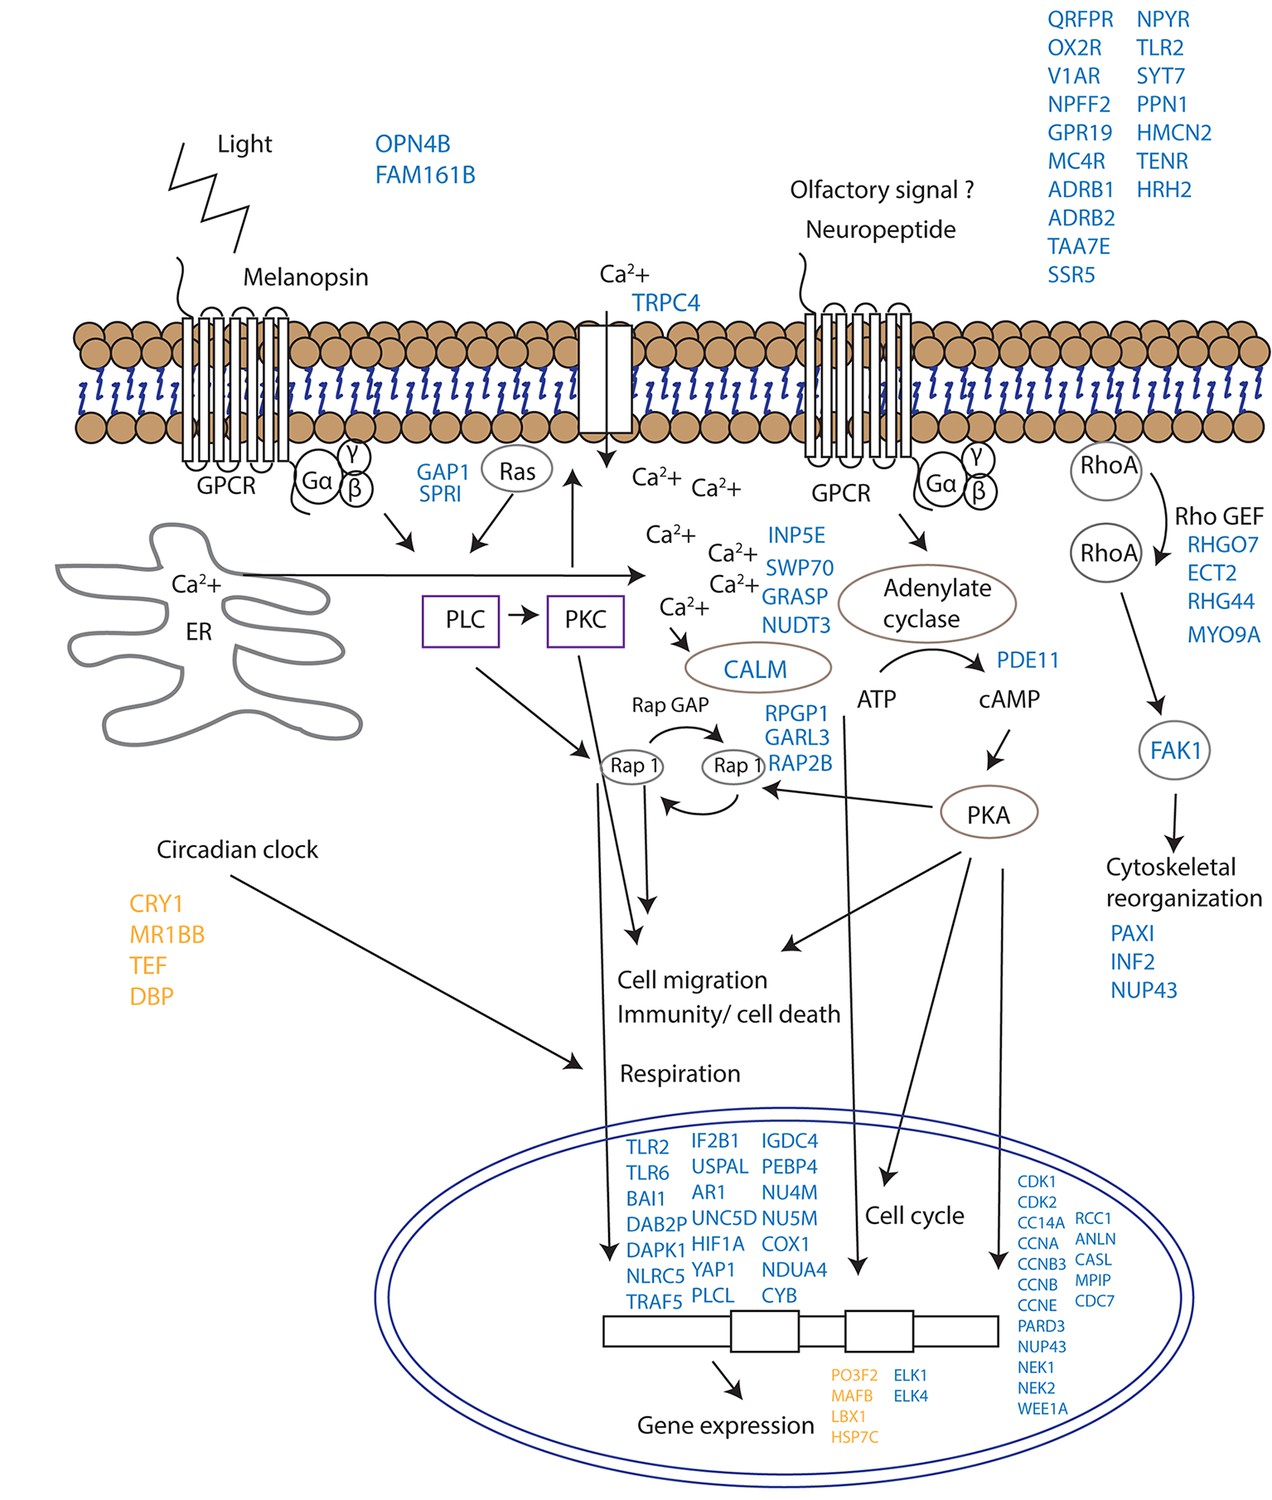
Proposed model for signalling events during spawning and gamete release in Acropora millepora.
The release of gametes occurs in the presence of moonlight or another signal (such as an olfactory signal) that stimulates melanopsin-like homologs and/or other neuropeptides and commences GPCR signalling cascades upon receptor activation. This effect results in cell migration, follicle rupture, changes in immunity/cell death, respiration and cytoskeletal organization, and the combination of which results in a synchronized gamete release. Blue labels indicate genes being up-regulated; orange labels indicate genes down-regulated.
Additional files
-
Supplementary file 1
Acropora millepora genes up-regulated during broadcast spawning, genes also detected to be variable during the spawning day are highlighted.
The time of tides and moonrise during November 2011 spawning event.
- https://doi.org/10.7554/eLife.09991.012
-
Supplementary file 2
Gene ontology enrichment analysis for Acropora millepora gene variability between new moon and full moon days.
Gene enrichments (false discovery rate<0.1) across GO categories are shown. GOseq was used to test for enriched GO categories.
- https://doi.org/10.7554/eLife.09991.013
-
Supplementary file 3
List of candidate genes used in qPCR expression analysis.
- https://doi.org/10.7554/eLife.09991.014
Download links
A two-part list of links to download the article, or parts of the article, in various formats.
Downloads (link to download the article as PDF)
Open citations (links to open the citations from this article in various online reference manager services)
Cite this article (links to download the citations from this article in formats compatible with various reference manager tools)
Signaling cascades and the importance of moonlight in coral broadcast mass spawning
eLife 4:e09991.
https://doi.org/10.7554/eLife.09991


