Near-infrared photoactivatable control of Ca2+ signaling and optogenetic immunomodulation
- Texas A&M University Health Science Center, United States
- University of Massachusetts Medical School, United States
- Beijing Normal University, China
- La Jolla Institute for Allergy and Immunology, United States
Figures
Figure 1 with 6 supplements
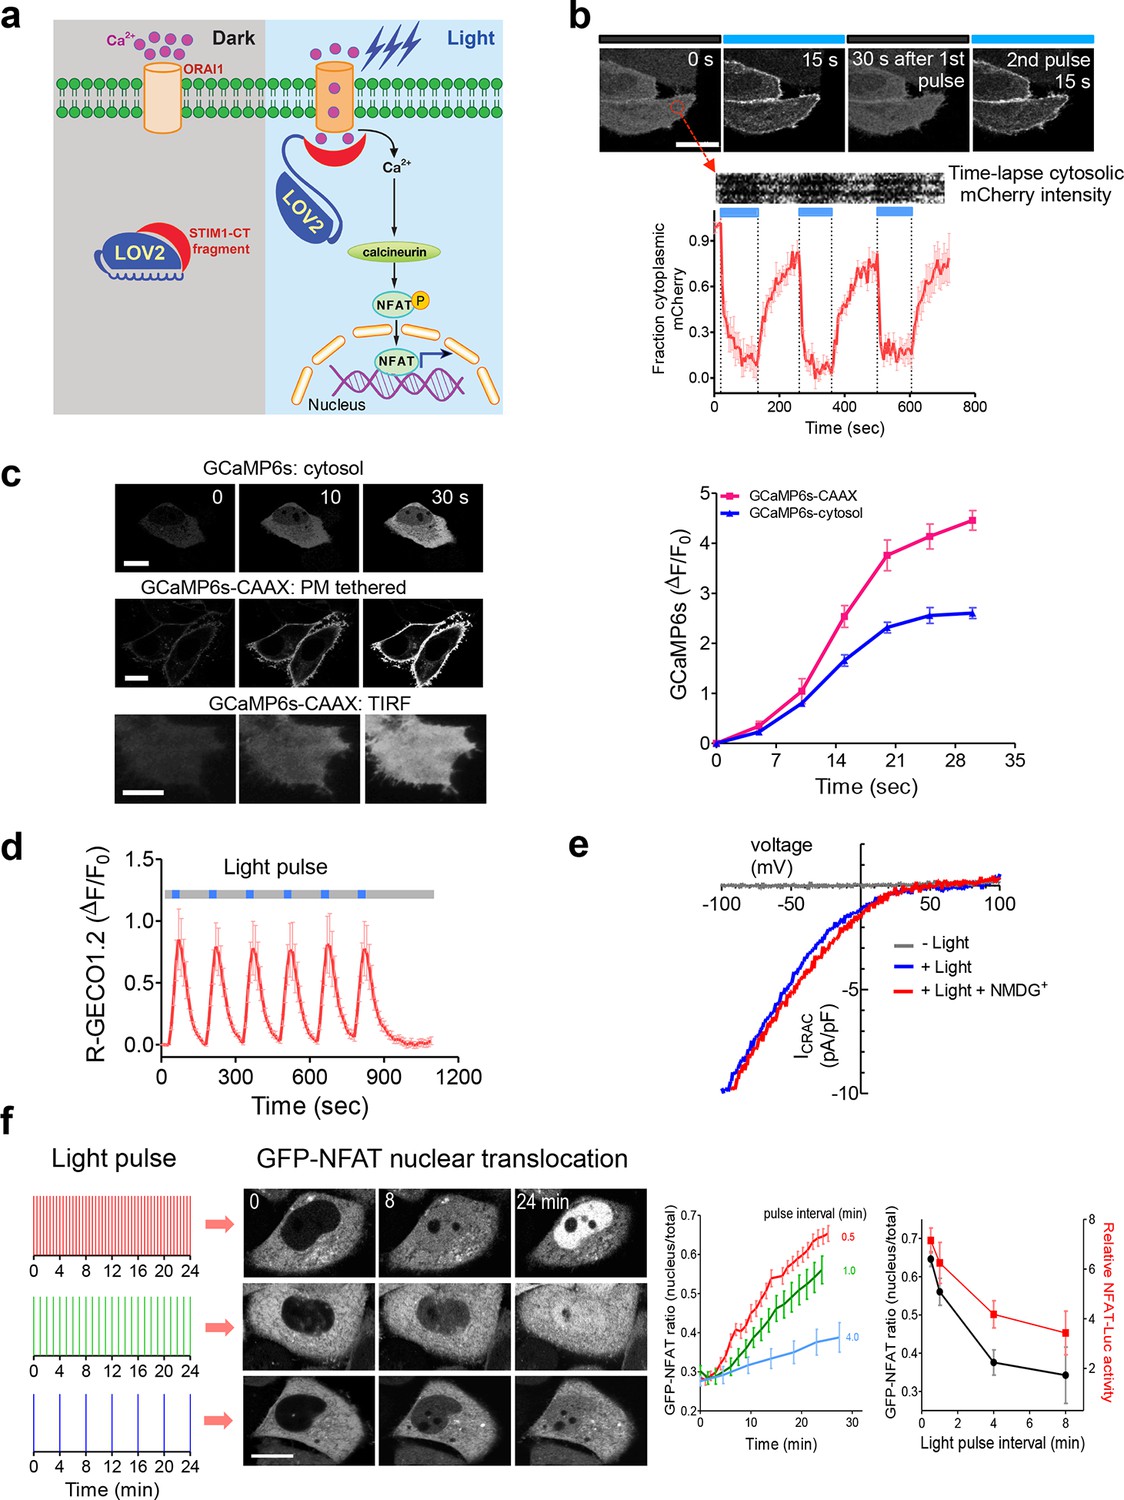
LOVSoc-mediated photoactivatable Ca2+ entry and nuclear translocation of NFAT in mammalian cells.
(a), Schematic of light-operated Ca2+ entry though engineered Opto-CRAC channels. Fusion with the lightswitch LOV2 domain confers photosensitivity to the ORAI1-activating STIM1-CT fragments. In the dark, STIM1-CT fragments are kept inactive presumably by docking toward the LOV2 domain. Upon blue light illumination, the undocking and unfolding of the LOV2 C-terminal Jα helix lead to the exposure of the STIM1-CT fragments, enabling their interaction with ORAI1 Ca2+ channels to trigger Ca2+ influx across the plasma membrane. See Figure 1—figure supplement 1 for the detailed design and comparison among the designed Opto-CRAC constructs. (b), Light-inducible translocation of mCherry-LOV2404-546-STIM1336-486 (designated as mCh-LOVSoc) from the cytosol to the plasma membrane in HEK293T-ORAI1 stable cells. Upper panel, the images represent the same cells in the dark (black bar) or exposed to blue light at 470 nm (40 μW/mm2; blue bar). Scale bar, 10 μm. Lower panel, Kymograph of mCh-LOVSoc corresponding to the circled area (top) and quantification of mCherry signals over three repeated light-dark cycles (bottom). n = 12 cells from three independent experiments. Error bars denote s.e.m. (c), Light-induced Ca2+ influx reported by the green genetically-encoded Ca2+ indicator (GECI) GCaMP6s. The global cytosolic Ca2+ change was monitored after cotransfection of mCh-LOVSoc and GCaMP6s in HeLa cells; whereas the local Ca2+ change near the PM was reported by the PM-tethered GCaMP6s-CAAX construct. Shown were representative confocal or TIRF images following blue light stimulation (30 s, 40 μW/mm2). The photo-activated Ca2+ response reflected in the fluorescence change was plotted on the right. n = 15 cells from three independent experiments. Error bars denote s.e.m. Scale bar, 10 μm. (d), A representative example of light-inducible Ca2+ oscillation pattern generated by LOVSoc-expressing HeLa cells when exposed to repeated light-dark cycles (30 s ON and 120 s OFF). The red Ca2+ sensor, R-GECO1.2, enabled recording of the whole course of intracellular Ca2+ fluctuation. n = 8 cells from three independent experiments. Blue bar indicates light stimulation at 470 nm with a power density of 40 μW/mm2. Error bars denote s.e.m. (e), Photo-triggered current-voltage relationships of CRAC currents in HEK293-ORAI1 cells transfected with mCh-LOVSoc. mCherry positive cells were subjected to whole-cell patch-clamp by a ramp protocol ranging from -100 mV to 100 mV in the presence (blue) or absence (gray) of light illumination. For the red curve, extracellular Na+ was replaced with a non-permeant ion NMDG+ to assess ion selectivity by examining the contribution of Na+. (f), Light-tunable nuclear translocation of GFP-NFAT1 and NFAT-dependent luciferase (NFAT-Luc) gene expression in HeLa cells transfected with mCh-LOVSoc. The HeLa-GFP-NFAT1 stable cells were subjected to light pulse stimulation for 30 s whilst the interpulse intervals were varied from 0.5 to 4 min. Representative snapshots of cells during GFP-NFAT1 nuclear translocation were shown in the middle panel. The corresponding time courses and dependence of NFAT nuclear translocation or NFAT-Luc activity on the interpulse interval were plotted on the right. n = 15–20 cells from three independent experiments. Error bars denote s.e.m. Scale bar, 10 μm.
Figure 1—figure supplement 1
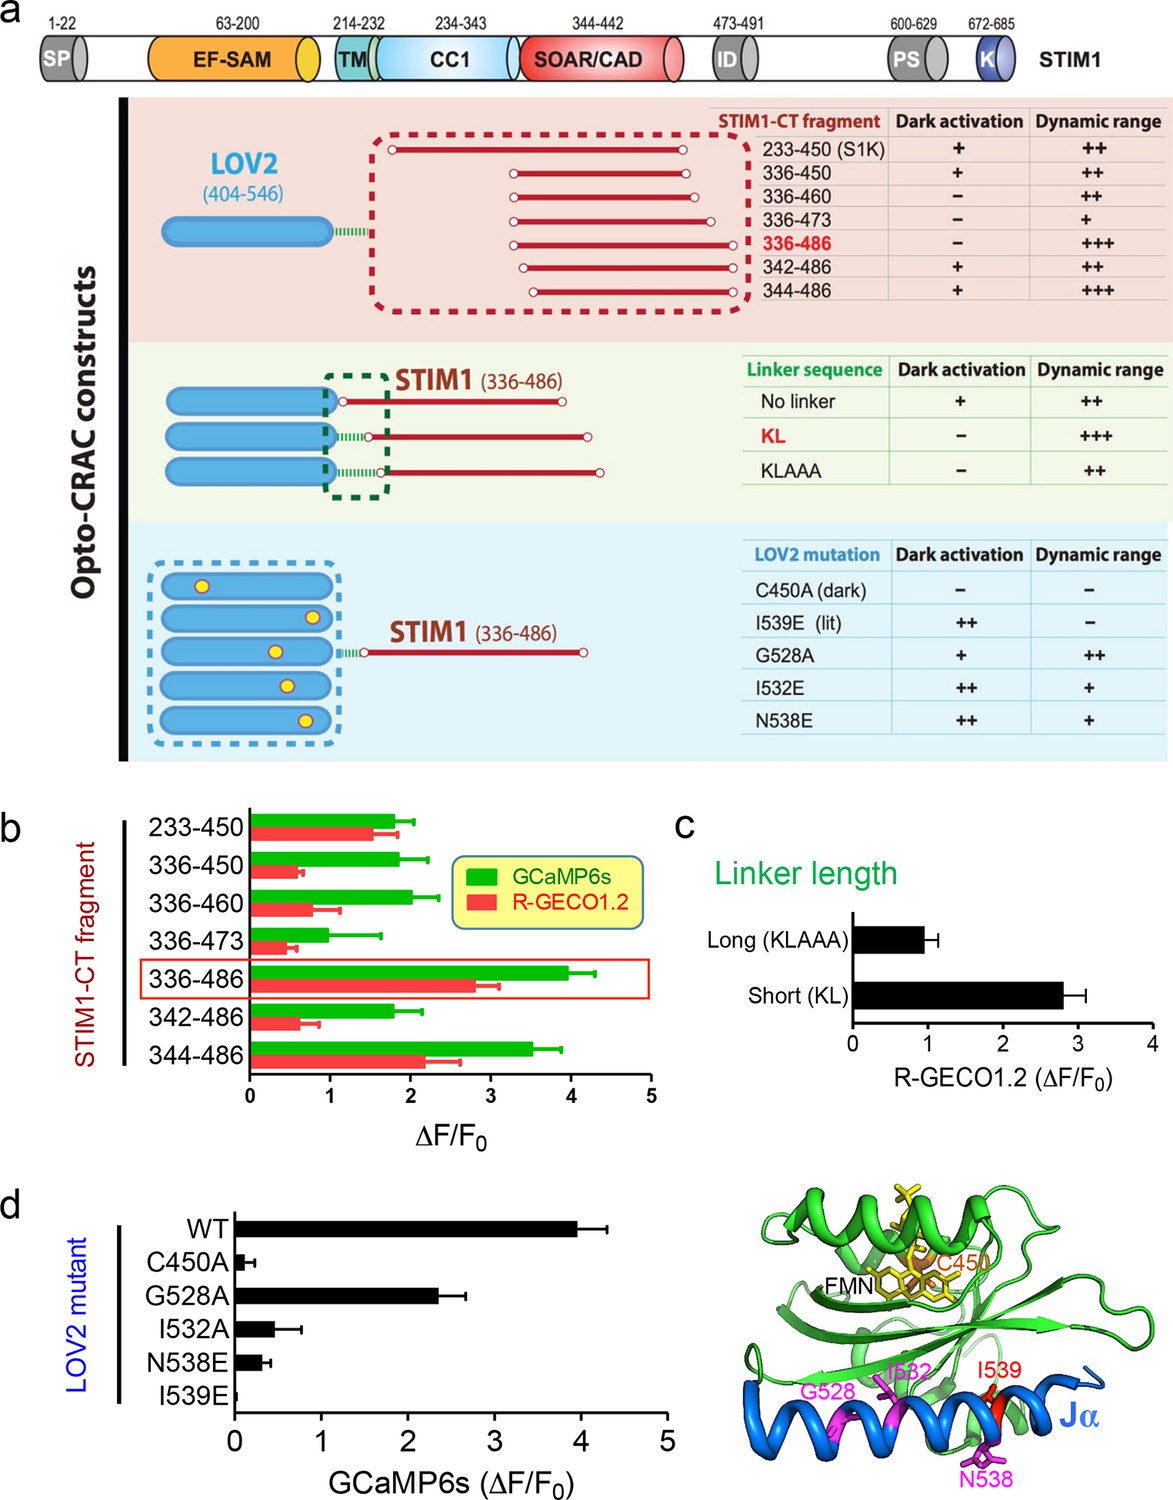
Design and characterization of engineered Opto-CRAC constructs (related to Figure 1a).
(a), Fragments derived the cytoplasmic domain of STIM1 (STIM1-CT) that are capable of constitutively activating ORAI1 channels (with the inclusion of the SOAR/CAD region) were fused to the photoswitch moiety LOV2. Residues KL or KLAAA was added between LOV2 and STIM1-CT fragments as linker. Five mutations were individually introduced into LOV2 domain. The chimera LOV2404-546-KL-STIM1336-486 (designated as LOVSoc) exhibited the highest dynamic range without showing significant dark activity (judging from constitutive NFAT translocation in the dark). C450A traps the LOV2 domain in the dark state to acts as a negative control whilst I539E is known to keep LOV2 in its lit state (10). G528A, I532E and N538E have been reported to increase the dynamic range of LOV2 domain (58). However, those mutations did not seem to improve the overall performance of Opto-CRAC constructs in our hands. The previously reported LOVS1K (LOV2-STIM1233-450) (47), which is approximately 8 kDa larger than LOVSoc in size because of the inclusion of CC1 region, had a much narrower dynamic range with noticeable dark activity. The dark activity is gauged by the percentage of nuclear/total GFP-NFAT in the dark and defined as follows: “−”, no discernible activation; “+”, less than 10% activation; “++”, ≥ 10%. The dynamic range, reported by the averaged fluorescence changes (ΔF/F0) of the Ca2+ sensor GCaMP6s, is categorized as: “−”, <0.2; “+”, 0.2–1.0; “++”, 1.0–2.5; “+++”, >2.5. The domain architecture of STIM1 was shown on the top: SP, signal peptide; EF-SAM, EF-hand motif and sterile-alpha motif; TM, transmembrane domain; CC1, predicted coiled-coil region 1; SOAR/CAD, the minimal ORAI-activating region in STIM1 or the CRAC activating domain; PS, proline/serine-rich region; K, poly-basic C-tail. (b-–d), Normalized fluorescence changes in HeLa cells co-transfected with genetically-encoded Ca2+ sensors (GCaMP6s or R-GECO1.2) and indicated opto-CRAC constructs (b, various STIM1-CT fragments; c, optimization of the linker; d, LOV2 mutations). The LOV2 structure (PDB entry: 2V0W), along with its co-factor FMN (yellow sticks) and mutated positions (highlighted in red colors), was shown to the right of panel (d). Data were shown as mean ± s.e.m. from 10–20 cells.
Figure 1—figure supplement 2
Light-dependent interaction between LOVSoc and ORAI1 (related to Figure 1b).
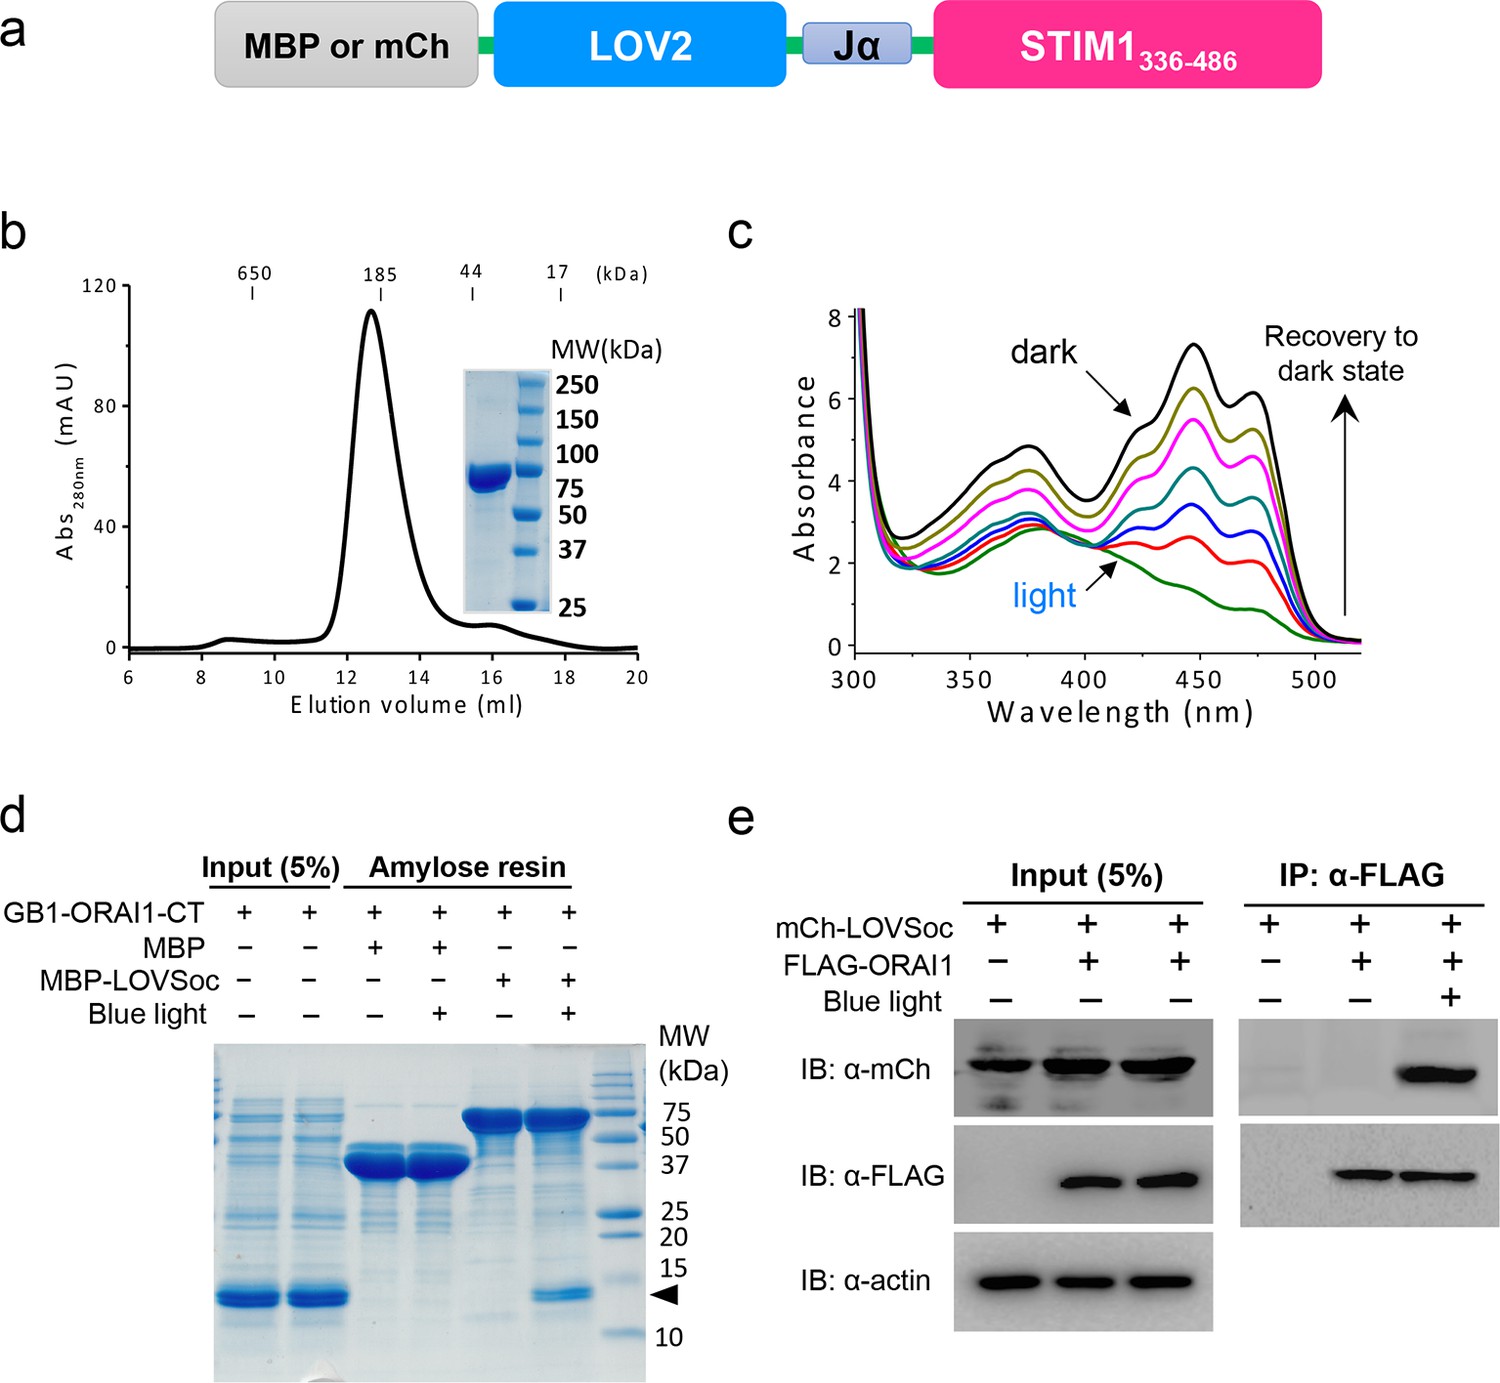
(a), Schematic of the MBP- or mCherry (mCh)-tagged LOVSoc constructs used in the pulldown or CoIP assays. MBP fusion protein was expressed in bacteria and purified to probe its interaction with GB1-tagged ORAI1 C-terminus (GB1-ORAI1-CT, residues 259–301) in vitro; whereas mCherry-tagged protein was used in the CoIP experiment to demonstrate its light-inducible interaction with FLAG-tagged ORAI1 (FLAG-ORAI1). (b), Size-exclusion chromatography elution profile of purified MBP-LOVSoC. Inset, SDS-PAGE image of purified recombinant protein. c, UV-Vis spectra absorbance changes of LOV2 domain upon photoexcitation. The recovery of LOV2 to dark state was monitored every 25 s. (d), In vitro light-inducible binding of recombinant GB1-ORAI1-CT (MWtheoretic = 13 kDa; indicated by arrowhead) to recombinant MBP-LOVSoc (MWtheoretic = 76 kDa) immobilized on the amylose resin. MBP (MWtheoretic = 43 kDa) was used as negative control and did not exhibit light-dependent association with GB1-ORAI1-CT. For the light stimulation groups, samples were constantly exposed to an external blue LED (470 nm, 40 μW/mm2) (e), FLAG-ORAI1 coimmunoprecipitated with mCh-LOVSoc in a light-dependent manner. Samples in the light-simulated groups were constantly exposed to an external blue LED (470 nm, 40 μW/mm2).
Figure 1—figure supplement 3
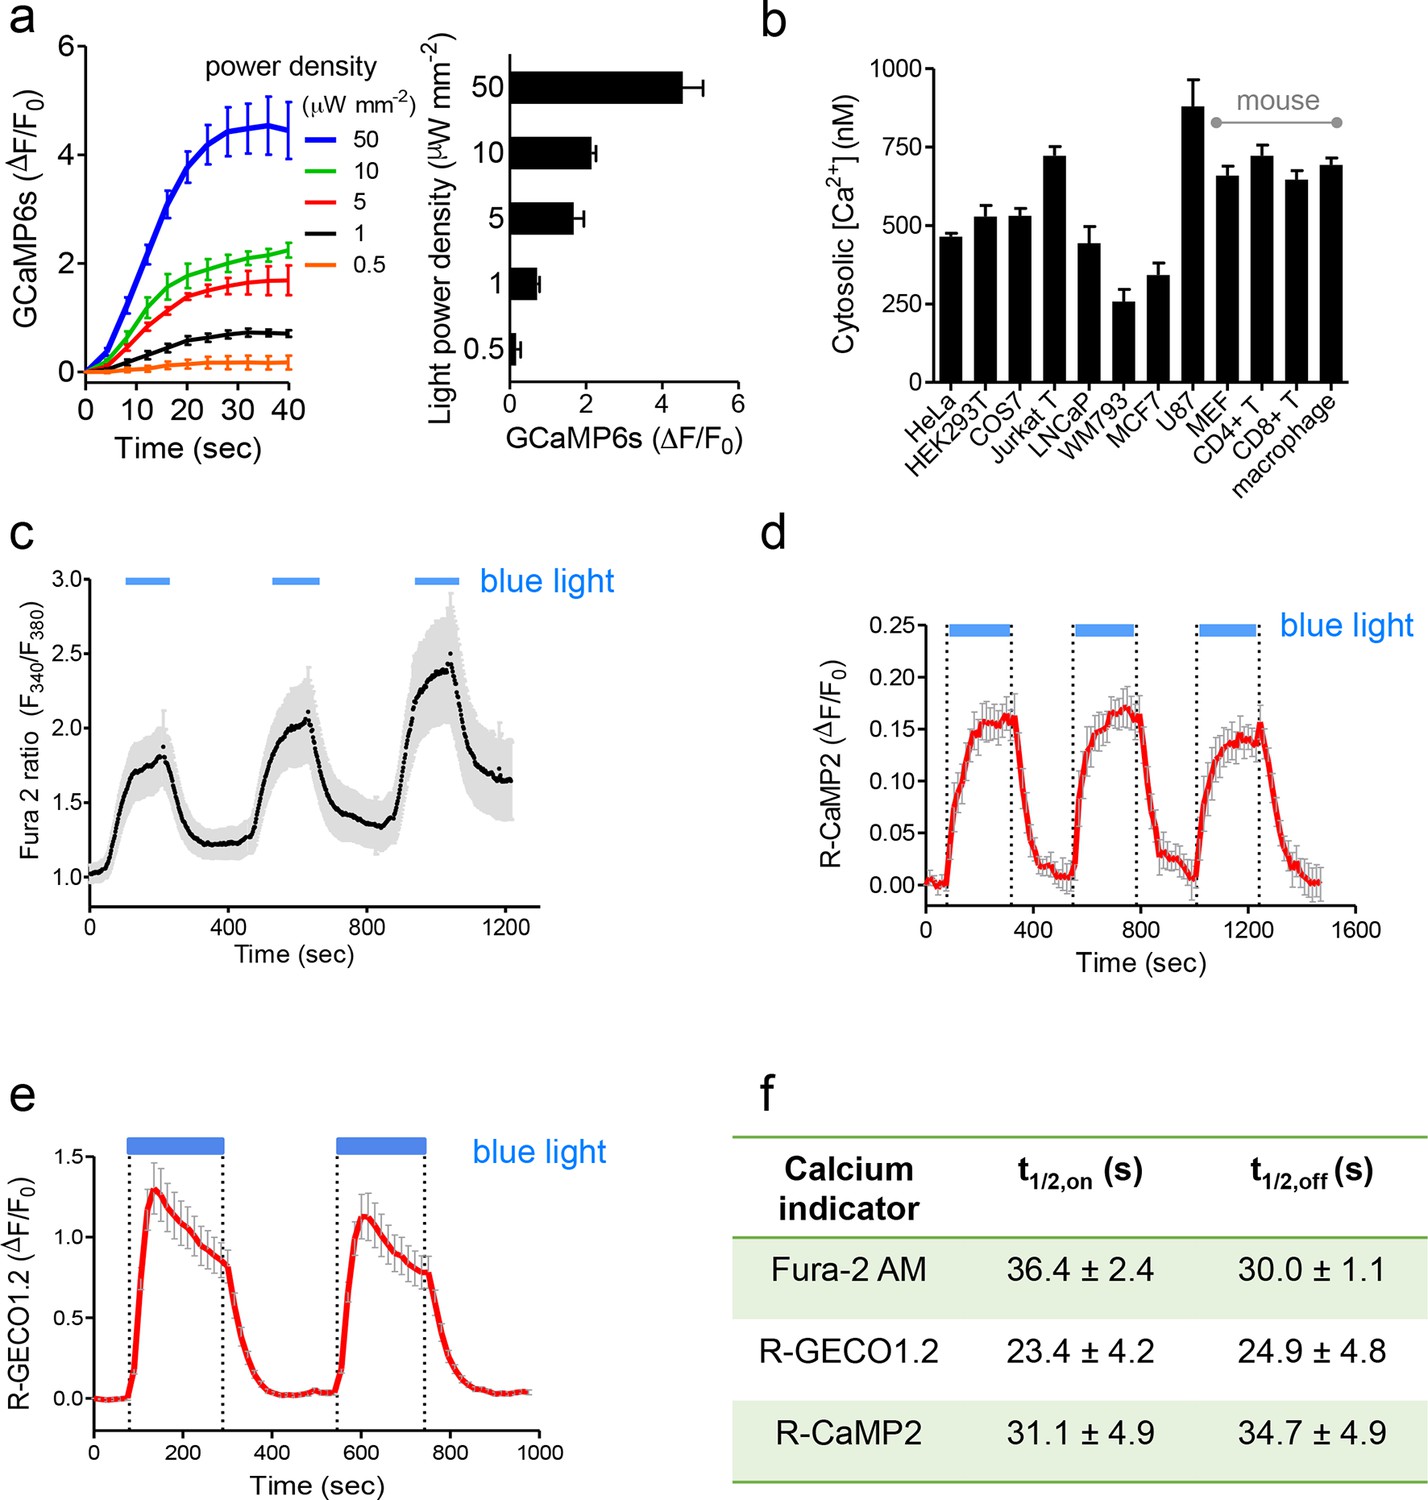
Characterization of photoactivatable Ca2+ entry into mammalian cells (related to Figure 1c,d).
Data were shown as mean ± s.e.m. from 10–20 cells. (a), Light-tunable Ca2+ entry reported by GCaMP6s in HEK293T cells transfected with mCh-LOVSoc. The response curves (n= 10 cells) were plotted as fold-changes of GCaMP6s signals following light stimulation at time 0 with indicated power densities at 470 nm. The bar graph on the right showed the maximal fold-changes of GCaMP6 at varying light power densities. (b), Maximal Ca2+ response induced by light stimulation (470 nm for 1 min at 40 μW/mm2) in various cell types. The cells were derived from a wide range of mammalian tissues, including kidney (HEK293T and Cos-7), cervix (HeLa), mammary gland (MCF7), prostate (LNCaP), sternum (WM793), brain (U87), peripheral blood (Jurkat), lymph nodes (T cells), bone marrow (macrophage) and embryo (MEF). Cultured cells were transiently transfected by 100 ng pTriEx-mCh-LOVSoc or transduced by retroviruses encoding mCh-LOVSoc. The cytosolic Ca2+ concentrations were calculated by using calibration protocols as described in our earlier studies (Wang, 2014; Zhou et al., 2010a; 2010b; 2013). (c-f), Light-inducible Ca2+ flux reported by Ca2+ indicators. HeLa cells were transfected with mCh-LOVSoc (c, n = 12), mCh-LOVSoc + R-CaMP2 (d, n = 15) or mCh-LOVSoc + R-GECO1.2 (e, n= 20). Two-to-three dark-light cycles were applied to demonstrate the reversibility of photo-activated Ca2+ influx. Note that the acquisition of Fura-2 signals might induce the drift of the baseline, possibly due to residual preactivation of LOVSoc when excited at 380 nm in our imaging system. The half-life times of light-triggered cytosolic Ca2+ rise (t1/2,on) and Ca2+ decay (t1/2,off) after switching off the light stimulation were listed in panel (f).
Figure 1—figure supplement 4
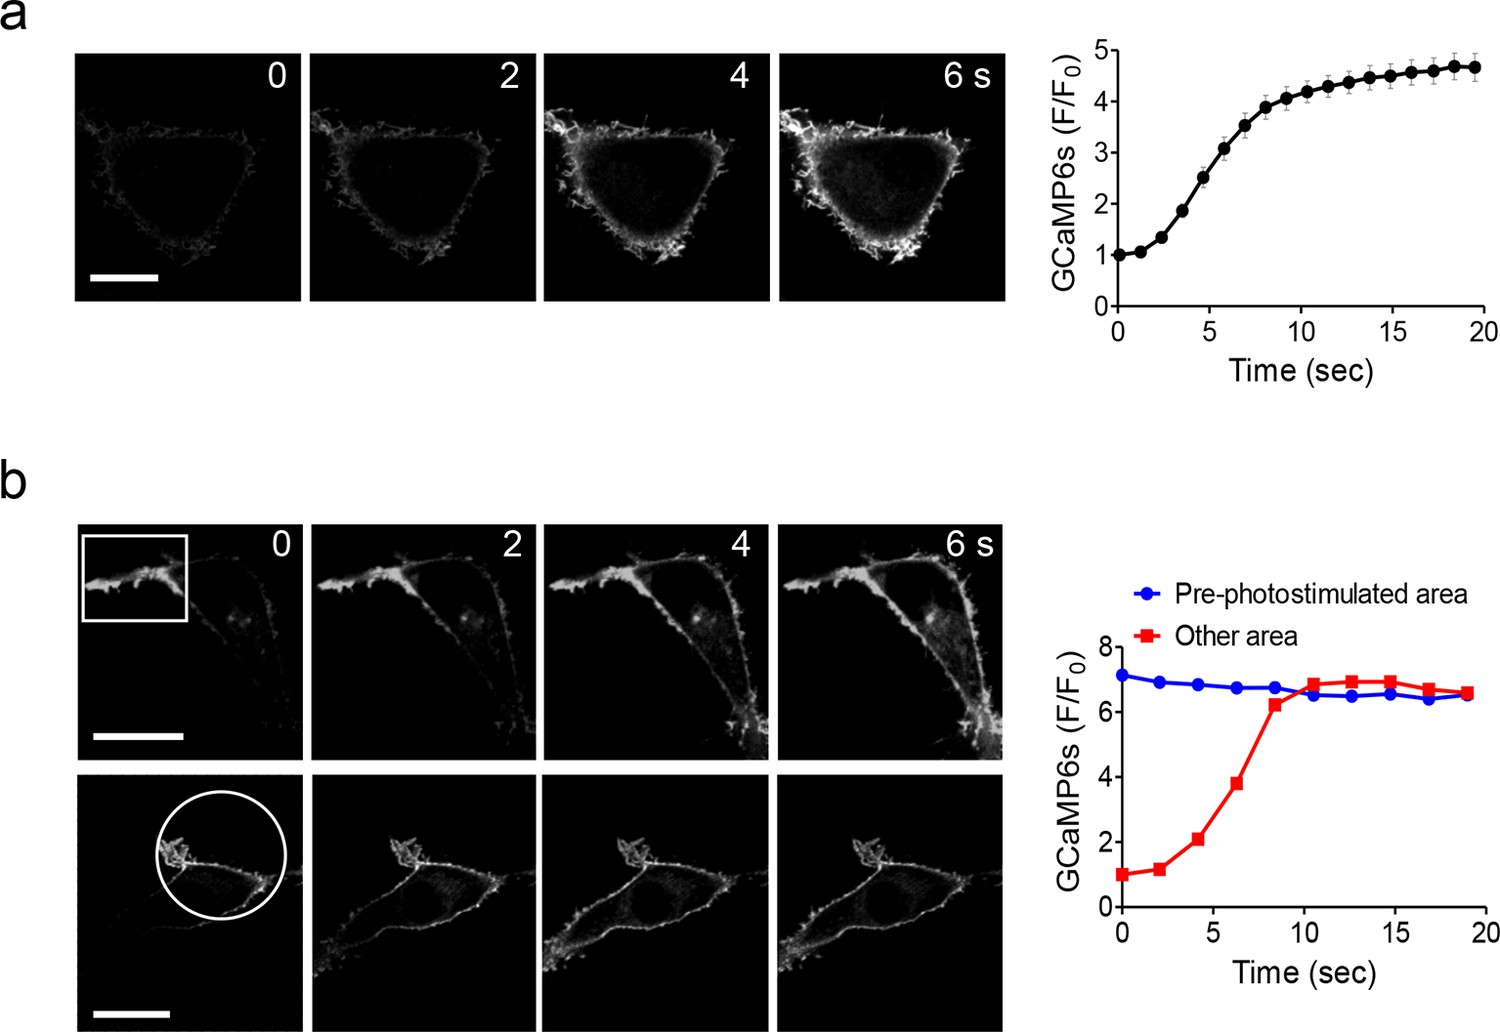
Global and local Ca2+ influx generated by photo-activation of LOVSoc at defined spatial resolution (related to Figure 1c).
(a), Confocal images of HEK293T cells transfected with GCaMP6s-CAAX and mCh-LOVSoc. The 488-nm confocal laser was able to globally activate mCh-LOVSoc to cause GCaMP6s signal increase within the whole illuminated field. Images were acquired within 1–2 s. The time course curve was plotted on the right. Data were collected from 10 cells from three independent experiments. Error bars denote s.e.m. (b), Spatially-defined photoexcitation led to local Ca2+ influx at desired areas in HeLa cells coexpressing GCaMP6s-CAAX and mCh-LOVSoc. Shown were representative confocal images of cells with the framed areas (box or circle) photostimulated by a 488-nm laser (10 s at a power density of 40 μW/mm2) prior to the acquisition of GCaMP6s signals in the whole field. The pre-photostimulated areas showed constant high levels of fluorescence intensities, indicating the preactivation of Ca2+ influx at those defined regions before image acquisition. By contrast, the non-prestimulated area showed a time course that was comparable to panel a. See Vedio 4 for the dynamic changes of GCaMP6s intensities.
Figure 1—figure supplement 5
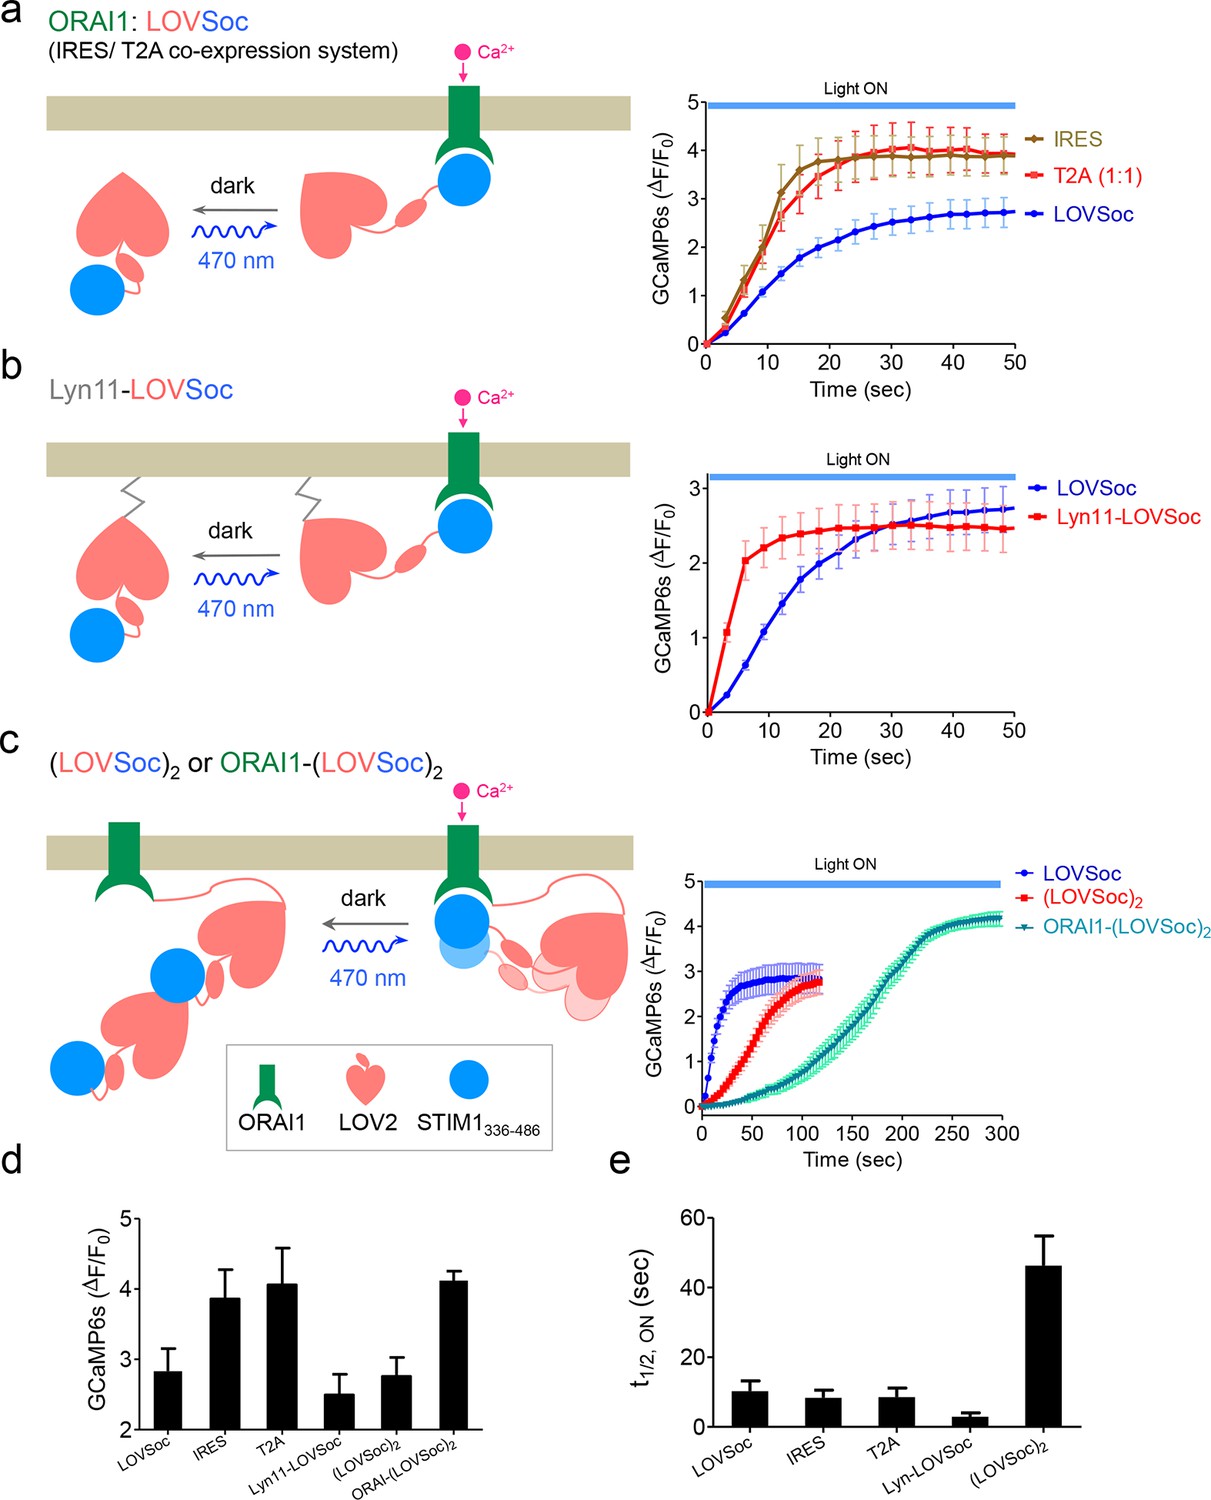
Schematic representation and light-induced response curves of Opto-CRAC variants reported by GCaMP6s.
(a-c), Photoactivated Ca2+ response curves for HeLa-GCaMP6s cells transfected with 100 ng of (a) coexpression vectors pMIG-mCh-LOVSoc-IRES-ORAI (IRES) or pTriEx-ORAI1-T2A-mCh-LOVSoc (T2A); (b) a PM-tethering construct pTriEx-Lyn11-mCh-LOVSoc; (c) pTriEx-mCh-(LOVSoc)2 or pTriEx-ORAI1-(LOVSoc)2 constructs that harbor two covalently-linked copies of LOVSoc. Transfected cells were subjected to light stimulation at 470 nm with a power density of 40 μW/mm2. Schematics of the design strategies were shown on the left. (d-e), Comparison of maximal fold-changes of GCaMP6s signals (d) and the time (e) required to reach half maximal GCaMP6s fluorescence during photoactivatable Ca2+ influx. Data were shown as mean ± s.e.m from 10–15 cells in two independent experiments.
Figure 1—figure supplement 6
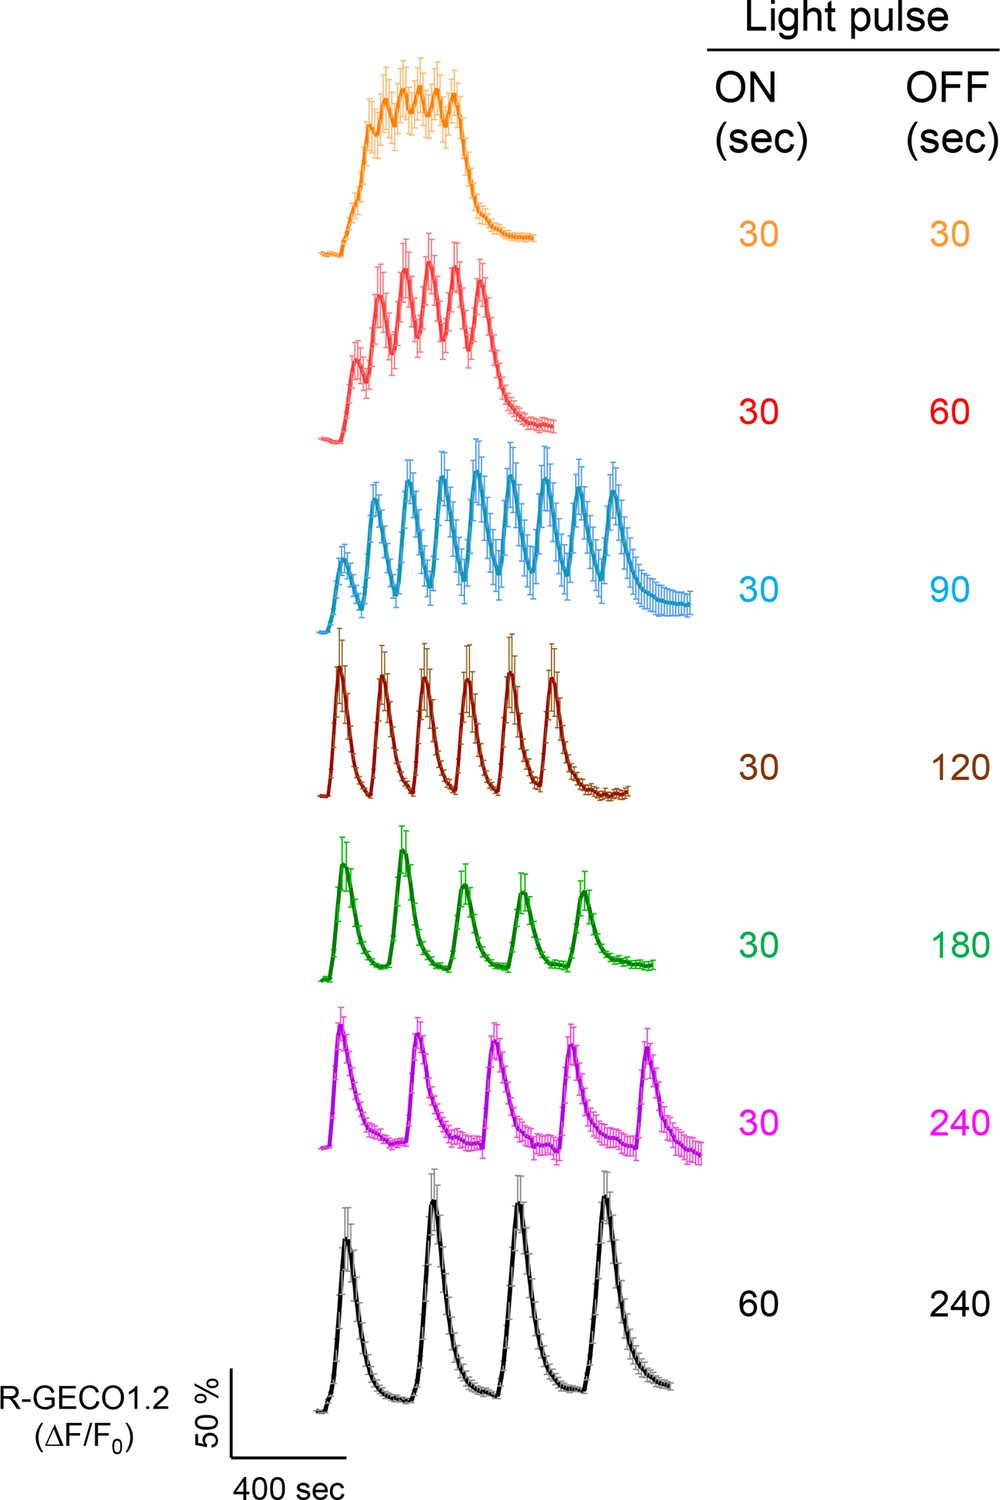
Examples of light-tunable Ca2+ oscillation patterns generated in HeLa cells (related to Figure 1d).
To generate and monitor calcium oscillation patterns, HeLa cells were transfected with mCh-LOVSoc and the red GECI R-GECO1.2. Blue light pulses were applied for 0.5 or 1 min with indicated intervals ranging from 0.5 min to 4 min. Data were shown as mean ± s.e.m from 6–8 cells.
Figure 2 with 1 supplement
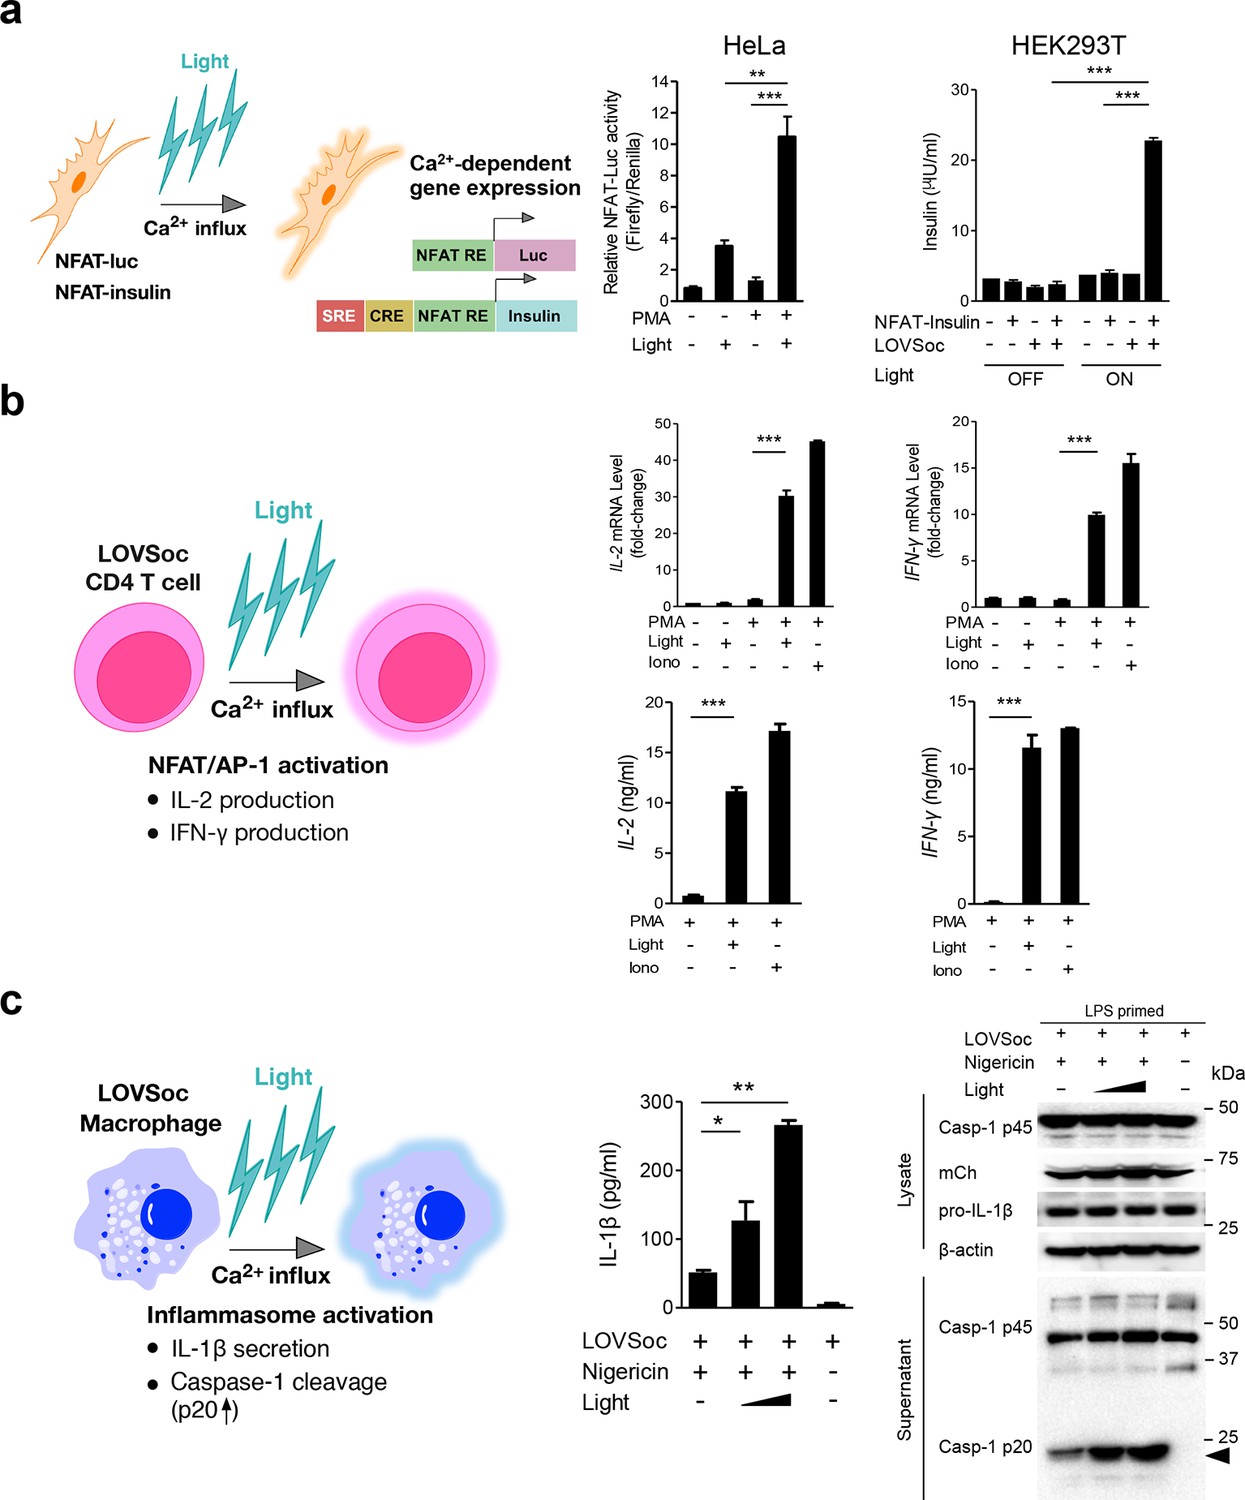
Photo-manipulation of Ca2+-dependent gene expression and immune response.
All data were shown as mean ± s.d. from three independent experiments. *P<0.05; **P<0.01; ***P<0.001 (paired Student’s t-test). (a), Light-triggered Ca2+-dependent gene expression. Cells were either kept in the dark or exposed to pulsed blue light (30 s on with 30 s interval; 40 μW/mm2) for 6 hr prior to cell lysis to quantify luciferase activity (middle) or insulin production (right). Iono, ionomycin. PMA, phorbol 12-myristate 13-acetate. Left panel, Schematic of experimental design. Three upstream Ca2+-responsive elements in the 5’ transcription regulatory region enable efficient initiation of gene expression of the downstream Ins1 gene encoding insulin following LOVSoc-mediated photoactivatable Ca2+ entry and NFAT nuclear translocation. SRE, serum-response element; CRE, cyclic adenosine monophosphate response element; NFAT RE, nuclear factor of activated T cells response element. Middle panel, Ca2+/NFAT-dependent luciferase activity in HeLa cells transfected with LOVSoc and an NFAT-dependent firefly luciferase reporter vector. A third plasmid encoding the Renilla luciferase gene was cotransfected as a reference gene for normalization of gene expression. Right panel, Photo-inducible insulin production driven by Ca2+-responsive elements in HEK293T cells. (b), Photo-inducible expression of IL-2 and IFN-γ genes in mouse CD4+ T cells expressing the LOVSoc construct. Mouse CD4+ T cells were enriched and purified using an immunomagnetic negative selection kit and transduced with a retrovirus encoding mCh-LOVSoc. On day 5 after transduction and expansion in the presence of IL-2, cells were treated with or without PMA, shielded from light or illuminated with blue light for 8 hr, and then lysed for qPCR (upper panels) or ELISA analyses (lower panels). The schematic of the experiment was shown on the left. Upper panel, Optogenetic stimulation of cytokine production in mouse CD4+ effector T cells transduced with a retrovirus encoding mCh-LOVSoc. Right panel, Cytokine production (IL-2 and IFN-γ that are characteristic of activated CD4+ T cells) was determined by ELISA. (c), Photo-tunable amplification of inflammasome activation in macrophages. Human THP-1-derived macrophages were transduced with lentiviruses expressing mCh-LOVSoc, primed with LPS (100 ng/ml) and incubated with inflammasome inducer nigericin (10 μM) for 6 hr. Cells were either shielded from light or illuminated with pulsed blue light for 8 hr at power densities of 5 or 40 μW/mm2. The cell lysates were collected for ELISA analysis (left) and WB (right). The schematic of the experiment was shown on the left. Left panel, the amount of secreted IL-1β in the culture supernatant quantified by ELISA. Right panel, NLRP3 inflammasome activation assessed by Western blotting of lysates and supernatants harvested from cells treated with indicated conditions. Arrowhead, processed caspase 1 (Casp-1) subunit p20.
Figure 2—figure supplement 1
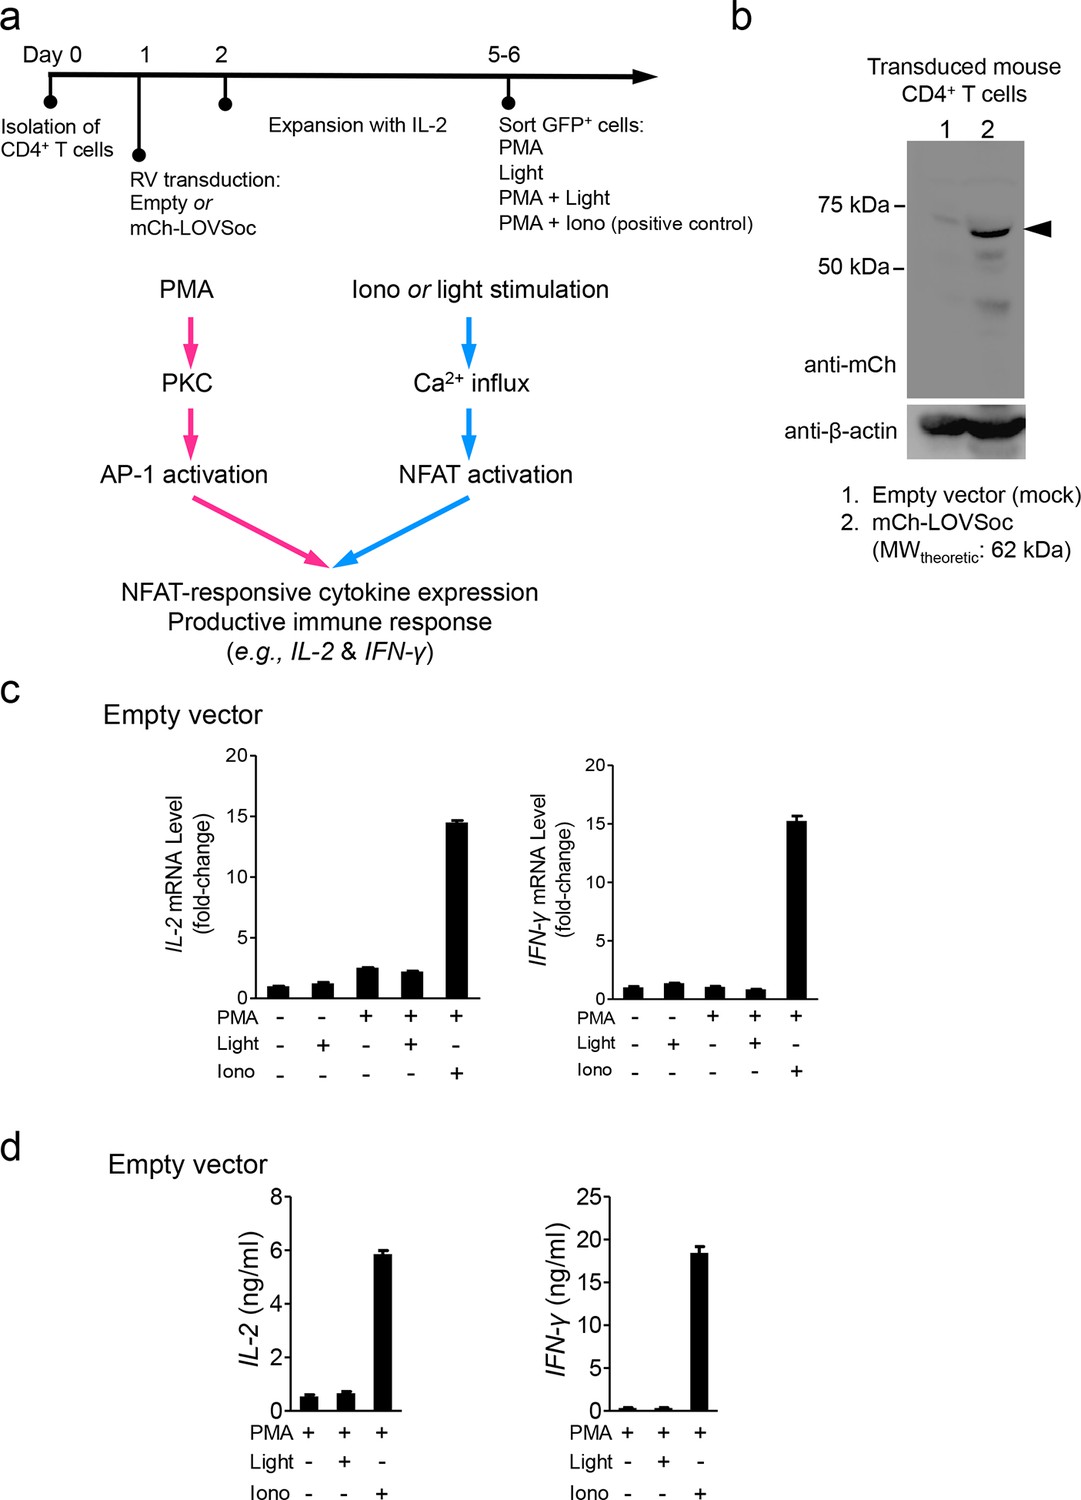
Retroviral transduction of CD4+ T cells and control experiments (related to Figure 2b).
(a), Schematic illustration of the experimental protocol and NFAT-responsive cytokine expression in retrovirally transduced mouse CD4+ T cells. RV, retroviruses packaged from Platinum-E cells transfected with pMIG constructs; PMA, phorbol myristate acetate used to activate protein kinase C (PKC); Iono, the Ca2+ ionophore ionomycin used to elicit Ca2+ influx; AP-1, the activator protein complex 1 that cooperates with NFAT to drive gene expression. (b), Western blot analysis of cell lysates from mouse CD4+ T cells transduced with retroviruses encoding the empty vector (lane 1) or mCh-LOVSoc (lane 2). (c-d), IL-2 and IFN-γ expression quantified by qPCR (c) and ELISA (d) in mouse CD4+ T cells transduced with the mock retrovirus under indicated stimulation conditions. Light illumination in the presence or absence of PMA failed to cause productive cytokine expression. Data were shown as mean ± s.e.m from 12 wells in three independent experiments.
Figure 3 with 3 supplements
NIR light control of Opto-CRAC by lanthanide-doped upconversion nanoparticles.
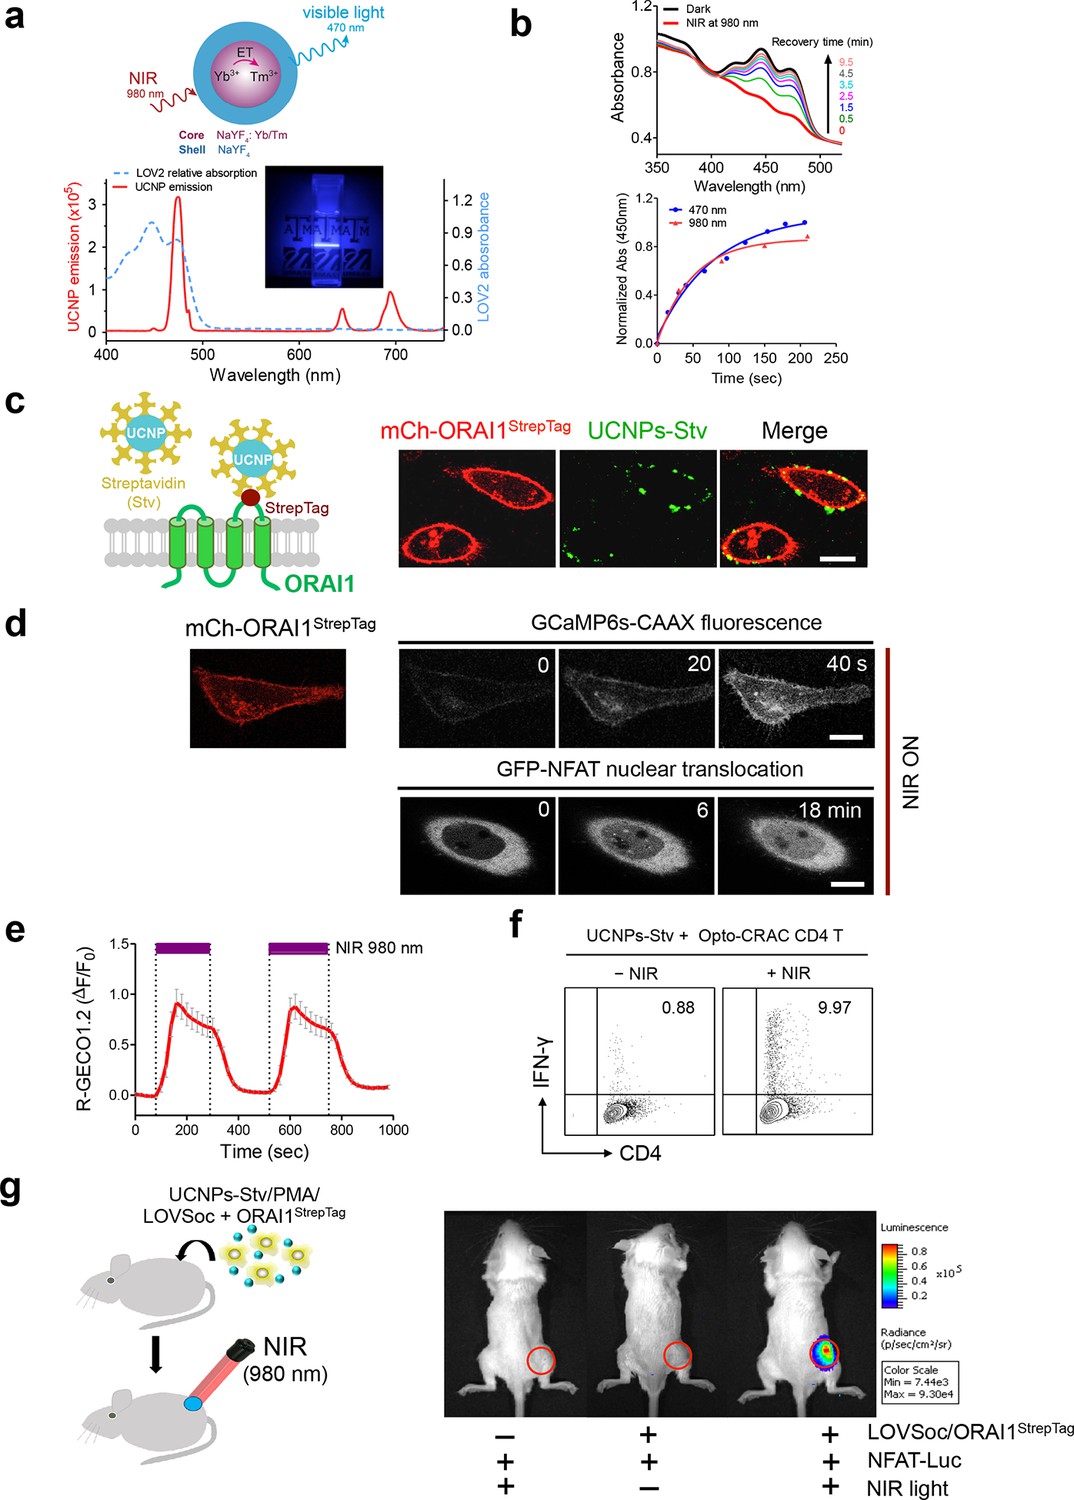
(a), Physiochemical properties of the synthesized upconversion nanoparticles. Upper panel, schematic illustration of the core/shell structure and energy transfer (ET) among lanthanide ions in the NaYF4: Yb, Tm@NaYF4 upconversion nanoparticles (UCNPs). Lower panel, the emission spectrum of NaYF4: Yb, Tm@NaYF4 (solid red line) upon 980 nm CW laser irradiation (15 mW/mm2) superimposed by the absorbance spectrum of recombinant LOV2 protein (dashed blue line). Inset: the bright blue emission could efficiently lighten the background upon NIR light illumination at 980 nm. (b), NIR light-induced changes in the absorption spectra of purified MBP-LOVSoc at different time interval after mixing with UCNPs-Stv and irradiation with a 980 nm laser (1 min at a power density of 30 mW/mm2). After blue (excited at 470 nm as control, blue circle) or NIR (red triangle) light stimulation, the recovery time course of LOV2 absorbance at 450 nm was plotted in the lower panel. (c), Specific targeting of streptavidin-conjugated UCNPs to engineered ORAI1 channels in the plasma membrane of HeLa cells. Left panel, Schematic showing the interaction between streptavidin-coated upconversion nanoparticles (UCNPs-Stv) and the engineered ORAI1 Ca2+ channel that harbors a streptavidin-binding tag (StrepTag) in the second extracellular loop. The mCh-ORAI1StrepTag protein was able to efficiently recruit and anchor UCNPs-Stv to the plasma membrane of transfected HeLa cells. Right panel, Florescence microscopy imaging showing the accumulation of UCNPs-Stv (green, λex: 980 nm, λem: 450–500 nm) on the plasma membrane of cells transfected with mCh-ORAI1-StrepTag. Scale bar, 10 μm. (d), NIR light-triggered Ca2+ influx and NFAT nuclear translocation in HeLa cells coexpressing mCh-ORAI1StrepTag and LOVSoc. Ca2+ influx was monitored by GCaMP6s fluorescence whilst GFP-NFAT translocation was reported by GFP signals. Transfected cells were mixed with UCNPs-Stv (20 μg/μl) and illuminated by a 980-nm CW laser to trigger the Ca2+ influx. The relatively slow onset of Ca2+ influx and NFAT nuclear translocation provided us a time window to quickly capture the green signals without noticeably activating LOVSoc during image acquisition at low excitation energy (<1 μW/mm2). Scale bar, 10 μm. (e), NIR light-induced reversible Ca2+ influx reported by R-GECO1.2. HeLa cells were transfected with an IRES bicistronic pMIG retroviral construct that enabled coexpression of ORAI1StrepTag and mCh-LOVSoc. Transfected cells were mixed with 5 mg UCNPs-Stv and illuminated by a 980-nm laser at 30 mW/mm2 to trigger the Ca2+ influx. Data were shown as mean ± s.e.m. from 12 cells in two independent experiments. (f), Flow cytometry analysis of IFN-γ production in mouse CD4+ T lymphocytes transduced with retroviruses co-expressing mCh-LOVSoc and ORAI1StrepTag. Freshly isolated CD4+ T cells were subjected to in vitro differentiation as described in Figure 2b, incubated with 20 μg/μl UCNPs-Stv and 1 μM PMA, and exposed to overnight NIR light pulse (ON/OFF interval of 30 s, 980 nm, 30 mW/mm2) prior to analysis. (g), NFAT-dependent luciferase expression in vivo triggered by NIR light stimulation. Left, Schematic of experimental setup. HeLa cells were transfected with NFAT-Luc and constructs encoding LOVSoc/ORAI1StrepTag. 48 hr post-transfection, cells were treated with 1 μM PMA, incubated with 10 mg UCNPs-Stv (blue sphere) and implanted to the flanks of mice subcutaneously. The implanted areas were then subjected to NIR light irradiation (red) with a 980 nm CW laser (50 mW/mm2, 30 sec ON, 30 sec OFF for a total of 25 min). Right, Shown were bioluminescence imaging of three representative BALB/c mice, one implanted with HeLa cells expressing NFAT-Luc only (left) and the other two with cells expressing LOVSoc and NFAT-Luc (middle and right). Mice were subjected to NIR light irradiation (left and right) with a 980 nm CW laser. The images were acquired 20 min after receiving a single dose of luciferin (100 μL, 15 mg/ml, s.c.). Luciferase-catalyzed bioluminescence was visualized as false color with the same rainbow scale bar for all acquired images. Red circle, implanted area.
Figure 3—figure supplement 1
Synthesis scheme and in vitro characterization of UCNPs.
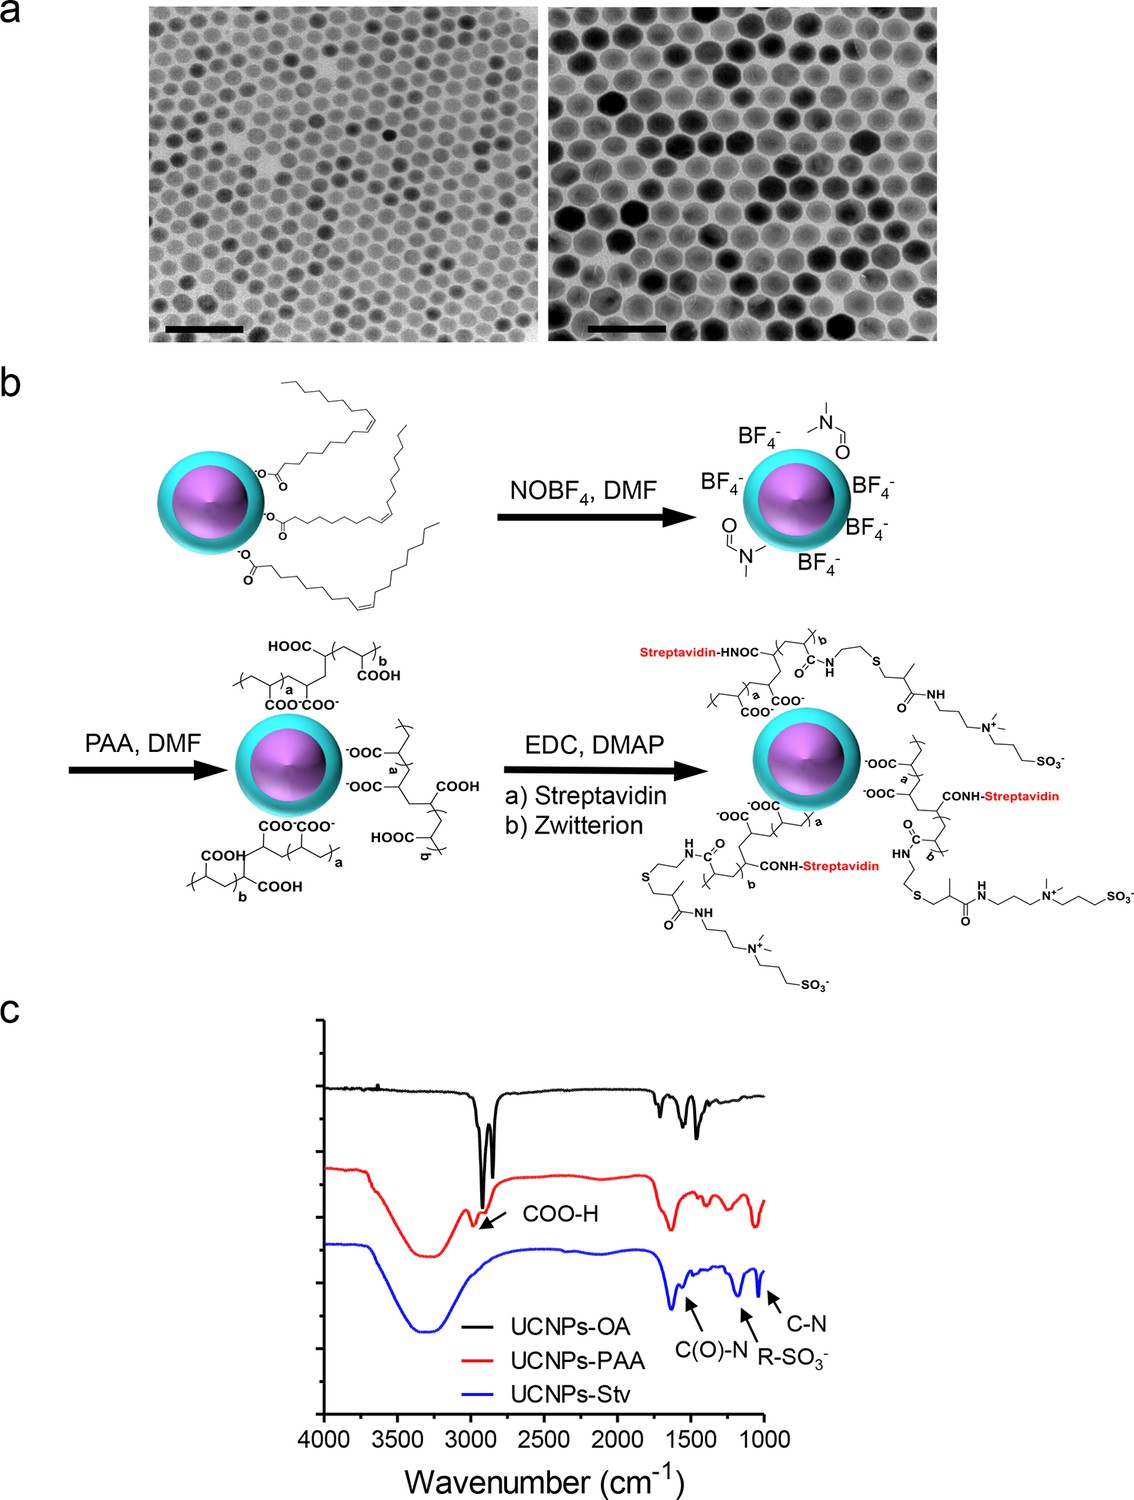
(a), TEM images of as-synthesized β-NaYF4: Yb,Tm core/shell UCNPs (UCNPs-OA), after PAA surface coating (UCNPs-PAA) and further modifications with streptavidin (UCNPs -Stv). Scale bar, 100 nm. (b), Schematic illustration of the surface modification procedures for water-soluble and streptavidin functionalized β-NaYF4: Yb, Tm/NaYF4 UCNPs. (c), FT-IR spectra of UCNPs with different surface modifications. In the spectrum representative of UCNPs-PAA, the peaks at 2898 and 2982 cm-1 were attributed to the resonance of COO-H. This PAA-specific peak disappeared after its amidation with zwitterion and streptavidin conjugation, but new peaks at 1554, 1182 and 1042 cm-1 emerged. These new peaks were attributed to the C(O)-N, R-SO3- and C-N vibrations, respectively.
Figure 3—figure supplement 2
Green-emitting UCNPs did not activate Opto-CRAC channels upon NIR light stimulation (related to Figure 3d).
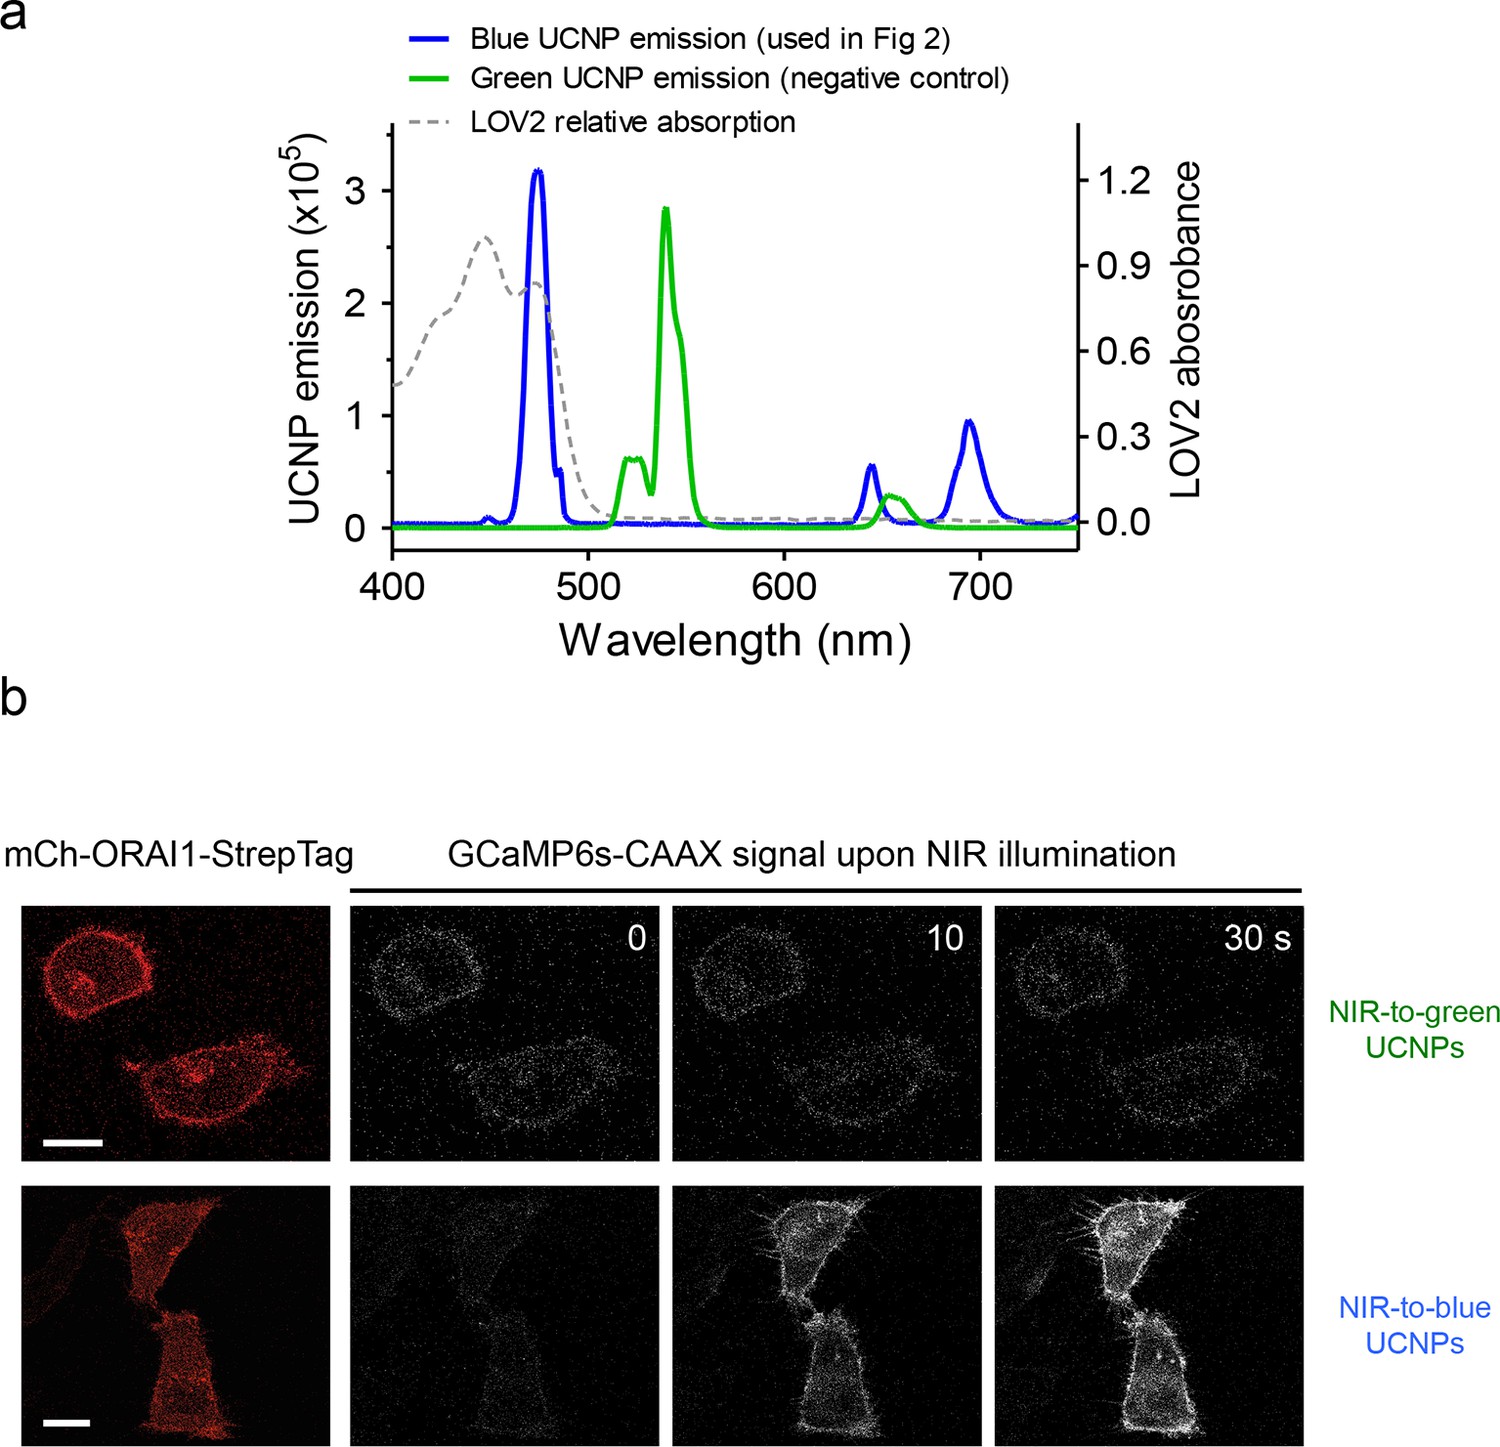
(a), Overlaid spectra of NaYF4: Yb, 2%Er@NaYF4 with green emission under 980 nm CW laser (green line), NaYF4: Yb, Tm@NaYF4 with blue emission upon 980 nm irradiation (blue line) and the absorbance of LOV2 domain. (b), Time-lapse images of GCaMP6s-CAAX in the illuminated region. Hela cells coexpressing mCh-ORAI1-StrepTag and LOVSoc were mixed with either blue-emitting (used in Figure 3d) or green-emitting UCNPs-Stv and then irradiated by a 980 nm CW laser (30 mW/mm2). Blue-emitting UCNPs generated a steady increase in fluorescence whilst green-emitting UCNPs caused no significant change in the fluorescence intensity.
Figure 3—figure supplement 3
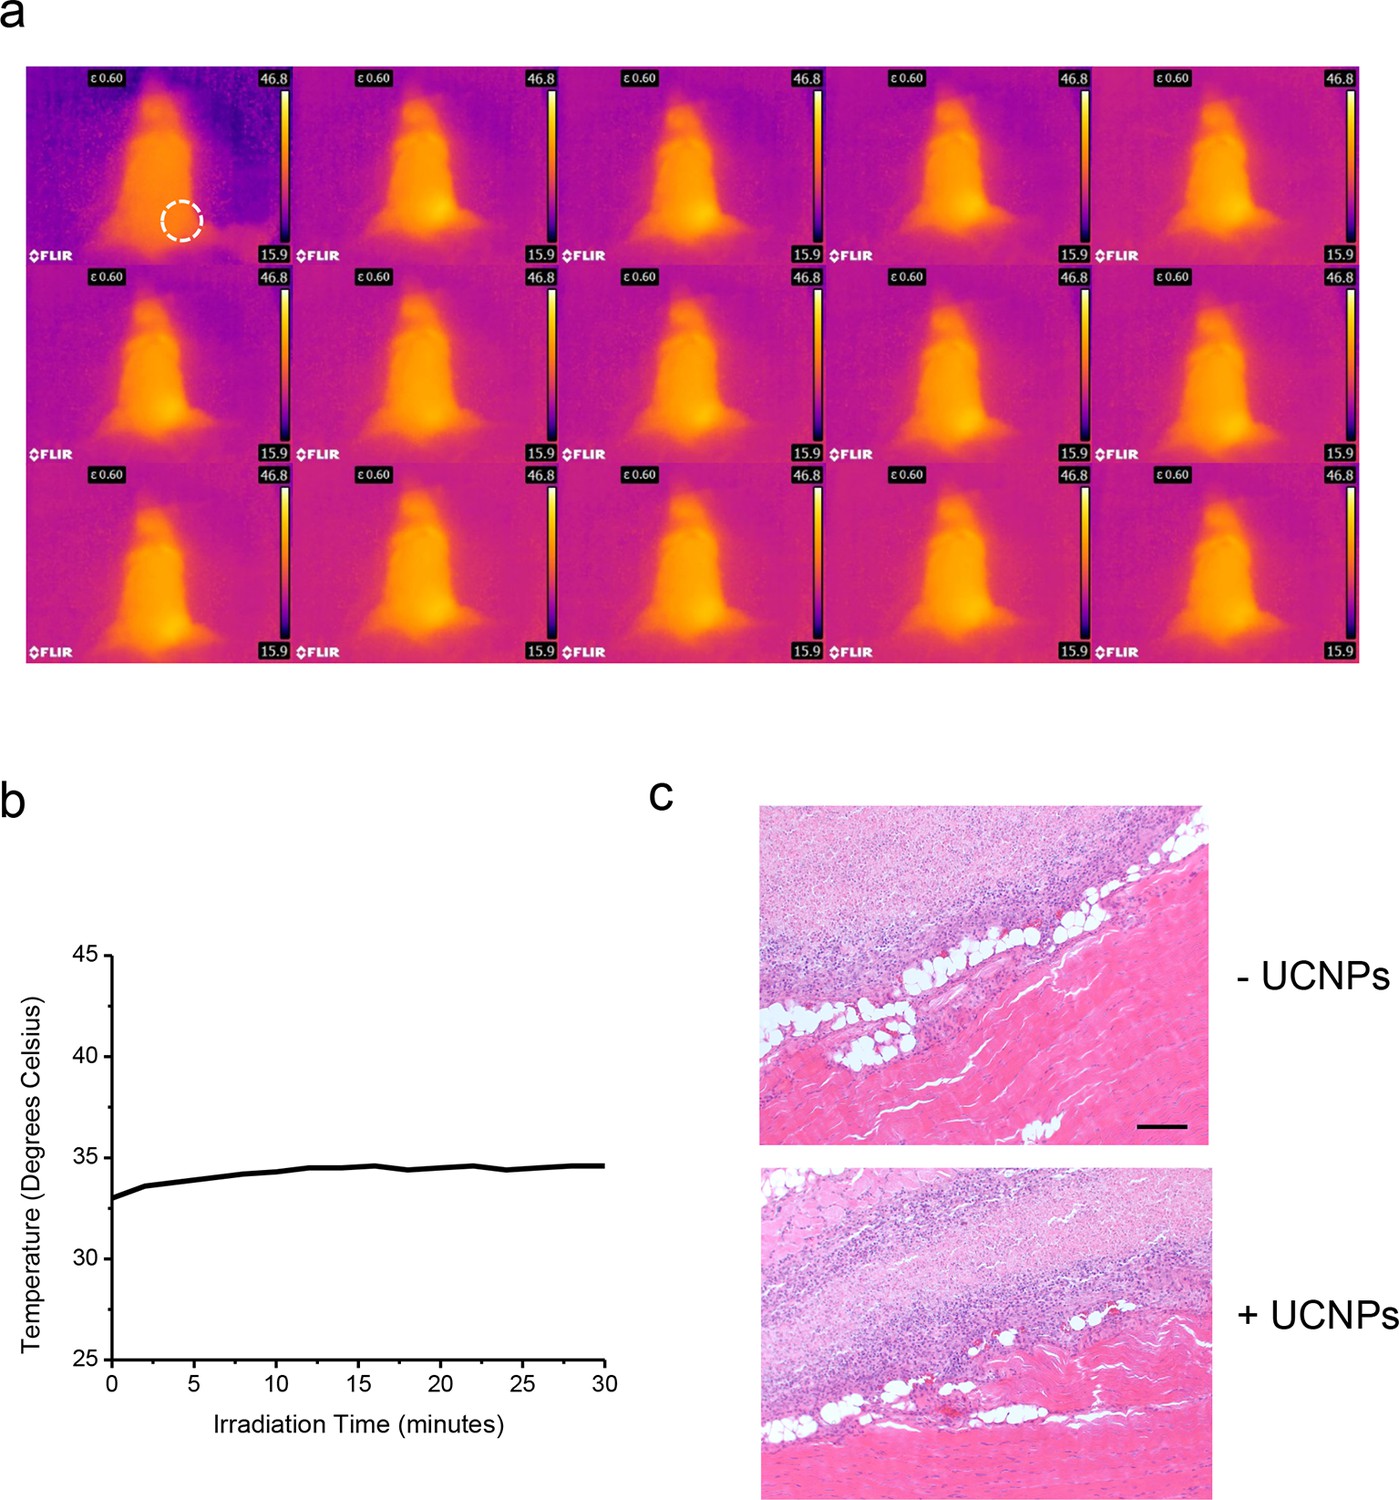
No noticeable heat generation during the in vivo experiment.
(a), Thermal imaging at two minute intervals. (b), Temperature change over time plot (right) of a Balb/c mouse exposed to 50 mW/mm2 980nm laser irradiation for 30 min. (c), Histological sections of implantation positions 14 days after ectopic injection and NIR treatment in mice. Fixed tissues isolated around the injection sites were subjected to hematoxylin/eosin staining. The sections represent HeLa cells without (upper) or with UCNPs (lower) loaded during the injection. Scale bar, 200 μm.
Figure 4
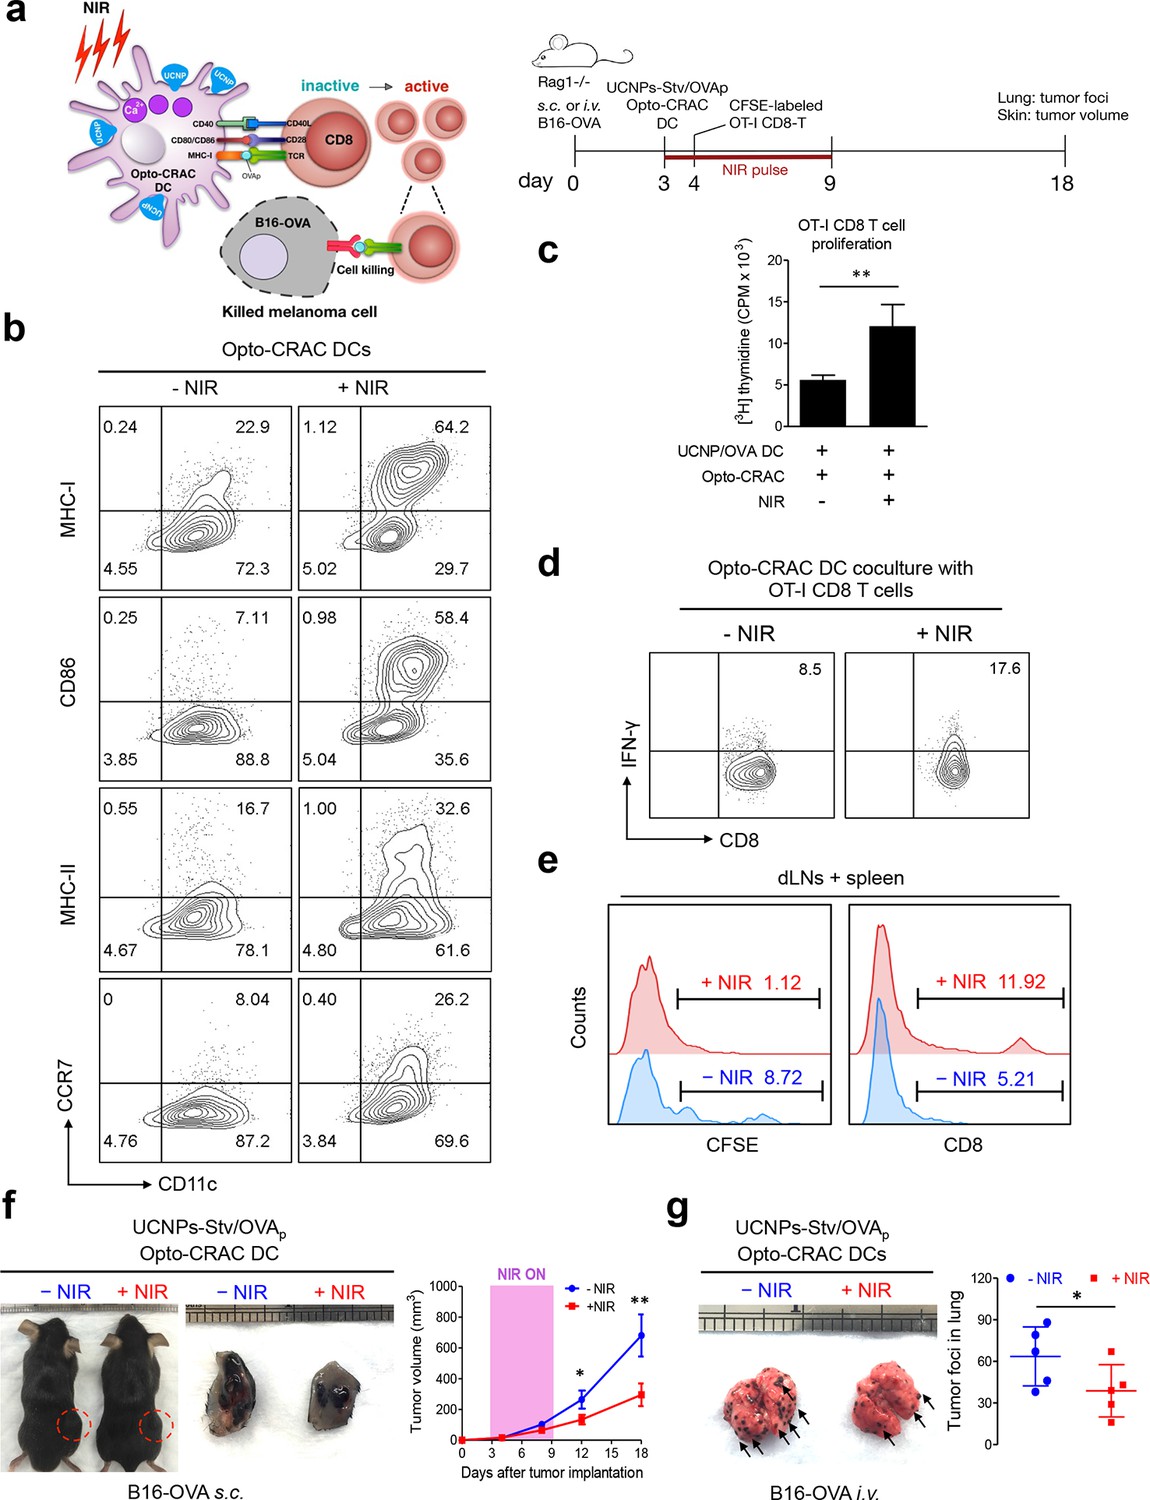
NIR light control of Opto-CRAC DC-mediated antigen cross-presentation to OT-I CD8 T cells and B16-OVA melanoma killing.
Data were shown as mean ± s.e.m. from at least three independent experiments. *p<0.05; **p<0.01; ***p<0.001 (paired Student’s t-test). (a), Scheme showing the experimental design. NIR-stimulated Ca2+ influx in Opto-CRAC DCs prompts immature DC maturation and OVA antigen cross-presentation to activate and boost anti-tumor immune responses mediated by OT-1 CD8 T cells (cytotoxic T lymphocytes, CTLs), thereby sensitizing tumor cells to OVA-specific, CTL-mediated killing in the B16-OVA melanoma model. OVA peptide (OVAp, 257SIINFEKL264) is used here as a surrogate tumor antigen. Rag1-/- mice were subcutaneously (s.c.) implanted in the flank or intravenously (i.v.) injected with 2 x 10⁶ B16-OVA tumor cells per mice to induce melanoma and lung metastasis. Bone marrow-derived dendritic cells (BMDCs) expressing the Opto-CRAC system (Opto-CRAC DCs) were pulsed with UCNPs-Stv and OVA257-264 peptides and injected into Rag1-/- mice 3 days after tumor cell injection. Sorted OT-I CD8 cells from OT-I Rag1-/- mice, which are labeled by CSFE for monitoring DC antigen cross-presentation and T cell proliferation in vivo, were transferred into B16 tumor-bearing mice one day after Opto-CRAC DC infusion. Mice were kept in dark or exposed to NIR for 1 week (8 hr per day, 1 min ON/OFF pulse, 30 mW/mm2) after DC injection to stimulate Opto-CRAC DC maturation in vivo and photo-boost tumor antigen cross-presentation. 5 days after adoptive transfer, tumor draining lymph nodes (dLNs) and spleen were harvest for FACS (panel e) analysis on CFSE-labeled CD8 T cells. Tumor growth was measured by caliper (panel f) and mice were sacrificed on day 18 for lung metastasis analysis (panel g). (b), Flow cytometric analysis on the expression levels of MHC, co-stimulatory and chemokine receptor molecules in BMDCs. Cells were double-immunolabeled with CD11c-FITC vs MHC class I-PE, CD86-PE, MHC class II-APC or CCR7-PE and analyzed three days after viral transduction of Opto-CRAC. UCNPs-Stv/ OVA loaded Opto-CRAC DCs were exposed or shielded from NIR illumination for 48 hr (30 mW/mm2 with 1 min pulse interval) prior to analysis. (c), Proliferation of sorted naïve OT-I CD8 T cells co-cultured with UCNPs-Stv/OVA loaded Opto-CRAC DCs, with or without NIR illumination, was measured by the [3H] thymidine incorporation assay. (d), Flow cytometric analysis of IFN-γ production in sorted naïve OT-I CD8 T cells co-cultured with UCNPs-Stv/OVA loaded Opto-CRAC DCs with or without NIR stimulation. (e), Flow cytometric analysis of in vivo proliferation of CFSE-APC labeled OT-I CD8 T cells in dLNs and spleen 6 days after injection of UCNPs-Stv/OVA loaded Opto-CRAC DCs with or without NIR pulse excitation (30 mW/mm2) as indicated in panel a. (f), Tumor-inoculated sites (left) were isolated from tumor-bearing mice (n = 5) shielded or exposed to NIR and the tumor sizes (mm3) were measured at indicated time points shown in the growth curve (right) after tumor implantation. (g), Representative lungs with melanoma metastases (left) were isolated from tumor-bearing mice shielded or exposed to NIR. The histogram represents counted numbers of visible pigmented tumor foci (as exemplified by the arrows) with pulmonary melanoma metastases on the surface of lungs (right panel; n = 5 mice).
Videos
Video 1
Light-triggered reversible cytosol-to-PM translocation of mCh-LOVSoc.
Three dark-light cycles were applied to HEK293-ORAI1 stable cells transfected with the Opto-CRAC construct mCh-LOVSoc.
Video 2
Time-lapse imaging of light-triggered Ca2+ influx reported by cytosolic (left) or PM-tethered GCaMP6s.
HeLa cells expressing mCh-LOVSoc was exposed to a 488-nm confocal laser.
Video 3
Light-inducible Ca2+ influx monitored with TIRF microscopy in HeLa cells coexpressing GCaMP6s-CAAX and mCh-LOVSoc.
https://doi.org/10.7554/eLife.10024.012
Video 4
Sequential and localized activation of Ca2+ influx with defined spatial resolution.
Imaging was performed on HeLa cells cotranfected with mCh-LOVSoc and GCaMP6s-CAAX. The boxed area was subjected to a brief photostimulation with the 488-nm laser for 10 s, followed by photoexcitation of the whole field at 488 nm to acquire GCaMP6s-CAAX signals. The boxed area showed preactivation of Ca2+ influx as reflected by the strong fluorescence signal at time point 0 s; whilst the other areas exhibited a gradual increase in fluorescence intensity following 488-nm light illumination.
Video 5
Light-inducible nuclear translocation of NFAT in HeLa cells.
The HeLa GFP-NFAT stable cell line was transiently transfected with mCh-LOVSoc and exposed to pulsed light stimulation at 470 nm (30 s for every 1 min). Shown were fluorescence signals from the green (GFP-NFAT, left panel) and red (mCh-LOVSoc, right panel) channels in the same field. Only cells expressing the Opto-CRAC construct (mCherry-positive, lower right corner) showed light-dependent NFAT nuclear translocation. Note that the cytosol-to-PM translocation of mCh-LOVSoc is not evident as in Video 1 due to the low expression level of endogenous ORAI1 in HeLa cells and much more abundant expression of mCh-LOVSoc. Nonetheless, the light-triggered activation of endogenous ORAI1 channel was sufficient to activate the downstream GFP-NFAT nuclear translocation.
Download links
A two-part list of links to download the article, or parts of the article, in various formats.
Downloads (link to download the article as PDF)
Open citations (links to open the citations from this article in various online reference manager services)
Cite this article (links to download the citations from this article in formats compatible with various reference manager tools)
Near-infrared photoactivatable control of Ca2+ signaling and optogenetic immunomodulation
eLife 4:e10024.
https://doi.org/10.7554/eLife.10024


