Differential interaction forces govern bacterial sorting in early biofilms
- University of Cologne, Germany
Figures
Figure 1
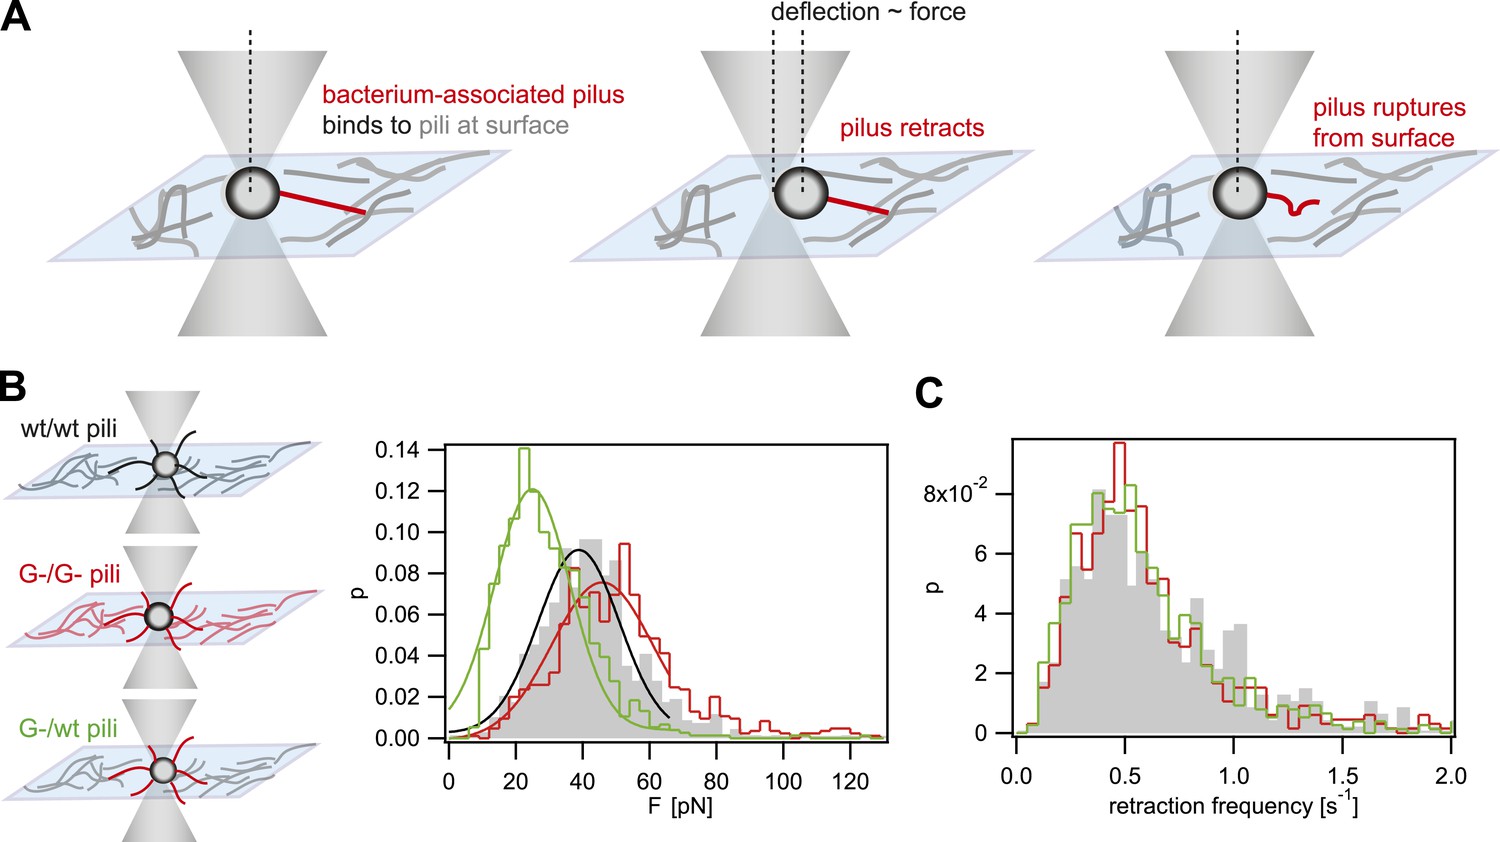
Rupture forces between T4P.
(A) Principle of force measurement. The surface was coated with pili. A single monococcus was trapped in an optical trap. One or multiple pili can bind to pili at the surface. When they retract they deflect the bacterium from the center of the laser trap. The deflection is proportional to the force acting on the bond between the bacterium-associated pili and the pili at the surface. When the bond between the pili is ruptured, the bacterium moved back to the center of the trap. For each retraction event, the maximum force generated prior to rupture was registered as the rupture force. (B) Distribution of rupture forces. Full lines: Gaussian fit for F < 65 pN. For F > 65 pN, the linear regime is exceeded and forces are overestimated. (C) Distribution of retraction frequencies. Gray bars: wt bacteria on surface coated with wt pili. Red line: G− green bacteria on surface coated with G− green pili. Green line: G− green bacteria on surface coated with wt pili.
Figure 2

Assay for direct visualization of spatio-temporal dynamics of a new clone and its progeny within an expanding microcolony.
(A) Strategy for visualization of a new clone. Genomic DNA (gDNA) from strain P+ green in which gfpmut3 recombines into igA1 is spread on the agar surface. When a single bacterium imports and integrates the DNA, then the bacterium becomes fluorescent. Type IV pilus (T4P) is unaffected. (B) Time-lapse of de novo occurring P+ green clone (orange) within an expanding wt colony. Scale bar: 10 µm. The arrow denotes the time point when fluorescence is detectable.
Figure 3
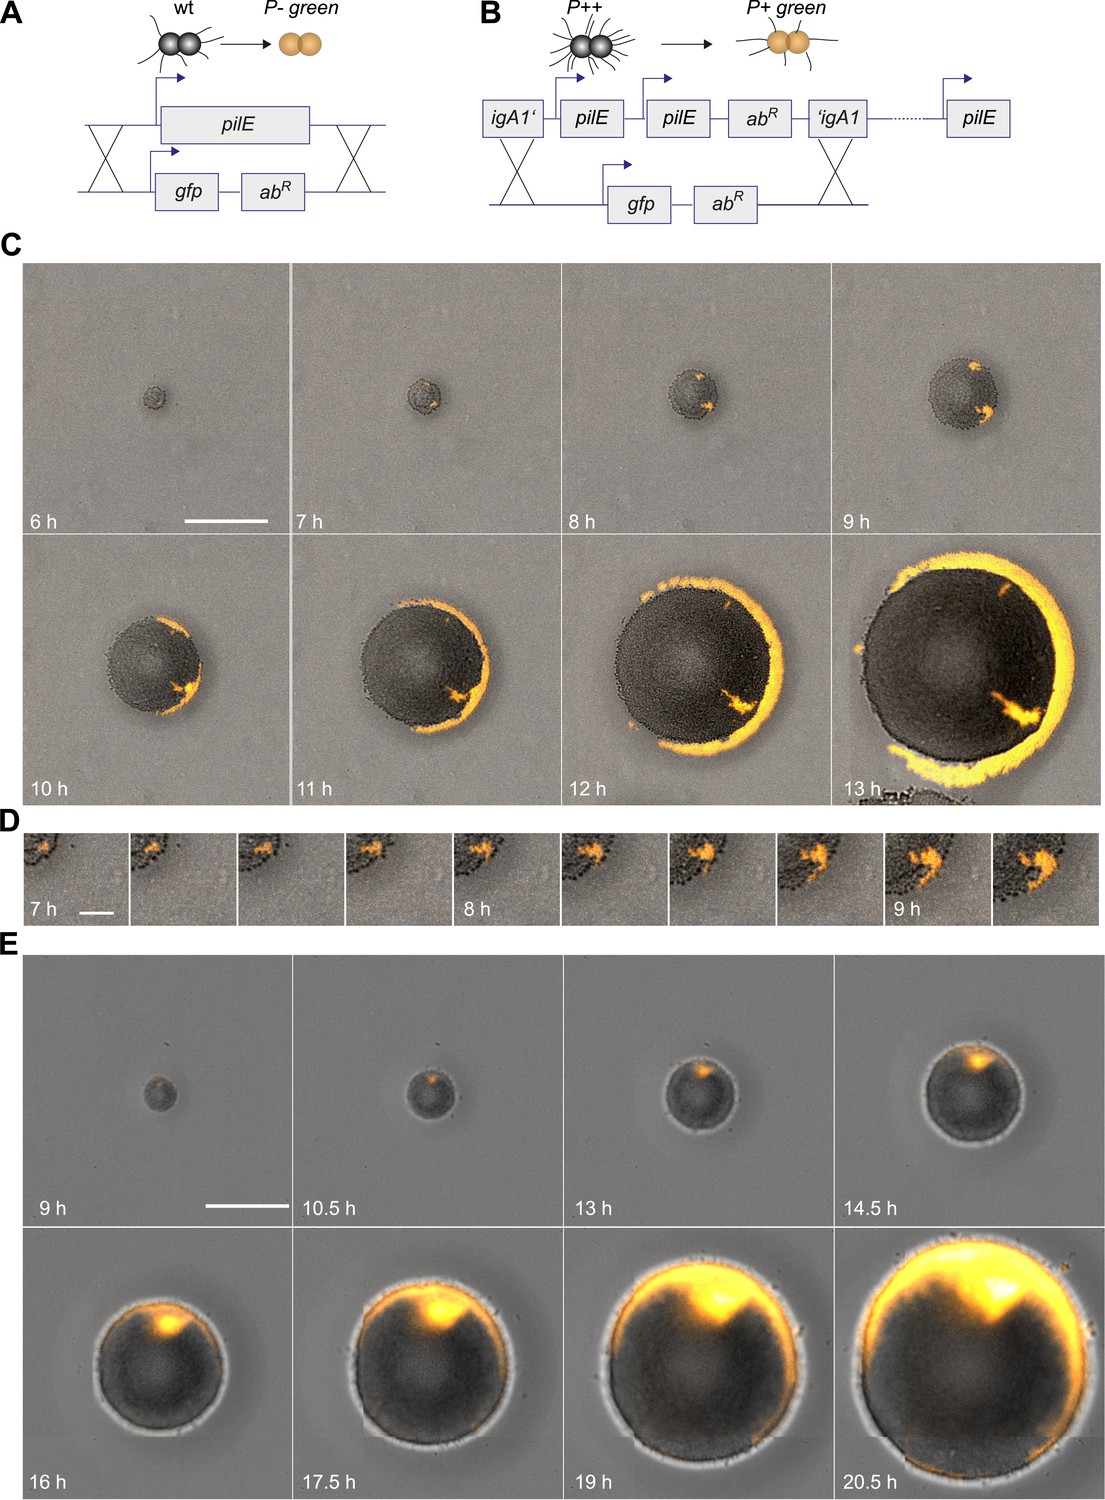
Spatio-temporal dynamics of de novo occurrence of clones with reduced pilus density and their offspring.
(A) Strategy for visualization of pilus-loss in a single bacterium. gDNA from strain P− green in which pilE is replaced by gfpmut3 is spread on the agar surface. Upon import and integration of DNA into a single bacterium, pili are lost and the bacterium becomes fluorescent. (B) Strategy for visualization of reduction of pilus-density. gDNA from P+ green strain is spread on the agar surface. Integration of DNA into a single hyperpiliated P++ bacterium carrying two additional copies of pilE in the igA1 locus led to the pilus density decreasing to wt level and to the acquisition of fluorescence. (C) Time-lapse of de novo occurring P− green clone (orange) within an expanding colony. Scale bar: 50 µm. (D) Detail of (C). Scale bar: 10 µm. (E) Time-lapse of de novo occurring P+ green clone (orange) within an expanding colony of P++. Scale bar: 50 µm.
Figure 4
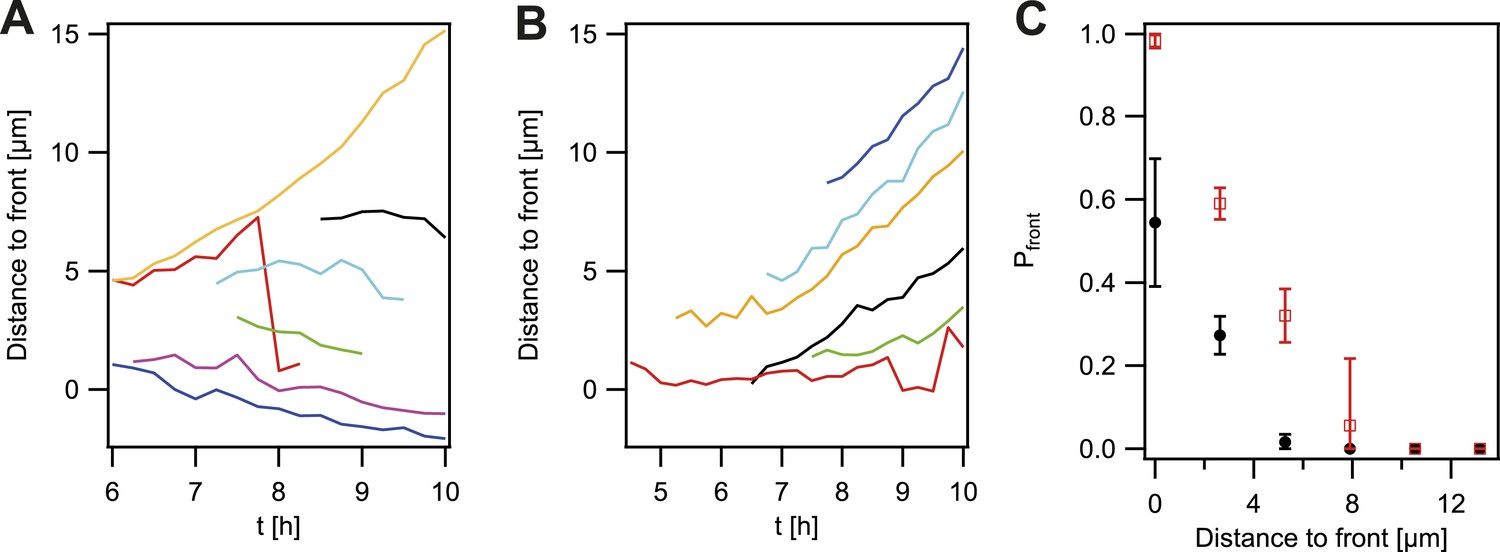
Probability that the offspring of a newly arisen P− gonococcus is moving towards the expanding front.
(A) Location of the bacterium closest to the front of the P− green subpopulation as a function of time. (7 out of 148 traces are shown.) (B) Location of the bacterium closest to the front of the P+ green subpopulation as a function of time. (6 out of 307 traces are shown.) (C) Probability that the offspring moves towards the front as a function of its distance from the front for P− green (red) and P+ green (black). Error bars: standard deviation of three independent experiments weighted with the number of traces per experiment.
Figure 5 with 2 supplements

Spreading of new clones within an expanding colony.
gDNA from P− green was spread on the agar plate and wt cells were seeded. (A) Fluorescence time lapse. Yellow lines: front of the expanding colony. Red outlines: boundaries of sectors formed by the offspring of a single transformant. Scale bar: 10 µm. Spatial variance of three sectors as a function of (B) time and (C) number of offspring (fluorescent bacteria per sector). The colors correspond to the colors of the numbers at 8.75 hr. (D) Average variance of P− green (red) and P+ green (black) within the colony as a function of the number of offspring N. Error bars: standard error as obtained from >50 sectors for each condition.
Figure 5—figure supplement 1
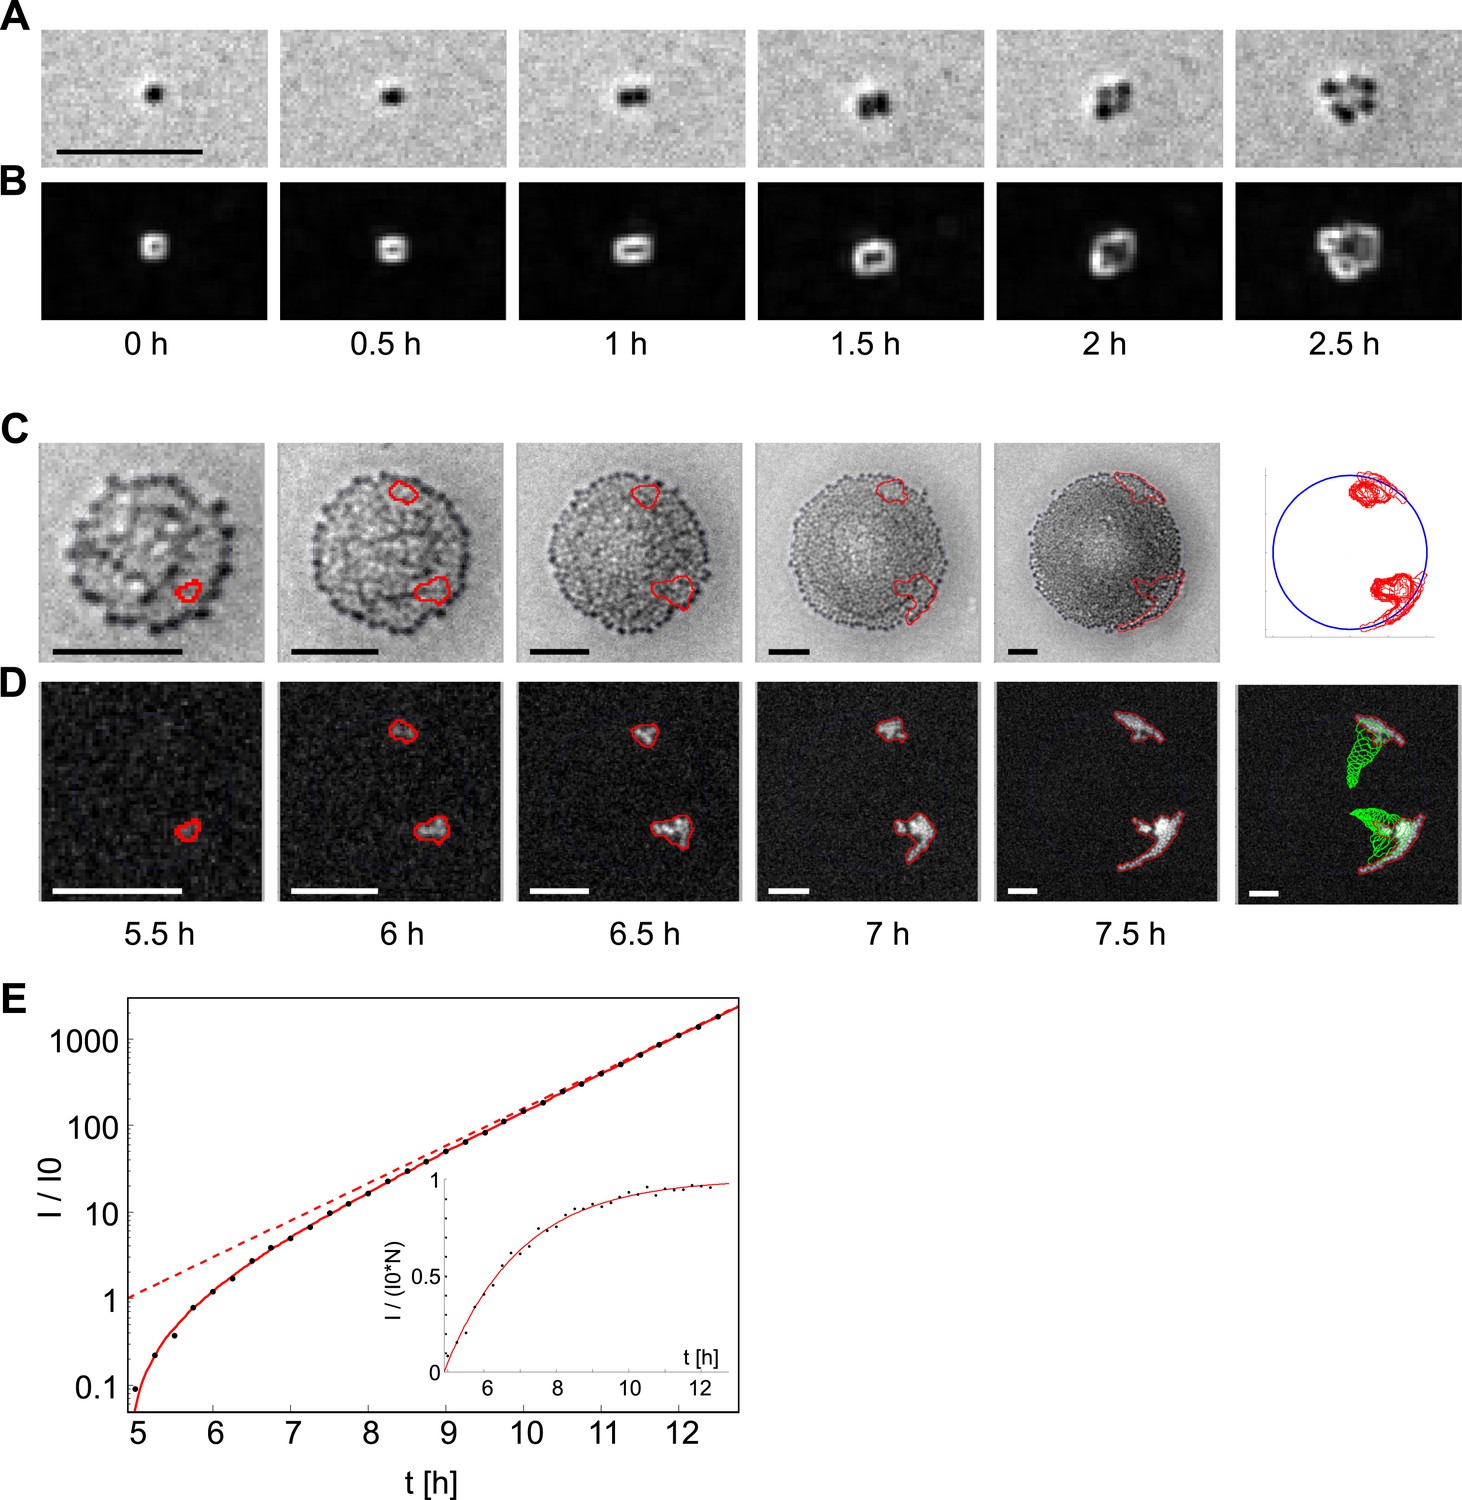
Analysis of the dynamics of the offspring of a single transformant.
(A) Time-lapse in brightfield of a single cell growing into a colony. (B) Local intensity variance of the same cells. (C) Time-lapse of the same colony in brightfield keeping the proportion of colony radius to sub-image constant. Contour lines of emerging fluorescent patches are labeled in red. The last column shows all contour lines normalized by the colony radius and superimposed onto a unit-circle. (D) Fluorescence images showing contour of segmentation. The last column shows a superposition of all preceding contour lines (green) onto the fluorescence image of the final time-point. (E) Increase of fluorescence Itot over time normalized by the fit parameter of single cell fluorescence I0. The solid line is a fit onto the data. The dashed line gives the inferred number of fluorescent bacteria. The inset shows Itot normalized by I0 and N, that is, the normalized intensity per fluorescent bacterium. All scale bars: 10 µm.
Figure 5—figure supplement 2
Segregation dynamics of non-piliated PQ− green from P+ red*.
(A) pilQ deletion strain PQ− green was inoculated at low density with a higher density of P+ red*. (B) Zoom of (A). Scale bar: 20 µm. Arrows depict PQ− green bacteria that later spread ring-like along the expanding front.
Figure 6
Spatio-temporal dynamics of de novo occurrence of clones with the ability to glycosylate pili.
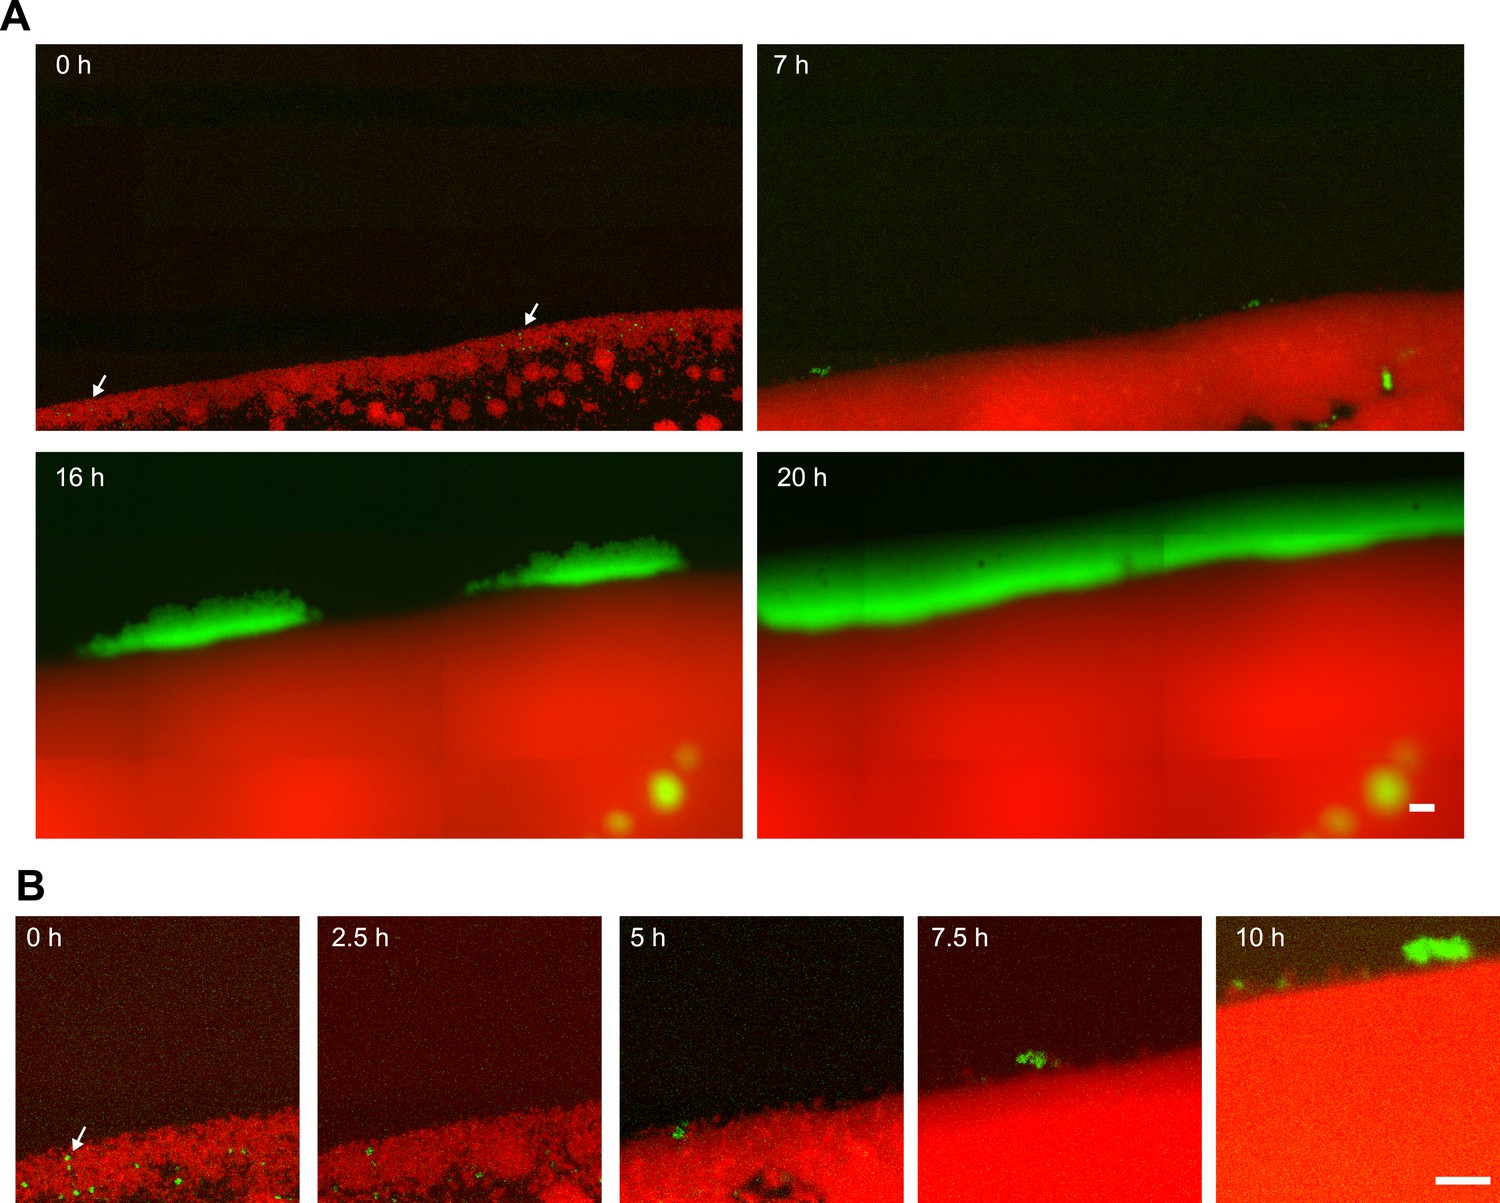
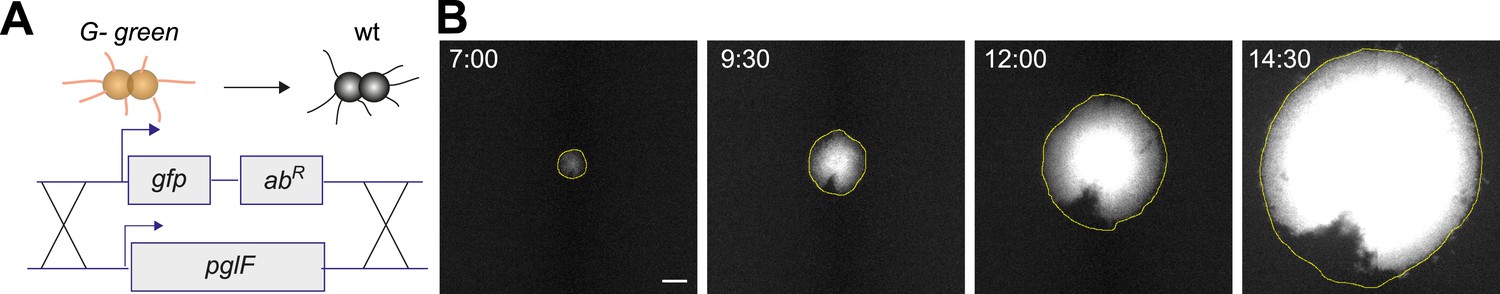
(A) Strategy for visualization of gain of glycosylation in a single bacterium. gDNA from wt is spread on the agar surface. Upon import and integration of wt DNA into a single G− green bacterium, both the fluorescence is lost and pilus glycosylation is gained. (B) Time-lapse of de novo occurring wt clone within an expanding G− green colony. Full yellow line: front of the microcolony obtained from the brightfield image. Scale bar: 10 µm.
Figure 7

Loss of pili or gain of post-translational modification causes segregation in aqueous environment.
Confocal stacks of gonococci mixed in a liquid and incubated on a glass surface for (3–5) hr. (A) P+ red was mixed with P+ green, (B) P+ red and P− green, (C) P++ red and P+ green, (D) P+ red and G− green. Scale bar: 10 µm.
Figure 8
Active T4P retraction affects colony morphology.
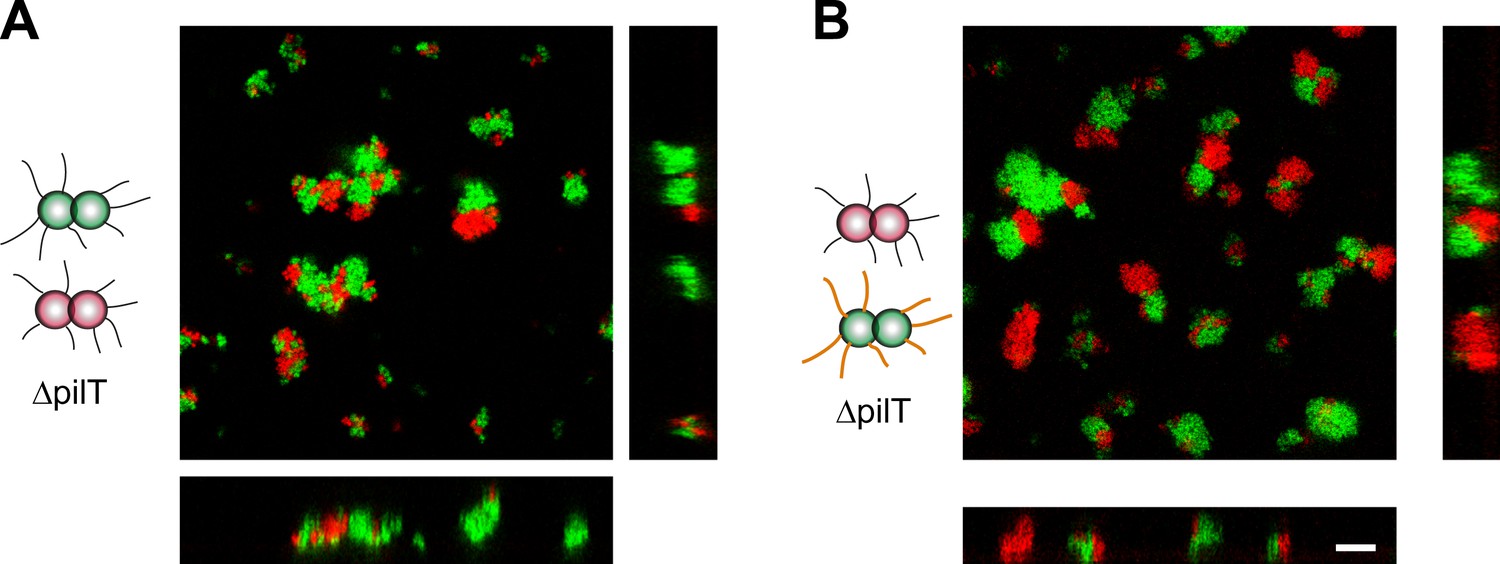
Confocal stacks of gonococci deficient in active force generation by T4P retraction were mixed in a liquid and incubated on a glass surface for (3–5) hr. (A) T− red was mixed with T− green, (B) T− red, and T−G− green. Scale bar: 10 µm.
Figure 9
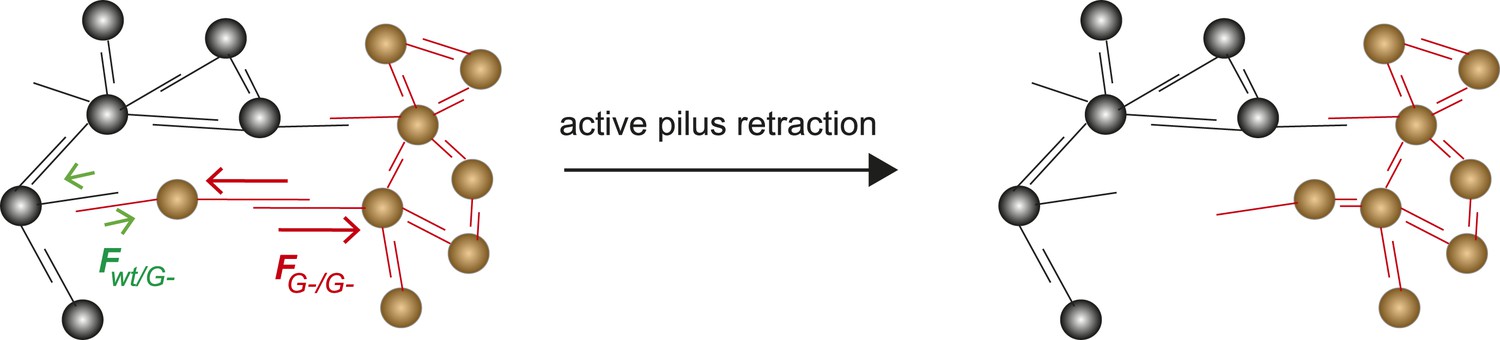
Model for tug-of-war mechanism of cell sorting.
Pili form contacts between bacteria. For simplicity, only single pilus–pilus bonds between bacteria are shown. Pili continuously elongate and retract. During retraction, they generate force on an attached object. When pili bind to other pili and retract they generate force on each other. The probability of bond rupture increases with force. Since the rupture force between G− and G− pili is larger than between wt and G− pili, the latter bond is more likely to rupture. Pilus retraction pulls the cell body in the direction in which the strongest, least breakable bonds are formed. Cells whose bonds are most easily broken are squeezed outward to the peripheral layer.
Videos
Video 1
Spatio-temporal dynamics of de novo occurrence of a P+ clone and its offspring.
Chromosomal DNA from strain P+ green is spread on the agar surface. Upon import and integration of DNA into a single bacterium, pili are lost and the bacterium becomes fluorescent. Time-lapse (Δt = 15 min) of de novo occurring P+ green clone within an expanding colony. Brightfield image and fluorescence images were merged.
Video 2
Mobility of bacteria on agar plate.
P+ green bacteria were inoculated onto an agar plate. Images were acquired at Δt = 10 s. Bacteria residing within the bulk of the microcolony were immobile at this time scale. At the front, individual bacteria are motile. This motility depends on active T4P retraction and was not observed for non-piliated bacteria. Scale bar: 10 µm.
Video 3
Spatio-temporal dynamics of de novo occurrence of a P− clone and its offspring.
Chromosomal DNA from strain P− green in which pilE is replaced by gfpmut3 is spread on the agar surface. Upon import and integration of DNA into a single bacterium, pili are lost and the bacterium becomes fluorescent. Time-lapse (Δt = 15 min) of de novo occurring P− green clone within an expanding colony. Brightfield image and fluorescence images were merged.
Video 4
Confocal reconstruction of P+ green and P+ red.
https://doi.org/10.7554/eLife.10811.017
Video 5
Confocal reconstruction of P+ red and P− green.
https://doi.org/10.7554/eLife.10811.018
Video 6
Confocal reconstruction of P++ red and P+ green.
https://doi.org/10.7554/eLife.10811.019
Video 7
Confocal reconstruction of P+ red and G− green.
https://doi.org/10.7554/eLife.10811.020Tables
Table 1
Strains used in this study
| Strain | Relevant genotype | Source/Reference |
|---|---|---|
| VD300 | wild type, opa- selected | – |
| Ng105 P+ green | igA1::PpilE gfpmut3 ermC | This study |
| Ng106 P+ red | lctP: PpilE mcherry aadA:aspC | This study |
| Ng081 P− green | pilE::PpilE gfpmut3 kan | This study |
| Ng095 G− green | pglF::PpilE gfpmut3 kan | This study |
| Ng109 P++ | igA1::pilE pilE ermC | This study |
| Ng110 P++ red | igA1::pilE pilE ermC; lctP: PpilE mcherry aadA:aspC | This study |
| Ng118 Q− green | pilQ::m-Tn3cm; igA1::PpilE gfpmut3 ermC; recA6ind(tetM); | This study |
| Ng116 P+ red* | lctP: PpilE mcherry aadA:aspC; recA6ind(tetM); | This study |
| Ng119 T− green | pilT::m-Tn3cm; igA1::PpilE gfpmut3 ermC | This study |
| Ng120 T− red | pilT::m-Tn3cm; lctP: PpilE mcherry aadA:aspC | This study |
| Ng121 T−G− green | pilT::m-Tn3cm; pglF::PpilE gfpmut3 kan | This study |
Table 2
Generation times
| Strain | Generation time | Total number of evaluated colonies |
|---|---|---|
| ig:A1:PpilE gfpmut3 ermC (P+ green) | 48.6§ ± 2.7† min | 76 |
| igA1::pilE pilE ermC; lctP: PpilE mcherry aadA:aspC (P++ red) | 55.6 ± 3.7 min | 33 |
| pilE::gfpmut3 kan (P− green) | 41.1 ± 0.8 min | 84 |
| pglF::PpilE gfpmut3 kan (G− green) | 49.7 ± 2.0 min | 14 |
| pilQ::m-Tn3cm; igA1::PpilE gfpmut3 ermC; recA6ind(tetM) (PQ− green) | 51.1 ± 0.3 min | 280 |
| lctP: PpilE mcherry aadA:aspC; recA6ind(tetM) (P+ red*) | 49.4 ± 0.6 min | 211 |
-
§Average value of results obtained from at least three independent experiments. Each experiment comprises the analysis of several individual colonies.
-
†
Corrected sample standard deviation from at least three independent experiments.
Table 3
Primers used in this study
| Primers | Sequence 5′–3′ |
|---|---|
| KH1a | ATGCCGTCTGAATTCCGACCCAATCAACACACC |
| KH4 | GTTCAATCATATGTGACCTCCTCTATTTGTATAGTTCATCC |
| KH5 | TAGAGGAGGTCACATATGATTGAACAAGATGGATTGC |
| KH6 | TCACTTACCGTCAGAAGAACTCGTCAAGAAGG |
| KH7 | TTCTTCTGACGGTAAGTGATTTCCCACGG |
| KH8 | ATGCCGTCTGAACGCACCGATATAGGGTTTG |
| KH34 | AAAAAGAATTCATGCCGTCTGAAGCAAAATCGACCTGCACCATCTGAT |
| KH35 | CGGGTGTGTTGATTGGGTCGGTTTTGATGTCCGGTCGGCGGC |
| KH36 | GCCGCCGACCGGACATCAAAACCGACCCAATCAACACACCCG |
| KH37 | GAACCGACATAGAAGTAGTCAGGATGATTTTCAGAAGAACTCGTCAAGAAGGCG |
| KH38 | CCTTCTTGACGAGTTCTTCTGAAAATCATCCTGACTACTTCTATGTCGGTTC |
| KH39 | AAAGGATCCATGCCGTCTGAACATCAAAAGCGGGCGGGGG |
| NK83 | TTGAGTCTTCCGACCCAATCAACACACCCGATAC |
| N135 | AGTTCTTCTCCTTTACGCATAAAATTACTCCTAATTGAAAGGG |
| N134 | TTTCAATTAGGAGTAATTTTATGCGTAAAGGAGAAGAACTTTTCAC |
| NK133 | TTGAGCTCCTATTTGTATAGTTCATCCATGCC |
| NK19 | TTAGGAGTAATTTTATGGTGAGCAAGGG |
| NK23 | TCGCCCTTGCTCACCATAAAATTACTC |
| NK46 | CATTGGCCGGCCTTCCGACCCAATCAACACACC |
| NK51 | CATTAATTAATTACTTGTACAGCTCGTCCATGCC |
| NK60 | TTCGGTCTCCACGCATCGTCAG |
| NK61 | TTTAAGCTTATGGCACTTTTCCTCAGCATATTCCC |
| NK62 | GAGCTCTTAATTAAATGCATGGCCGGCCCTAGAGGAAGAAAATCATTGCCGCGAC |
| NK63 | GGCCGGCCATGCATTTAATTAAGAGCTCATGTTCTTCAAGCACATCGAAGCC |
| NK64 | TTTAAGCTTTTACAAGACTTTCACGATGCTTTCGC |
| NK65 | TTTTAATTAAATGCGTAAAGGAGAAGAACT TTTCACTGG |
| NK66 | GTAAGGCCGGCCCTATTTGTATAGTTCATCCATGCCATGTGTAATC |
Download links
A two-part list of links to download the article, or parts of the article, in various formats.
Downloads (link to download the article as PDF)
Open citations (links to open the citations from this article in various online reference manager services)
Cite this article (links to download the citations from this article in formats compatible with various reference manager tools)
Differential interaction forces govern bacterial sorting in early biofilms
eLife 4:e10811.
https://doi.org/10.7554/eLife.10811


