Localized JNK signaling regulates organ size during development
- Howard Hughes Medical Institute, Yale University School of Medicine, United States
- Institute for Stem Cell Biology and Regenerative Medicine, Howard Hughes Medical Institute, Stanford University School of Medicine, United States
- University of California, San Francisco, United States
- Fudan University, China
Figures
Figure 1 with 1 supplement

Localized JNK activity exists in the developing wing.
(A) Schematic of wing precursor cells (grey) in the developing disc (A, anterior; P, posterior). (B-F) Antibody staining against active, phosphorylated JNK (pJNK, green; DAPI, blue) labels a stripe in wildtype (B-C) but not JNKK mutant (D-E, hepr75/Y) third instar discs. Boxed region in (B) and (D) is magnified in (C) and (E), respectively. Weak pJNK signal is also detected along the dorsal/ventral boundary. pJNK stripe staining is lost in JNKK mutant clones (F, hepr75, clone is negatively marked in F’). (G-I) pJNK localizes to the same cells in which ptc is expressed (G, ptc>RFP, red) along the A/P boundary, and is lost following JNK phosphatase expression (H, ptc>puc, RFP, red) or RNAi-mediated knockdown of bsk within the ptc domain (I, ptc>bskRNAi, RFP, red). Bar: 50 um (B-F, H-I) and 25 um (G). See also Figure 1—figure supplement 1.
Figure 1—figure supplement 1
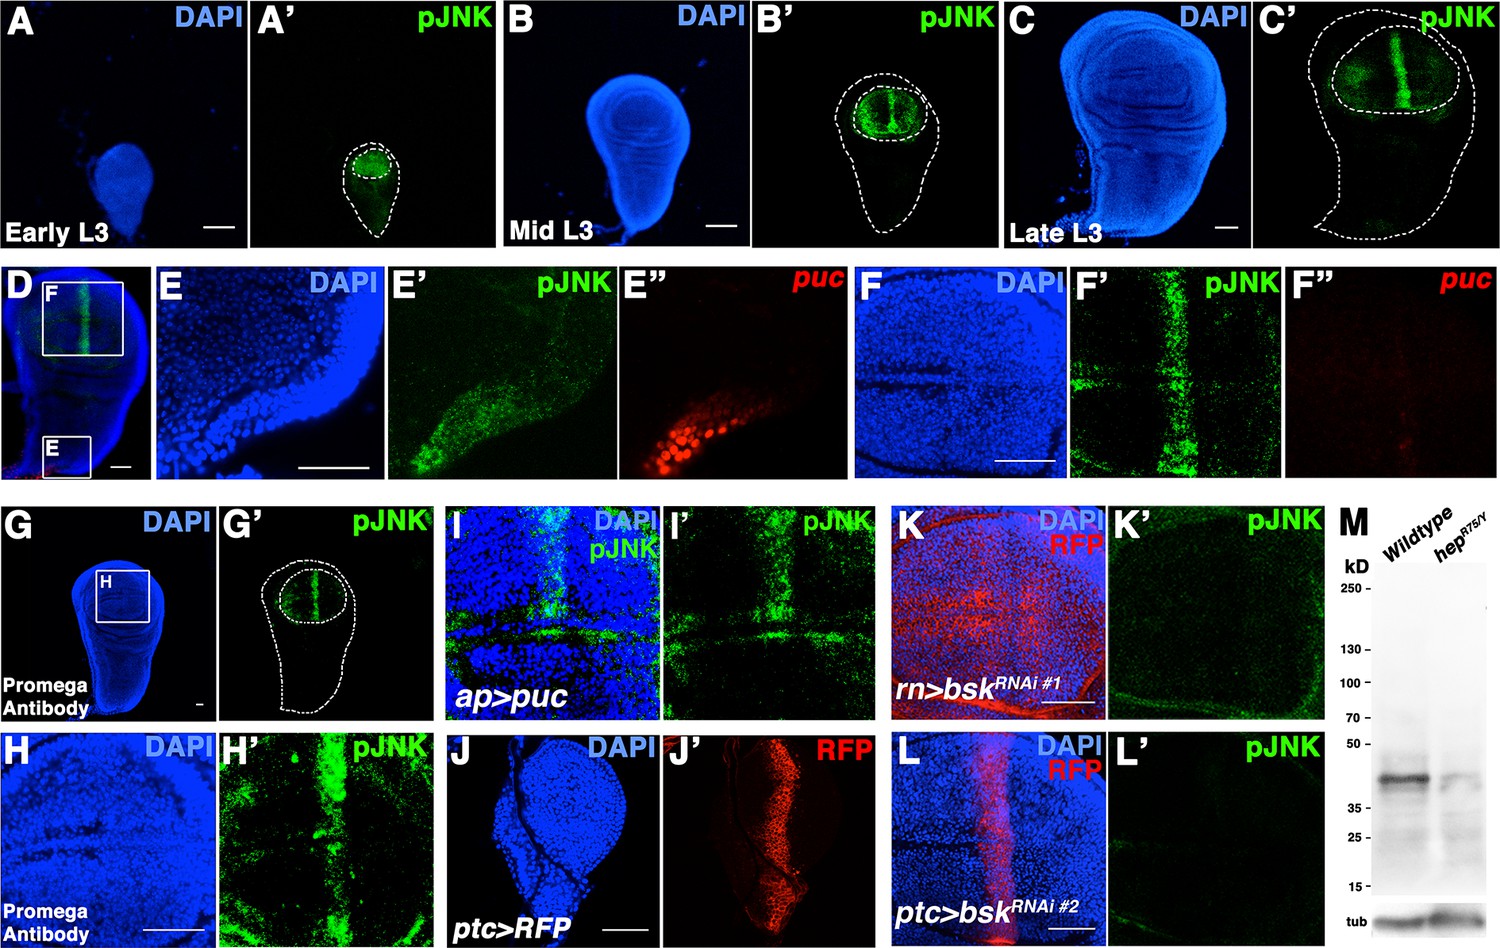
pJNK recognizes endogenous JNK activity in developing wing discs.
Related to Figure 1. (A-C) Wildtype Canton-S wing discs stained for DAPI (blue) and pJNK (green) during (A) early third instar (L3), (B) mid-third instar, and (C) late third instar. (D) Wing disc stained for DAPI (blue), pJNK (green), and puc-lacZ (red). Boxes indicate areas enlarged in E and F. (E) Notum cells are positive for pJNK and puc-lacZ. (F) Blade cells show a stripe of pJNK staining but no detectable puc-lacZ. (G-H) A second, independently generated antibody against pJNK from Promega shows a similar pattern in third instar discs. (G) Whole wing disc and (H) wing blade. (I) Inhibition of JNK signaling in the dorsal compartment reduces pJNK staining (green) (ap>puc). (J) ptc-Gal4 expresses in a stripe in early L3 stage. (K) Inhibition of JNK in all wing blade cells (rn>bskRNAi#1, RFP) or (L) in ptc cells (ptc>bskRNAi#2, RFP) eliminates pJNK (green) signal. (M) Western blot analysis of larval extracts from Canton-S (Lane 1) and hepr75/Y (Lane 2) animals. pJNK is predicted to be ~43kD. Loading control (bottom) is alpha-tubulin. Bar: 50 um.
Figure 2 with 4 supplements

Modulation of localized JNK signaling changes wing size.
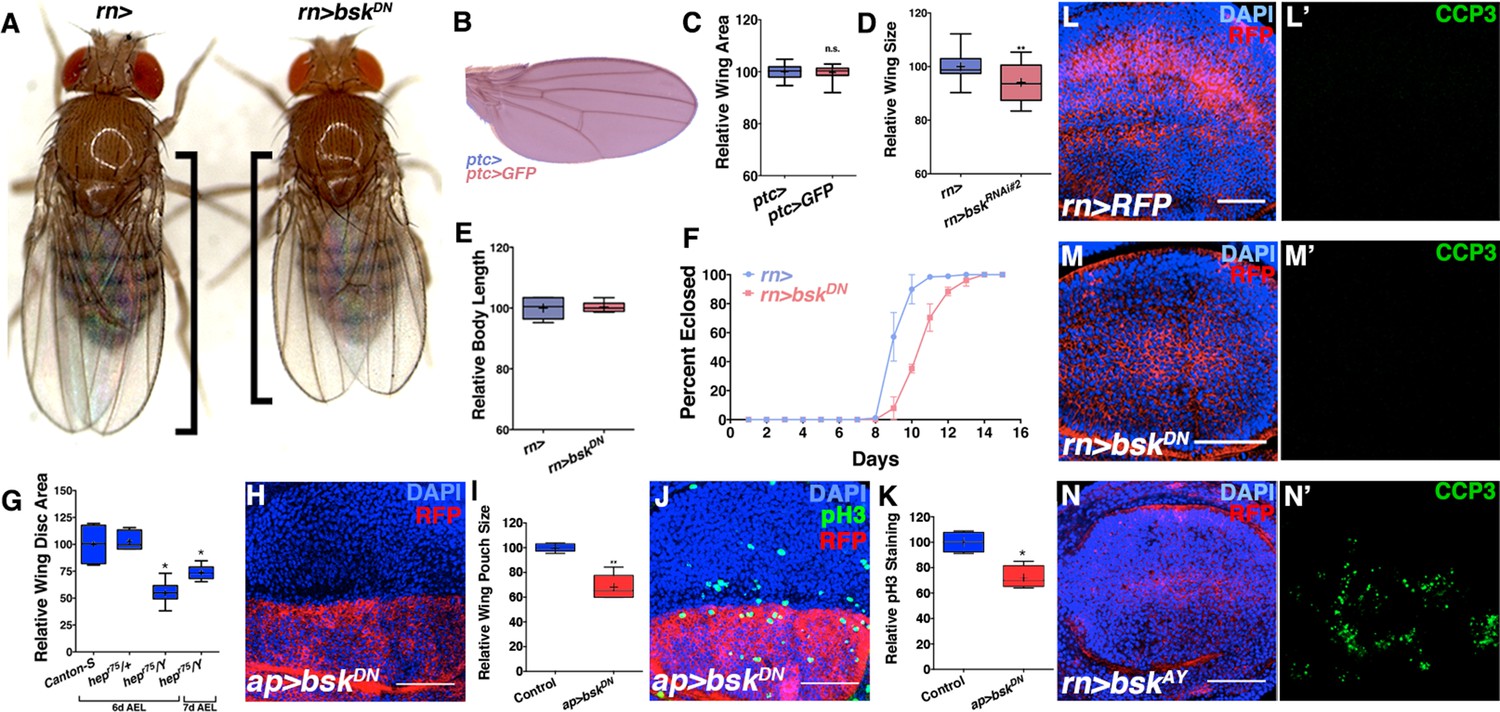
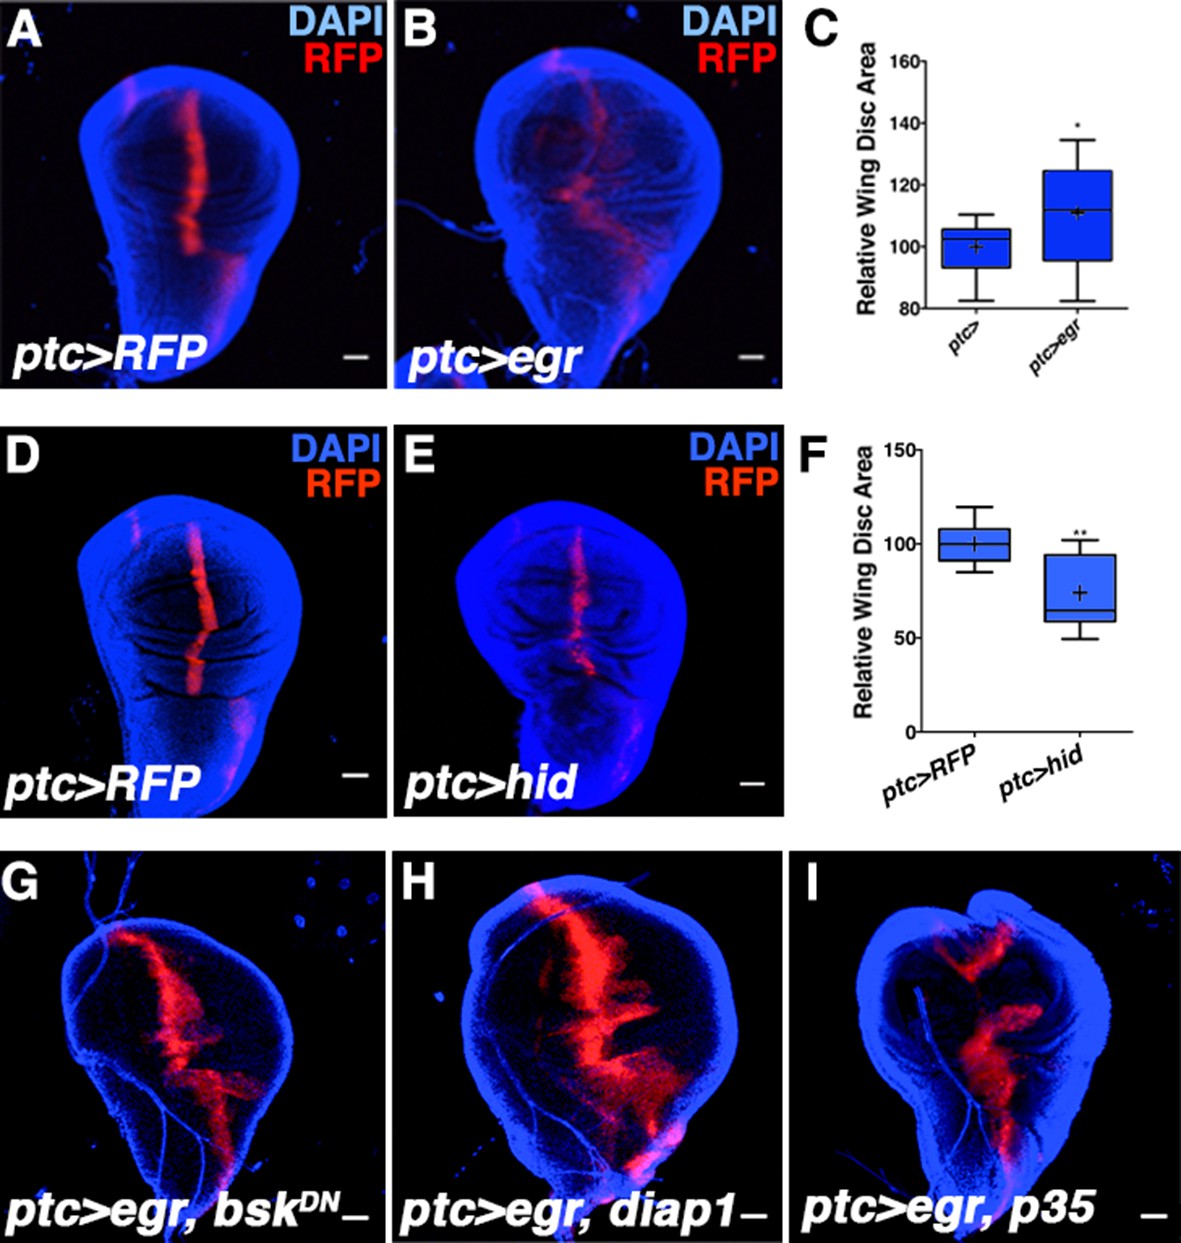
Inhibition of JNK in all wing blade cells (B-E, J) or within the ptc domain (F, K) decreases adult wing size compared to controls (A, C-E, J, rn>) or (F, K, ptc>). Note that autonomous reduction between longitudinal veins 3 and 4 accounts for a small portion of the global reduction. Apoptosis inhibition does not rescue the small wing phenotype (red, G, rn>p35, bskDN). (H-I, L) Increased JNK signaling within the ptc domain following eiger expression causes an increase in disc size (I, ptc>egr, RFP, red; DAPI, blue) compared to controls (H, ptc>RFP, red). (L) This is increase is dependent on bsk (ptc>egr, bskDN) but not affected by diap1 or p35 expression (ptc>egr, diap1 or ptc>egr, p35). Due to high pupal lethality, disc size was analyzed when animals reached the wandering third instar stage. (M-O) JNK inhibition does not affect cell size (N-O, rn>bskDN). (P-Q) Increased JNK signaling within the ptc domain causes an increase in proliferation (Q, ptc>egr, RFP, red; EdU, green) compared to controls (P, ptc>RFP, red; EdU, green). EdU of boxed region in (P) and (Q) is shown in (R) and (S), respectively. (T) Quantification of mean EdU signal in wing pouch regions between ptc>RFP and ptc>egr animals. Whiskers are SD. For box plots of area quantifications, whiskers represent maximum and minimum values (J-L, O). *-****=p<0.05–0.0001. n.s.= not significant. Bar: 50 um. See also Figure 2—figure supplements 1–4.
Figure 2—figure supplement 1
JNK inhibition does not affect body size or cell death, but rather cell proliferation.
Related to Figure 2. (A) Control rotund-Gal4 (rn>) alone female fly (left). Inhibiting JNK in the entire wing (rn>bskDN) leads to a female fly with smaller, well-patterned wings (right). Black bars highlight difference in wing size. (B-C) Expression of a control transgene (UAS-GFP) does not affect wing size (ptc>GFP). (D) Quantification of relative wing size for knockdown of bsk with a second RNAi line (bskRNAi#2). (E) Adult body length is not affected by inhibiting JNK by rn-Gal4. (F) Inhibition of JNK with rn-GAL4 delays development. (G) hepr75/Y animals have smaller wing discs than controls (Canton-S or hepr75/+), even when adjusted for delayed developmental time (7d AEL). (H-I) JNK inhibition (red, dorsal half) causes a reduction in wing pouch size compared to its matched control (blue, ventral half) (ap>bskDN, red). (J) JNK inhibition (dorsal half) reduces cell proliferation by phosphorylated histone 3 (PH3) staining (green) compared to its matched control (ventral half) (ap>bskDN). (K) Control discs (ap>RFP, blue) do not show a difference in PH3 staining between dorsal and ventral halves (ratio = 1.04), while JNK inhibited ones do (Ratio = 0.86, red). (L) Control wing pouch (rn>RFP, red) stained for cleaved Caspase 3 (CCP3, green). (M) Inhibition of JNK in all pouch cells (rn>bskDN, RFP, red) does not induce apoptosis as assayed by CCP3 staining (green). (N) Positive control expression of wildtype JNK (bskAY) causes apoptosis and CCP3 staining (green). Two-sided student’s t-test: *-***p<0.05–0.001. Bar: 50 um.
Figure 2—figure supplement 2
Activating JNK signaling increases wing disc size independent of cell death or developmental timing.
Related to Figure 2. (A-C) Age-matched wing discs expressing RFP by ptc-GAL4 (control, A) or RFP and egr by ptc-GAL4 (B). (C) Wing disc area quantification for A-B. (D-F) Induction of apoptosis in the ptc domain reduces wing disc size. (D) Control ptc>RFP wing. (E) Expression of UAS-hid (ptc>hid) decreases wing size. (F) Quantification of D-E. (G) Size increase due to egr expression depends on bsk activity (ptc>egr, bskDN), but is not affected by expression of diap1 (G, ptc>egr, diap1) or p35 (I, ptc>egr, p35). Quantification of G-I is presented in Figure 2L. Two-sided student’s t-test: *-**p<0.05–0.01. Bar: 100 um.
Figure 2—figure supplement 3
JNK inhibition does not affect Dpp or EGFR signaling.
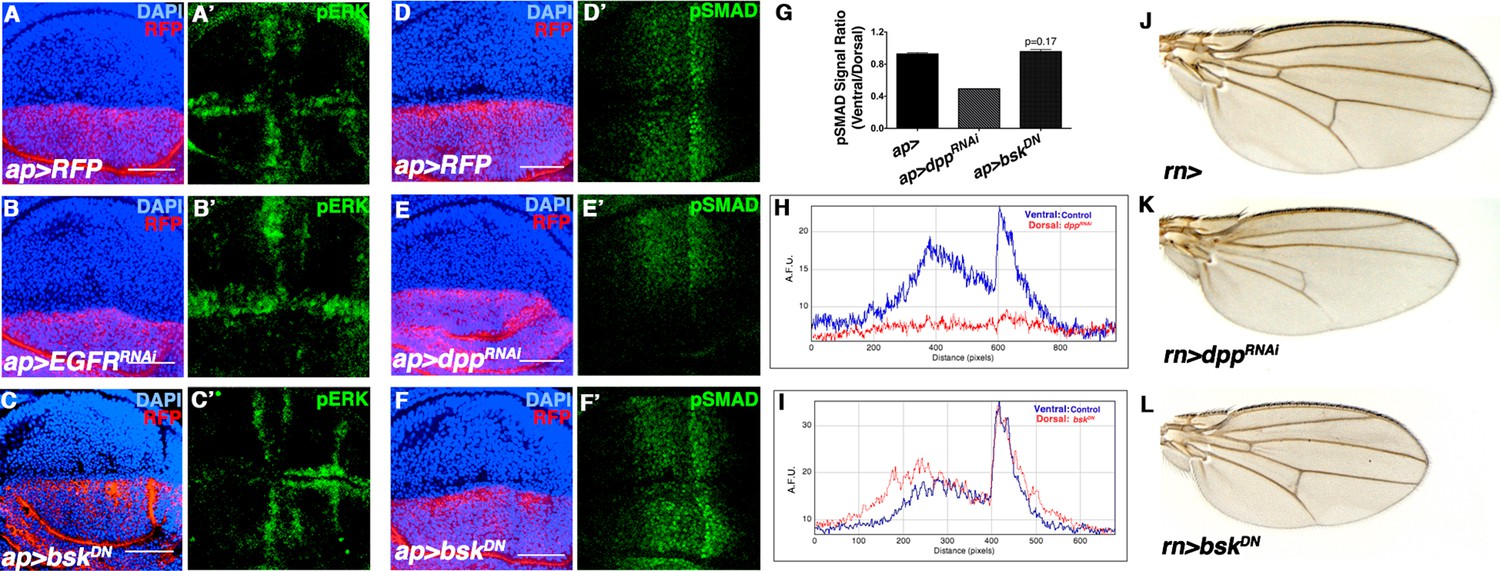
Related to Figure 2. (A-C) Wing discs stained for the EGFR reporter pERK (green). (A) Control wing disc (ap>RFP, red). (B) Inhibition of EGFR signaling in the dorsal half of the disc (ap>EGFRRNAi, RFP, red) decreases dorsal pERK (green) staining, while (C) inhibition ofJNK signaling (ap>bskDN, RFP, red) does not. (D-F) Wing discs stained for the Dpp reporter pSMAD (green). (D) Control (ap>RFP, red). (E) Inhibition of Dpp signaling in the dorsal half of the disc (ap>dppRNAi, RFP, red) abolishes dorsal pSMAD (green) staining, while (F) inhibition of JNK signaling (ap>bskDN, RFP, red) does not. (G) Quantification of pSMAD fluorescence, as a ratio of dorsal to ventral staining. ap>dppRNAi causes a dramatic decrease in the ratio, while JNK inhibition (ap>bskDN) does not produce a statistically significant change (p=0.17). (H) pSMAD gradient fluorescence plot by distance along the A-P axis. Ventral (blue) is control, while dorsal (red) is knockdown of dpp. (I) pSMAD gradient fluorescence plot by distance along the A-P axis. Inhibiting JNK signaling (dorsal, red) does not affect pSMAD gradient formation (compare blue to red). (J) Control rn-Gal4 alone control. (K) RNAi-mediated knockdown of dpp causes a reduction in wing veins and a more pronounced effect on AP than PD length. (L) Inhibition of JNK does not cause wing vein loss, but does cause a global reduction in size. AFU.: arbitrary fluorescence units. Bar: 50 um.
Figure 2—figure supplement 4

Inhibiting EGFR or Dpp signaling does not affect pJNK establishment.
Related to Figure 2. Inhibition of EGFR (A) or Dpp (B) by RNAi does not have an effect on pJNK (green). Bar: 50 um.
Figure 3 with 2 supplements
Non-canonical JNK signaling regulates wing size.
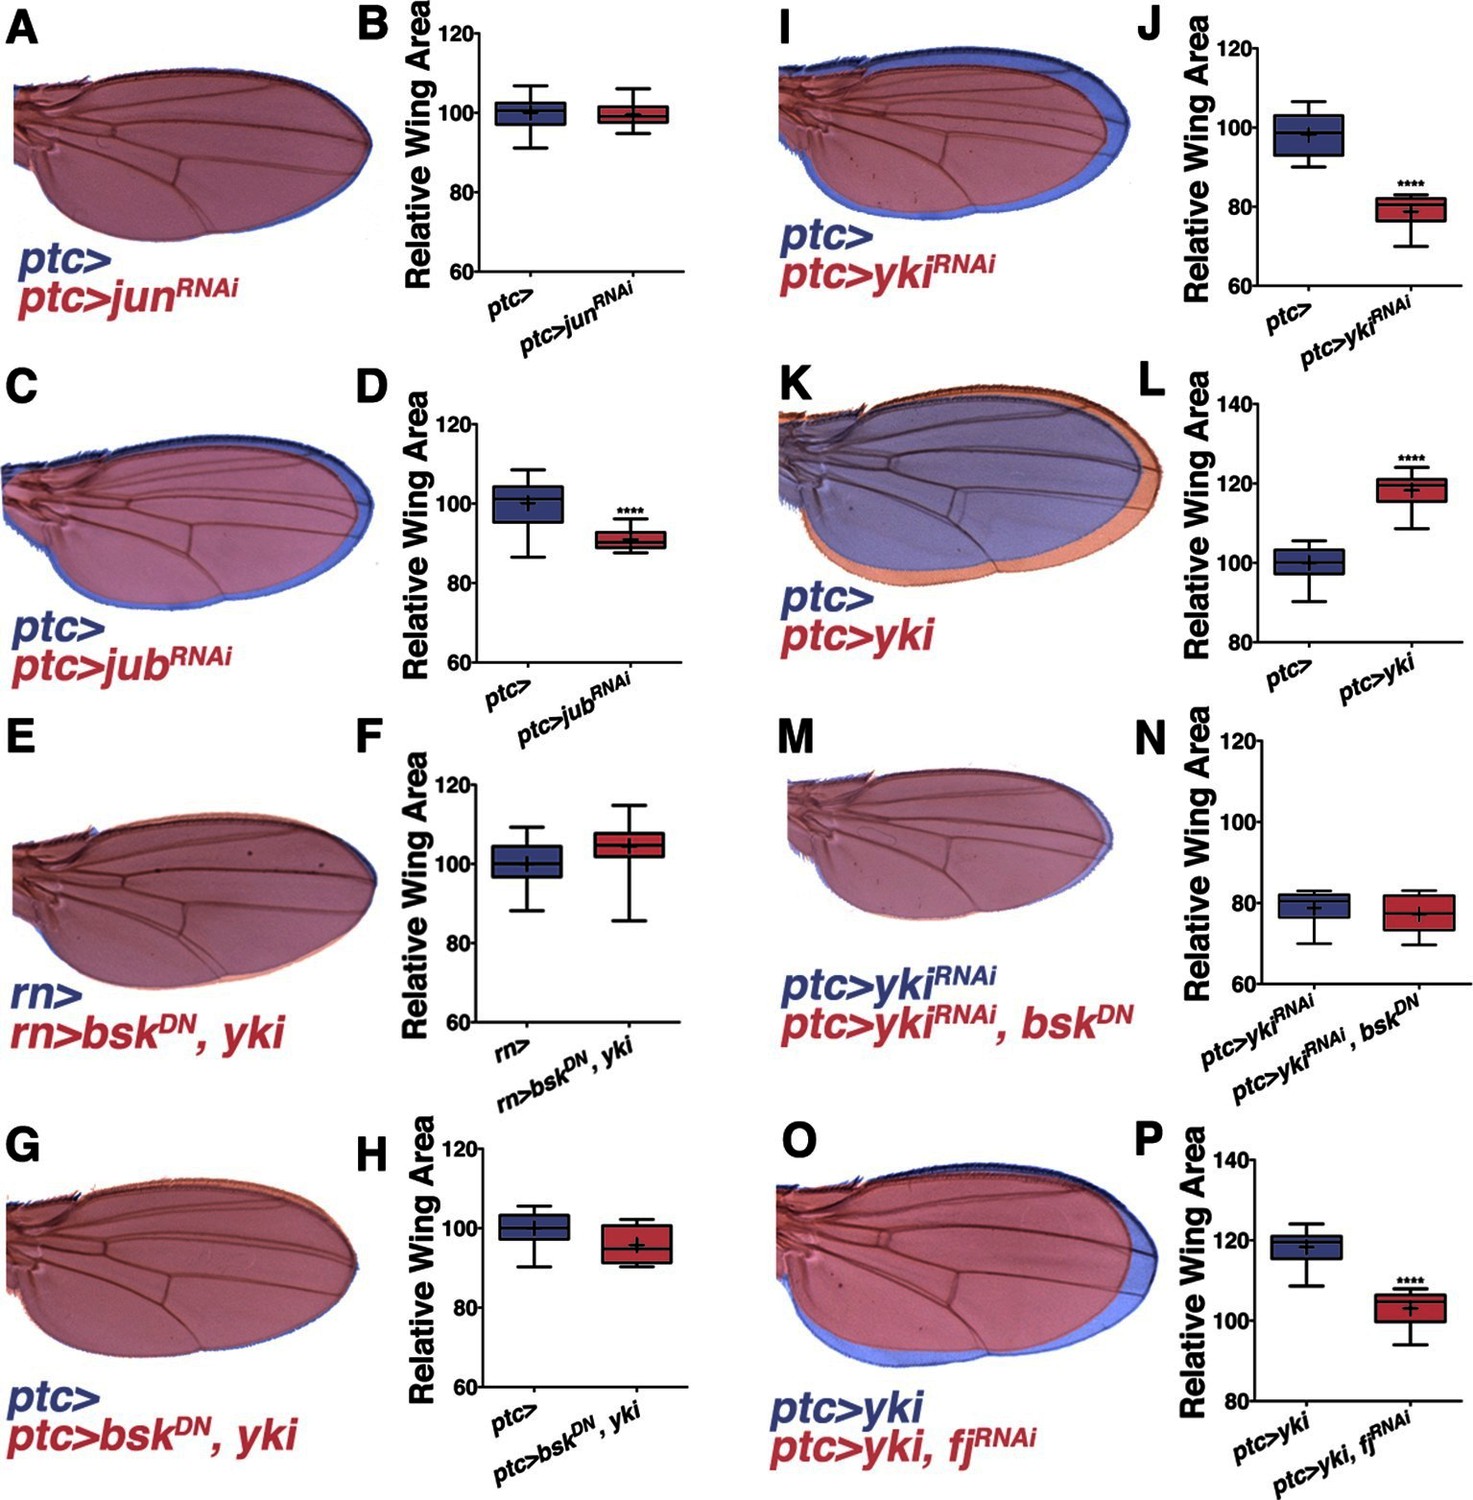
RNAi-mediated knockdown of Jun within the ptc stripe does not change adult wing size (A-B, red, ptc>junRNAi compared to blue, ptc>). RNAi-mediated knockdown of jub does change global wing size (C-D, red, ptc>jubRNAi compared to blue, ptc>). Expression of yki in all wing cells (E-F, red, rn>yki, bskDN compared to blue, rn>) or within the ptc stripe (G-H, red, ptc>bskDN, yki compared to blue, ptc>) rescues wing size following JNK inhibition. RNAi-mediated knockdown or overexpression of yki in ptc cells decreases or enlarges wing size, respectively (I-J, red, ptc>ykiRNAi, blue, ptc>, and K-L, red, ptc>yki, blue, ptc>). (M-N) Inhibition of JNK signaling does not enhance the phenotype of Yki inhibition alone (M, red, ptc>bskDN, ykiRNAi; blue, ptc>ykiRNAi). (O-P) RNAi-mediated knockdown of fj modifies the Yki growth phenotype (O, red, ptc>yki, fjRNAi; blue, ptc>yki). For box plots, whiskers represent maximum and minimum values. ****=p<0.0001. See also Figure 3—figure supplements 1–2.
Figure 3—figure supplement 1

Jun RNAi line validation and loss of kayak phenotypes.
Related to Figure 3. RNAi-mediated knockdown of Jun in ap domain cells decreases puc expression (puc-lacZ, green) (B) compared to controls (A). Dotted line indicates puc+ cells that co-localize with ap-Gal4. Note decreased puc-lacZ staining in this domain following Jun inhibition. However, (C-D) inhibition of Jun in all wing cells by RNAi-mediated knockdown does not show a phenotype. (E-F) A second Jun RNAi line does not show a phenotype when expressed in ptc-expressing cells. (G-H) Inhibition of kayak/fos (red, rn>kayRNAi) does not affect wing size, nor does inhibiting jun and kay together (green, rn>kayRNAi, junRNAi). Individually, kayRNAi lines induced a thorax closure defect when driven by ap-Gal4. For box plots, whiskers represent maximum and minimum values. Bar: 5
Figure 3—figure supplement 2
JNK interacts with Yki to cause global changes in wing size.
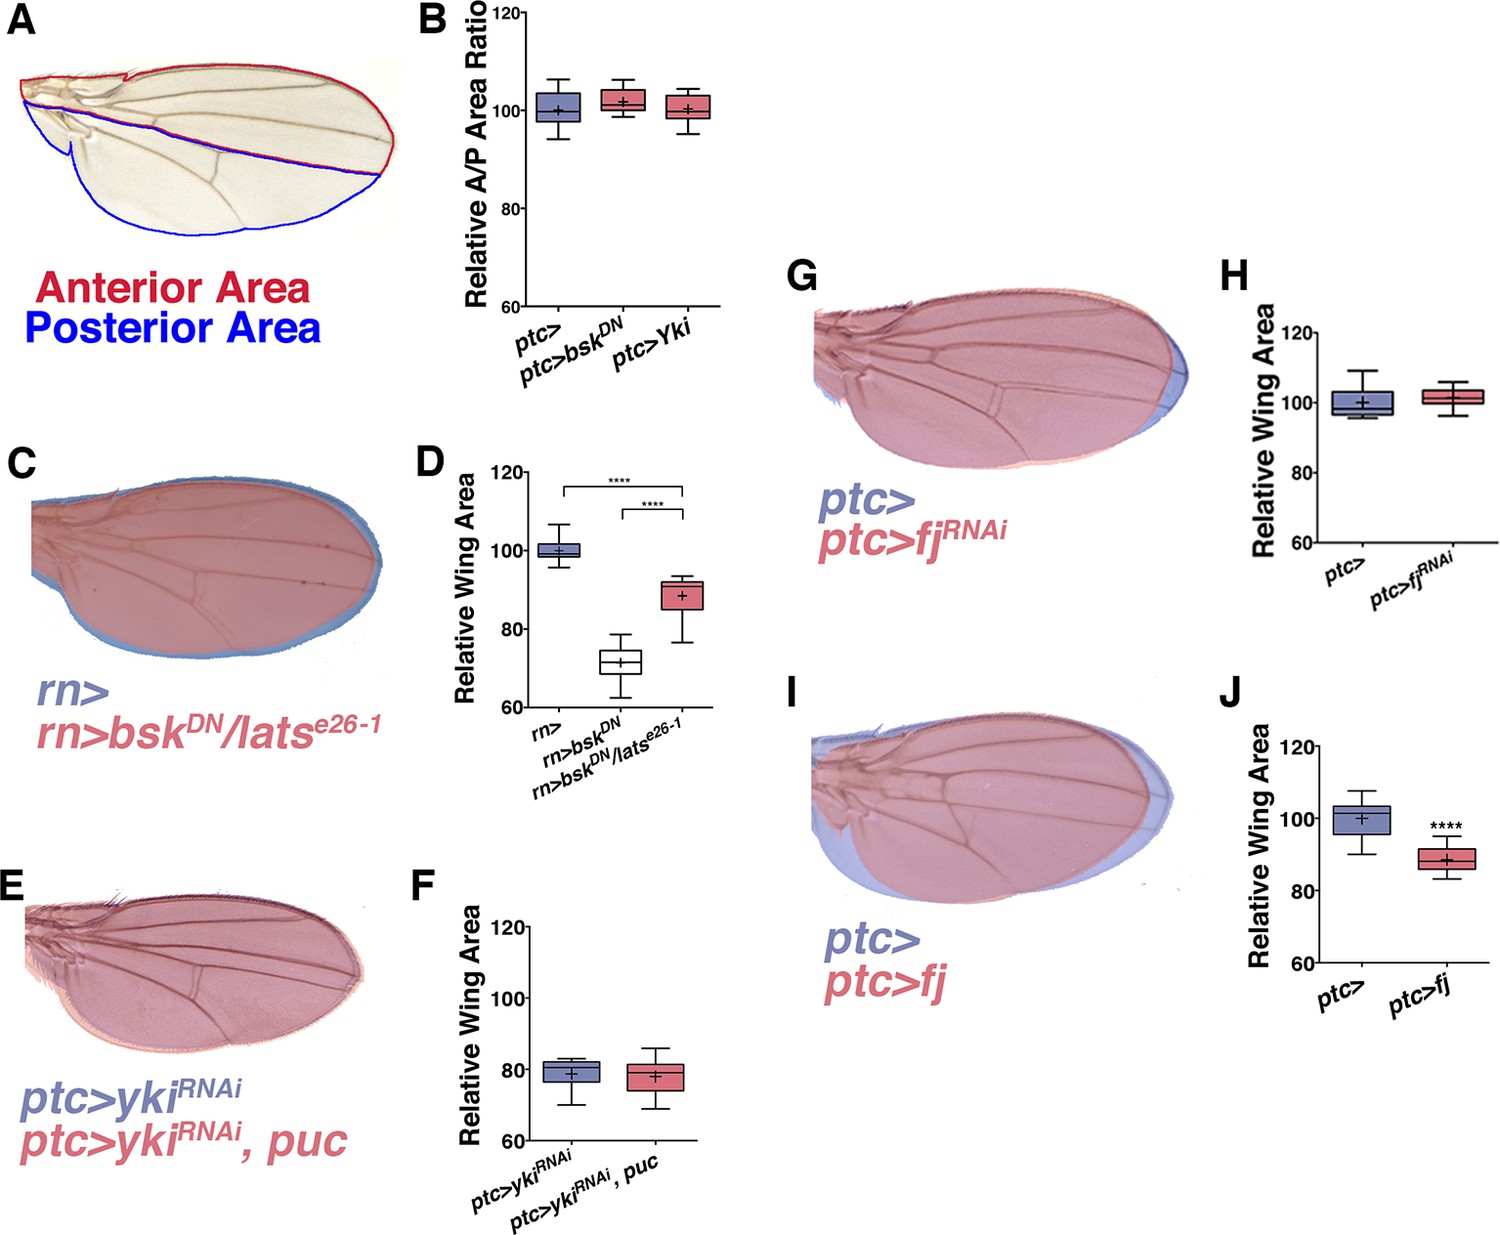
Related to Figure 3. (A) Schematic for measuring the ratio of anterior to posterior wing area. (B) Local (ptc-driven) inhibition of JNK or increased Yki expression affects the anterior and posterior compartments equally. (C-D) The effect of inhibiting JNK signaling can be partially suppressed in a lats heterozygous mutant background (C, red, rn>bskDN; latse26-1/+). (G-H) Inhibition of fj alone does not change wing size (G, red, ptc>fjRNAi, blue, ptc>), albeit it slightly changes wing shape, likely due to its effect on polarity. (I-J) Over-expression of fj causes a decrease in wing size (I, red, ptc>fj). For box plots, whiskers are maximum and minimum values. Two-sided student’s t-test: *-****p<0.05–0.0001.
Figure 4
Hh signaling through Ci establishes localized pJNK.
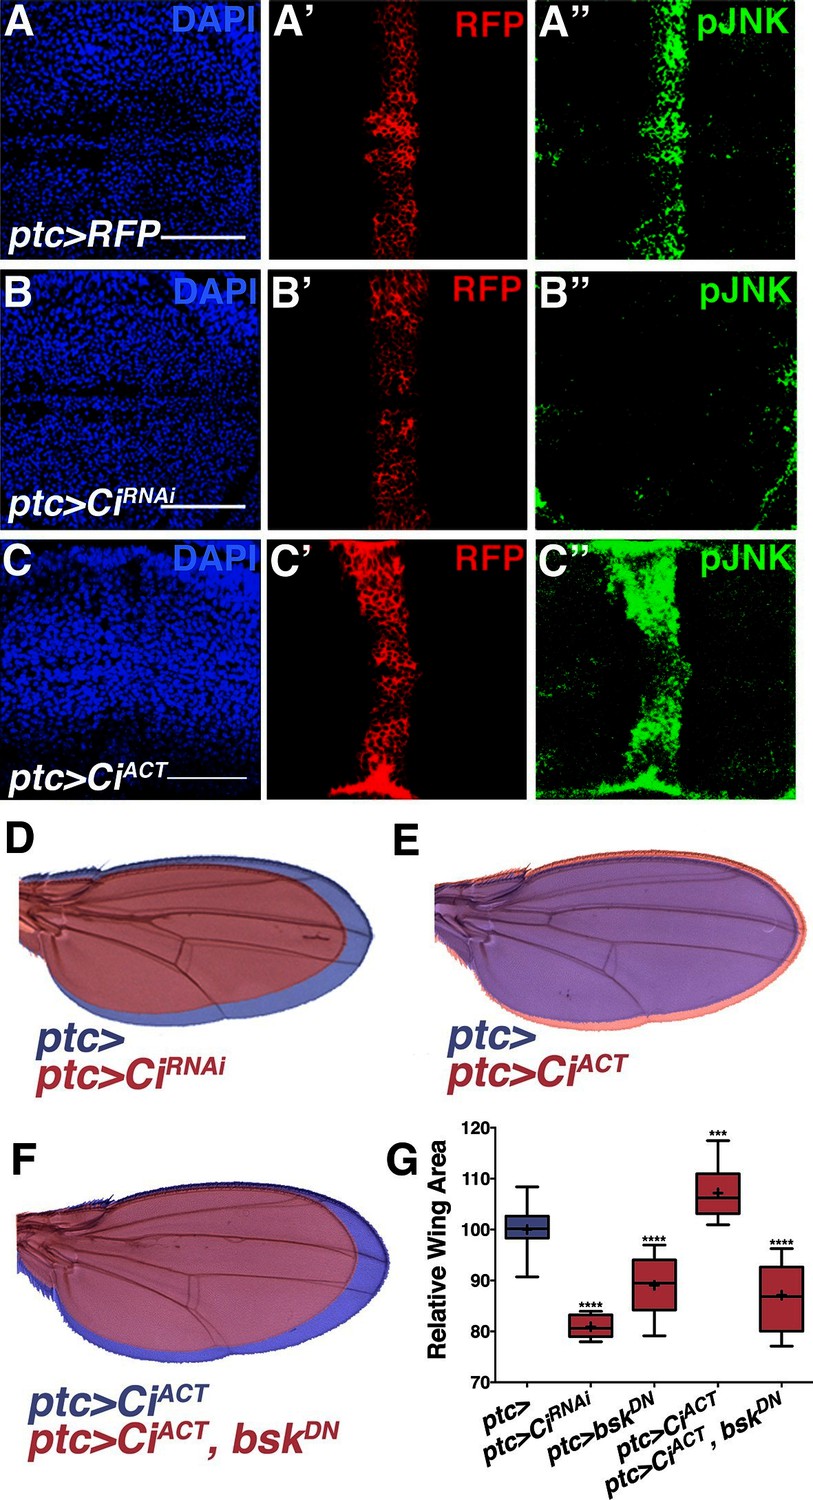
RNAi-mediated knockdown of Ci in ptc cells abrogates pJNK (green) staining (A-B, ptc>CiRNAi, RFP compared to ptc>RFP) and results in smaller adult wings (D, red, ptc>CiRNAi compared to blue, ptc>). Expression of activated Ci in the ptc domain leads to increased pJNK staining (green) (C, ptc>CiACT, RFP) and a larger wing (E, red, ptc>CiACT compared to blue, ptc>). Inhibition of JNK signaling in these cells blocks the effect of activated Ci (red, F, ptc>CiACT, bskDN). For the box plot (G), whiskers represent maximum and minimum values. ***-****=p<0.001–0.0001. Bar: 50 um.
Figure 5 with 2 supplements
Hedgehog signaling establishes pJNK by elevating dTRAF1 expression.
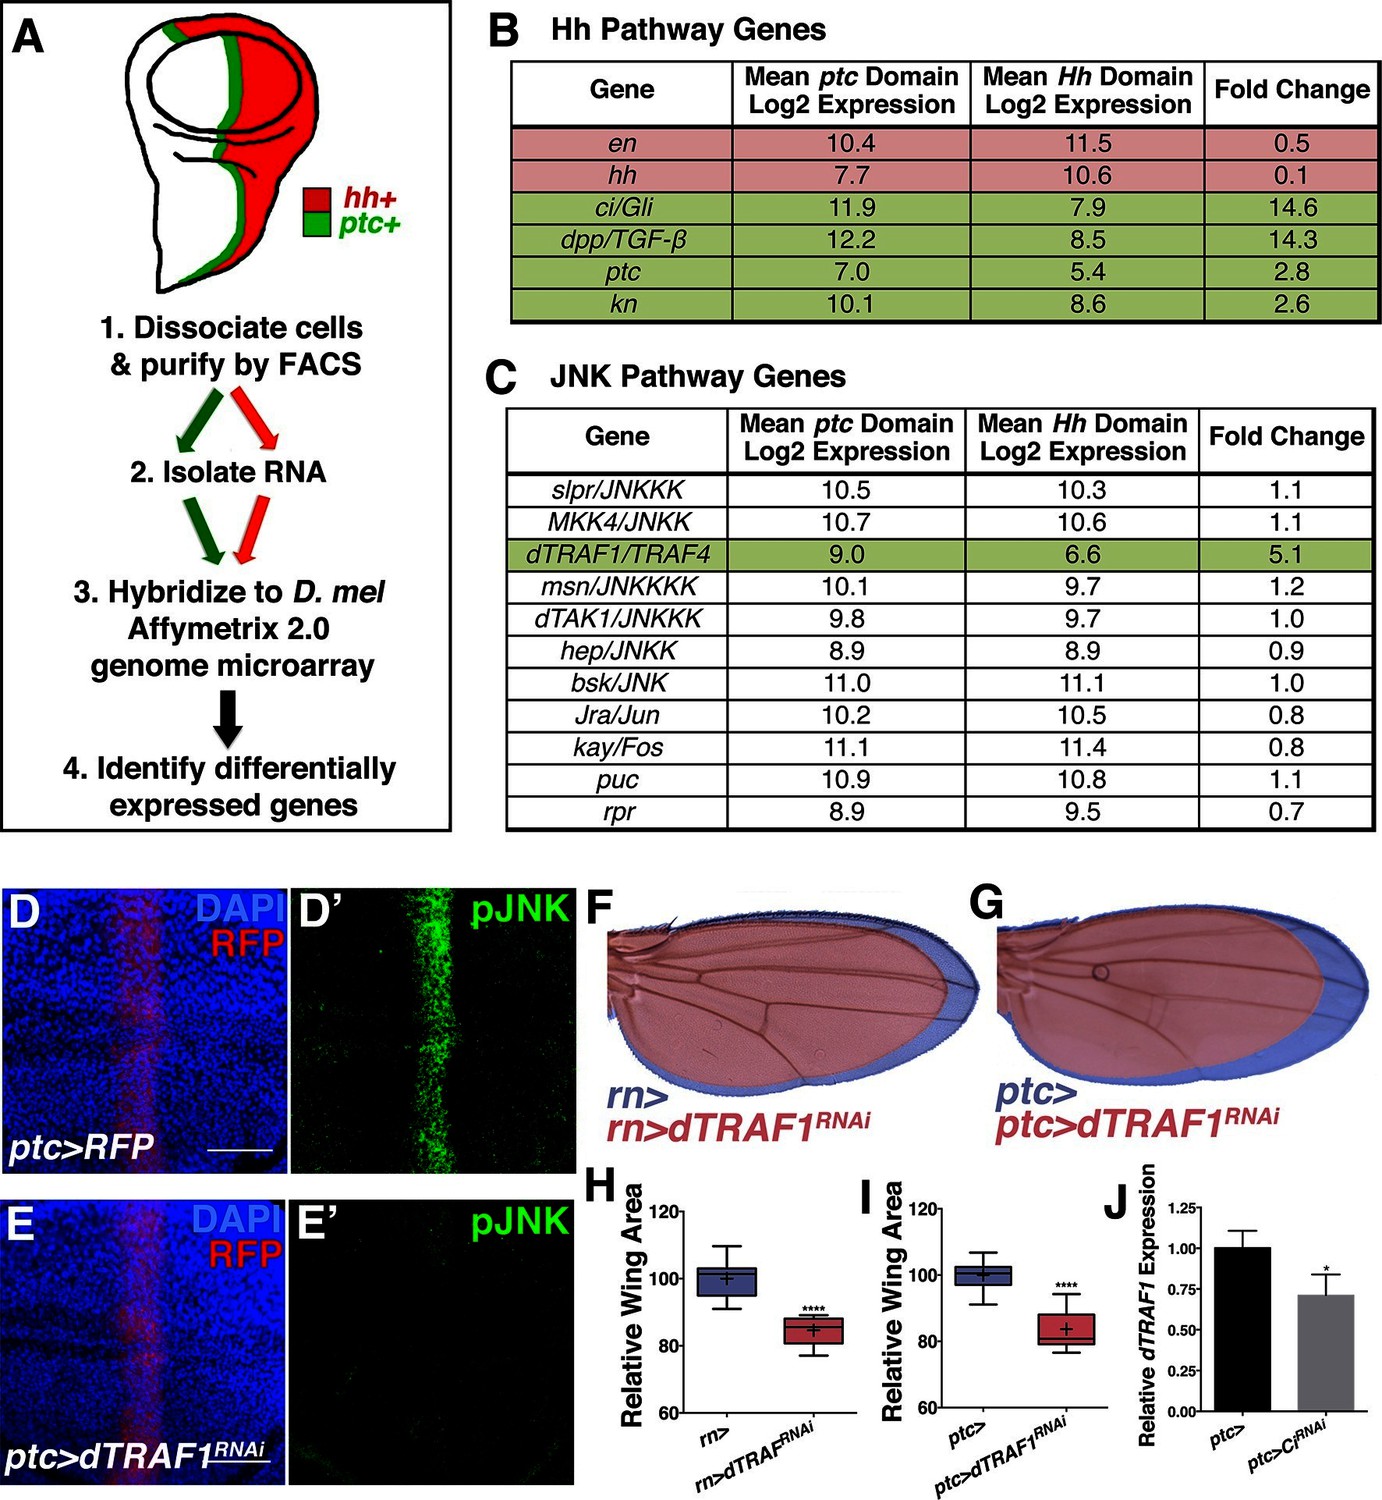
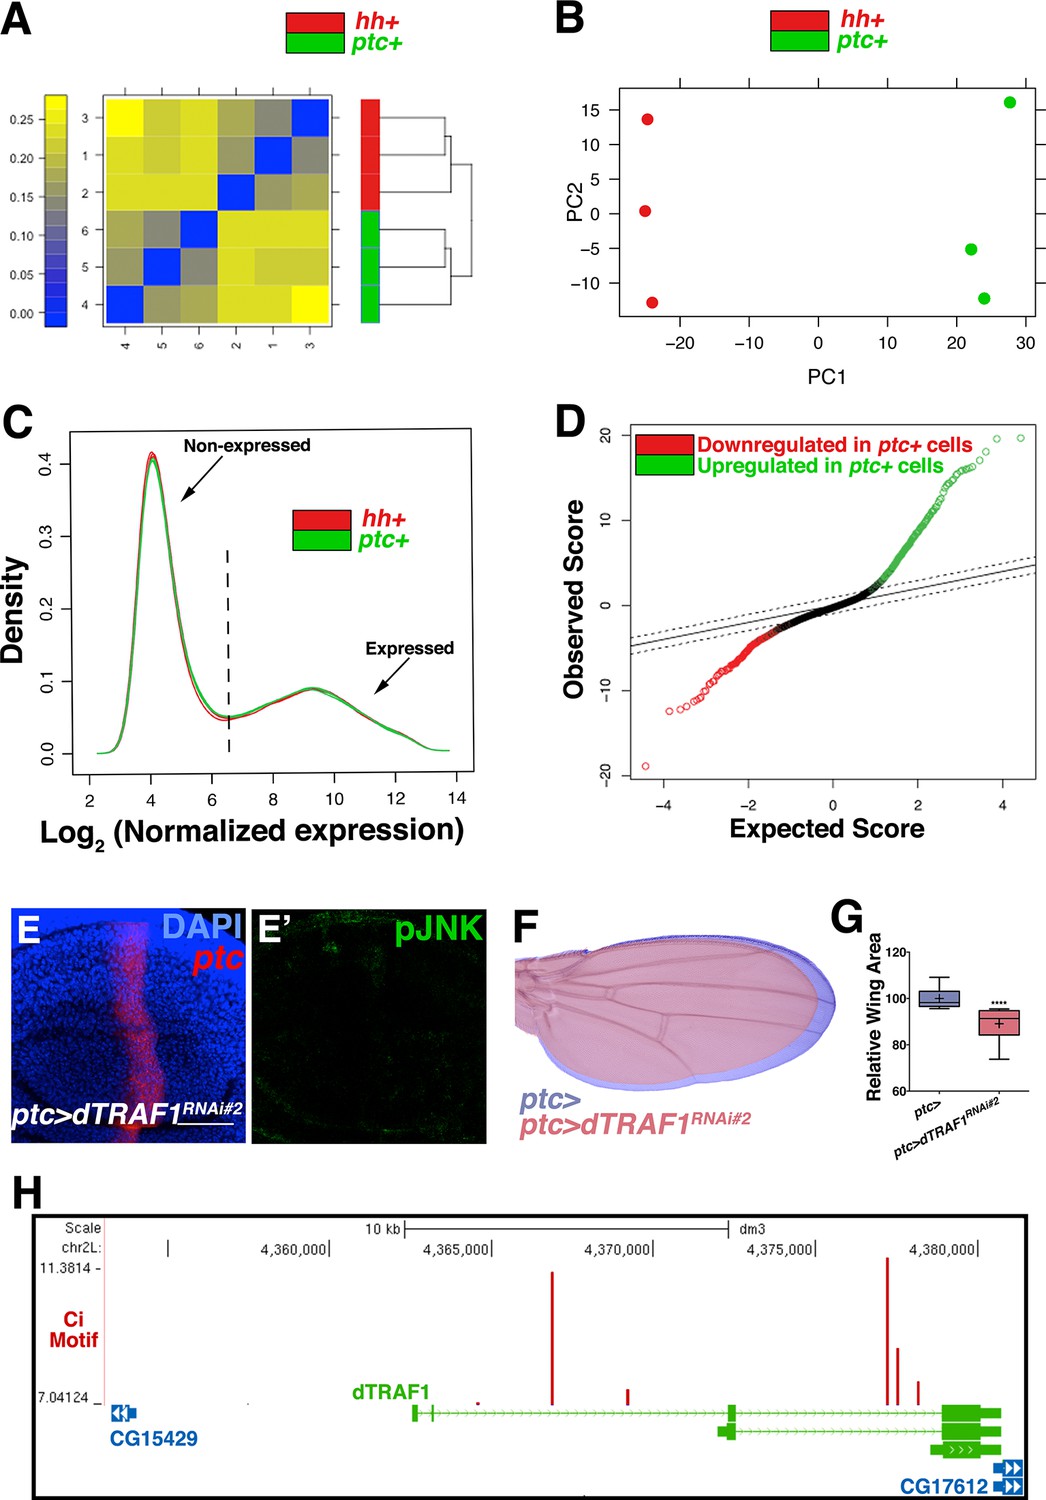
(A) ptc cells (green, ptc+) and posterior cells (red, hh+) from third instar wing discs were dissociated and sorted by FACS. RNA was isolated and hybridized to microarrays. Differentially expressed genes were identified. (B) Hedgehog pathway genes known to be differentially expressed are identified. Genes upregulated in ptc cells (ptc+) compared to posterior (hh+) cells are highlighted in green and downregulated in red. Genes with log2 normalized expression ≥6.5 are considered expressed. (C) JNK pathway gene dTRAF1 is >5-fold upregulated in ptc cells. (D-I) RNAi-mediated knockdown of dTRAF1 eliminates pJNK (green) staining (E, ptc>dTRAFRNAi#1, RFP, red) and leads to smaller adult wings (F-I, rn>dTRAFRNAi#1 or ptc>dTRAFRNAi#1). (J) Ci inhibition causes a ~30% decrease in dTRAF1 expression in 3rd instar wing discs, relative to endogenous control Rp49. Whiskers are SD. For box plots, whiskers are maximum and minimum values (H-I). *-****=p<0.05–0.0001. Bar: 50 um. See also Figure 5—figure supplement 1–2.
Figure 5—figure supplement 1
Transcriptional profiling quality control and additional dTRAF1 validation.
Related to Figure 5. Quality assessment analyses were conducted with post-normalized data. (A) Microarrays cluster by condition, indicating that biological effects are driving variability. (B) Principle components analysis similarly groups biological replicates. Outliers were not detected in (A) or (B). (C) Density plots of the log2 normalized expression in ptc domain (ptc+) or posterior (hh+) samples are very similar in shape and range, further suggesting comparable signal quality between the two arrays. Probe sets with a median log2 normalized expression ≥6.5 in ptc+ samples, hh+ cells, or both, were considered expressed (Supplementary file 1; Materials and methods). This corresponds to 6854 genic probe sets (47.3%). (D) Quantile-quantile plot for the differential expression analysis. Based on a criteria of minimum fold change ≥1.5 and false discovery rate (FDR) ≤0.01, 624 of 6,854 genic probe sets (9.1%) are differentially expressed, with 376 (5.5%) upregulated in ptc+ samples (green) and 248 (3.6%) downregulated in ptc+ samples (red, Supplementary file 2; Materials and methods). The dashed line indicates the tuning parameter, delta, which is chosen according to the specified FDR (≤0.01). Inhibition of dTRAF1 expression by a second RNAi line also abolishes pJNK staining (E, ptc>dTRAFRNAi#2, and (F) leads to a smaller adult wing (red) compared to control (blue). (G) Quantification of adult wing size. (H) Multiple Ci binding sites (red lines) are identified within the dTRAF1 gene region (green). Height of red line indicates significance of the binding site. Boxes indicate exons, and arrowed lines indicate introns in the direction of transcription. For box plot, whiskers represent maximum and minimum values. ****=p<0.0001. Bar: 50 um.
Figure 5—figure supplement 2
Inhibiting dTRAF1 can modify an activated Ci phenotype.
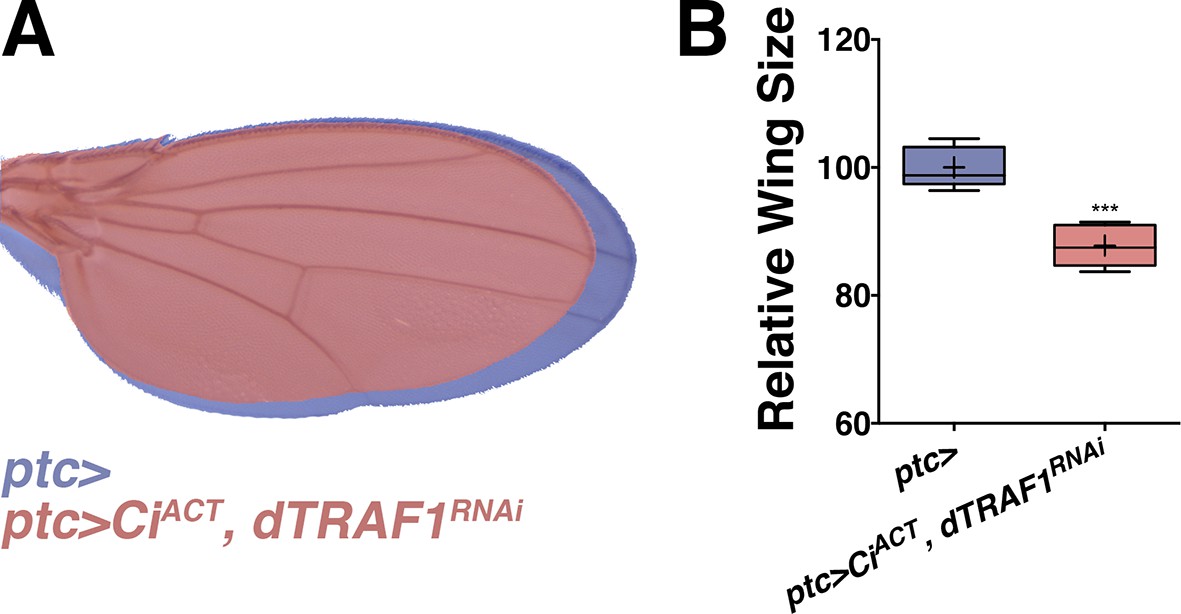
Related to Figure 5. (A) Compared to control wings (blue, ptc>), inhibiting dTRAF1 while activating Ci still leads to a dTRAF1 phenotype of a smaller wing (red, ptc>CiACT, dTRAF1RNAi). Compare to Figure 4E,G. For box plot, whiskers represent maximum and minimum values. ***=p<0.001.
Figure 6

Modulation of localized JNK signaling within the developing antenna or leg changes organ size.
pJNK (green) staining of wildtype antenna/eye (A) and leg (G) third instar discs. Inhibition of JNK in the developing antenna (B-C, F, dll>bskDN) or leg (H-I, L, dll>bskDN) leads to a smaller adult organ. Increased JNK activation within the antenna (D-E, dll>egr, RFP, red) or leg disc (J-K, dll>egr, RFP, red) causes an increase in disc size. (M) Model of how localized JNK signaling regulates wing size during development. Engrailed (En) controls Hh signaling, leading to a stripe of active Ci along the A/P boundary. Ci increases transcription of dTRAF1, activating JNK (pJNK, green). JNK acts in a non-canonical, Jun-independent manner to regulate Yki or Yki-dependent signaling. As the human dTRAF1 homolog, TRAF4, and Hippo components are amplified in numerous cancers, these findings provide a new mechanism for how the Hh pathway could contribute to tumorigenesis (Camilleri-Broët et al., 2006; Harvey et al., 2013). For box plots, whiskers represent maximum and minimum values (F, L). ****=p<0.0001. Bar: 100 um
Additional files
-
Supplementary file 1
Genes expressed in posterior (hh+) and/or ptc domain wing disc cells.
- https://doi.org/10.7554/eLife.11491.018
-
Supplementary file 2
Differentially expressed genes between posterior (hh+) and ptc domain wing disc cells.
- https://doi.org/10.7554/eLife.11491.019
Download links
A two-part list of links to download the article, or parts of the article, in various formats.
Downloads (link to download the article as PDF)
Open citations (links to open the citations from this article in various online reference manager services)
Cite this article (links to download the citations from this article in formats compatible with various reference manager tools)
Localized JNK signaling regulates organ size during development
eLife 5:e11491.
https://doi.org/10.7554/eLife.11491


