Quantitative neuroanatomy for connectomics in Drosophila
- Janelia Research Campus, Howard Hughes Medical Institute, United States
- University of Zurich, Switzerland
- Eidgenössische Technische Hochschule Zürich, Switzerland
Figures
Figure 1 with 1 supplement
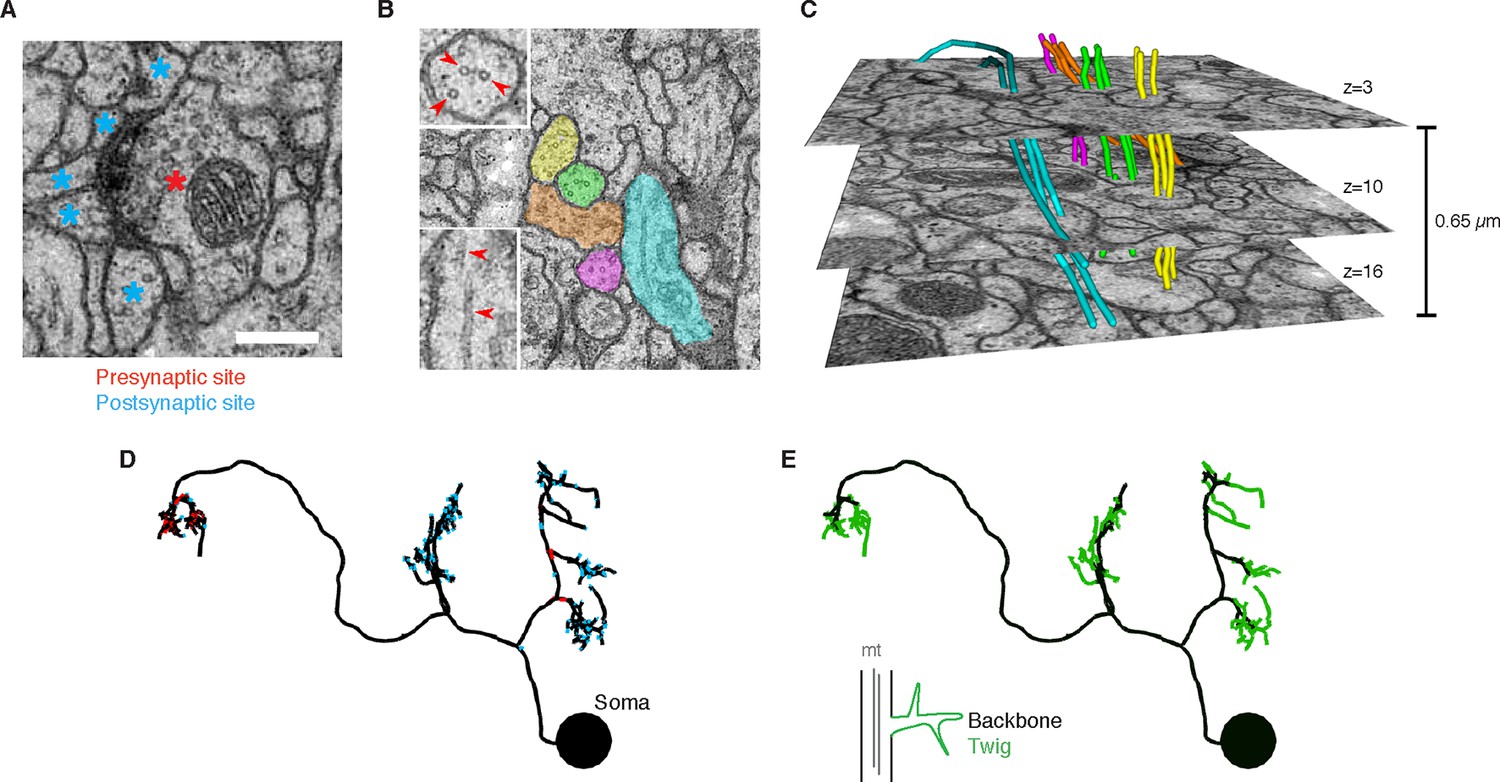
EM ultrastructure shows synapses and microtubule cytoskeleton.
(A) EM micrograph of a typical Drosophila synapse with a single presynaptic site (red asterisk) and multiple postsynaptic sites (blue asterisks). Scale bar is 200 nm. (B) Microtubules in neural processes are visible in EM sections whether cut transverse (top inset, red arrowheads) or obliquely (bottom inset, red arrowheads). (C) Microtubules in a given neuronal process span several sections (three shown here; microtubules were traced over 16 sections) and maintain their relative orientations. Microtubules are color coded as in the processes in B and were traced and visualized in TrakEM2. (D) Synaptic distribution (red, presynaptic site; blue, postsynaptic site) across the arbor of larval neuron A23a. (E) Microtubule distribution of larval neuron A23a. Black indicates the microtubule-containing backbone continuous with the soma, green are microtubule-free twigs. See Video 1 for both microtubules and synapses shown together.
Figure 1—figure supplement 1
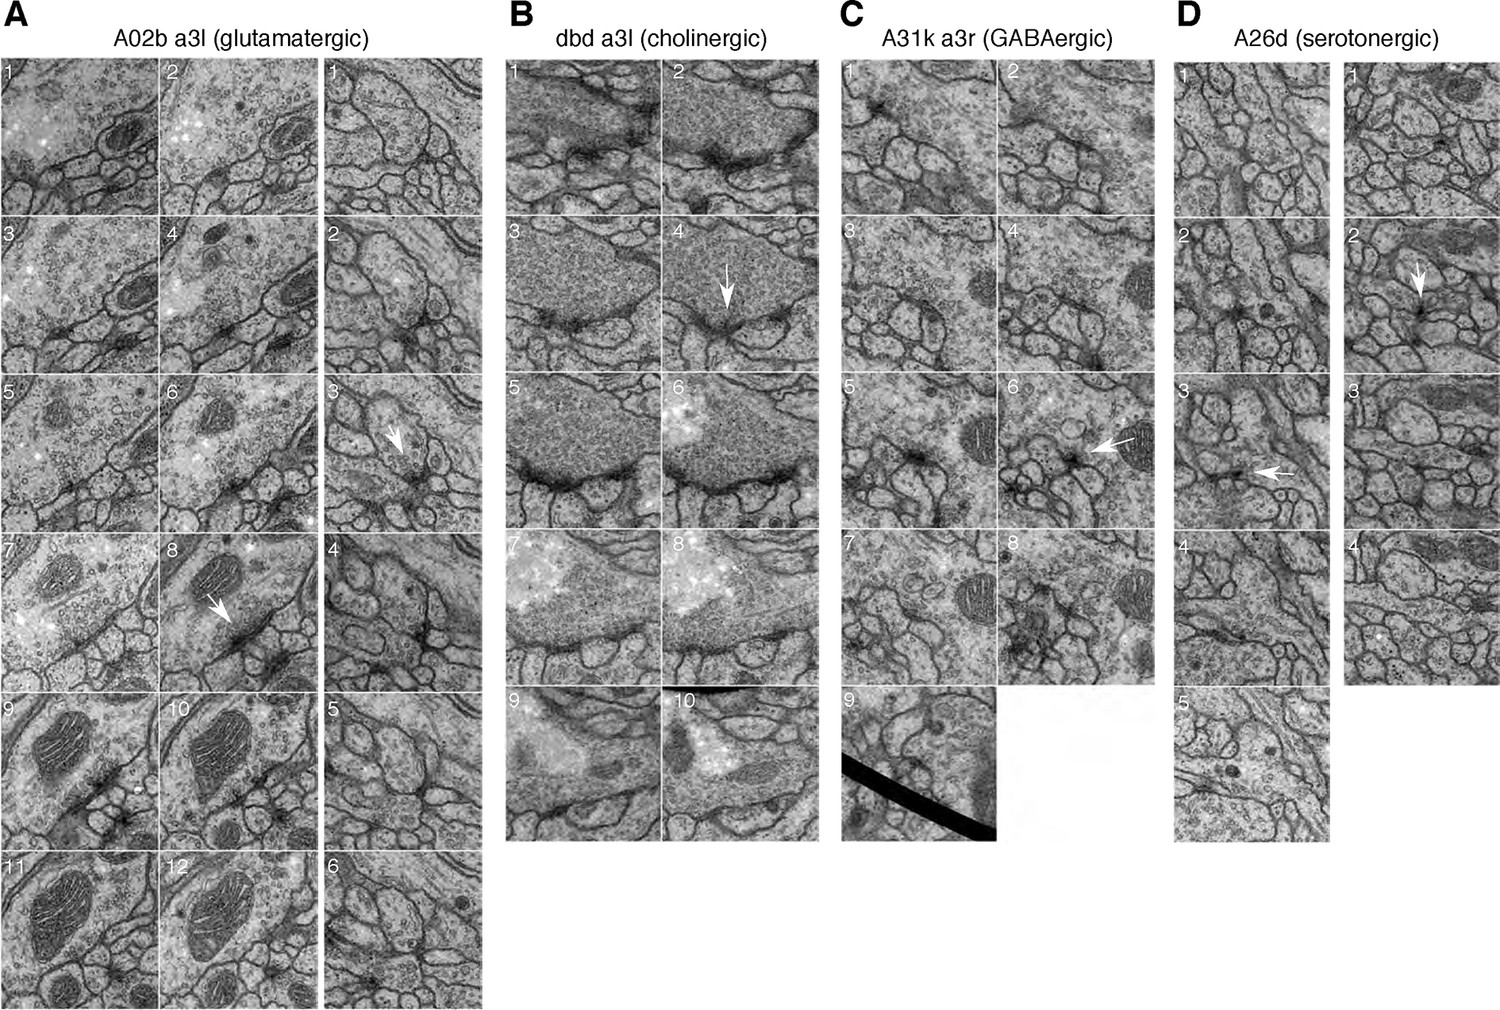
Synapses of neurons with different neurotransmitters.
For all examples, white arrow points at the most prominent slice of the T-bar. Each panel measures 1024 nanometers on the side. (A) Two examples of synapses in the glutamatergic neuron A02b (a 'looper' or 'PMSI' neuron; Kohsaka et al. 2014) spanning twelve and six 50 nm sections respectively. Glutamatergic synapses vary considerably in size and number of postsynaptic partners (from 3 to over 15). (B) An example of a cholinergic synapse (a sensory axon, dbd; Yasuyama and Salvaterra, 1999) spanning 12 sections. (C) An example of a synapse from a GABA immunoreactive cell type, A31k, spanning 9 sections. The arrowhead annotates the T-bar at panel 6 for the GABAergic synapse. The black thick line crossing panel 9 in A31k is the shadow of a fold in the support film. (D) Two examples of the typically small, dyadic synapses found in serotonergic neurons like A26d (Chen and Condron, 2008). Synapses in the serotonergic neurons typically span only 2 sections (100 nm) and contact 2 or occasionally 3 postsynaptic partners.
Figure 2
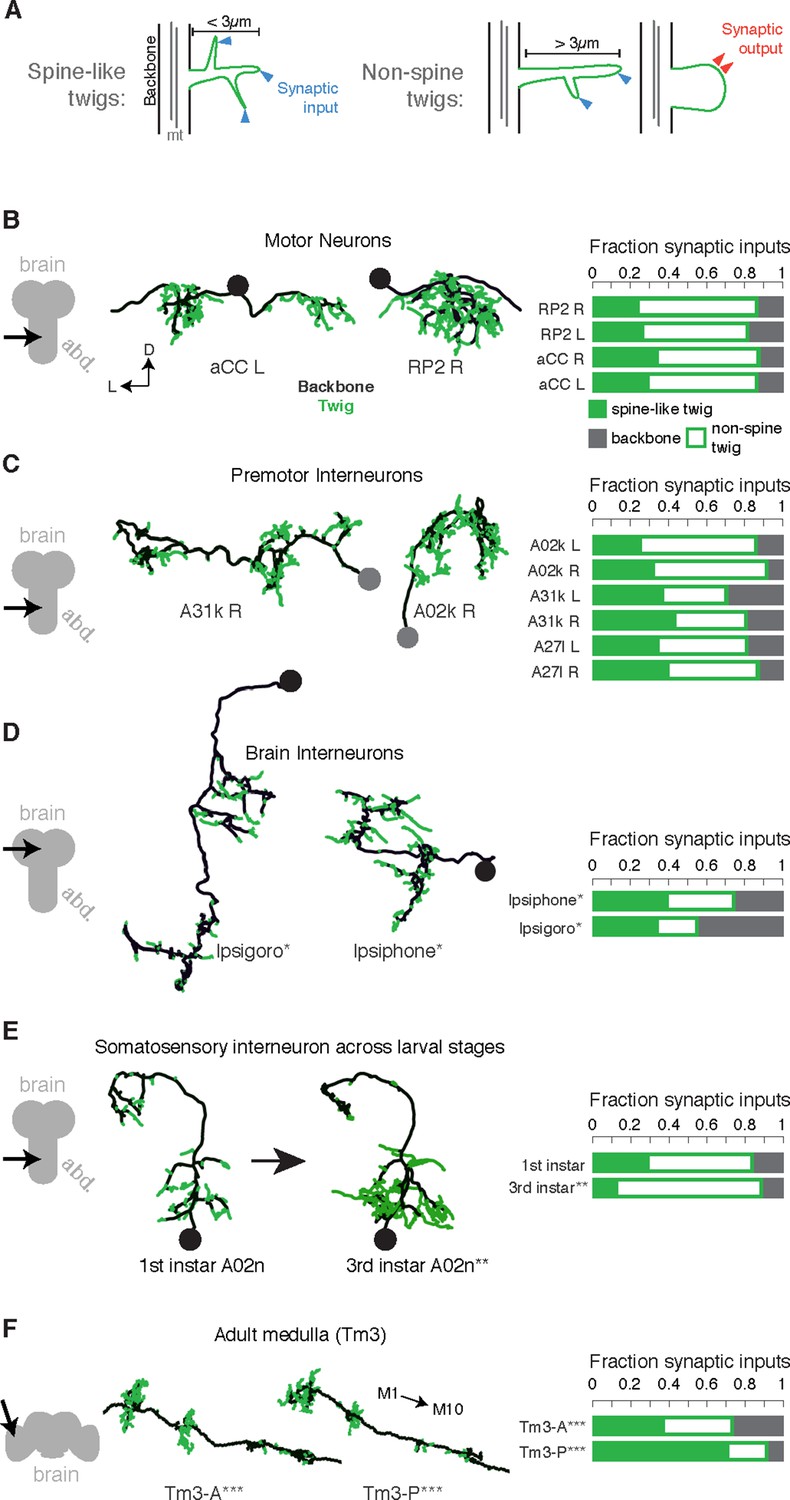
Twigs, small microtubule-free neurites, are the primary site of input in Drosophila neurons.
(A) Twigs less than 3 µm are considered spine-like, while those longer or primarily presynaptic are not. (B–F) EM reconstructions (middle) of Drosophila neurons from different parts of the nervous system (left) showing backbone (black) and twigs (green). At right, the fraction of all synaptic inputs onto short spine-like twigs, longer twigs, and backbone. Data sets are indicated by marks: no asterisk: 1.5 segment volume. *: Whole CNS volume. **: 3rd instar abdominal segment volume. ***: Adult medulla skeletons and images, generously provided by Janelia FlyEM [9]. Neurons are individually scaled to show complete arbors. (B) motor neurons in 1st instar larva. (C) Premotor interneurons of 1st instar larva. (D) Interneurons in the brain of the 1st instar larva. (E) A somatosensory interneuron cell type across life stages, 1st instar and 3rd instar larvae. (F) Tm3 cells in the adult fly medulla.
Figure 3 with 3 supplements
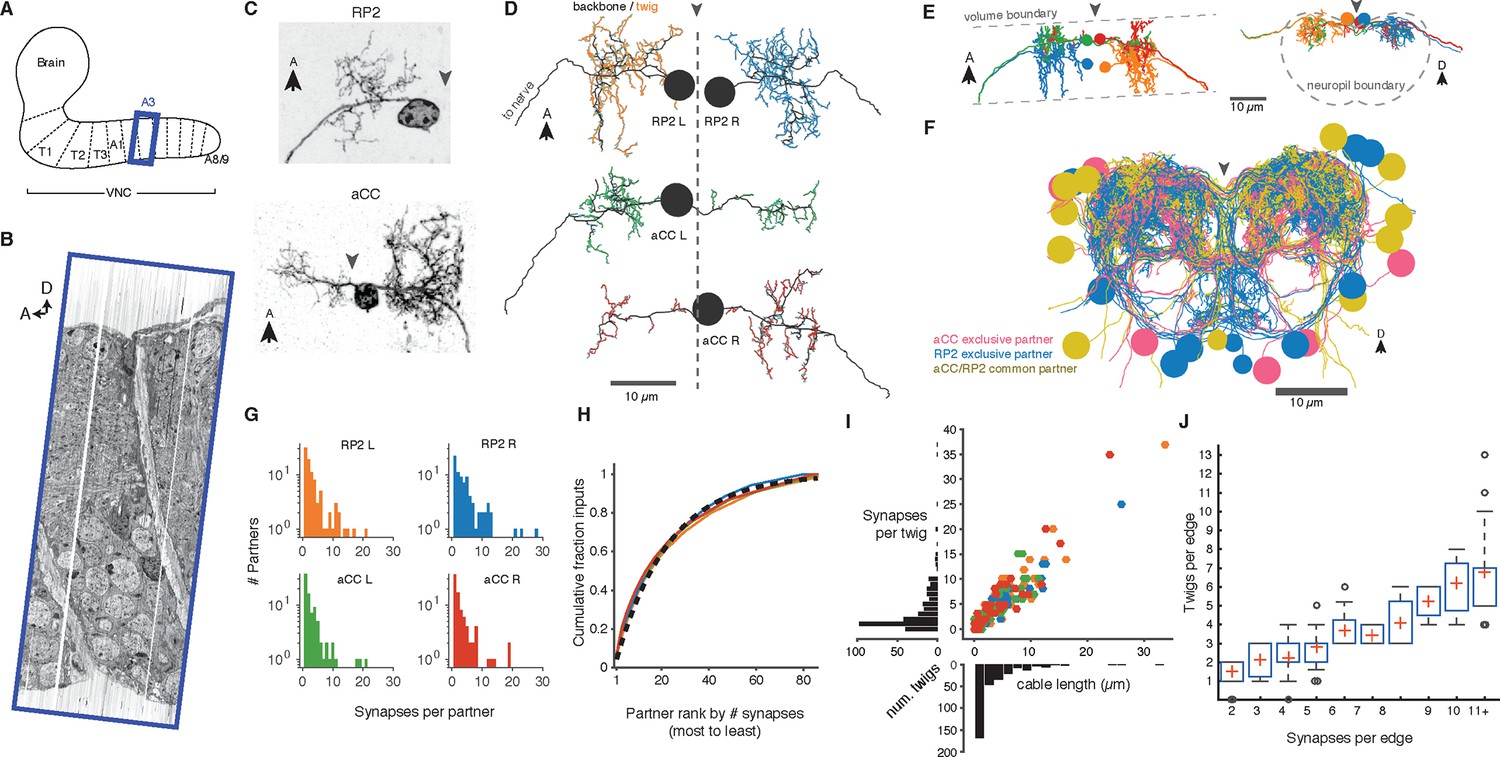
Twigs are crucial to larval motor circuitry.
(A) The EM volume covers one abdominal segment (blue box) of the ventral nerve cord. (B) Sagital view of the EM volume. Note segmentally repeated features. (C) Dorsal projections of genetically labeled motor neurons RP2 (top, from 1st instar) and aCC (bottom, from 3rd instar). Each cell type has characteristic dendritic arbors. Midline indicated by gray arrowhead. (D) EM reconstructions of each of four motor neurons aCC and RP2 in the 1st instar larva match the left and right homologs of aCC and RP2. Backbone is indicated by black, twigs by colors. Midline is shown as dashed line. (E) True spatial relationship of the four motor neurons in (D), shown dorsally (left) and in cross-section (right). Note that the boundary of the EM volume is limited. (F) All arbors presynaptic to aCC and RP2. Colors indicate if neuron is presynaptic to one or both motor neuron cell types. See Video 2 for rotated views of the arbors. (G) Histograms of premotor partners connected via number of synapses. (H) Colored lines: the cumulative fraction of total inputs as a function of ranked presynaptic partn ers for each motor neuron are extremely similar. Black dashed line: simultaneous fit for all four motor neurons to 1 - exp (-r/ρ) for rank r gives ρ = 22.34. (I) Scatterplot and histogram of the total length and number of synapses on each of the 305 twigs for each of the four motor neurons (colors as previous). (J) Number of twigs contacted by motor neuron partners as a function of the number of synapses in the connection. Crosses are median, boxes the interquartile range, whiskers the 10th to 90th percentiles. Outliers shown.
Figure 3—figure supplement 1
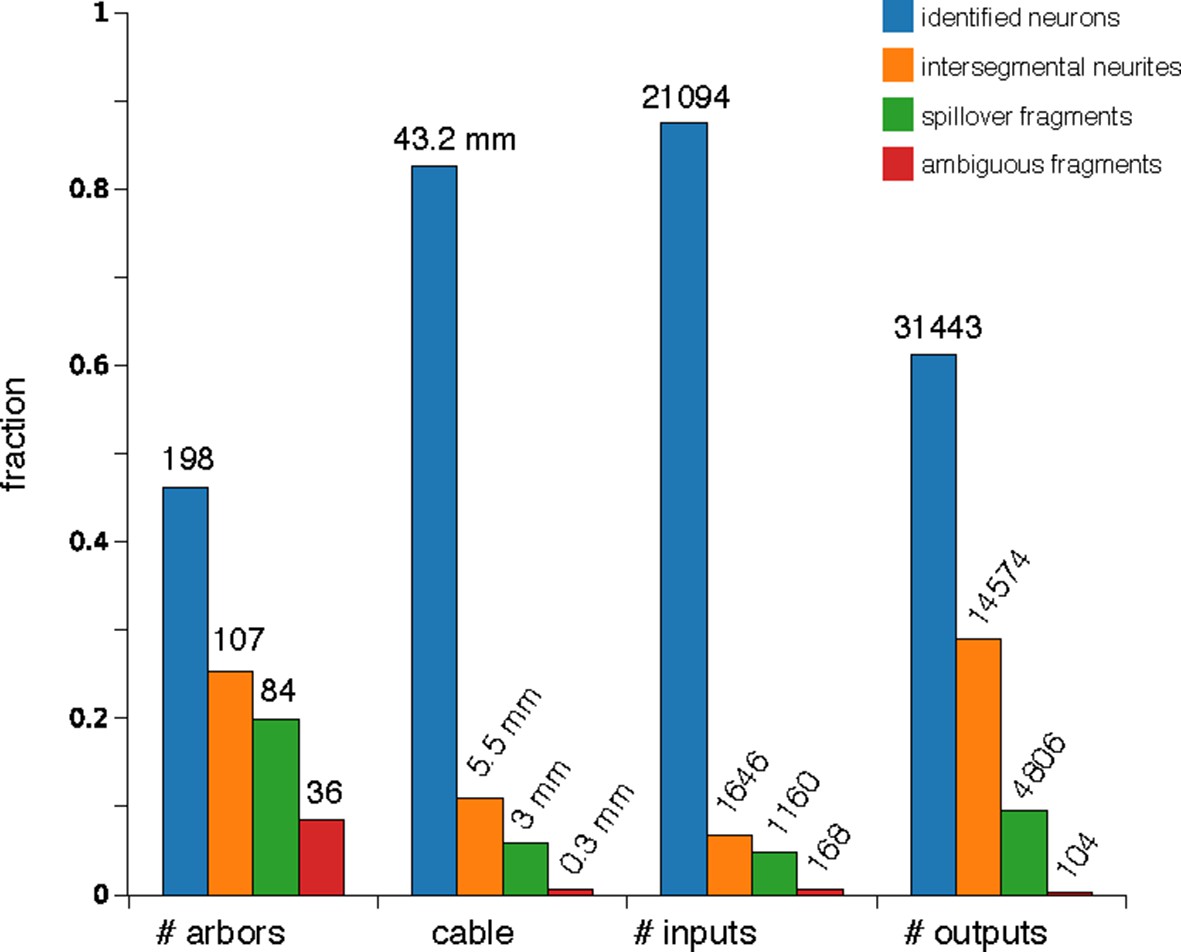
Counts of reconstructed neuronal arbors.
We reconstructed 425 arbors which fall into 4 groups: 'identified neurons' (arbors that could be associated with a single neuron name or at least with a lineage of origin, even if the whole arbor is not present within the imaged EM volume), 'intersegmental neurites' (neurites that cross the volume from anterior to posterior, the majority of which are an unbranched axon that synapses onto motorneurons), 'spillovers' (partial arbors that are not recognizable and which originate in neurons in the anterior or posterior segments) and 'ambiguous fragments' (very small arbors with few inputs or outputs and which terminate within the boundaries of the volume; most of them terminate at a three-section gap between sections 348 and 352). Identified neurons are either synaptic partners of dbd, aCC or RP2, or are any of the other 16 proprioceptive axons (the left and right ddaD in segments 3 and 4; ddaE in segments 2 and 3; dmd1 and vbd in se gment 3; and dbd in segments 2 and 4) or 9 motorneurons (the left and right RP5, U1, U2 and the unpaired VUMs in abdominal segment 3). While arbors in the intersegmental group could not be identified, in numerous occasions the left and right homologs are recognizable, given idiosyncratic characteristics (not shown).
Figure 3—figure supplement 2
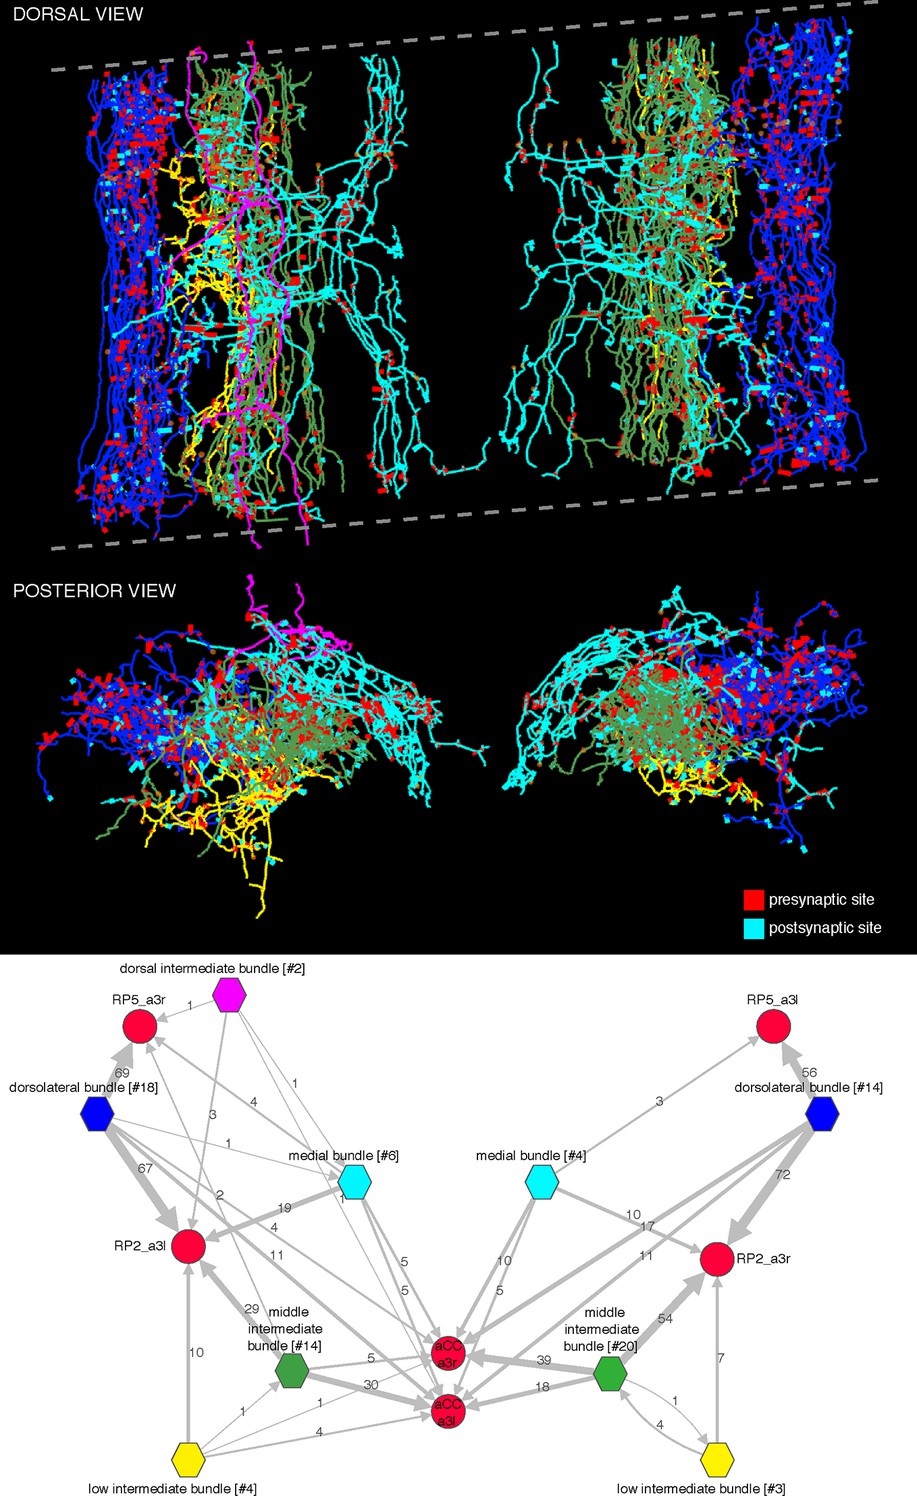
Bundles of premotor axons that run the length of the imaged volume.
These axons originate in neurons whose somas are located in areas of the central nervous system beyond the limits of the imaged EM volume. We distinguish five bundles: dorsolateral (blue), low intermediate bundle (yellow), middle intermediate bundle (green), dorsal intermediate bundle (magenta; only present on the left side and weakly connected to motor neurons), and medial bundle (cyan). The dotted lines delimit the imaged volume, which had a tilt of about 8 degrees relative to the transversal plane. Arbors, particularly the most dorsal ones (magenta) may appear outside the plane or short of the imaged limits due to the perspective projection. Below, wiring diagram bundle-wise onto the motor neurons RP2, RP5, and aCC. The name of each bundle includes the number of member neurons in brackets; asymmetries between left and right originate in the fact that some members contribute a single synapse onto mot or neurons and may not appear on the other side. Intrabundle edges are not shown. Notice how the only large source of inputs onto RP5 is from the dorsolateral bundle, which also places many synapses onto RP2. Note that we did not reconstruct all synaptic partners of RP5.
Figure 3—figure supplement 3

Numerically high synapse edges are distributed over many twigs in adult Tm3 neurons.
Each input onto the Tm3s analyzed in Figure 2 is a data point (see legend). The x-axis is the number of synapses this edge is comprised of, the y-axis is the number of distinct twigs this edge spans. As in the larval motor neuron data, edges with multiple synapses are almost always distributed across multiple twigs. Points are jittered to avoid overlap.
Figure 4
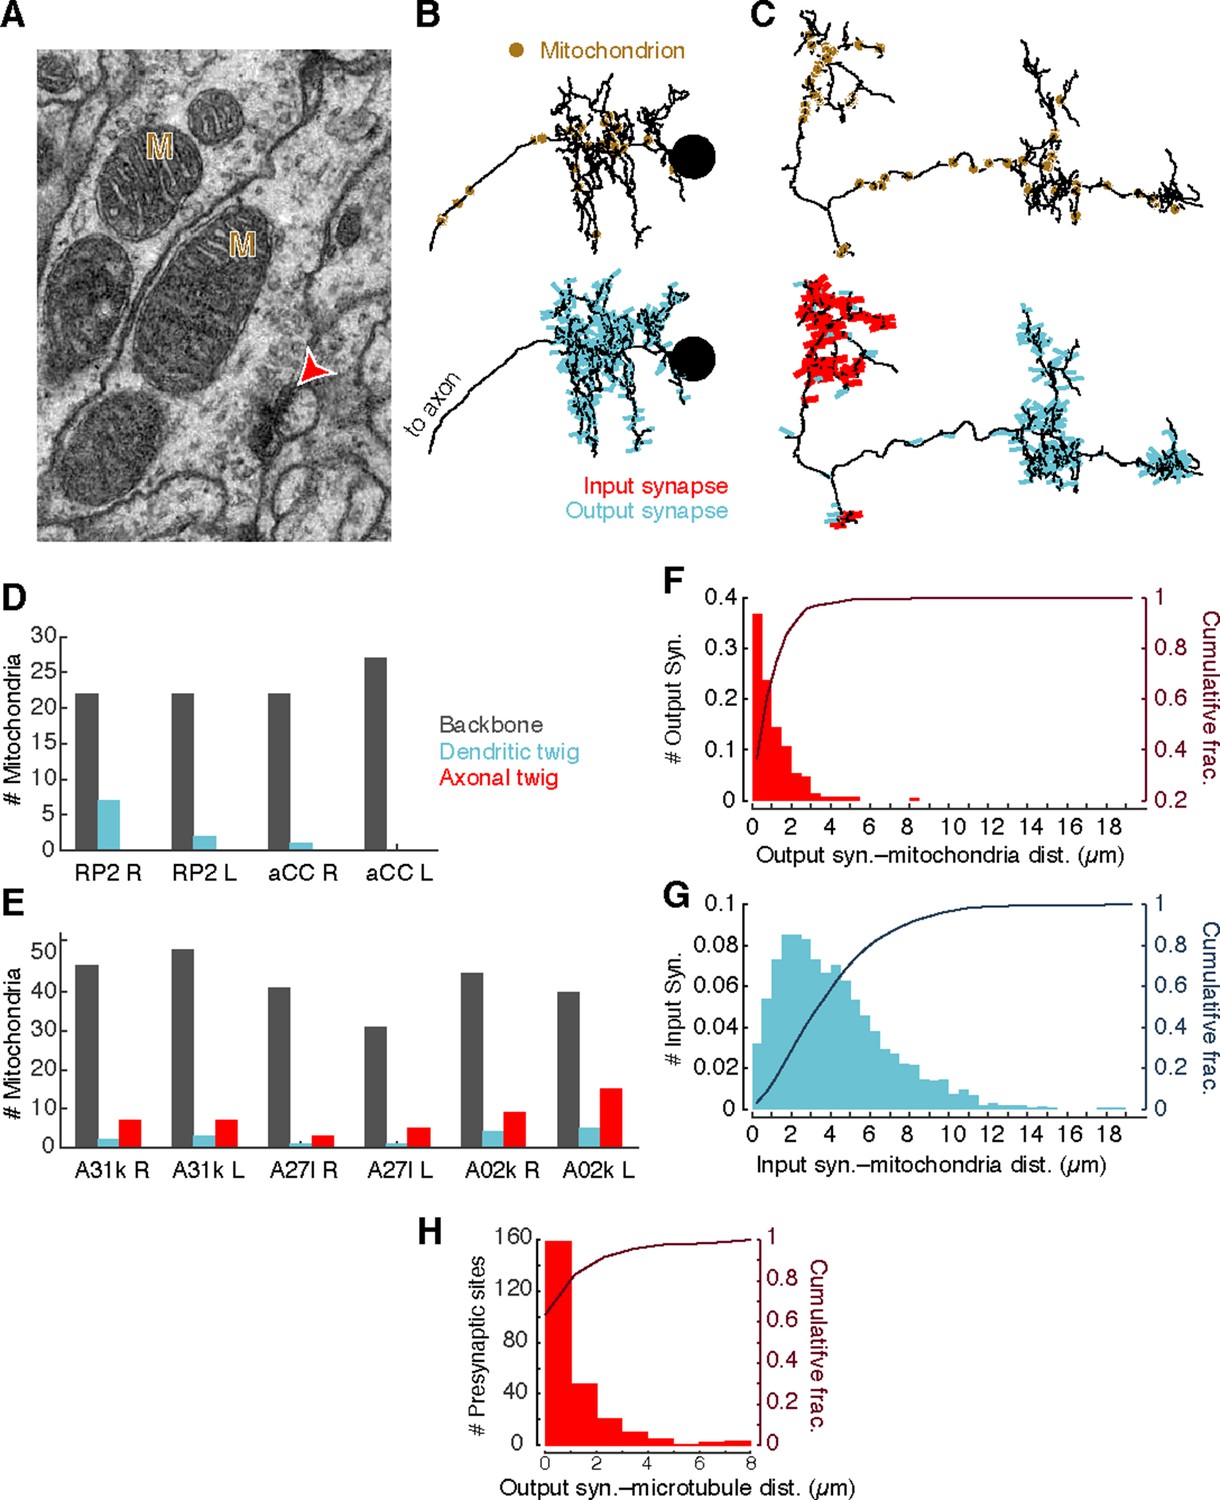
Mitochondria are associated with presynaptic sites and cytoskeleton.
(A) EM micrograph shows clear mitochondria (labeled with M) and a nearby presynaptic site (red arrowhead). (B) Dorsal view of motor neuron RP2 with locations of mitochondria indicated (top, circles) and synaptic sites (bottom). (C) Dorsal view of interneuron A31k with locations of mitochondria indicated (top, circles) and synaptic sites (bottom). See Video 3 for both mitochondria and synapses shown together. (D) Number of mitochondria associated with backbone and twig locations on selected motor neurons. (E) Number of mitochondria associated with backbone and twig locations on selected interneurons. (F) Histogram of the distance between presynaptic sites and their nearest mitochondrion along the arbor for the interneurons in E. Cumulative distribution indicated as a line. (H) Histogram of the distance between presynaptic sites and the nearest backbone along the arbor for the interneurons in E. Cumulative distribution indicated as a line.
Figure 5
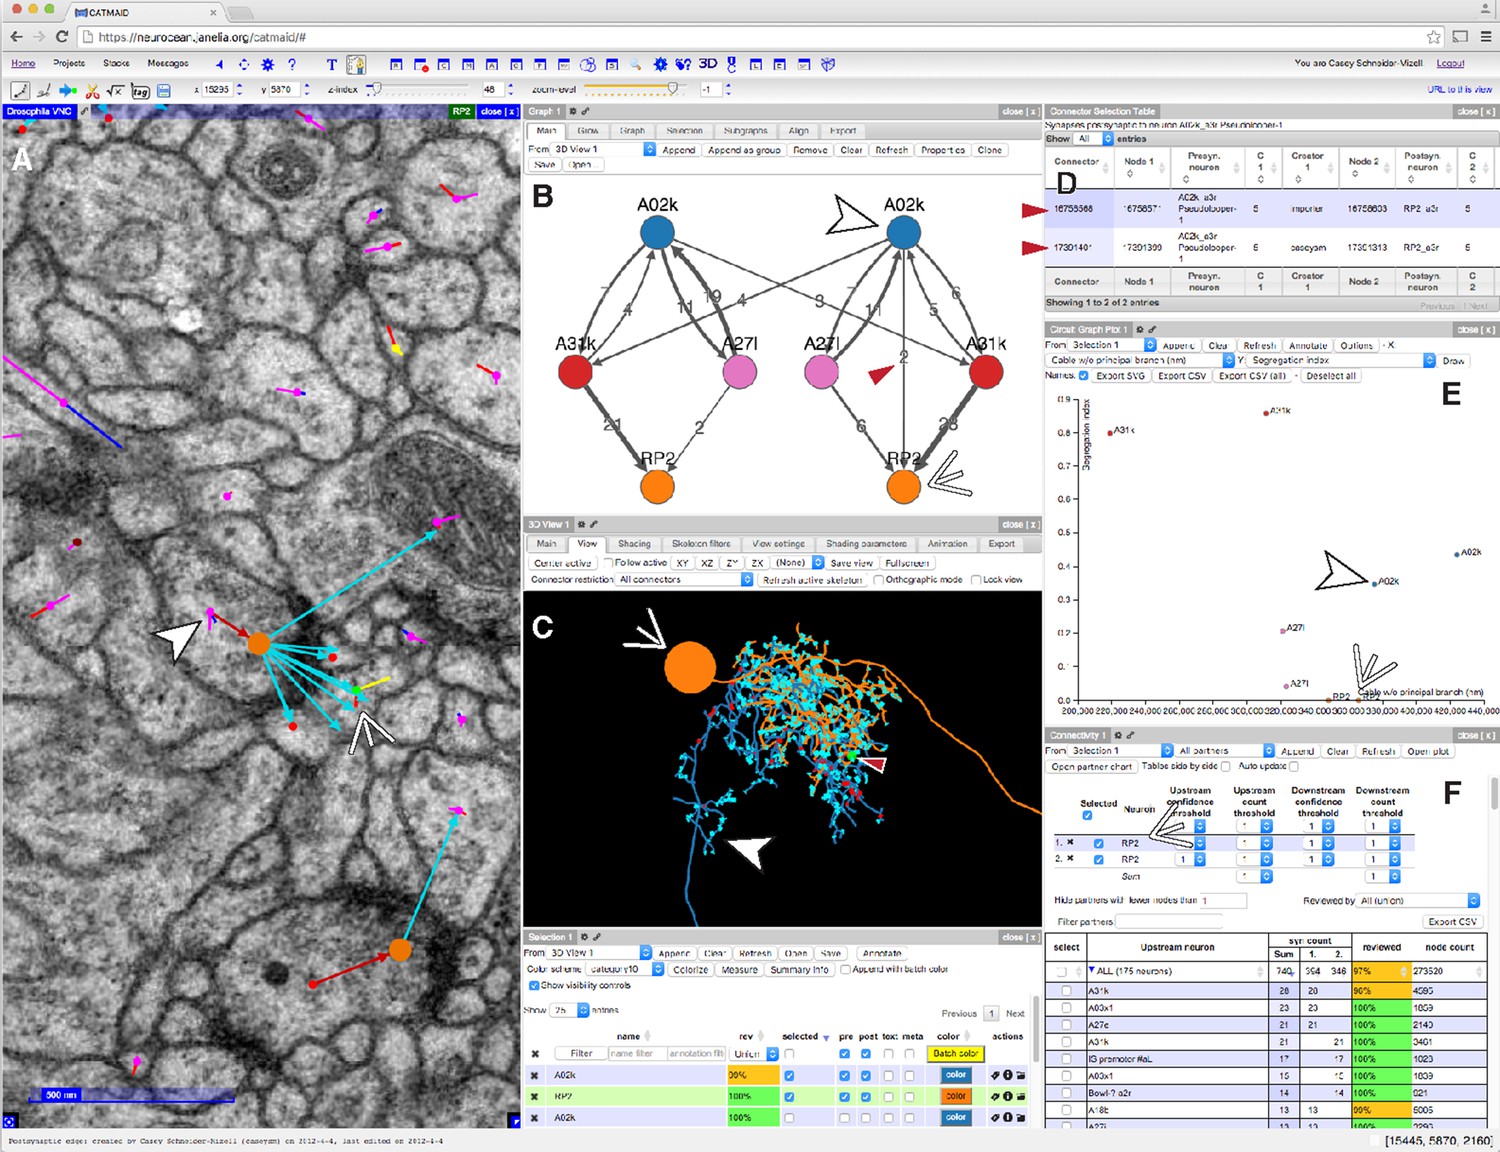
CATMAID presents multiple, interactive views on EM imagery and quantitative features.
(A–F) An example of a CATMAID session in the Chrome web browser (Google, Inc.). Different aspects of a pair of connected neurons, A02k and RP2, are shown across each pane. The number, quantity, location, and neurons in each panel are controllable. (A) An image pane shows the EM data, all reconstructed nodes in the view (purple dots), synapse connector nodes (orange dots), and the active node (green dot, indicated by thin white arrowhead). The current active node belongs to an RP2 motor neuron and is postsynaptic to a synapse on interneuron A02k, indicated by the thick white arrowhead. (B) Graph representation of a collection of six neurons, including the selected pair indicated as above. Edge labels indicate the number of associated synapse (red arrowhead). (C) The pair of neurons indicated in (A), shown in a 3d viewer (orange, RP2; blue, A02k, indicated as above). The active node in the image pane is shown by a green dot in the viewer (indicated by red arrowhead, also the location of the synapse shown at left). (D) List of synapses between A02k and RP2, represented in the graph pane by an edge (red arrowhead in B). Each row is clickable, letting the contributor jump to that location to permit fast reviewing of specific connections. (E) Plot of quantitative morphological or network measurements of the six neurons in (B). (F) Connectivity list shows neurons synaptically connected to selected neurons (here, RP2) and counts the total number of synapses. The row for the presynaptic neuron A02k is offscreen.
Figure 6 with 3 supplements
Graph search to identify consistent networks.
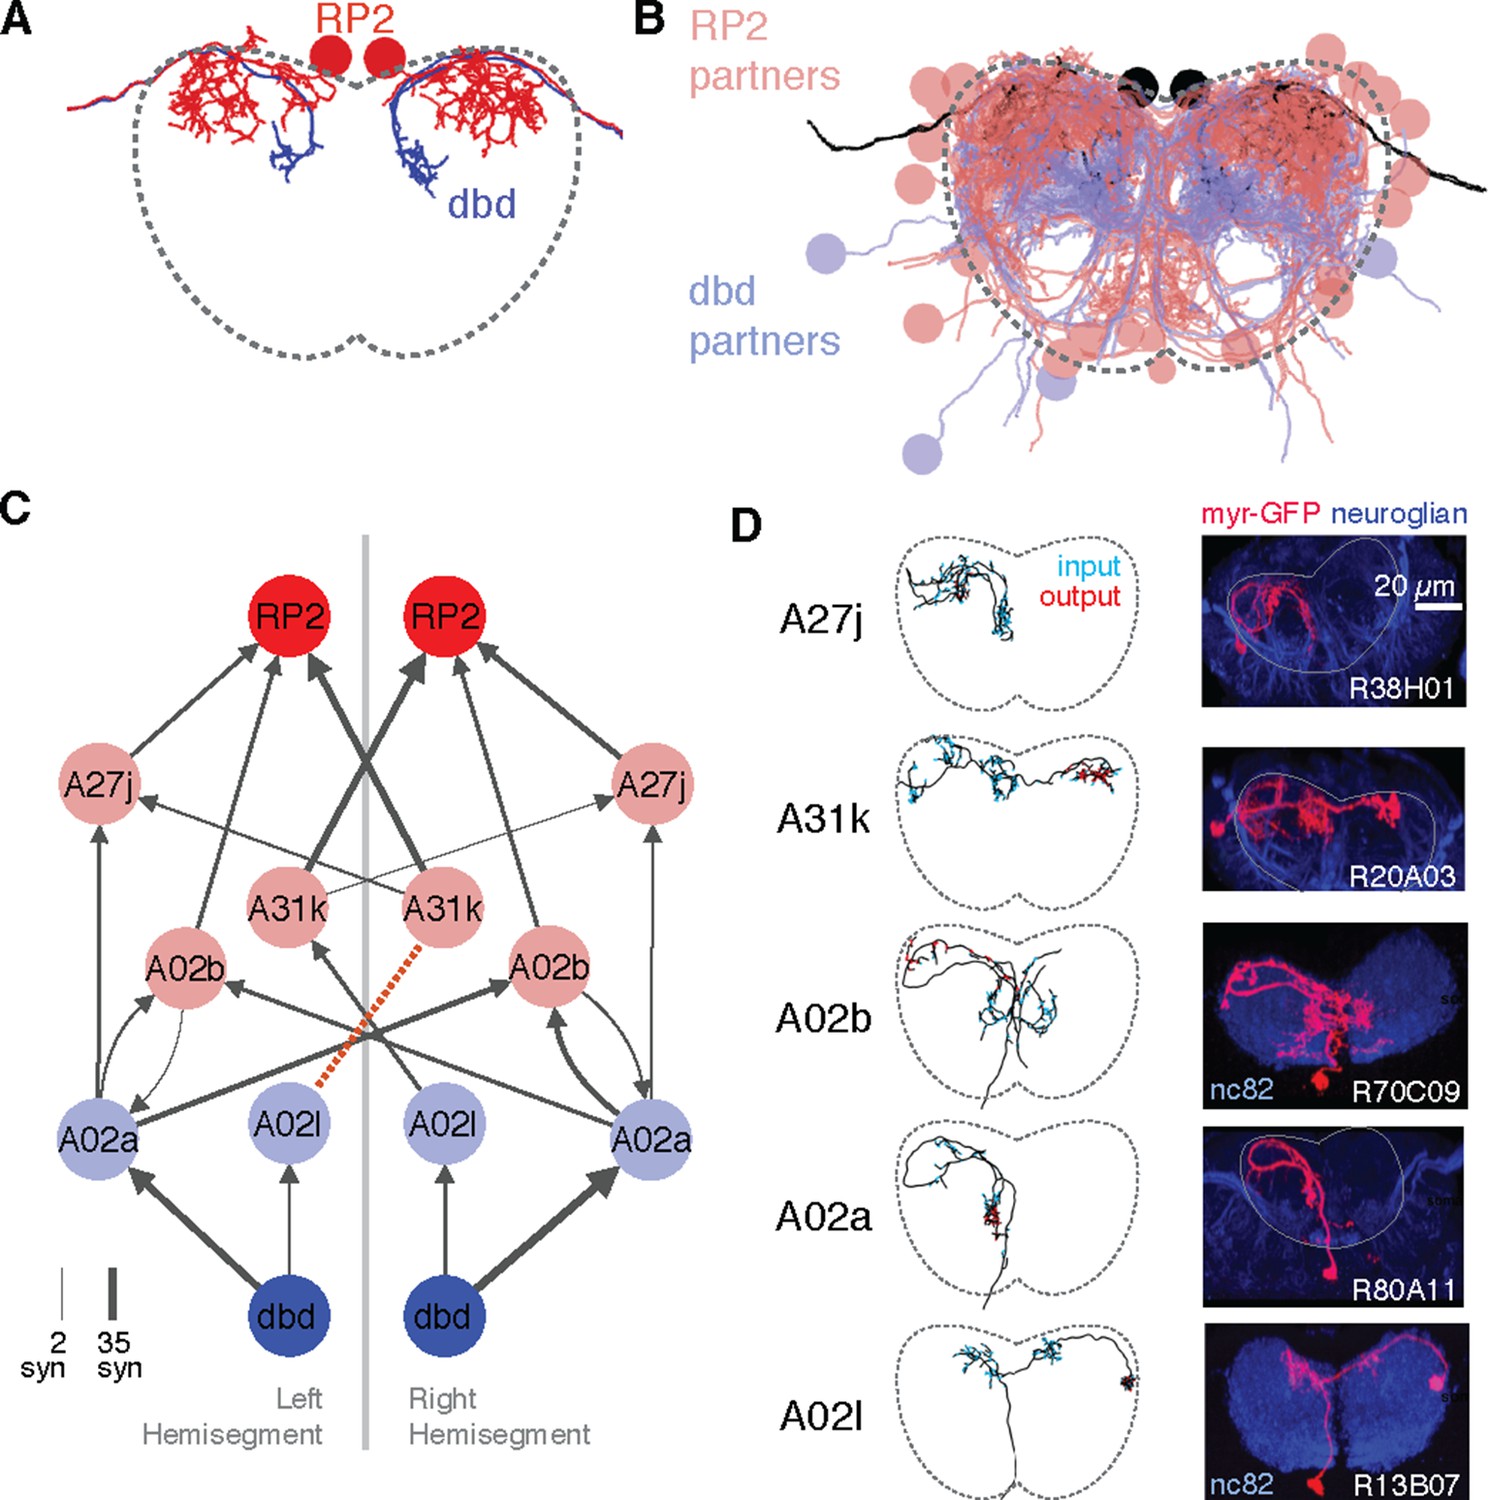
(A) The motor neuron RP2 and proprioceptive sensory neuron dbd, shown in transverse. (B) All synaptic partners of RP2 and dbd in (A). (C) Five symmetric pairs of identified neurons link the two cell types with three or fewer hops of at least three synapses each, as found by search in CATMAID. All edges are observed in both the left and right hemisegments, except for a single edge outside the volume boundary (red dashed line , see Figure 6—figure supplement 1). Line thickness increases with number of synapses (maximum and minimum values shown). In this and all network diagrams, single synapse edges are not shown for clarity. (D) All identified cells in EM (left) could be matched to confocal maximum intensity projections of single neurons found in sparsely labeled GAL4 lines (right, see 'Materials and methods' for details). For neuroglian staining, an approximate neuropile boundary is shown; for nc82 staining, the blue region is a profile of neuropile.
Figure 6—figure supplement 1
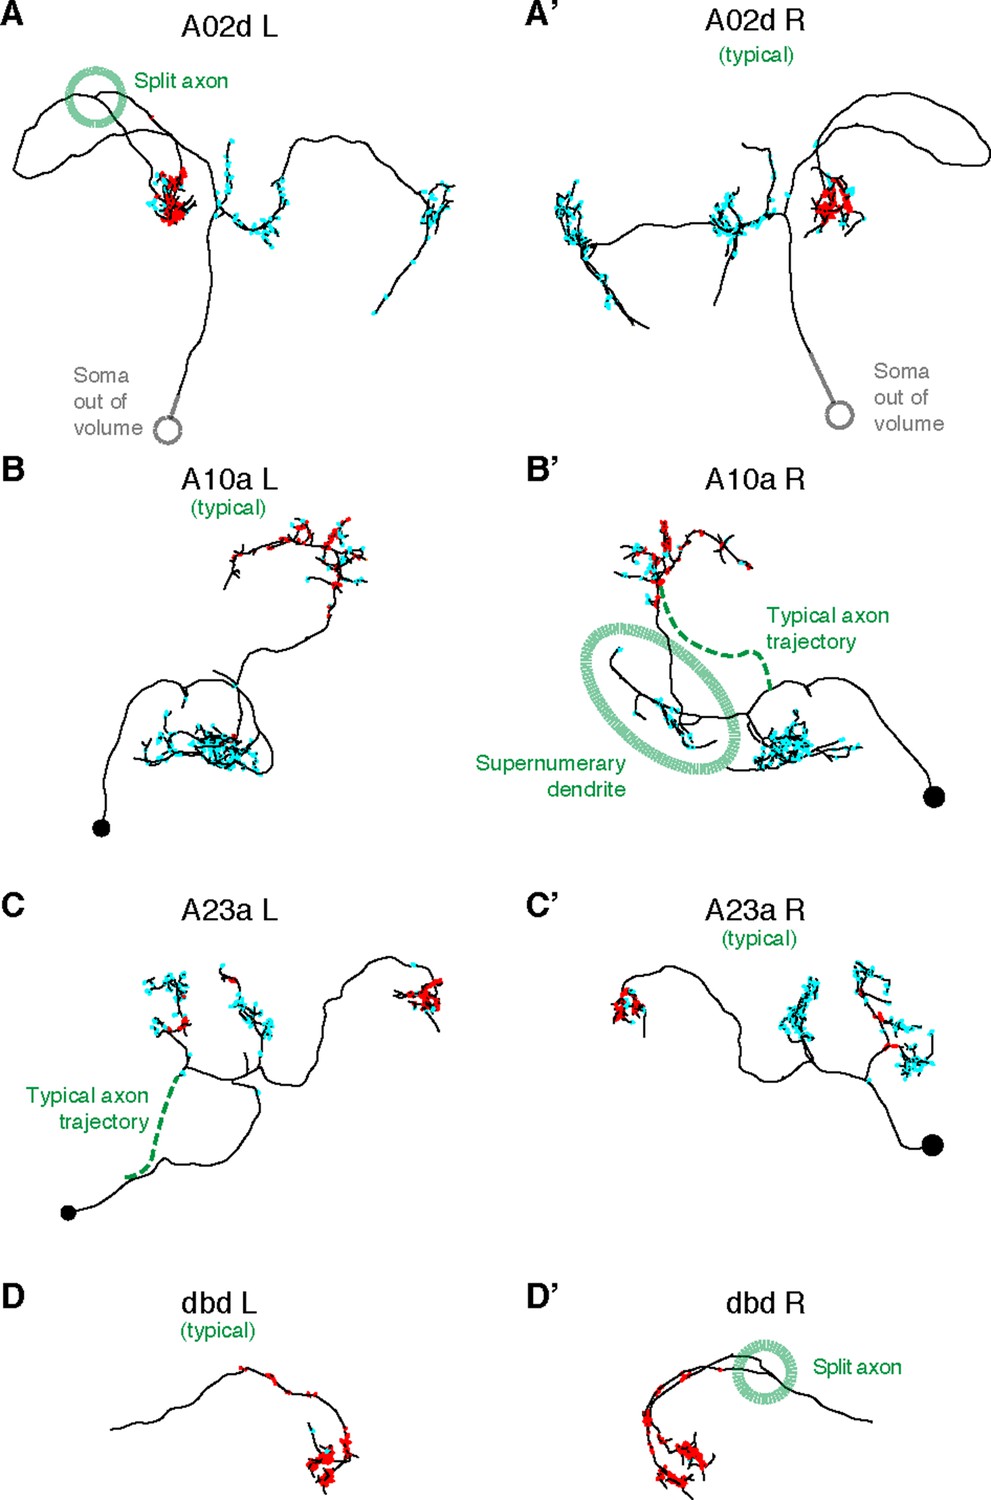
Four pairs of left and right homologs in posterior view, where one of the pairs (canonical) conforms with the arbor shape found in light microscopy (not shown) and the other presents deviations (A,’A’: A02d, B,B’: A10a, C,C’: A23a, D,D’: dbd ).
There are two cases of an early split of the axon (A02d a3l and dbd a3r; dotted circle marks the split); normally the split would occur at the proprioceptive domain (where the output synapses are, in red). A10a a3r presents a misrouted axon that reaches the correct target area (and connects to the same neuron types as the canonical homolog does) but sprouts an ectopic, supernumerary dendrite along the way (which accounts for 14 input synapses out of 178 total). A23a a3l presents a correct arbor but the path to the soma is different. Connectivity-wise, deviant neurons are very similar to their canonical homologs.
Figure 6—figure supplement 2
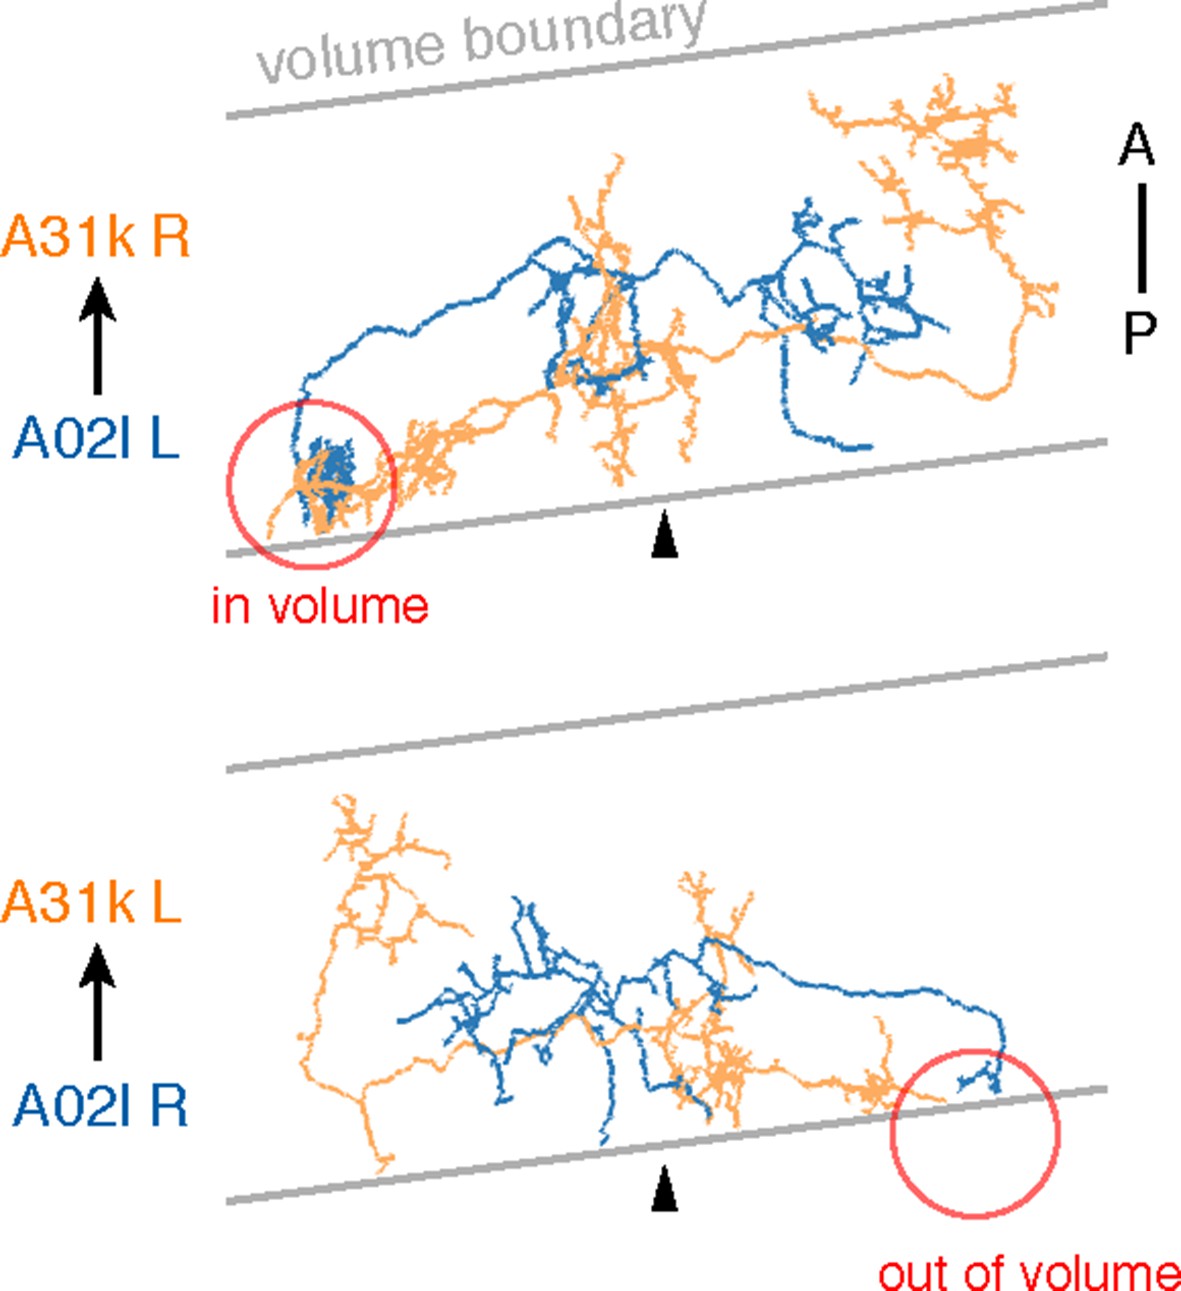
Sections were cut approximately 8 degrees from transverse.
Due to the volume limits, observed circuitry could be asymmetric, as in the case of A02l synapsing onto 31k (see Figure 6C). The region where the contact occurs (red circle) is present on one side of the data but not the other.
Figure 6—figure supplement 3
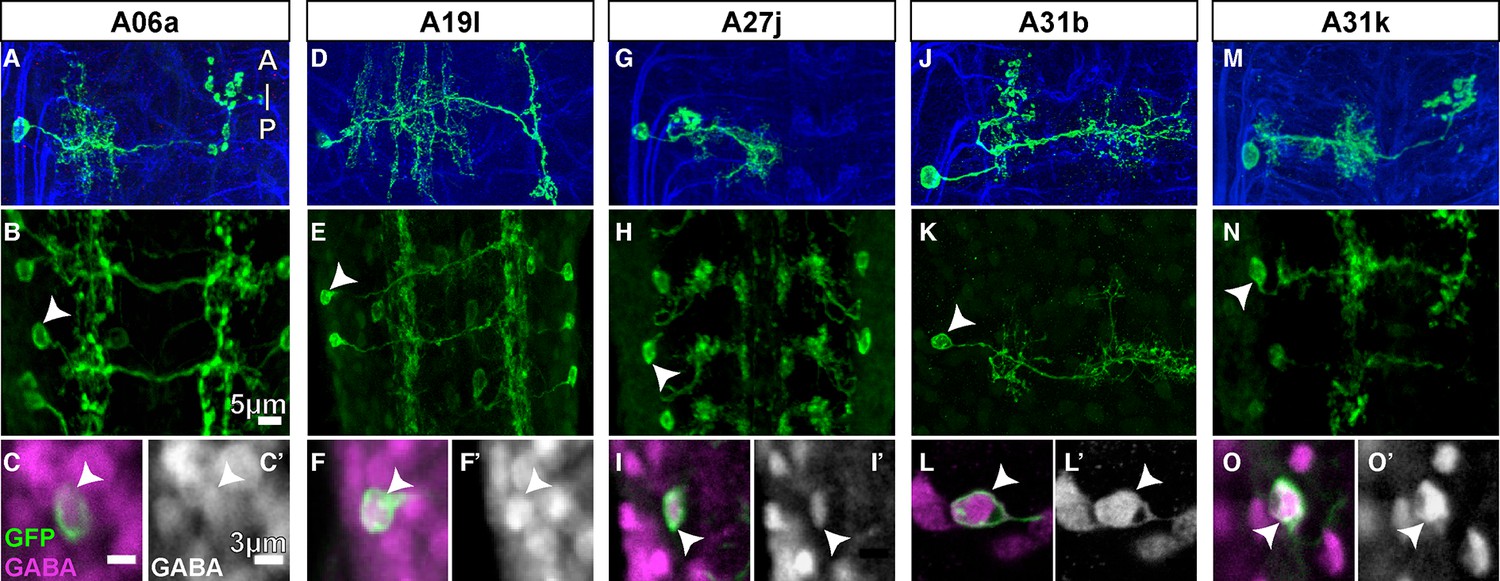
GABA immunolabeling of proprio-motor interneurons.
(A-O) Dorsal views. (A, D, G, J, M) Projections of fluorescently labeled single-cell clones of identified neurons (courtesy of James W. Truman, HHMI Janelia Research Campus). (B, E, H, K, N) Dorsal views of projections of parent lines used to generate single-cell clones, expressing myr::GFP. (C, F, I, L, O) Single z-plane at high magnification of cell indicated by arrowhead in (B, E, H, K, N) showing immunoreactivity to anti-GABA (magenta) and GFP (green). (C’, F’, I’, L’, O’) Same view as (C, F, I, L, O) only showing the anti-GABA channel in grayscale.
Figure 7 with 1 supplement
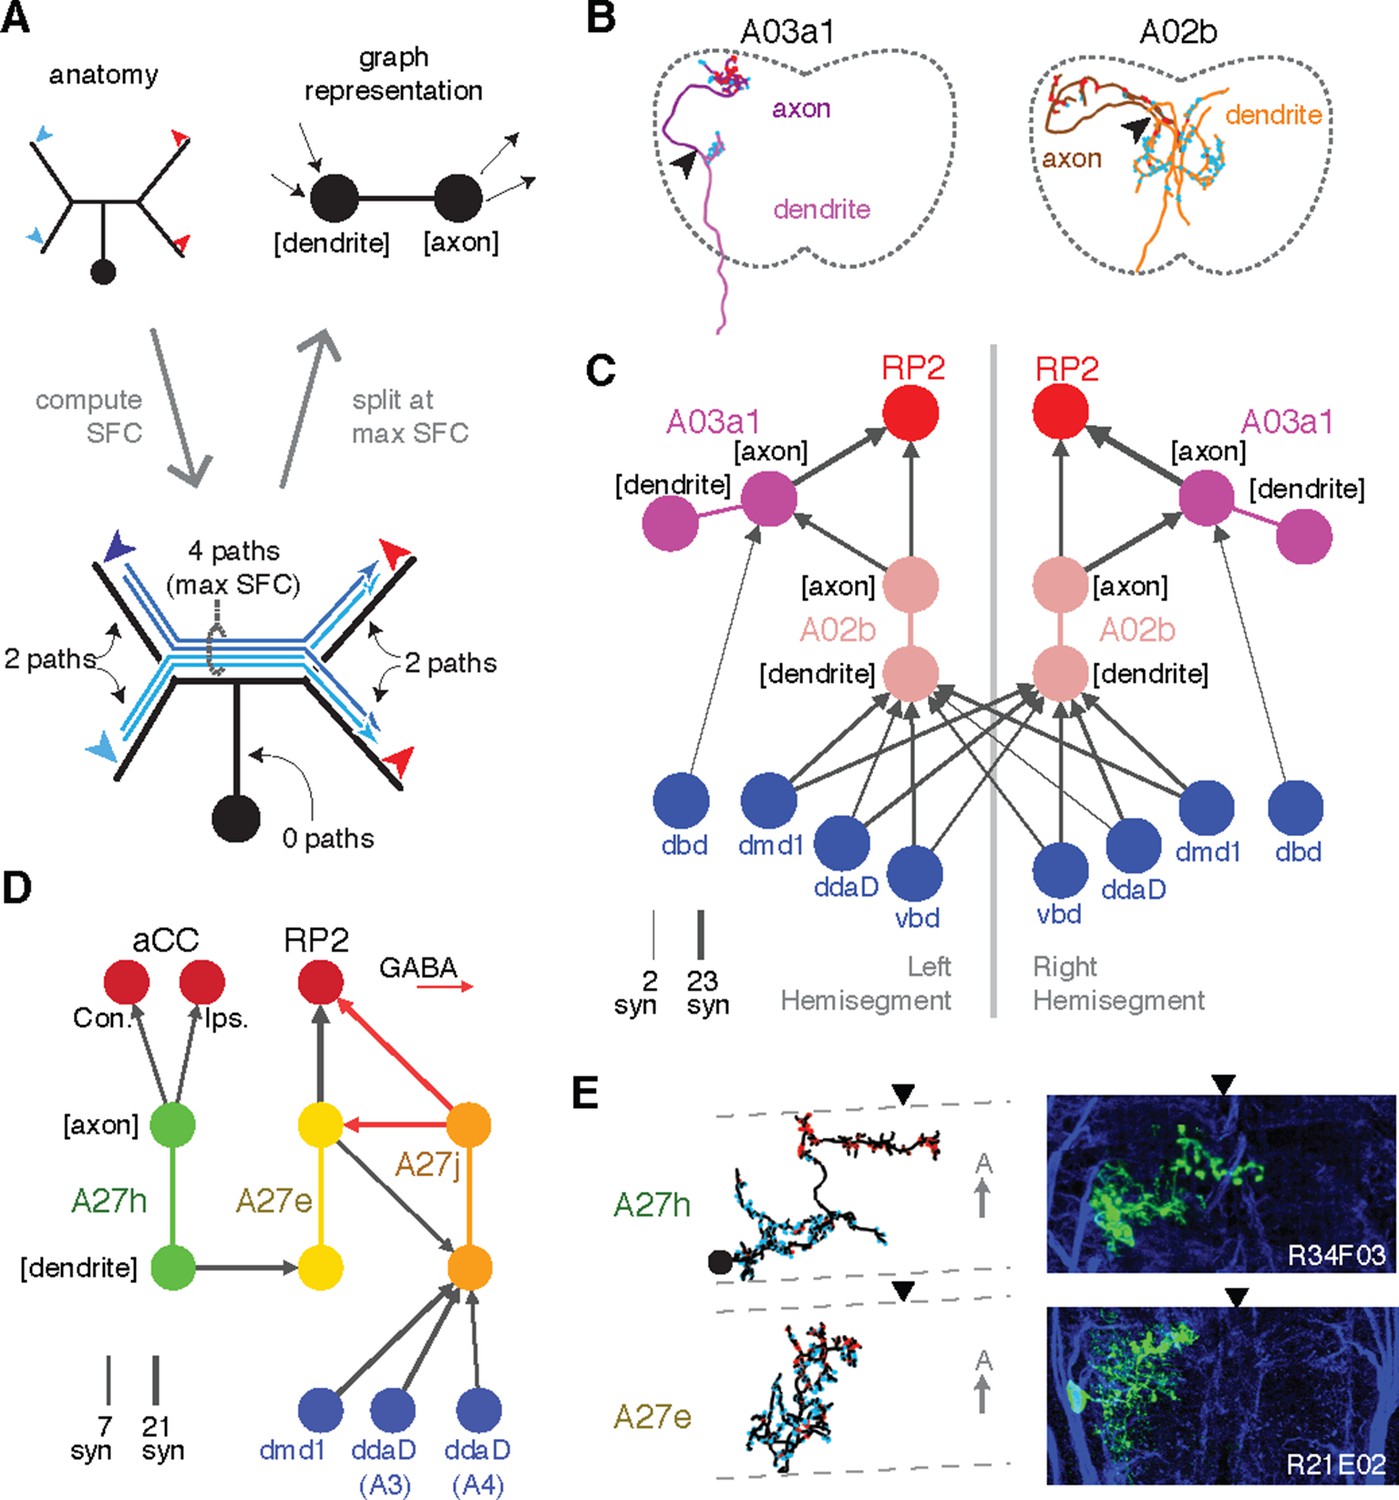
Enriching graphs with anatomical compartments.
(A) Cartoon example of splitting neurons using synapse flow centrality (SFC). (B) Examples of two premotor interneurons split into axonal (darker) and dendritic (lighter) regions with this method. Split point is indicated by the arrowhead. See Video 4 (A03a1) and Video 5 (A02b) for rotated views of synapses and splits. (C) Splitting interneurons into axonal and dendritic compartments in a proprio-motor circuit reveals stereotypic pre- and post-synaptic connectivity to premotor interneuron A03a1 and differential contributions from proprioceptor dbd relative to other proprioceptors dmd1, ddaD, and vbd. Note that the axo-axonic connection from dbd to A03a1 is only 2 synapses, and thus would not appear in Figure 6A. (D) Splitting interneurons A27j, A27e, and A27h reveals GABAergic pre- and post-synaptic input to a premotor connection, as well as dendro-dendritic coupling between interneurons that connect to synergistic motor neurons aCC and RP2. (E) Dorsal projections of A27h and A27e from EM (left) and light (right), as in C. Midline indicated by arrowheads.
Figure 7—figure supplement 1
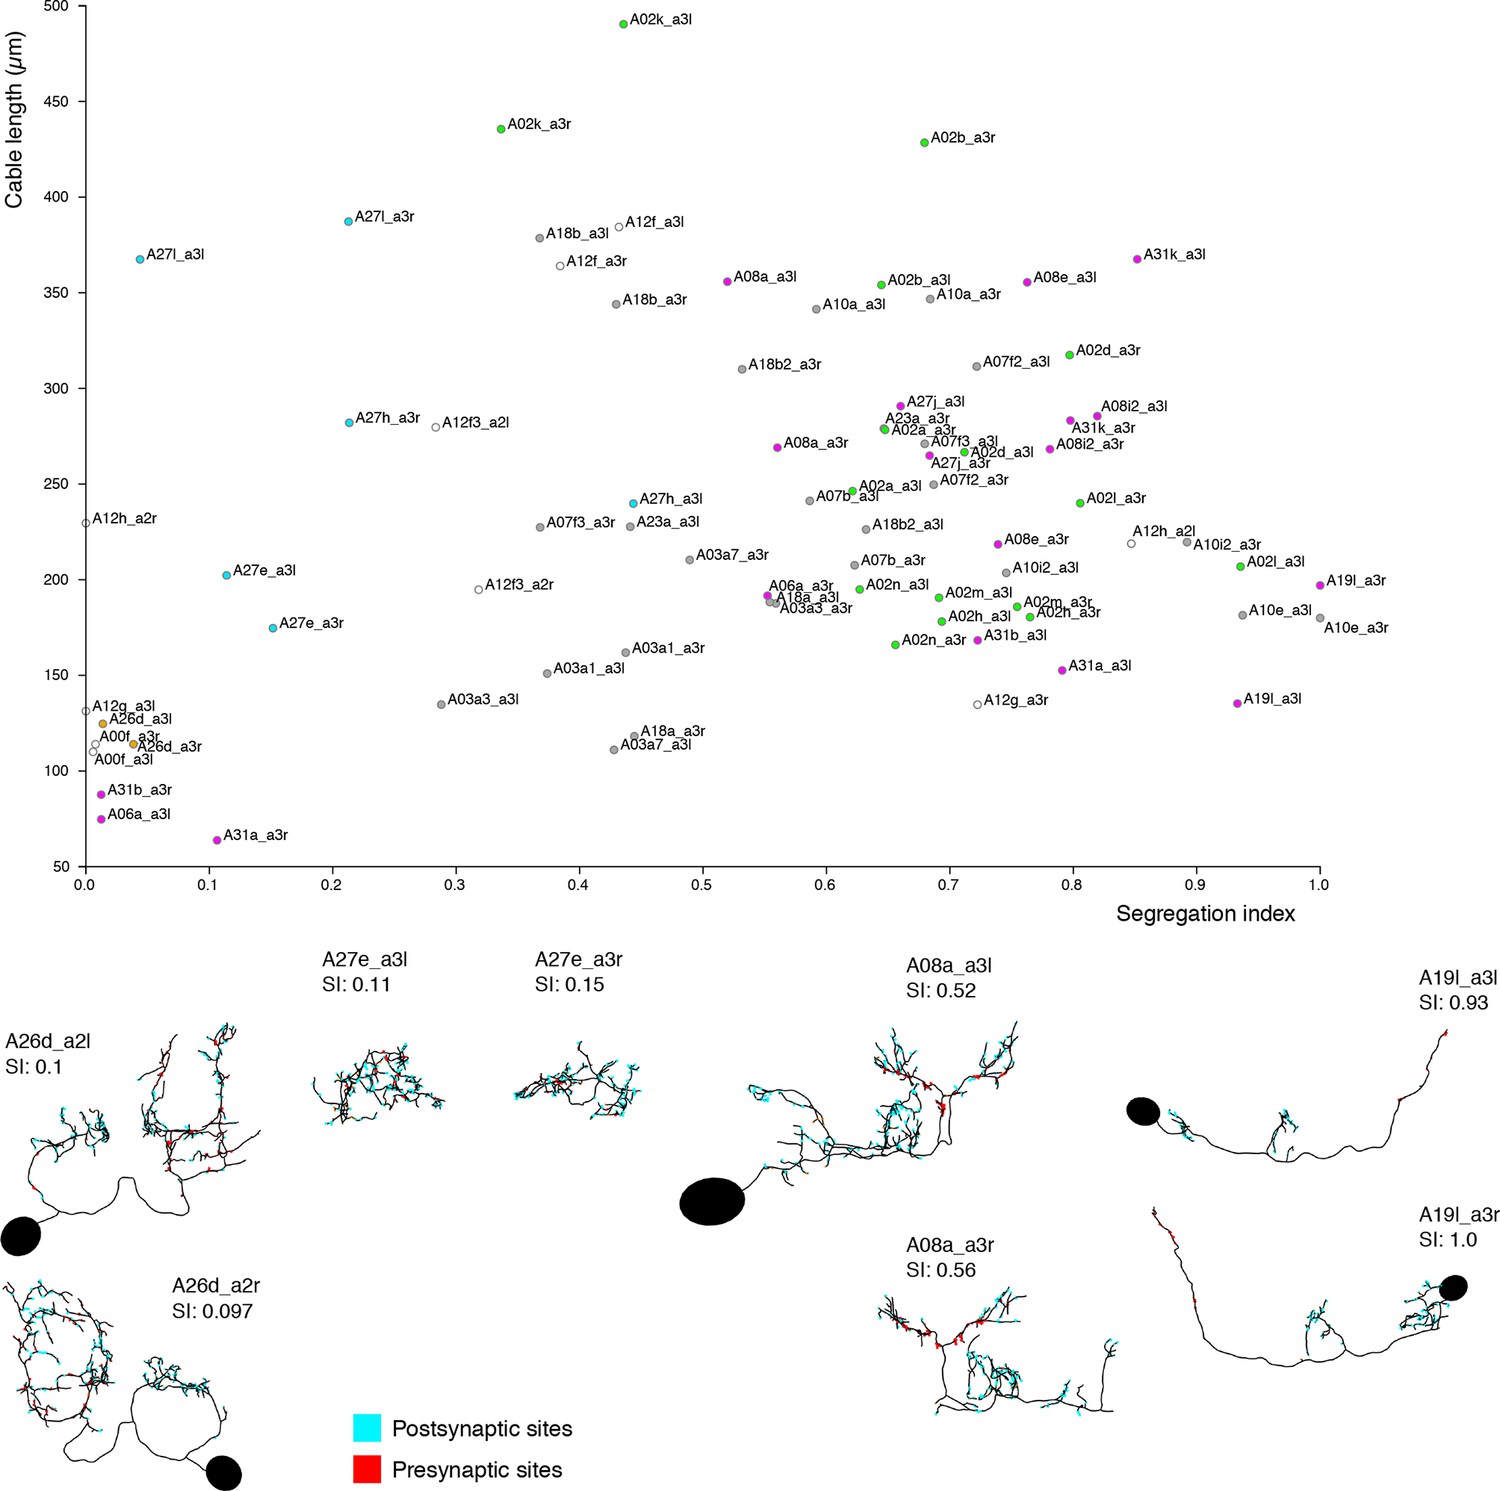
Neurons are distributed throughout the complete range of possible segregation indices.
Top, plot of segregation index vs. cable length for the 39 pairs of identified neurons. Neurons span the full range of the segregation index. Some neurons present completely unsegregated arbors like the serotonergic neurons A26d, with large arbors that present a mixture of inputs and outputs throughout; or compact neurons that are also fully mixed like A27e. Other neurons present intermediate segregation index, which generally takes one of two forms: purely postsynaptic dendrites with mixed axons (i.e. axons that receive a number of inputs) like A08a, and neurons that additionally present a small amount of dendrodendritic output synapses (e.g. A23a). Finally, some neurons present purely segregated arbors, with dendrites with only postsynaptic sites and axons with only presynaptic sites, like A19l. At bottom left of the chart, the majority of neurons are intersegmental premotor neu rons (partial axonal arbors from neurons present in segments not in the imaged EM volume). Note that neurons A27e (both sides) and A08 a3r have their soma outside the imaged EM volume. SI, segregation index; red dots: neurons presynaptic to aCC or RP2; cyan dots: neurons postsynaptic to dbd; violet dots: neurons both postsynaptic to dbd and presynaptic to aCC or RP2; yellow dots: motor neurons, proprioceptive axons or serotonergic neurons not downstream of dbd.
Figure 8
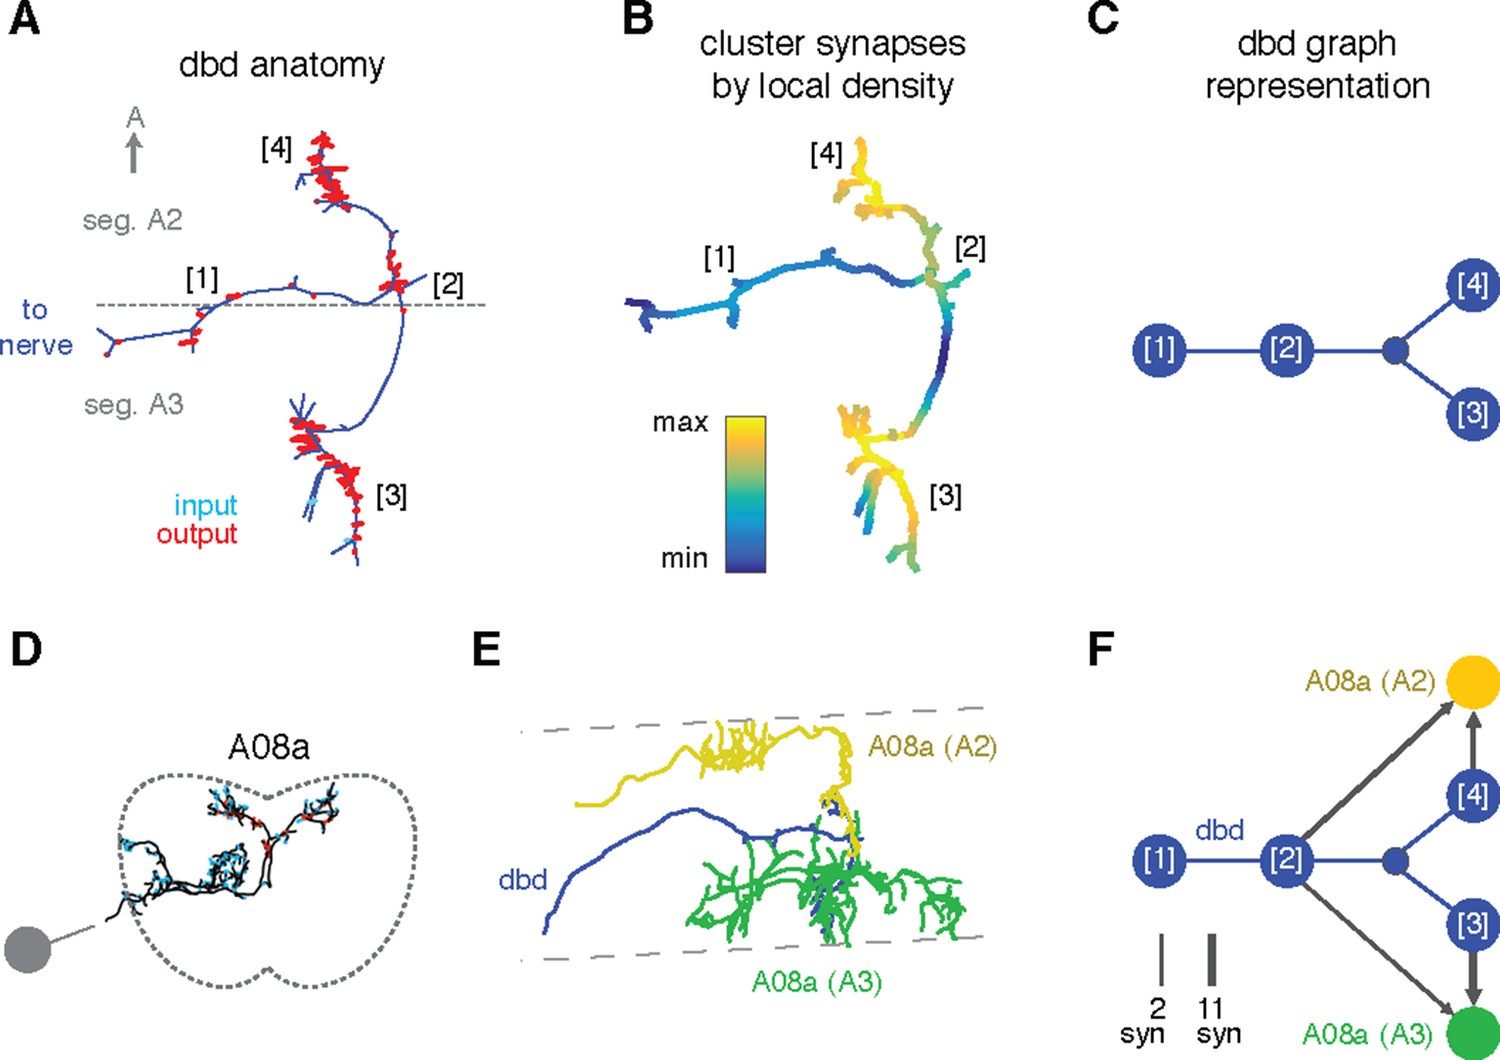
Enriching graphs with compartments defined by synaptic density.
(A) Dorsal view of the axon terminal of dbd. Dashed line indicates, segmental boundary between A2 and A3, numbers indicate clusters of synapses. (B) Synapse density mapped onto the arbor. Regions were given a weight as the sum of Gaussian functions (σ = 3 μm) of the distance to each synaptic site. Colormap is a log scale, arbitrary units. (C) Resulting neuron with four nodes, one for the basin of each density peak. Note that the topological structure between clusters (as defined by the peak location) is preserved. (D) Transverse view of interneuron A08a, shown here in segment A3. (E) Dorsal view of the overlap between dbd (blue) and the A08a in segment A3 (green) and segment A2 (yellow). (F) Network of the dbd extended by synapse clustering and A08a. Different clusters have different synaptic regions with the segmentally repeated interneuron.
Figure 9
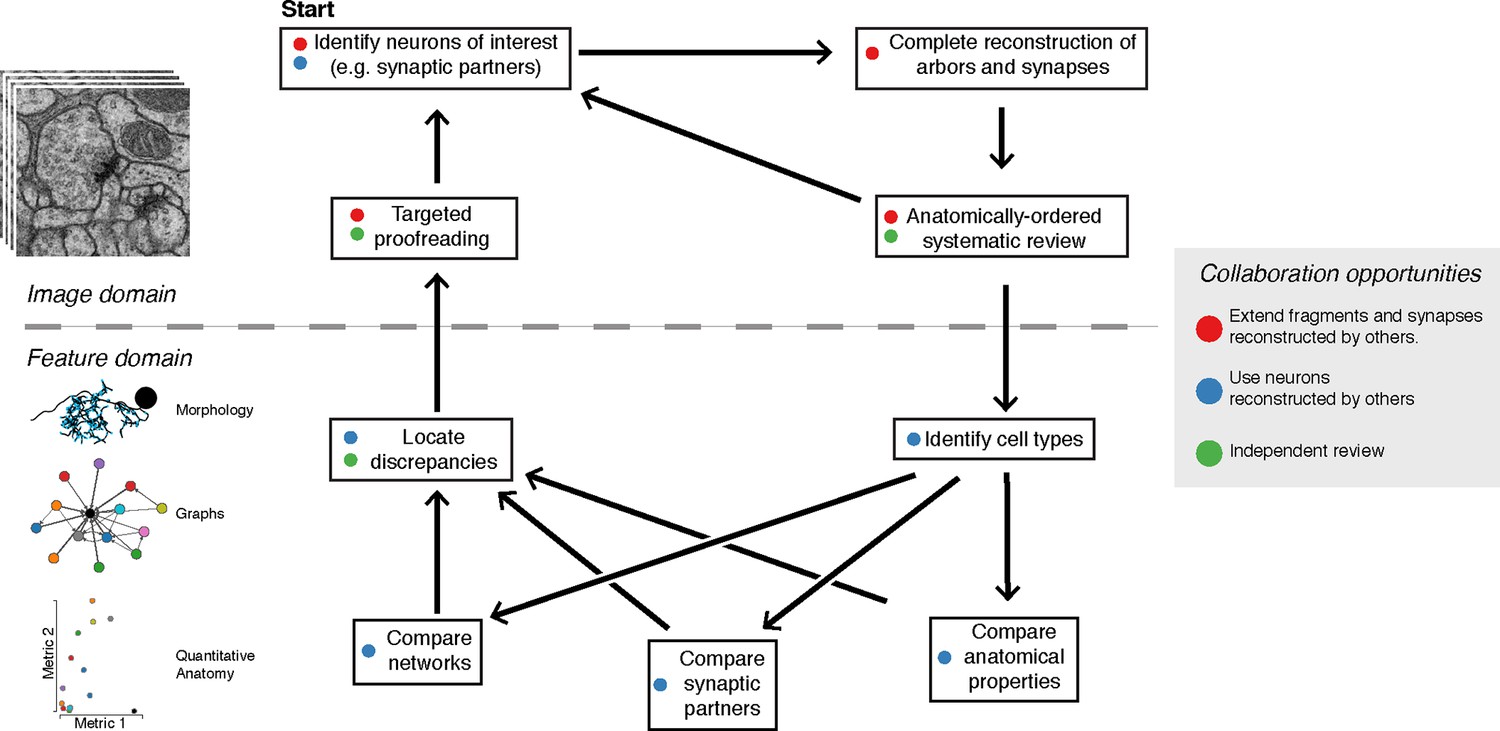
The typical reconstruction and proofreading workflow.
While reconstruction decisions occur only based on the image data, feature-based comparisons inform specific areas of interest for further proofreading. Each stage in this process can take advantage of the work of other collaborators.
Figure 10 with 1 supplement
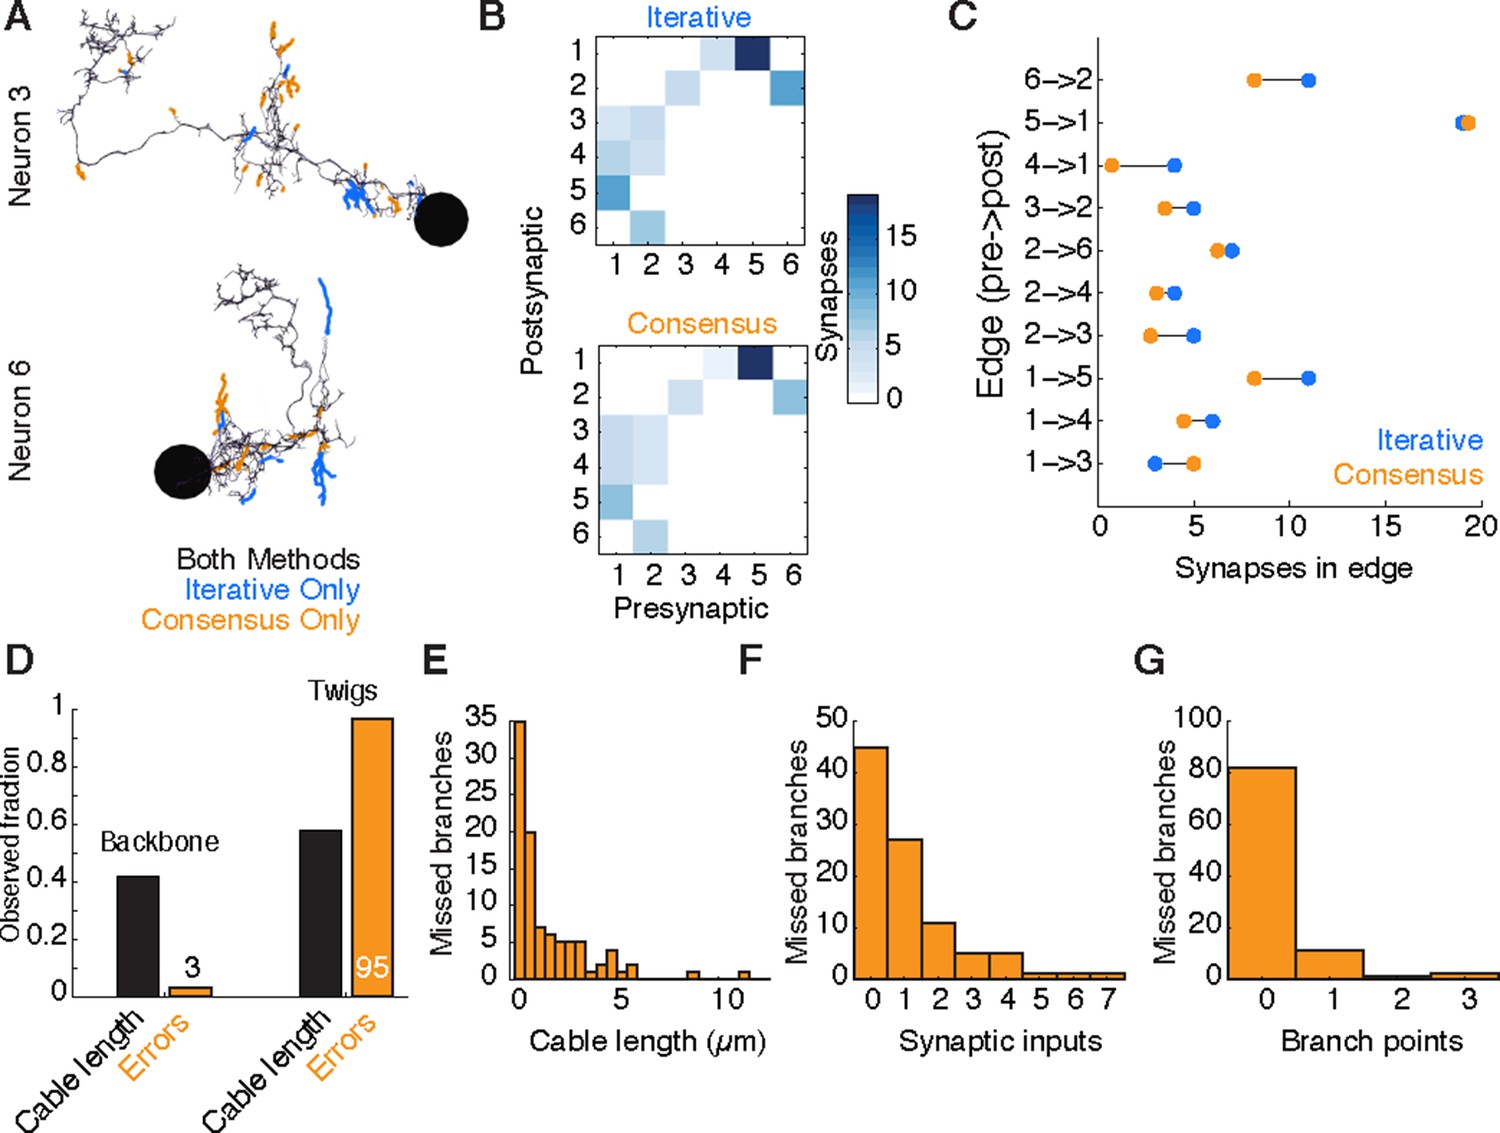
Comparison of iterative reconstruction to a consensus method.
(A) Dorsal view of two of six neurons for which we compared our iterative reconstruction method to a RESCOP-generated consensus of four independent reconstructions. Arbor found in both, dark lines; iterative only, blue; consensus only, orange. (B) The adjacency matrix produced by our iterative method has an identical set of edges as that of the consensus method, with variability only in the amount of synapses per edge. (C) The weights of each edge (the amount of synapses) are similar between methods. (D) Point errors in iterative reconstructions are not distributed equally across the cable of neuronal arbors, instead falling overwhelmingly on twigs. (E-G) Branches missed by our iterative method but observed in the consensus method are typically very small and lightly connected as seen from histograms of their (E) cable length, (F) synaptic inputs, and (G) number of branch points.
Figure 10—figure supplement 1
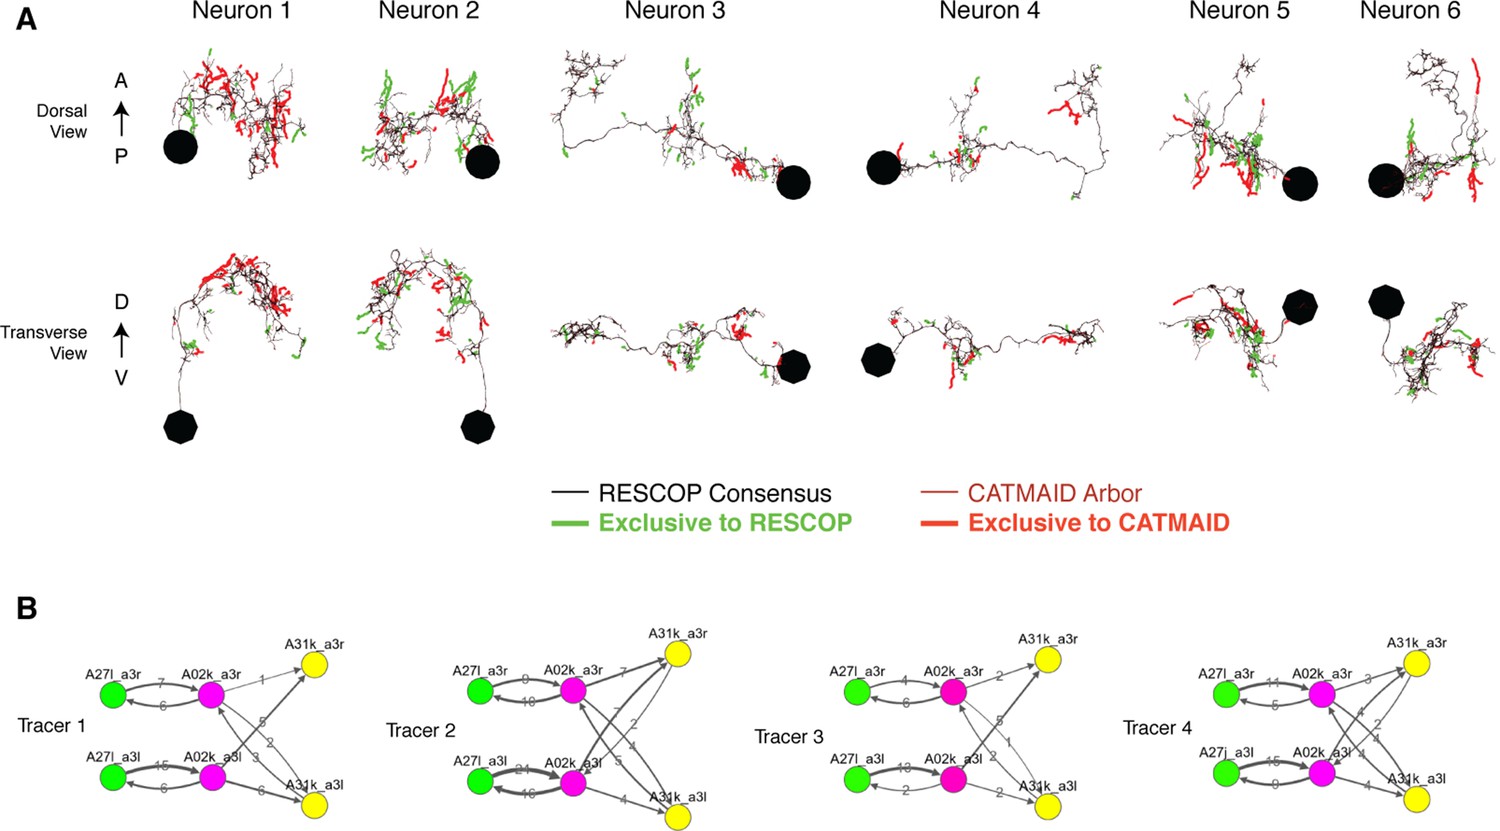
Four independent reconstructions of a six neuron circuit.
(A) Morphology of the six neurons used for the comparison. The arbors of these neurons were reconstructed independently four times, and used for generating a consensus skeleton for each arbor using the RESCOP method. Branches found only on the consensus and only in the CATMAID approaches are indicated. Neurons 1 and 2 are A02k, 3 and 4 are A31k, and 5 and 6 are A27l. (B) Graphs of each of the four independent reconstructions. Notice that all four individuals agree on almost all edges with similar amounts of synapses per edge, except in a missing edge for two tracers between A02k a3l and A31k a3r.
Figure 11 with 1 supplement
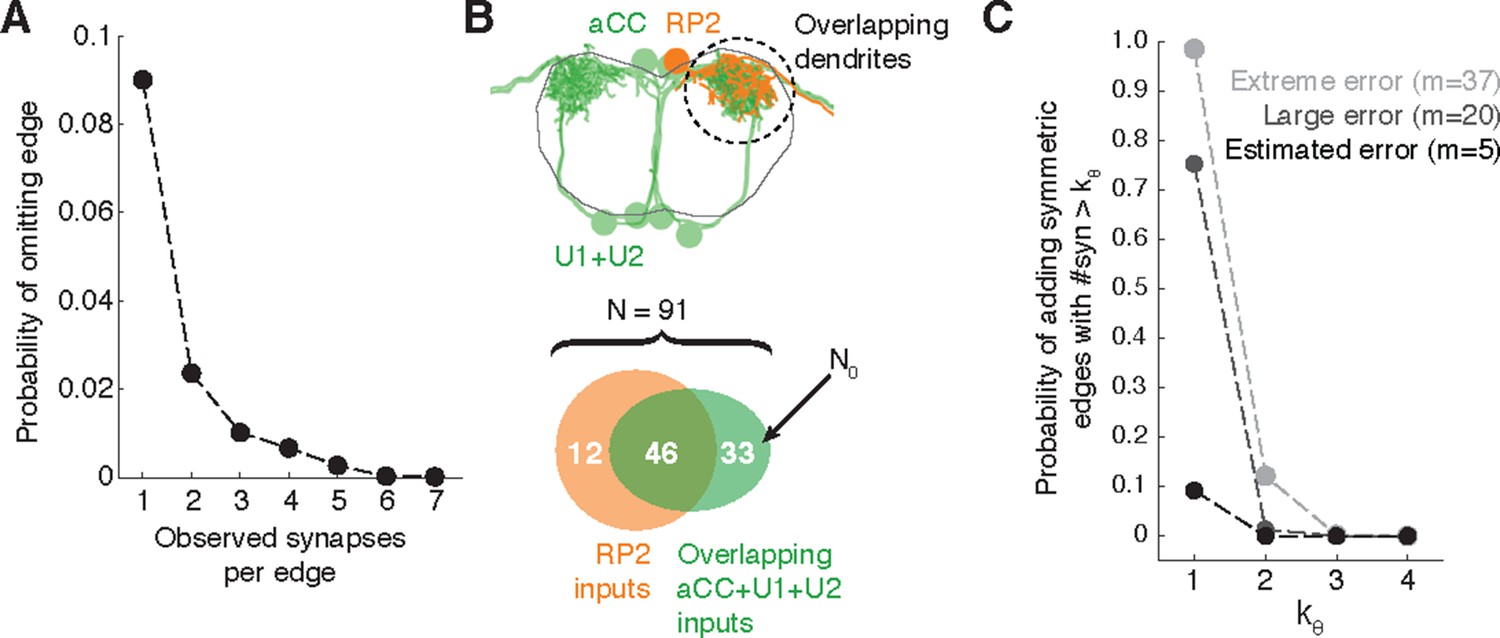
Estimating errors that affect graph topology.
(A) Estimated probability of fully omitting an edge as a function of how many synapses were on the edge based on omitting random twigs with the frequency observed in the validation data. (B) Cartoon of dendritic overlap between RP2 and aCC, U1, and U2. On average, 91 axons put at least two synapses on any motor neuron (denoted N in the false positive estimate model, see text for details), of which 33 are not connected to RP2 (denoted N0). (C) Probability that, given a pair of homologous postsynaptic neurons, introducing m false inputs randomly distributed across N presynaptic neurons yields at least one pair of false edges of kθ or more synapses each. The number of axons were estimated in b, and false input counts are shown estimated from the validation data (m = 5), as well as if they came from adding a rare but large twig (m = 20), and the largest observed twig (m = 37).
Figure 11—figure supplement 1
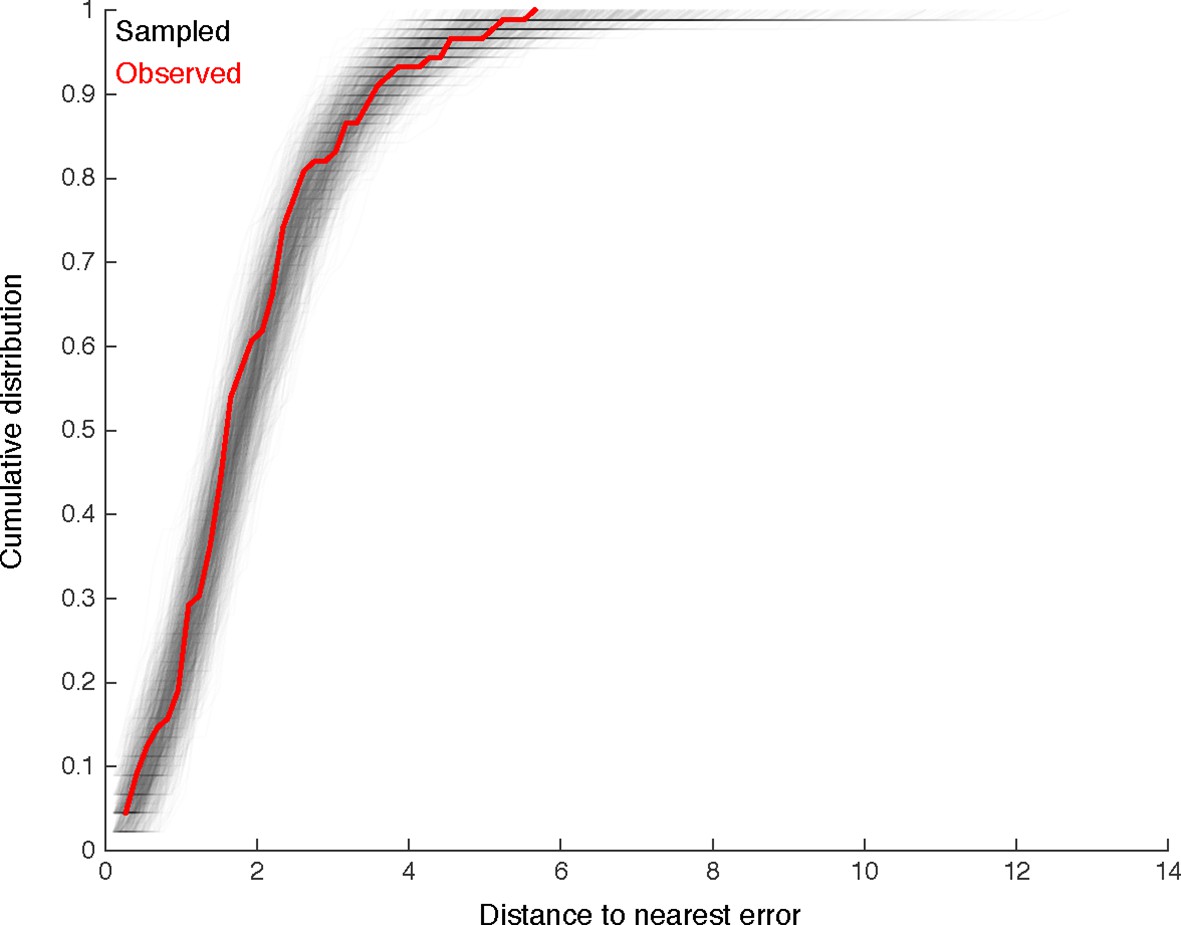
We look for clustering in the spatial distribution of errors found by comparison with multiple independent reconstructions.
For each of the 89 missed branches, we computed the distance to the nearest other error. The cumulative distribution of such distances is shown in red. We compared this distribution to that obtained by randomly sampling 89 nodes from twigs across all six neurons, disallowing two nodes from the same twig. Distributions for each of the 1000 samples are shown in gray. Only 65/1000 differ from the observed distribution in a two-sample Komologorov-Smirnov test with a p-value < 0.05. We thus conclude that spatial clustering of errors is minimal.
Figure 12
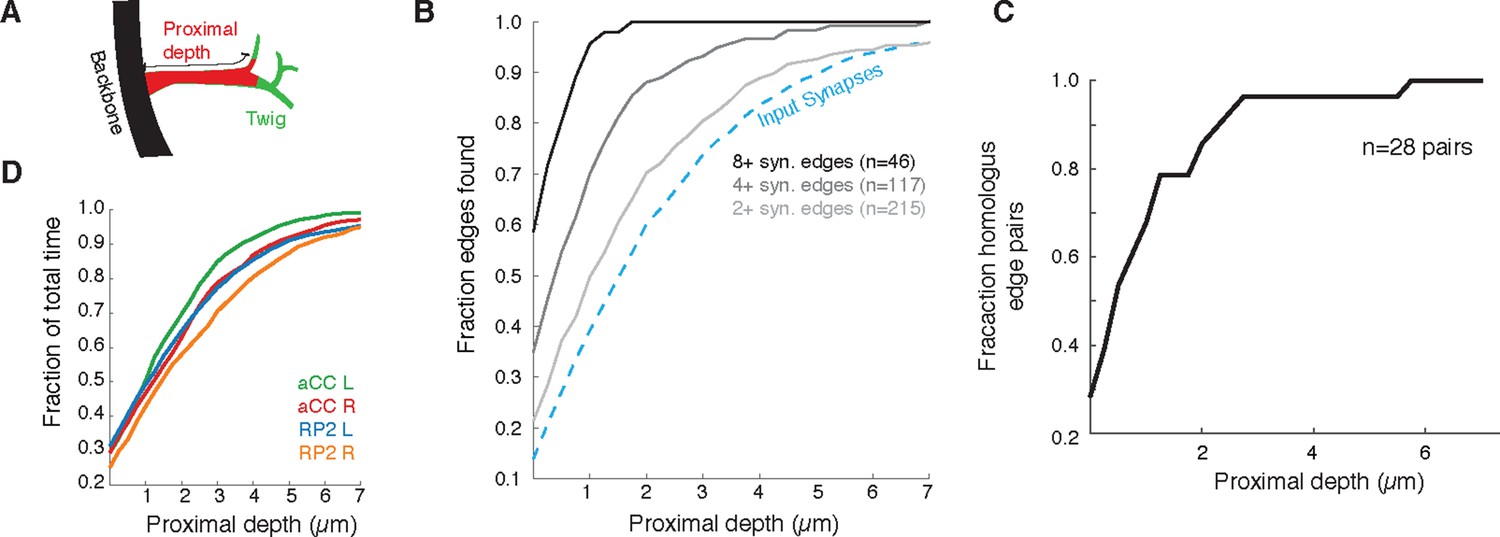
Proximal regions of twigs reflect final wiring
(A) Cartoon of the proximal depth (red) into of a twig (green) measured from from the backbone (black). (B) The fraction of two or more synapse edges onto aCC and RP2 that would be found when considering only synapses onto the backbone and twigs cropped at a maximum depth. From light to dark gray are those edges whose final measured connectivity has more than two, four, and eight synapses. Blue dashed line indicates fraction of all input synapses. (C) The fraction of pairs of homologous edges from identified neurons (N=28 edge pairs) that would be identified using synapses up to a given depth. (D) Fraction of total reconstruction time for each of the four motor neurons (see legend) as a function of cropping twigs at a maximum depth. Note that 0µm depth cropping corresponds to backbone reconstruction only.
Videos
Video 1
Rotation of the A23a neuron showing both synapses (red, presynaptic sites; blue, postsynaptic sites) and presence of microtubules (black, with microtubules; green, without microtubules).
https://doi.org/10.7554/eLife.12059.005
Video 2
Rotation of all arbors (colored skeletons) presynaptic to RP2 motor neurons (black skeletons).
(Red dots are presynaptic sites, cyan are postsynaptic sites). Dorsal is up.
Video 3
Rotation of A31k showing both synapses (red, presynaptic sites; cyan, postsynaptic sites) and mitochondria (blue dots).
Anterior is up.
Video 4
Rotation of A03a1 showing both synapses (red, presynaptic sites; cyan, postsynaptic sites) and axon/dendrite split (magenta skeleton, axon; black skeleton, dendrite).
Dorsal is up.
Video 5
Rotation of A02b showing both synapses (red, presynaptic sites; cyan, postsynaptic sites) and axon/dendrite split (orange skeleton, axon; black skeleton, dendrite).
Dorsal is up.
Additional files
-
Source code 1
Matlab code for visualizing and computing basic features of the reconstructions, as well as data fully describing the morphology and synaptic connectivity for the proprio-motor reconstructions.
- https://doi.org/10.7554/eLife.12059.030
Download links
A two-part list of links to download the article, or parts of the article, in various formats.
Downloads (link to download the article as PDF)
Open citations (links to open the citations from this article in various online reference manager services)
Cite this article (links to download the citations from this article in formats compatible with various reference manager tools)
Quantitative neuroanatomy for connectomics in Drosophila
eLife 5:e12059.
https://doi.org/10.7554/eLife.12059


