Structural and kinetic analysis of the COP9-Signalosome activation and the cullin-RING ubiquitin ligase deneddylation cycle
- University of Southern California, United States
- California Institute of Technology, United States
- California Instittute of Technology, United States
- Swiss Federal Institute of Technology, Switzerland
- University of Zurich, Switzerland
- Howard Hughes Medical Institute, California Institute of Technology, United States
Figures
Figure 1 with 3 supplements
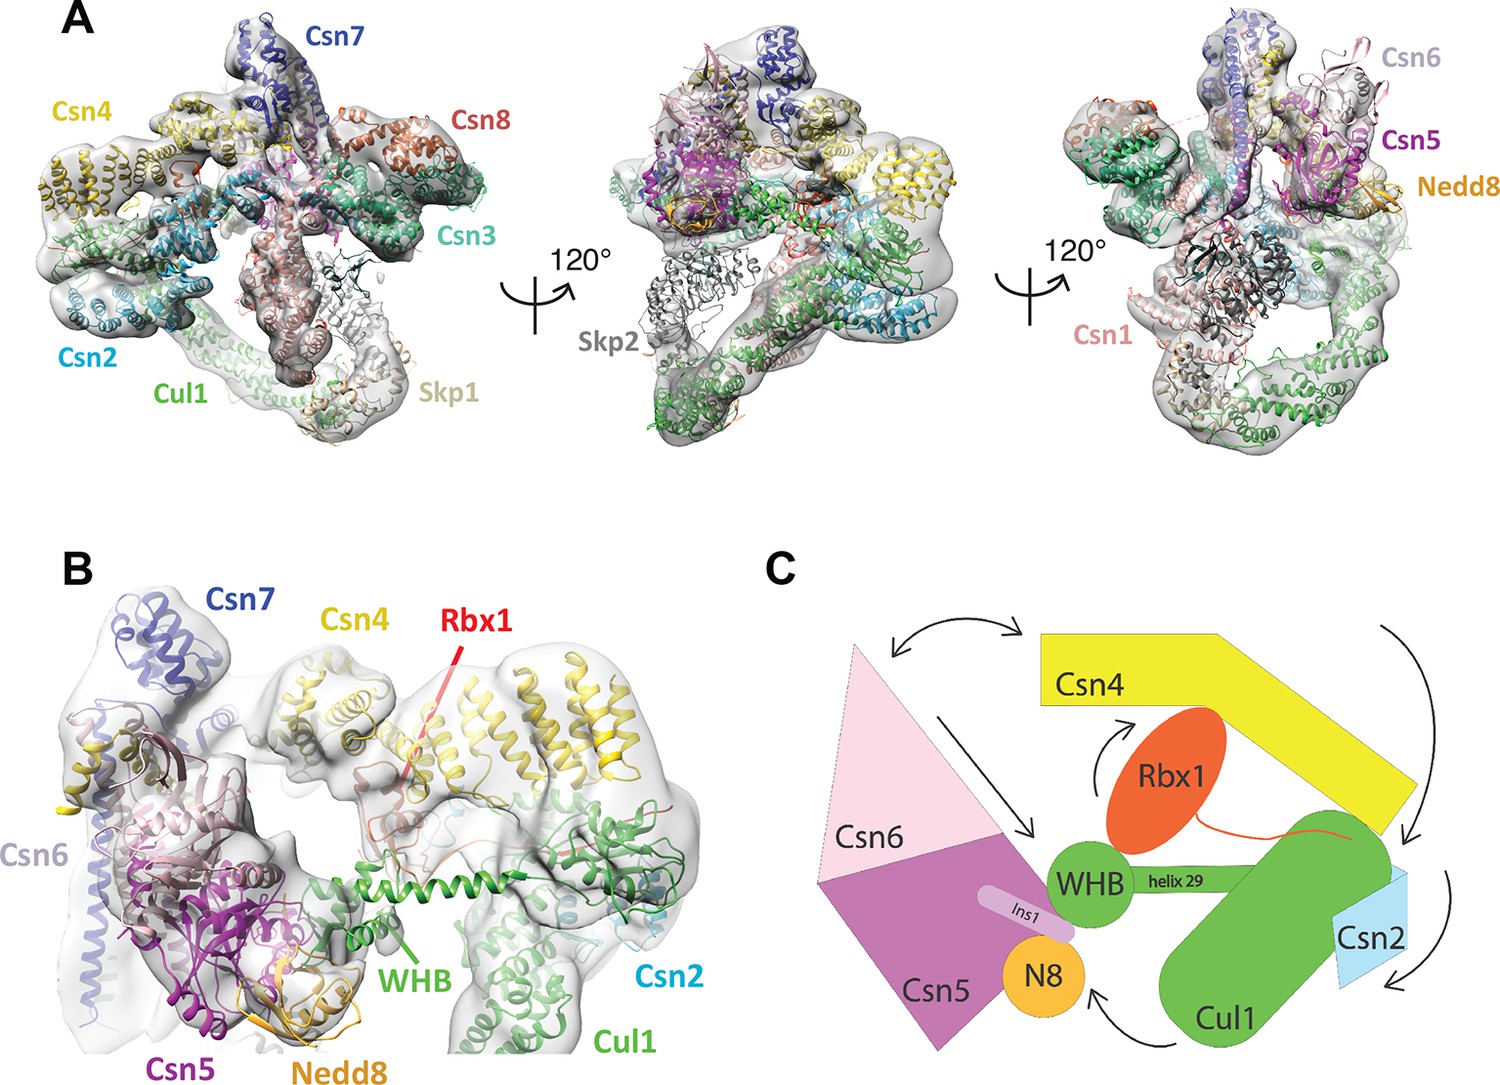
Cryo-electron microscopy of a CSN-SCF complex.
(A) Molecular model of CSN5H138A-SCF-N8Skp2/Cks1 docked into the cryo-electron density map (gray mesh). (B) Close-up view of the model, showing the observed conformations of Csn2, Csn4, Rbx1, Csn5/6 and WHB-Nedd8 and (C) a cartoon representation of the differences between the apo CSN and substrate-bound state.
Figure 1—figure supplement 1
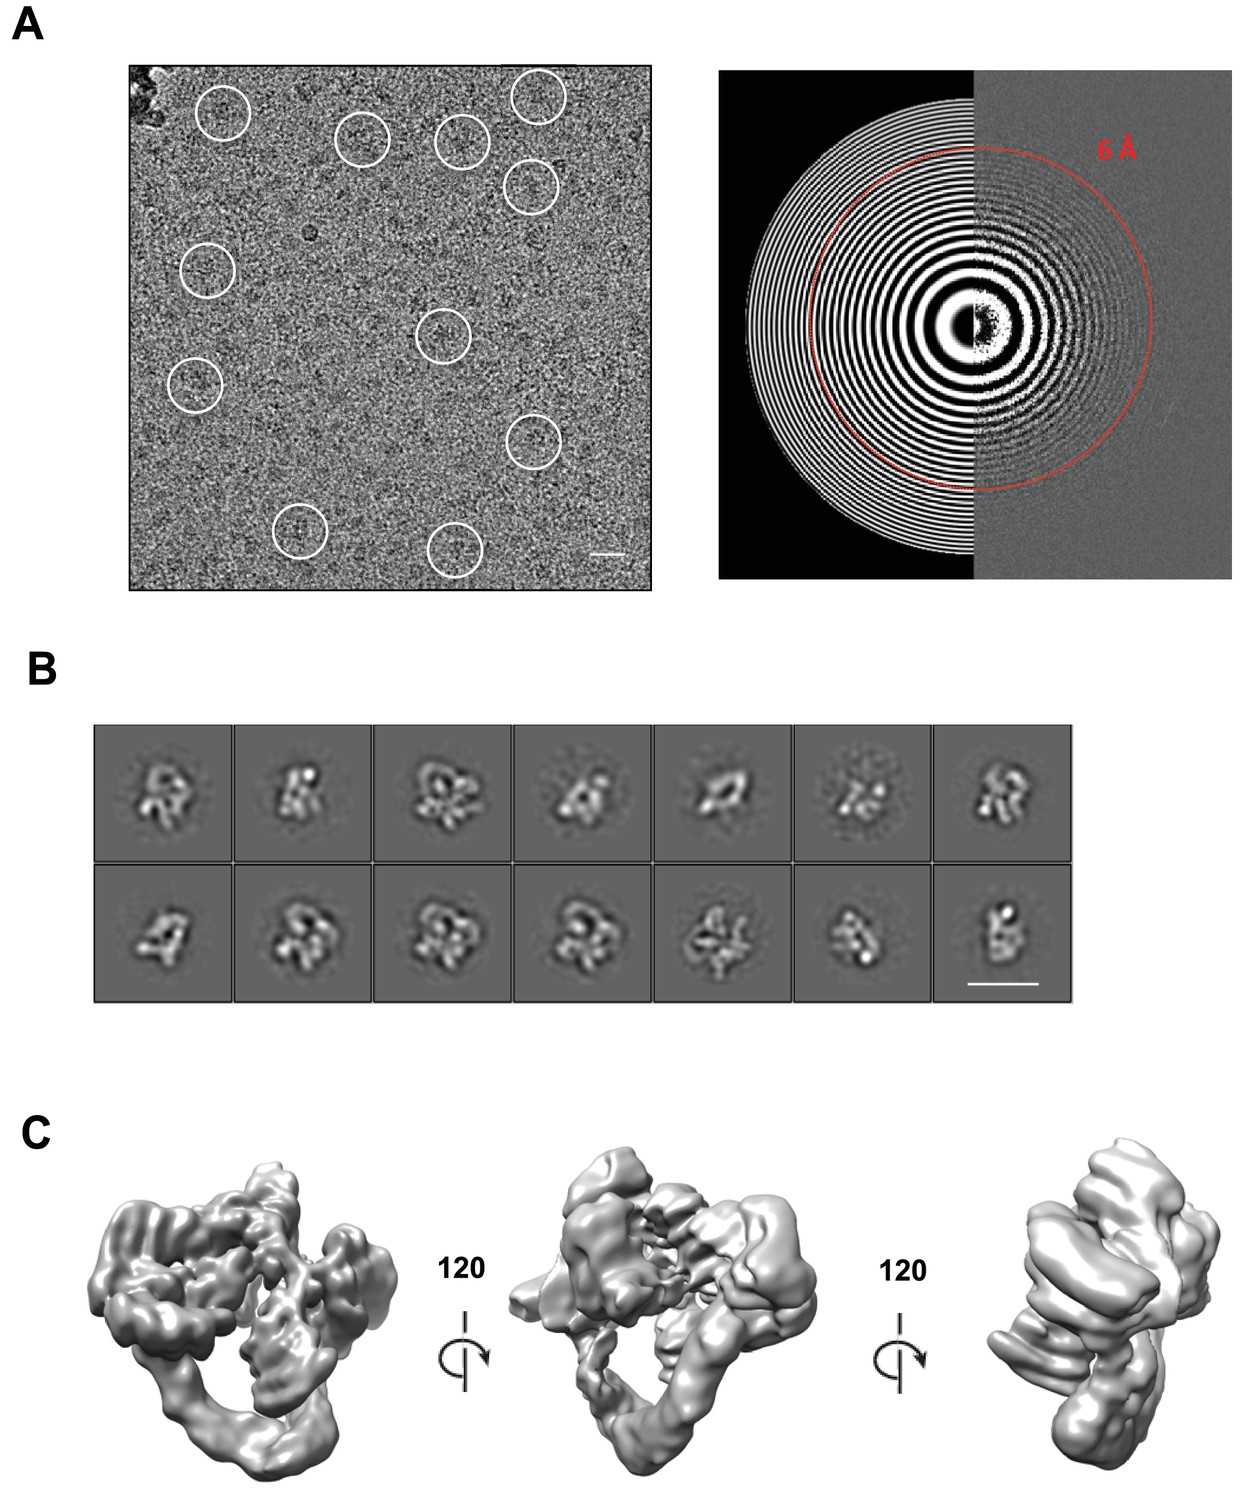
Cryo-electron microscopy and single particle analysis of a CSN5H138A-N8-SCFSkp2/Cks1 complex, part 1.
(A) A representative cryo-electron micrograph of a CSN5H138A-N8-SCFSkp2/Cks1 complex with some single molecular views indicated by white circles (left) and a power spectrum indicating Thon rings reaching 6 Å (right). Scale bar is 200 Å. (B) Representative two-dimensional class averages from the curated dataset, used for the subsequent analysis. Scale bar is as in (A). (C) Surface views of the final, post-processed cryo-electron map.
Figure 1—figure supplement 2
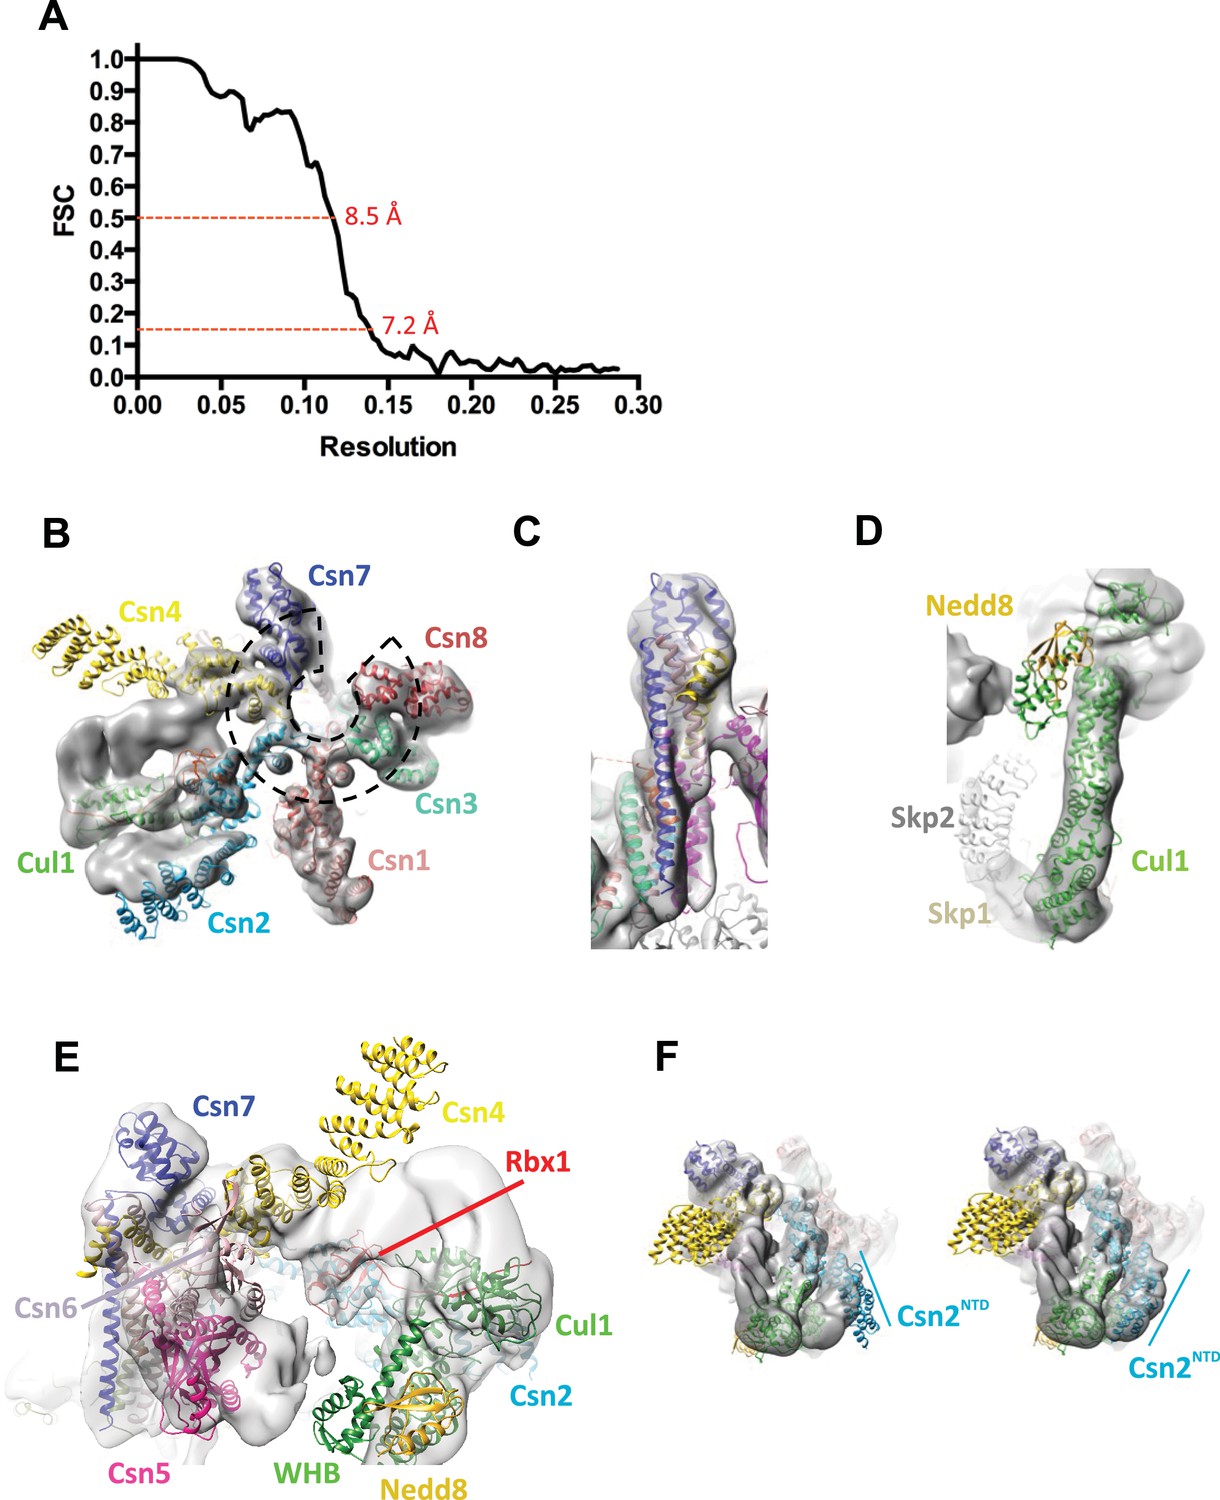
Cryo-electron microscopy and single particle analysis of a CSN5H138A-N8-SCFSkp2/Cks1 complex, part 2.
(A) Resolution estimate according to the FSC criteria of 0.143 and 0.5. (B) Fit of the PCI-domain containing CSN subunits in the cryo-electron density map. Csn1,3,7, and 8 match the density very well but the N-terminal domains of Csn2 and Csn4 do not, but their winged-helix domains fit well. The horseshoe arrangement of the six winged-helix domains is indicated with a dotted black line. (C) All the C-terminal helices of the CSN subunits match well the electron density map. (D) Fit of SCF in the electron density map. (E) Same view as in Figure 1B but prior to flexible docking of the N-terminal domains of Csn2 and Csn4, the MPN domains of Csn5&6, the WHB domain of Cul1, and Nedd8. (F) Movement of the N-terminus of Csn2 from its crystallographically-determined position (left) into the EM density map (right).
Figure 1—figure supplement 3
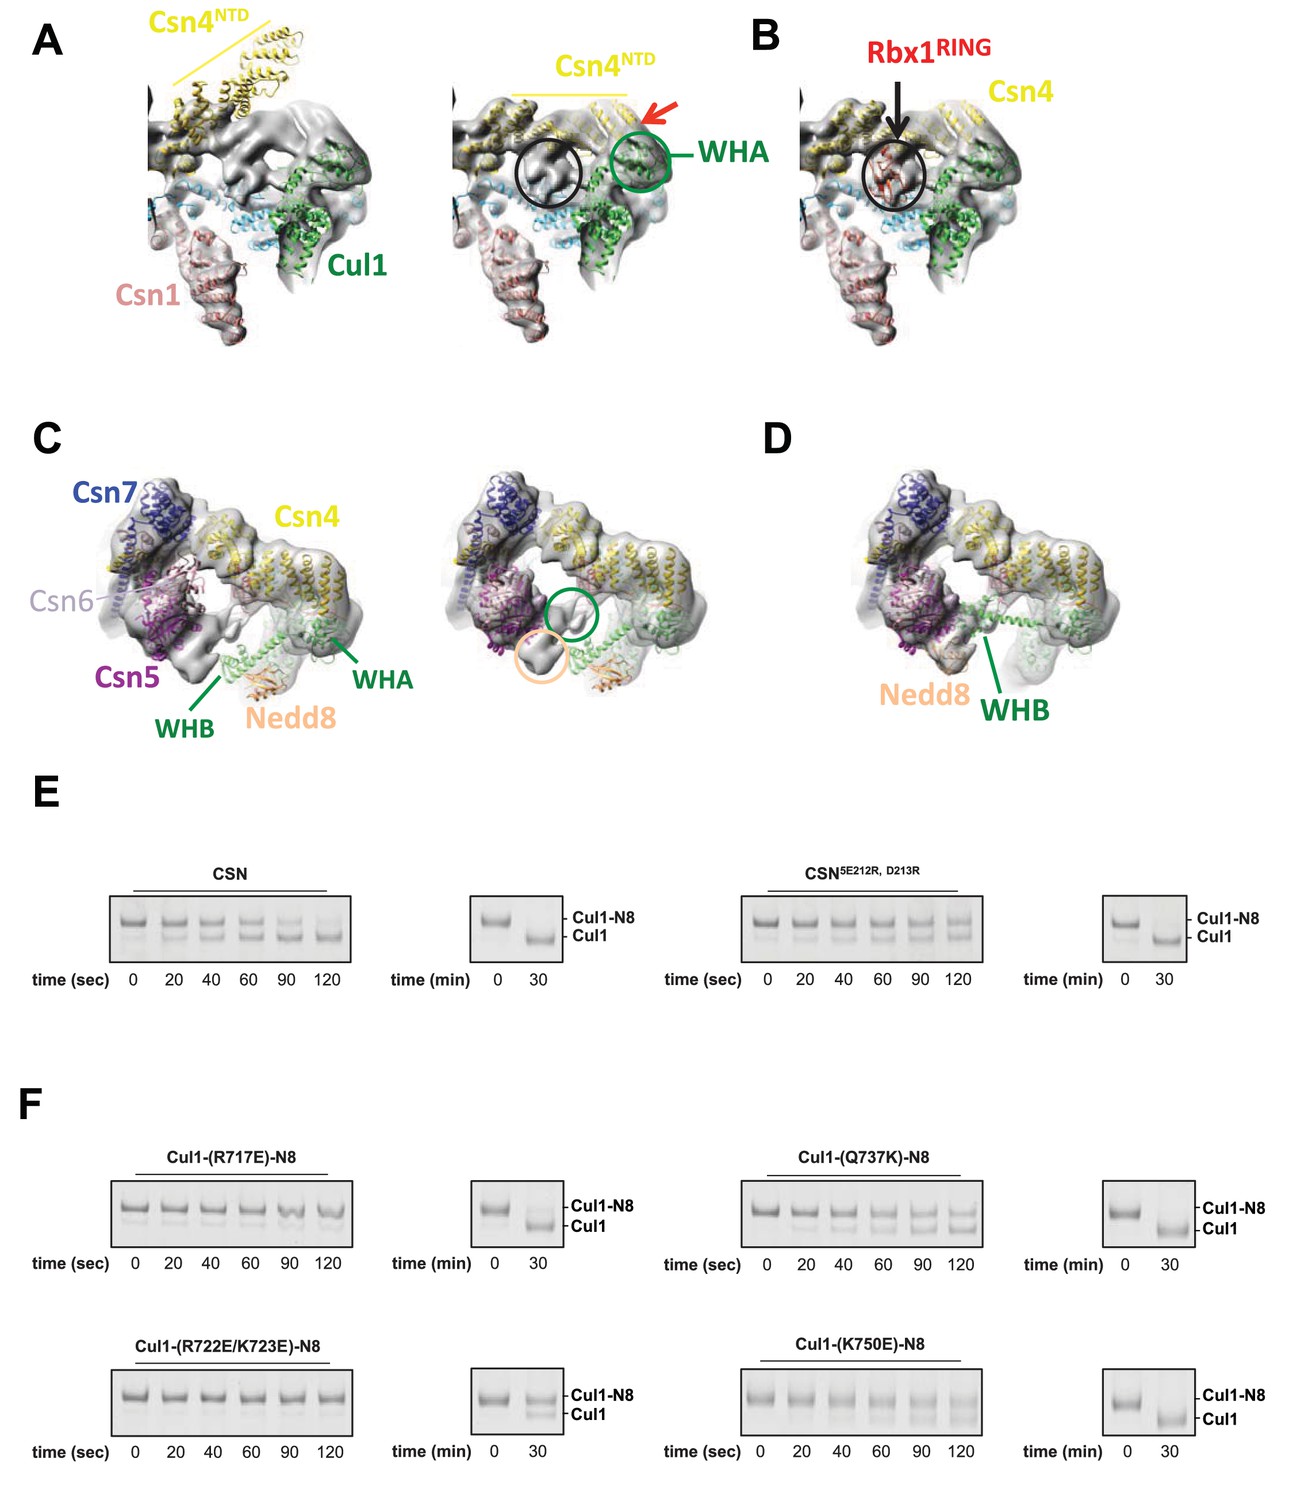
Cryo-electron microscopy and single particle analysis of a CSN5H138A-N8-SCFSkp2/Cks1 complex, part 3.
(A) Movement of the N-terminus of Csn4 from its crystallographically-determined position (left) into the EM density map (right). The two N-terminal helical repeats of Csn4, red arrow, are in close proximity to the WHA domain of Cul1 (green circle). (B) Localization of the RING domain of Rbx1. The unfilled density that is indicated by a black ellipse in the right-hand panel of Figure 1—figure supplement 3A accommodates Rbx1 (shown in red). The helices of Csn4 in close proximity to the RING domain of Rbx1 are indicated by a black arrow. (C) Re-localization of Csn5/6. Comparing the left and right panels, Csn5/6 move leftward to occupy unfilled density. The tan and green circles below Csn5/6 indicate densities that are occupied by Nedd8 and the WHB domain, as depicted in (D). (E, F) Deneddylation assays with (E) wild type Cul1-N8/Rbx1 and indicated CSN variants and (F) wild type CSN and mutant Cul1 variants. Note that all Cul1 constructs have an uncleaved C-terminal sortase tag, which is the reason for slower deneddylation of wild type Cul1-N8/Rbx1 by wild type CSN relative to the kinetics reported elsewhere in this work.
Figure 2 with 2 supplements
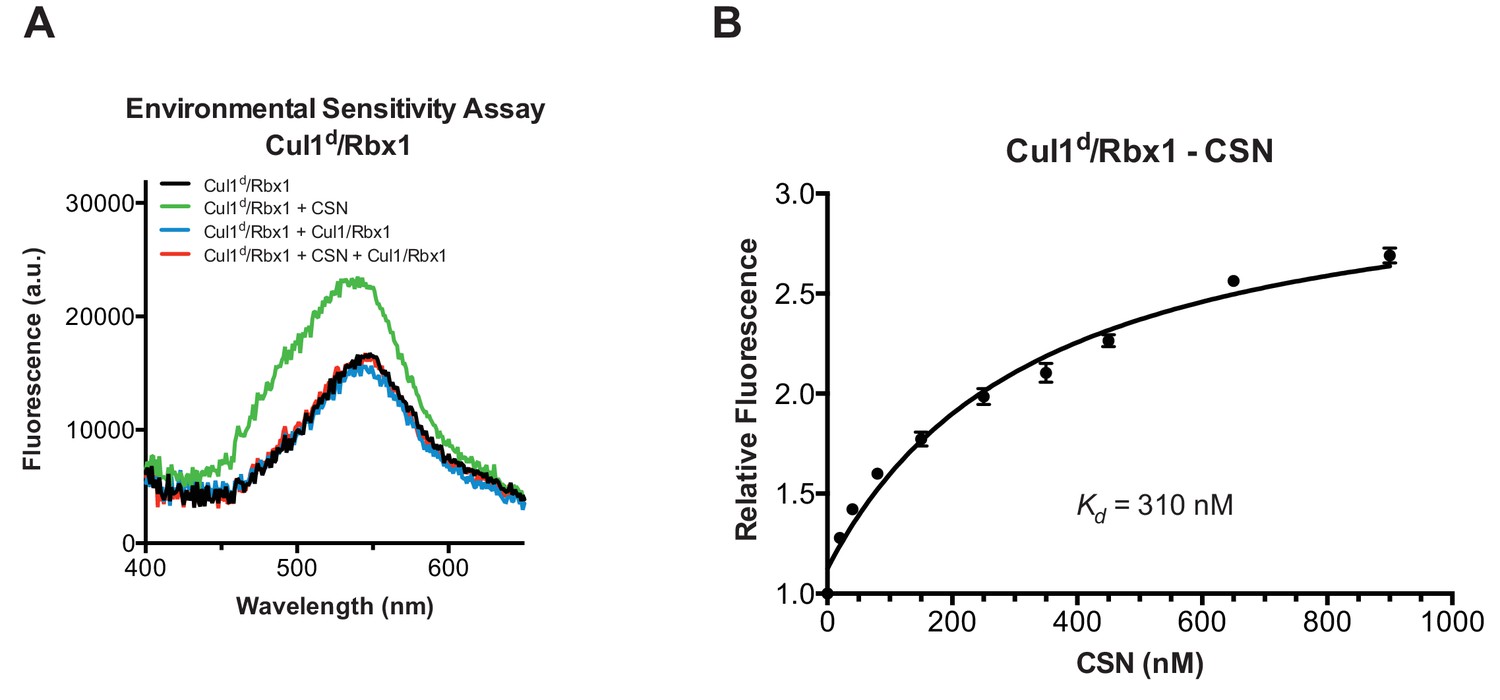
Development and validation of a binding assay for CSN–Cul1/Rbx1 interaction.
(A) Equilibrium binding of CSN to Cul1d/Rbx1 and competition by unlabeled Cul1/Rbx1. The indicated proteins were mixed and allowed to equilibrate prior to determination of dansyl fluorescence in a fluorometer. Note that Cul1/Rbx1 blocks the fluorescence enhancement caused by CSN. CSN, Cul1d/Rbx1, and Cul1/Rbx1 were used at 350, 30, and 4000 nM, respectively. (B) Equilibrium binding of CSN to Cul1d/Rbx1. Cul1d/Rbx1 (30 nM) was mixed with increasing concentrations of CSN and the proteins were allowed to equilibrate prior to determining the change in dansyl fluorescence in triplicate samples. Error bars represent standard deviation.
Figure 2—figure supplement 1
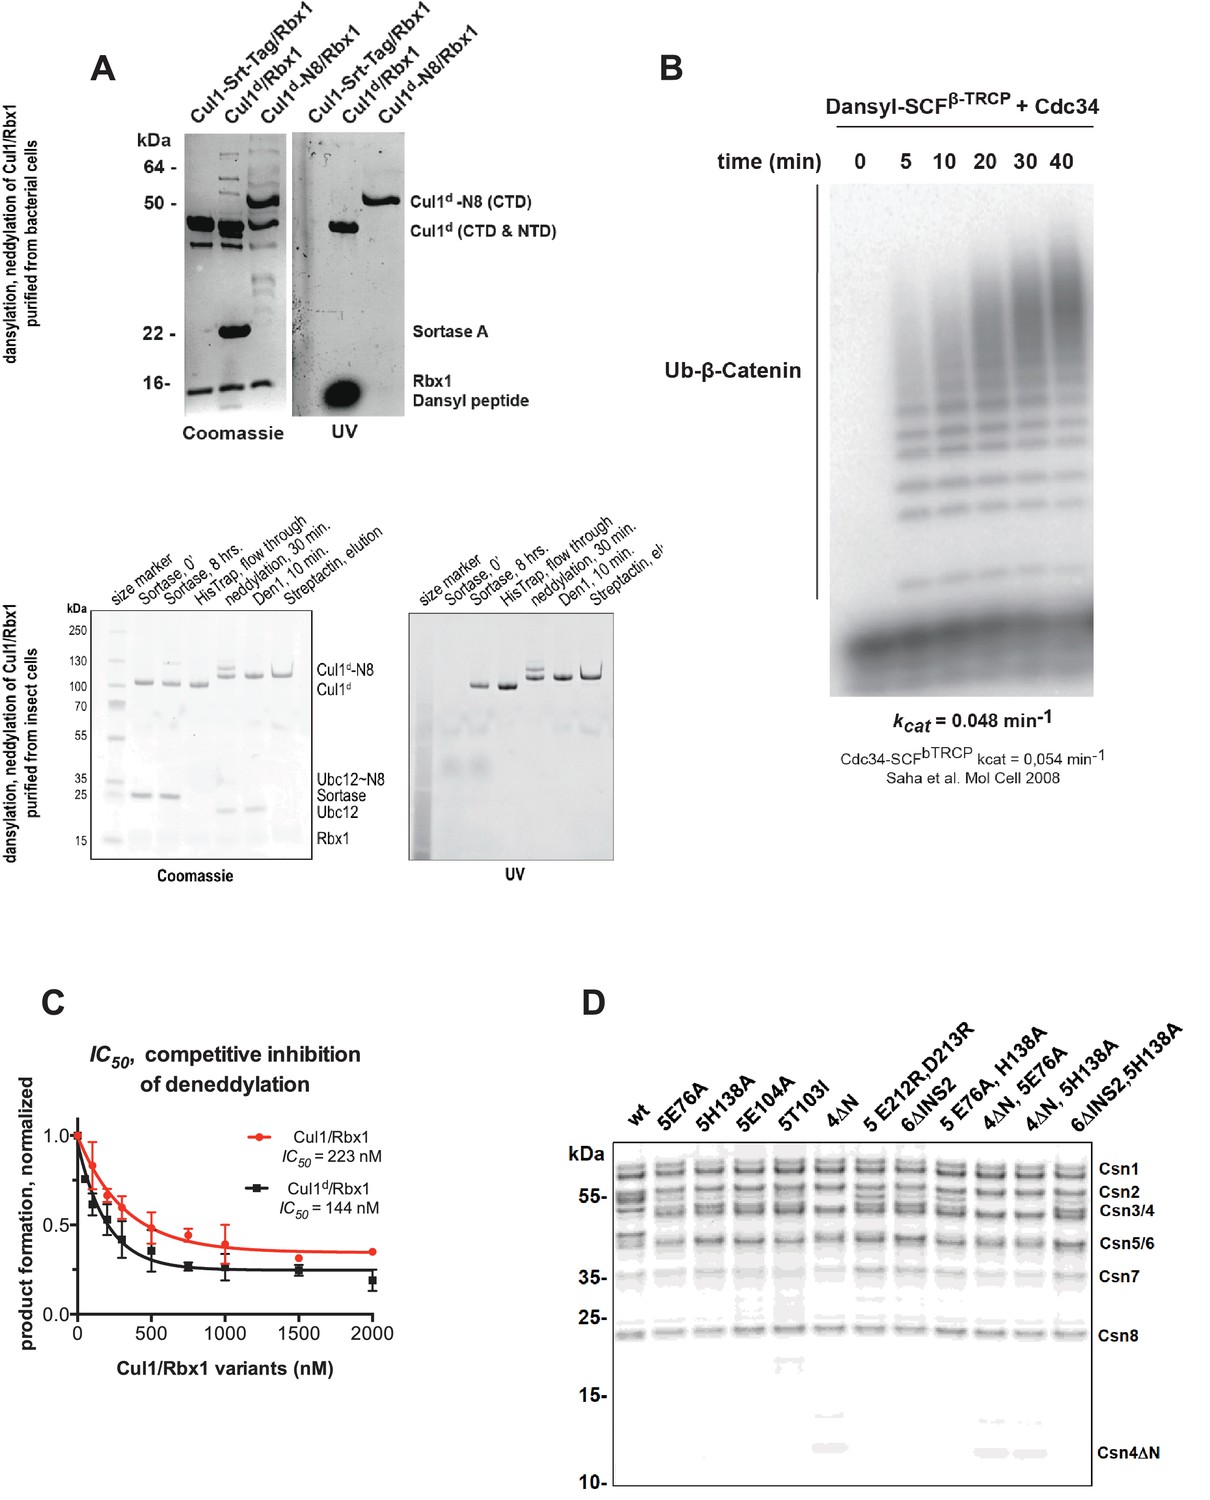
Supporting data for development and validation of CSN–Cul1d/Rbx1 binding assay, part 1.
(A) Dansylation of Cul1/Rbx1 constructs. Upper panel: dansylation of bacterially expressed and purified Cul1/Rbx1. Lower panel: dansylation of Cul1/Rbx1 expressed and purified from insect cells. For details, see Materials and Methods. (B) Ubiquitination of 32P-labeled β-catenin substrate peptide by dansylated SCFβ-TrCP was monitored as described (Saha and Deshaies, 2008). The kcat measured here (0.048 min-1) compares favorably with that previously determined for wild type unmodified SCF (0.054 min-1) (Saha and Deshaies, 2008). (C) IC50 study of the inhibitory effects of unlabeled (red) or dansylated (black) product. Cul1/Rbx1 and Cul1d/Rbx1 were separately titrated into a deneddylation reactions containing 50 nM Cul1-[32P]N8/Rbx1 substrate and 0.5 nM CSN, and the resulting reaction rate was measured. (D) CSN preparations used in this study. 600 ng of each sample were fractionated by SDS-PAGE and stained with SYPRO Ruby.
Figure 2—figure supplement 2

Supporting data for development and validation of CSN–Cul1d/Rbx1 binding assay, part 2.
(A) IC50 for competitive inhibition of CSN-Cul1d/Rbx1 complex formation by unlabeled Cul1/Rbx1 (~390 nM) agrees with the Kd measured for binding of Cul1d/Rbx1 to CSN (310 nM). (B) Equilibrium binding of 100 nM CSN to 50 nM Cul1d/Rbx1 and competition by 500 nM Cand1. The indicated proteins were mixed and allowed to equilibrate prior to determination of dansyl fluorescence. (C–E) Free Nedd8 and F-box box proteins do not appreciably change affinity of Cul1d/Rbx1 for CSN. Same as Figure 2C, except that either 5 µM free Nedd8 (C), 100 nM Skp2/Skp1 (D) or 100 nM Fbxw7/Skp1 (E) was included in the binding reaction. All binding and activity measurements reported in this legend were carried out in triplicate and error bars represent standard deviation.
Figure 3 with 2 supplements

Quantitative determination of enzyme–substrate binding affinities for wild type and mutant proteins.
(A) Tight binding of CSN5H138A to substrate. Cul1d-N8/Rbx1 and CSN5H138A were mixed and allowed to equilibrate prior to determining the change in dansyl fluorescence. (B) Summary of Kd measurements for the indicated CSN complexes tested against unmodified Cul1d/Rbx1, Nedd8-conjugated Cul1d-N8/Rbx1 or Cul1d-N8/Rbx1∆RING ligand. Boxes shaded in gray indicate combinations that could not be analyzed due to deneddylation during the binding reaction. For some complexes that bound weakly it was not feasible to titrate to saturation and so a lower boundary for Kd is indicated. N.D., not determined. *, due to the configuration of our assay, extremely low Kd values cannot be reliably determined. (C) Summary of kon and koff measurements for the indicated CSN complexes tested against Cul1d/Rbx1 or Cul1d-N8/Rbx1. Each reported koff is the mean of at least 8 replicates. For comparison, koff values calculated from kon and Kd measurements are also shown. For cases where kon was not measured (marked with asterisks), we assumed a value that was the average (1.83 x 10⁷ M-1 s-1) of the three measured kon values. Boxes shaded in gray indicate combinations that could not be analyzed due to deneddylation upon complex formation. N.D., not determined.
Figure 3—figure supplement 1
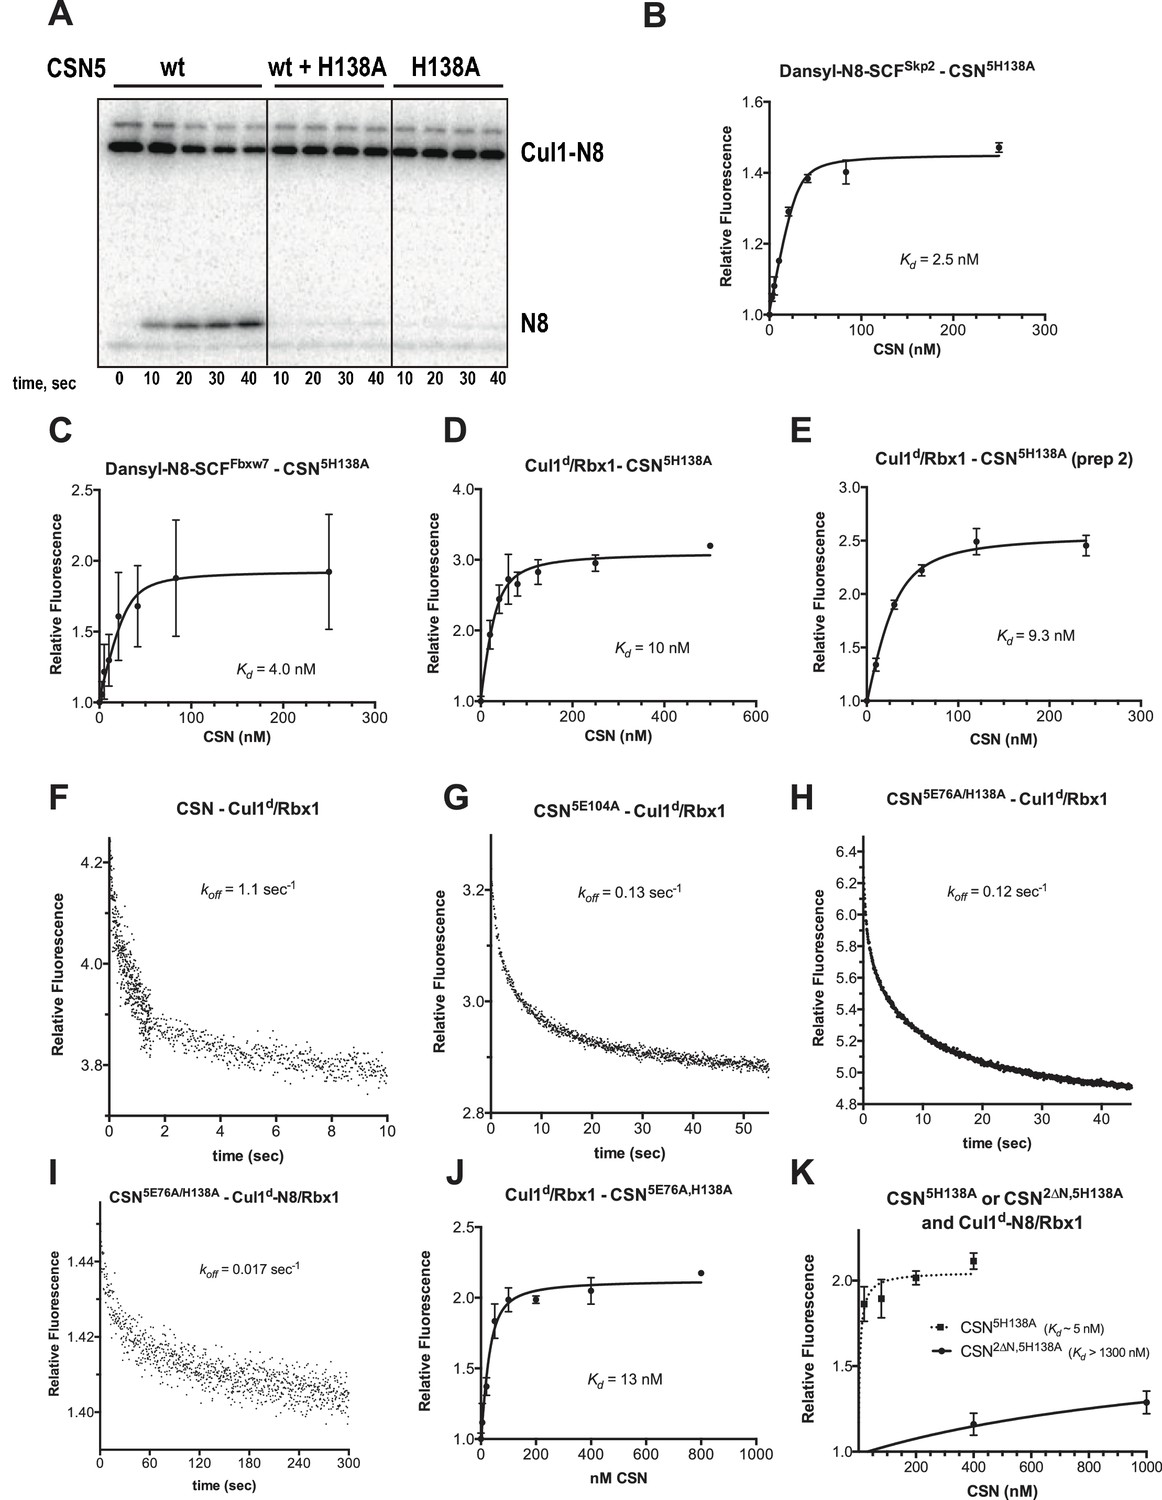
Supporting experiments and titration curves for binding data in Figure 3B–C, part 1.
(A) CSN5H138A is inactive and is a dominant-negative inhibitor of deneddylation. CSN, CSN5H138A, and substrate were used at 2 nM, 100 nM, and 75 nM, respectively. For reactions containing CSN and CSN5H138A, mutant enzyme was preincubated with substrate for 30 sec prior to initiating time-course by adding CSN. (B-E): The indicated proteins were mixed and allowed to equilibrate prior to determining the change in dansyl fluorescence. (B) CSN5H138A and dansylated, Nedd8-conjugated SCFSkp2. (C) CSN5H138A and dansylated, Nedd8-conjugated SCFFbxw7. Note that addition of Fbxw7–Skp1 greatly increased the variability in the measurement for unknown reasons. (D) CSN5H138A (first prep) and Cul1d/Rbx1, (E) CSN5H138A (second prep) and Cul1d/Rbx1, (F-I): The indicated CSN complexes were preincubated with Cul1d/Rbx1 for 10 min, followed by addition of unlabeled Cul1/Rbx1 chase and measurement of the decay in dansyl fluorescence over time. Final protein concentrations are listed for each experiment. (F) CSN (2000 nM), Cul1d/Rbx1 (200 nM), and Cul1/Rbx1 (3000 nM), (G) CSN5E104A (600 nM), Cul1d/Rbx1 (200 nM), and Cul1/Rbx1 (3000 nM), (H) CSN5E76A,5H138A (400 nM), Cul1d/Rbx1 (200 nM), and Cul1/Rbx1 (3000 nM), (I) CSN5E76A,5H138A (200 nM), Cul1d-N8/Rbx1 (100 nM), and Cul1/Rbx1 (1500 nM), (J–K): The indicated proteins were mixed and allowed to equilibrate prior to determining the change in dansyl fluorescence. (J) CSN5E76A, 5H138A and Cul1d/Rbx1, (K) CSN5H138A or CSN2∆N,5H138A and Cul1d-N8/Rbx1. All measurements in panels B–E and J–K were carried out in triplicate and error bars represent standard deviation.
Figure 3—figure supplement 2
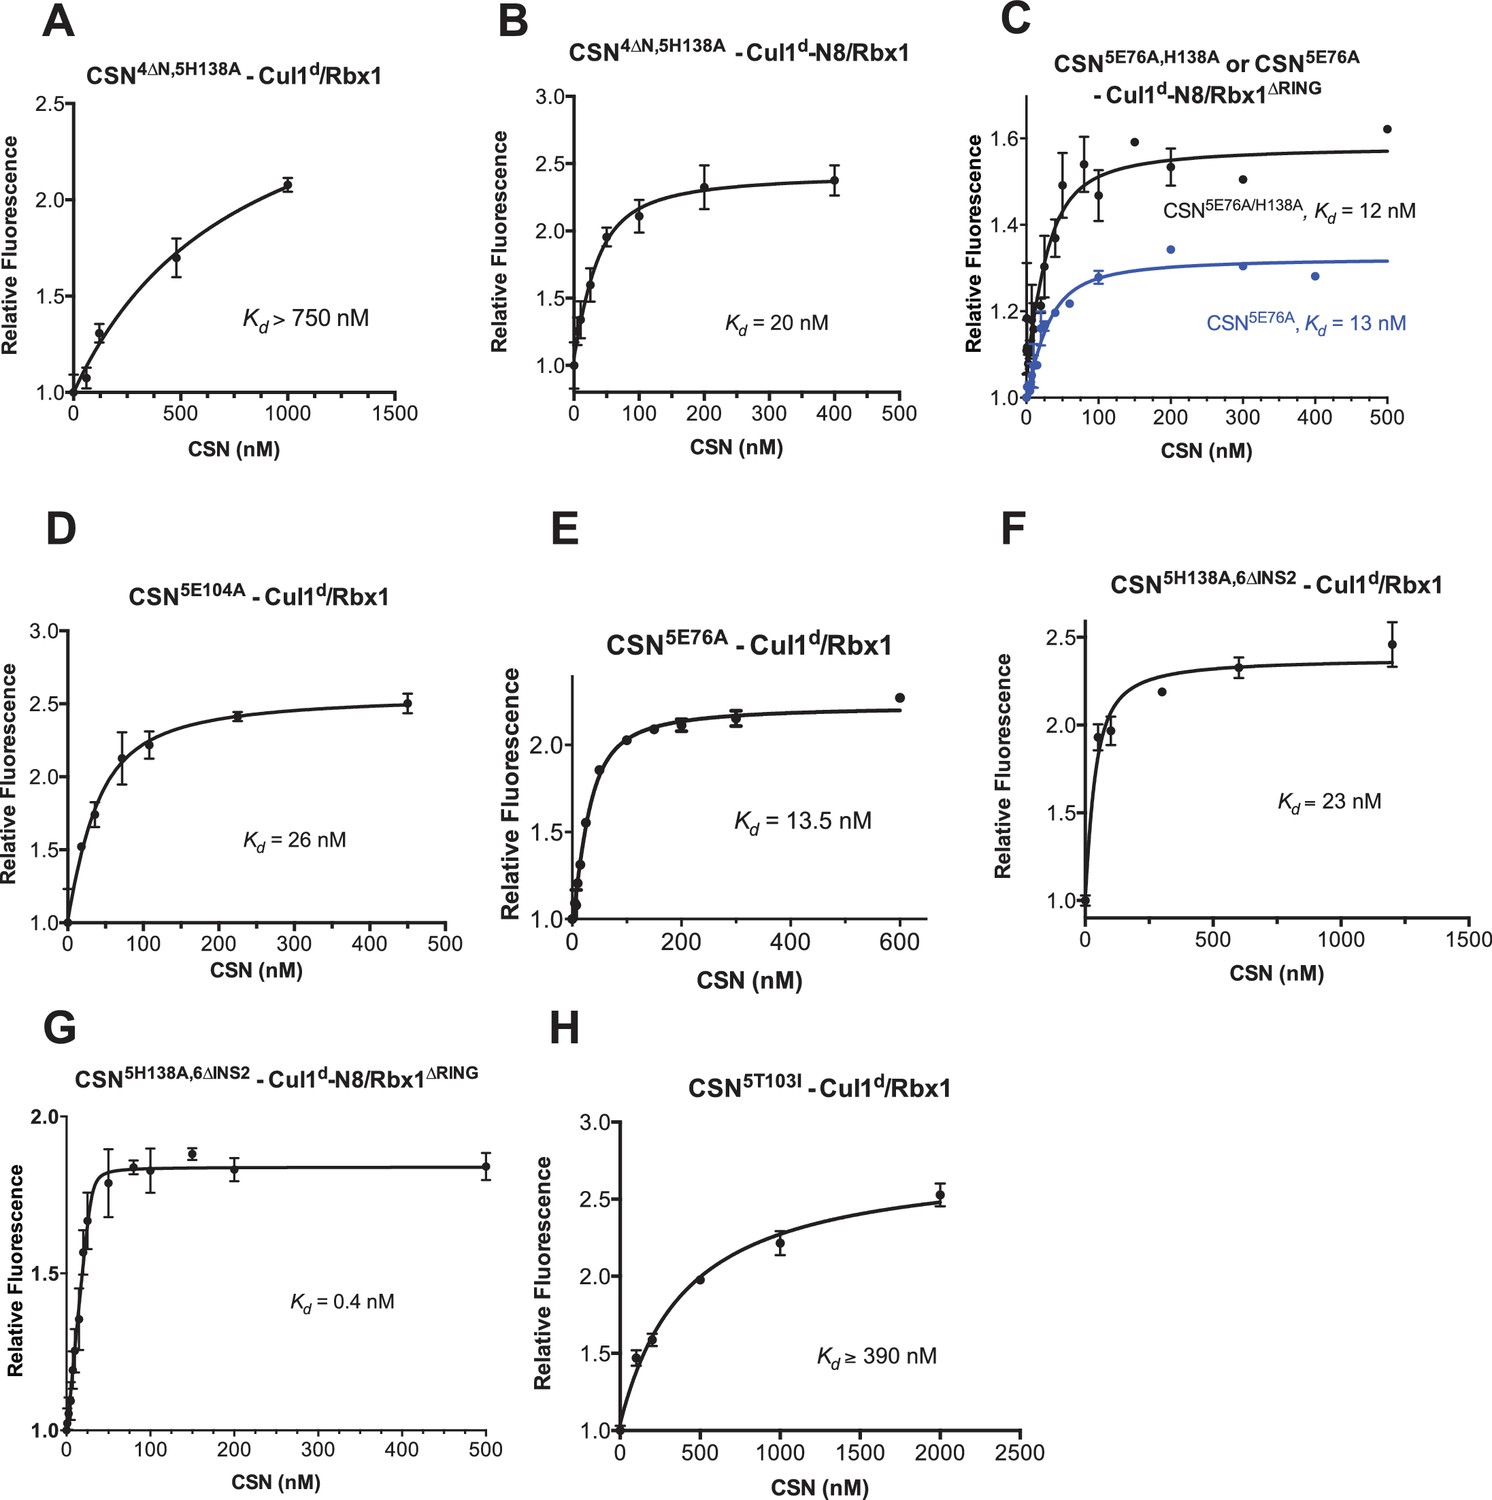
Supporting experiments and titration curves for binding data in Figure 3B-C, part 2.
(A–H): The indicated proteins were mixed and allowed to equilibrate prior to determining the change in dansyl fluorescence. (A) CSN4∆N,5H138A and Cul1d/Rbx1, (B) CSN4∆N,5H138A and Cul1d-N8/Rbx1, (C) CSN5E76A or CSN5E76A,5H138A and Cul1d-N8/Rbx1∆RING, (D) CSN5E104A and Cul1d/Rbx1, (E) CSN5E76A and Cul1d/Rbx1, (F) CSN5H138A,6∆INS2 and Cul1d/Rbx1, (G) CSN5H138A,6∆INS2 and Cul1d-N8/Rbx1∆RING, (H) CSN5T103I and Cul1d/Rbx1. All measurements in panels A–D and F–H were carried out in triplicate and error bars represent standard deviation. The measurement in panel E was performed in duplicates but the experiment was repeated on three independent occasions, obtaining similar results. Several of these results were independently confirmed in Zurich and Pasadena including panels Figure 3—figure supplement 1J, and panels Figure 3—figure supplement 2B,D,E and F.
Figure 4 with 1 supplement
The N-terminal domains of Csn2 and Csn4 and the RING domain of Rbx1 play key roles in substrate binding and deneddylation.
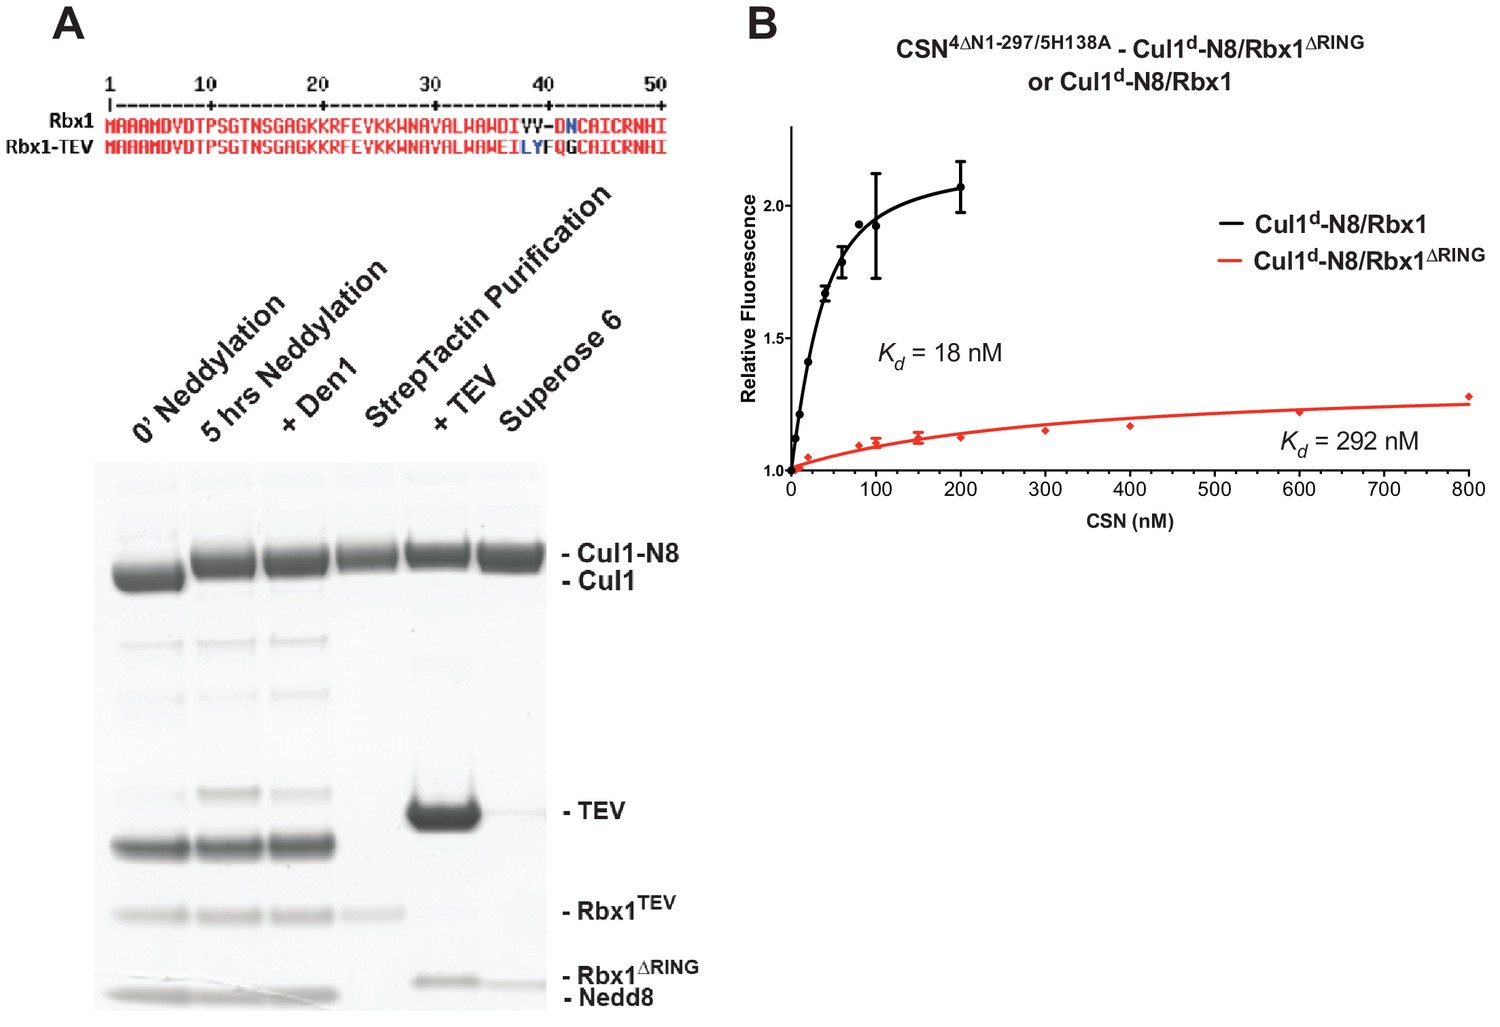
(A) Generation of Cul1-N8/Rbx1∆RING. Top: a TEV protease site was engineered between the N-terminal β-strand and the RING domain of Rbx1 as indicated. Only the first 50 amino acids of Rbx1 are shown. Bottom: Purified protein was subjected to the indicated treatments (see Materials and Methods for details) and reactions were fractionated by SDS-PAGE and stained with Coomassie Blue. (B) Deletion of the Csn4-NTD and Rbx1-RING domains independently reduce affinity of CSN for substrate. The indicated proteins were mixed and allowed to equilibrate prior to determining the change in dansyl fluorescence in triplicate samples. Error bars represent standard deviation. Kd values measured in this experiment are also reported in Figure 3B.
Figure 4—figure supplement 1
Biochemical characterization of Cul1/Rbx1TEV∆RING proteins.
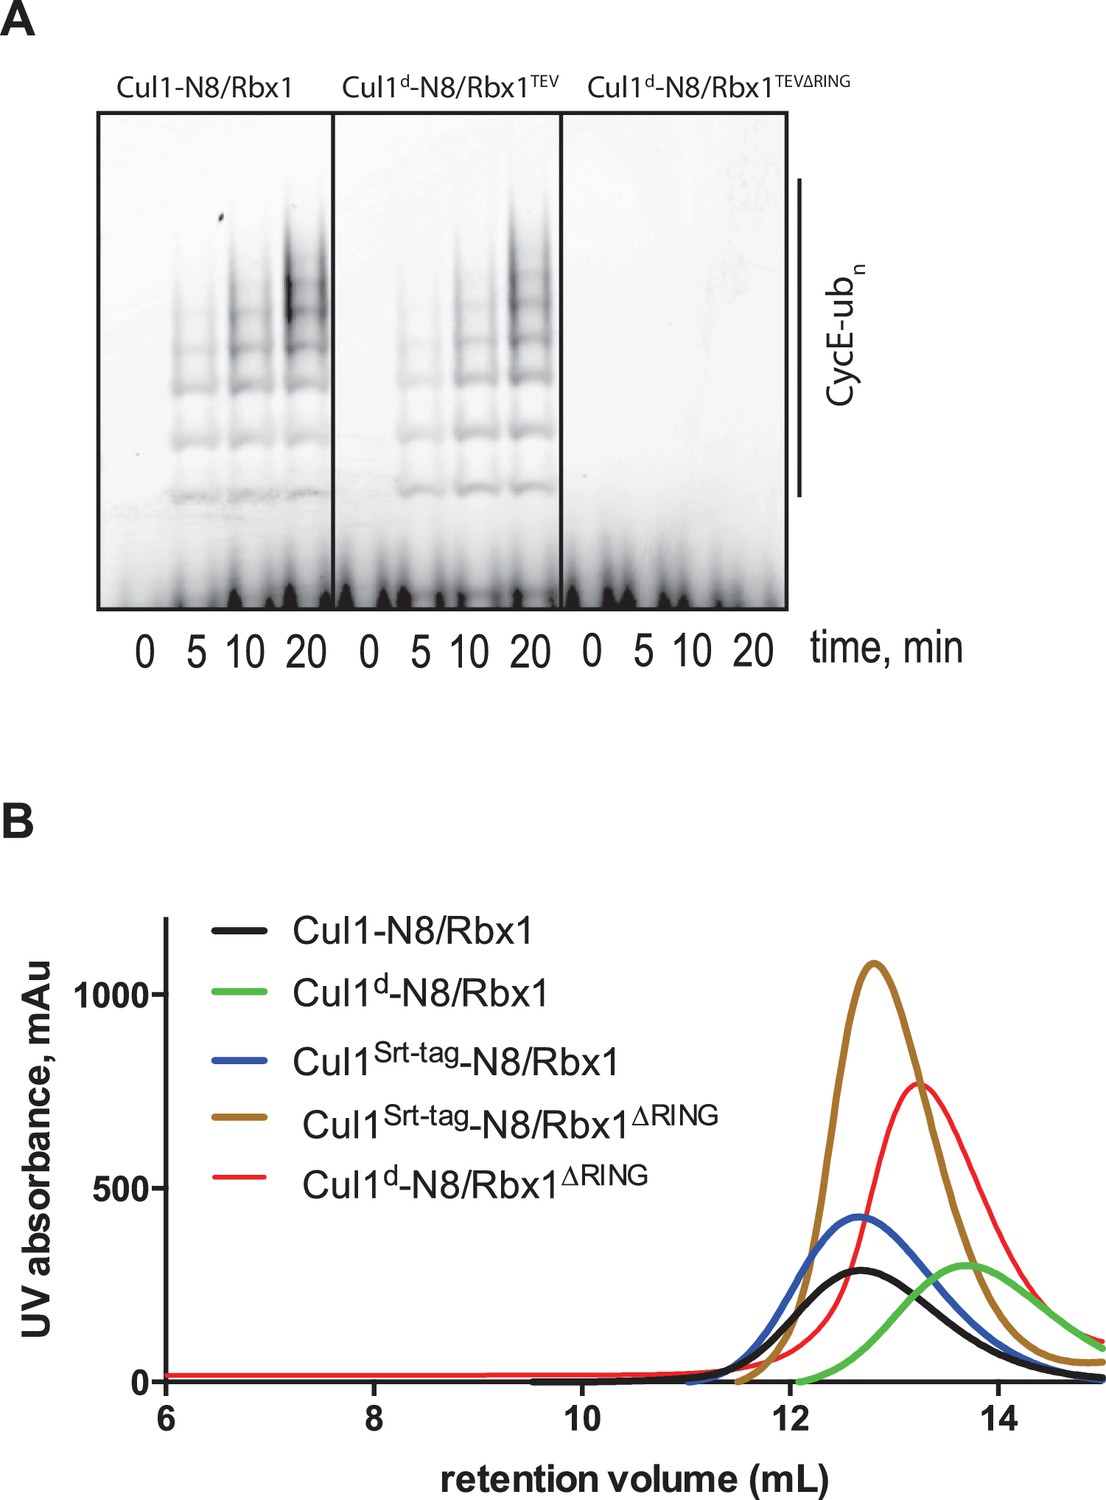
(A) Ubiquitination assay using the indicated Cul1-N8/Rbx1 variants (500 nM each) as an E3. Each reaction contained, in addition, 100 nM Ube1, 1000 nM Cdc34b, 750 nM Skp1/Fbxw7 and 4000 nM CyclinE phosphopeptide, labeled with FAM. The samples were incubated at 25 °C for the indicated time points, analyzed by SDS PAGE and visualized by excitation at 473 nm. (B) Overlay of Superdex 200 size exclusion profiles of purified Cul1/Rbx1 variants isolated from insect cells.
Figure 5 with 1 supplement
The N-terminal domains of Csn2 and Csn4 and the RING domain of Rbx1 are important for CSN-mediated deneddylation.
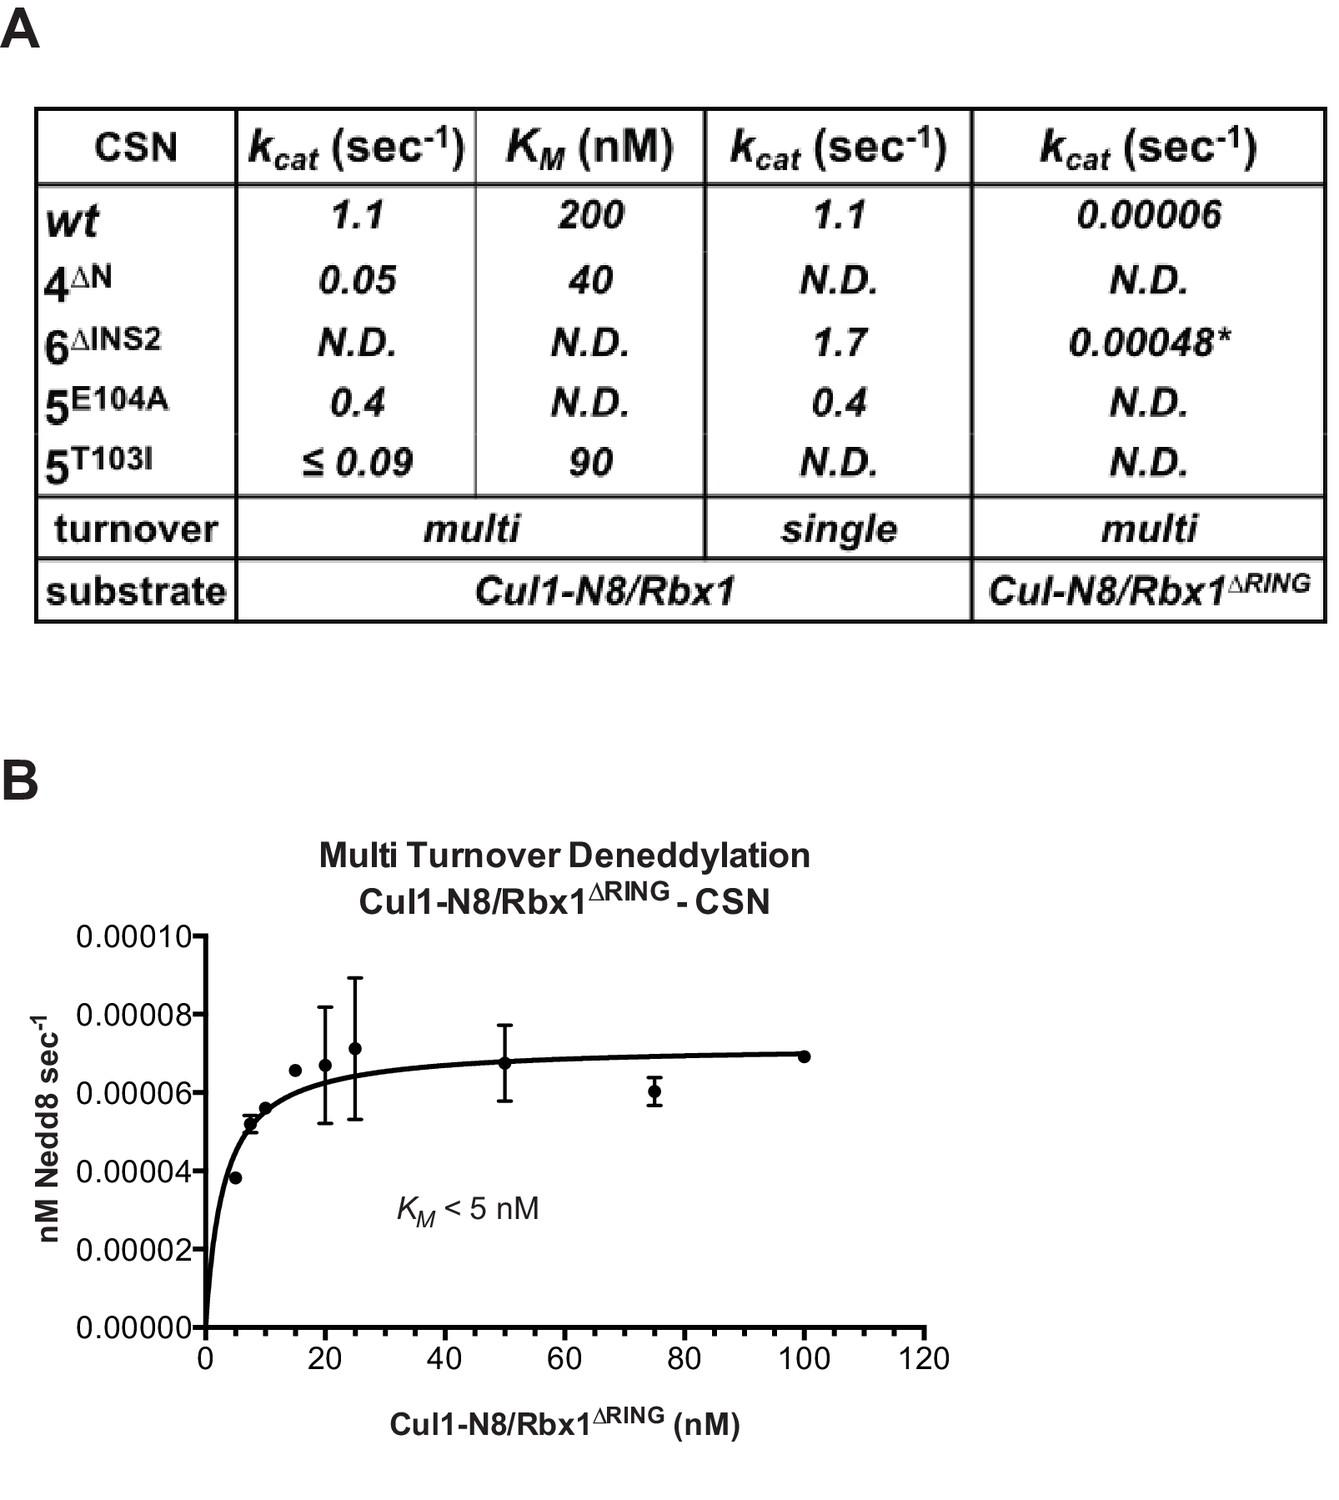
(A) Summary of kinetic parameters for the indicated CSN mutants in multi- or single-turnover deneddylation reactions with Cul1-N8/Rbx1 or Cul1-N8/Rbx1∆RING substrate. Note that there may be modest discrepancies between these kcat values and koff values due to differences in assay configurations as described in Materials and Methods. The ∆RING substrate used here and in panel B contains the sortase sequence at the C-terminus of Cul1 that was used for generation of dansylated Cul1. Control experiments revealed that this tag, with or without dansylation, reduced kcat by ~4-fold. In addition the wild type control for the ∆RING reaction exhibited kcat of 2.6 s-1. The rates shown have been correspondingly adjusted to normalize them to other rates reported here. *, This rate is estimated from Figure 5—figure supplement 1B. (B) Kinetic analysis of deneddylation of Cul1-N8/Rbx1∆RING by CSN.
Figure 5—figure supplement 1

Kinetic analysis of deneddylation.
(A) Deneddylation reactions were carried out in triplicate with CSN4∆N at varying concentrations of Cul1-[32P]N8/Rbx1 substrate and quantified to generate the curve shown. Estimates of kcat and KM are indicated. (B) Deneddylation assays of Cul1-N8/Rbx1∆RING (100 nM), incubated with CSN (200 nM, upper panel) or CSN6∆INS2 (200 nM, lower panel). Samples were taken at the indicated time points, and visualized by SDS PAGE and Sypro Ruby staining. Note that the ∆RING substrate contained an unreacted Sortase tag at the C-terminus of Cul1 that reduced kcat by ~4-fold. (C) Multi-turnover deneddylation reactions were carried out with CSN or CSN5E104A and Cul1-[32P]N8/Rbx1. Substrate was assayed at 1 and 1.3 µM to confirm that saturation was achieved. (D) Single-turnover deneddylation reactions were carried out with CSN on Cul1-[32P]N8/Rbx1 +/- Skp1/Skp2, and with CSN5E104A on Cul1-[32P]N8/Rbx1. (E) Same as panel D except that CSN6∆INS2 was also evaluated. (F) Multi-turnover deneddylation reactions were carried out in triplicate with CSN5T103I at varying concentrations of Cul1-[32P]N8/Rbx1 substrate and quantified to generate the curve shown. Estimates of kcat and KM are indicated.
Figure 6 with 1 supplement
Functional analysis of Csn5 active site and INS1 mutants in biochemical and cellular assays.
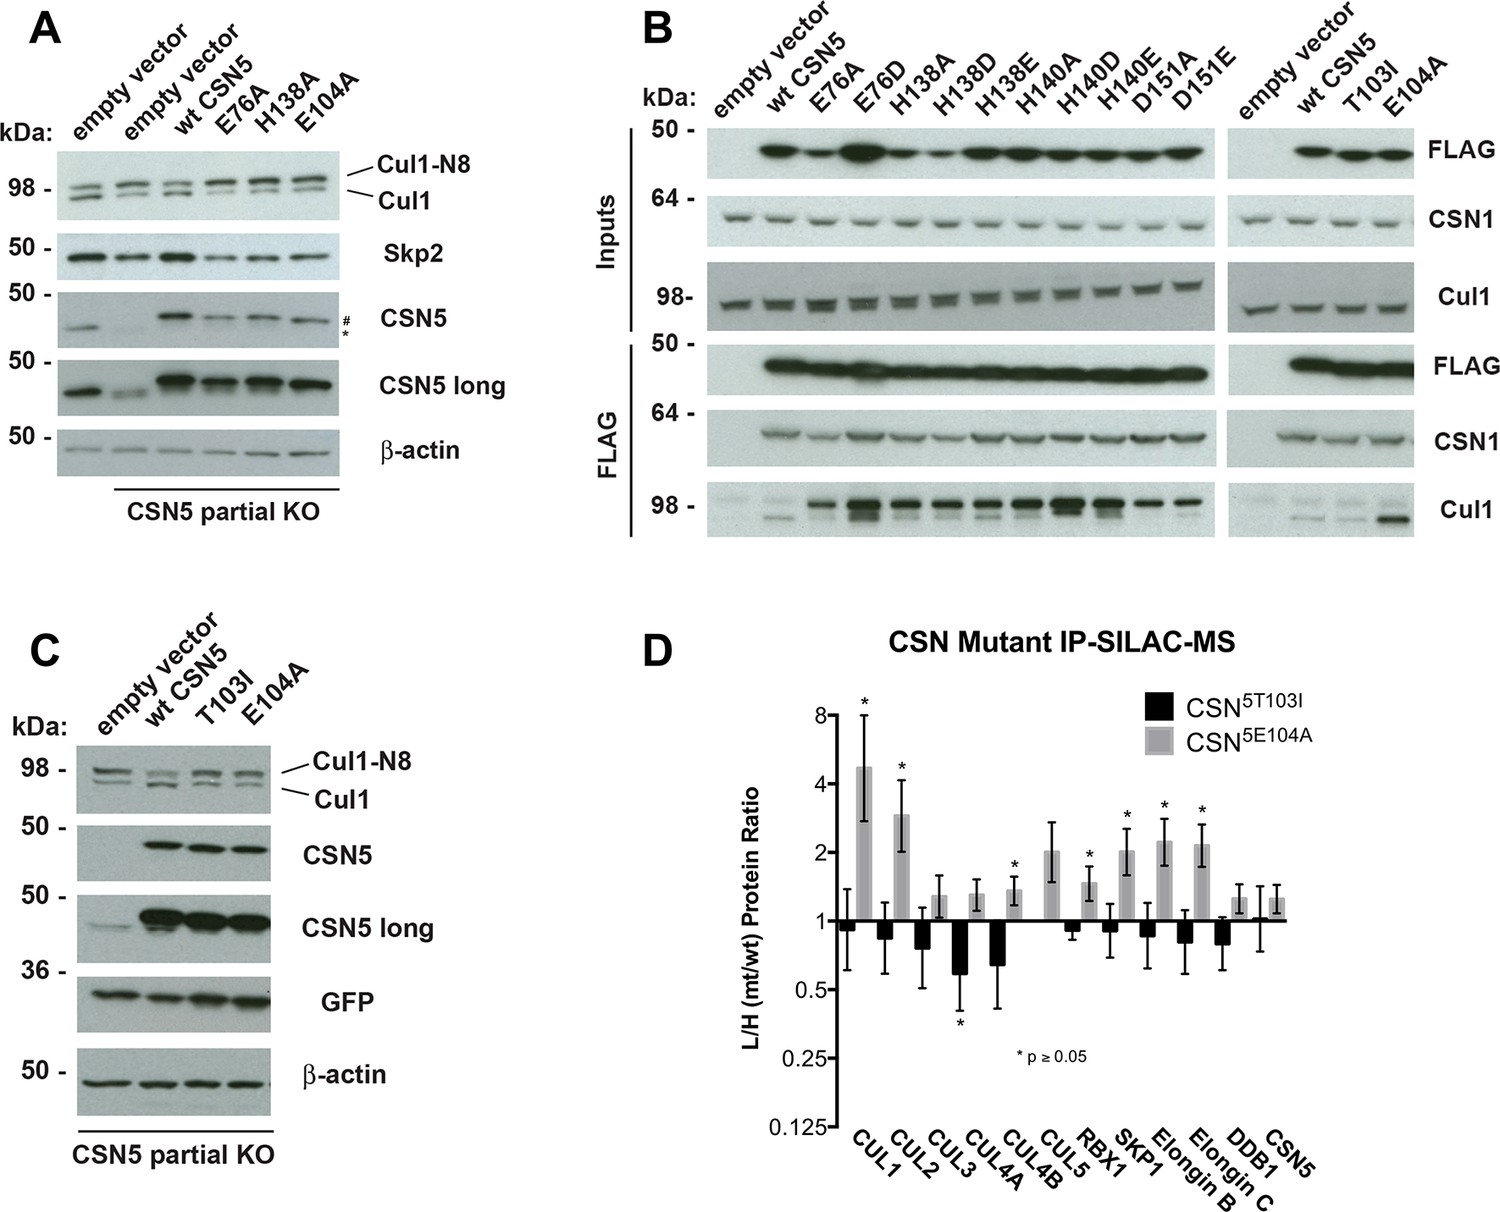
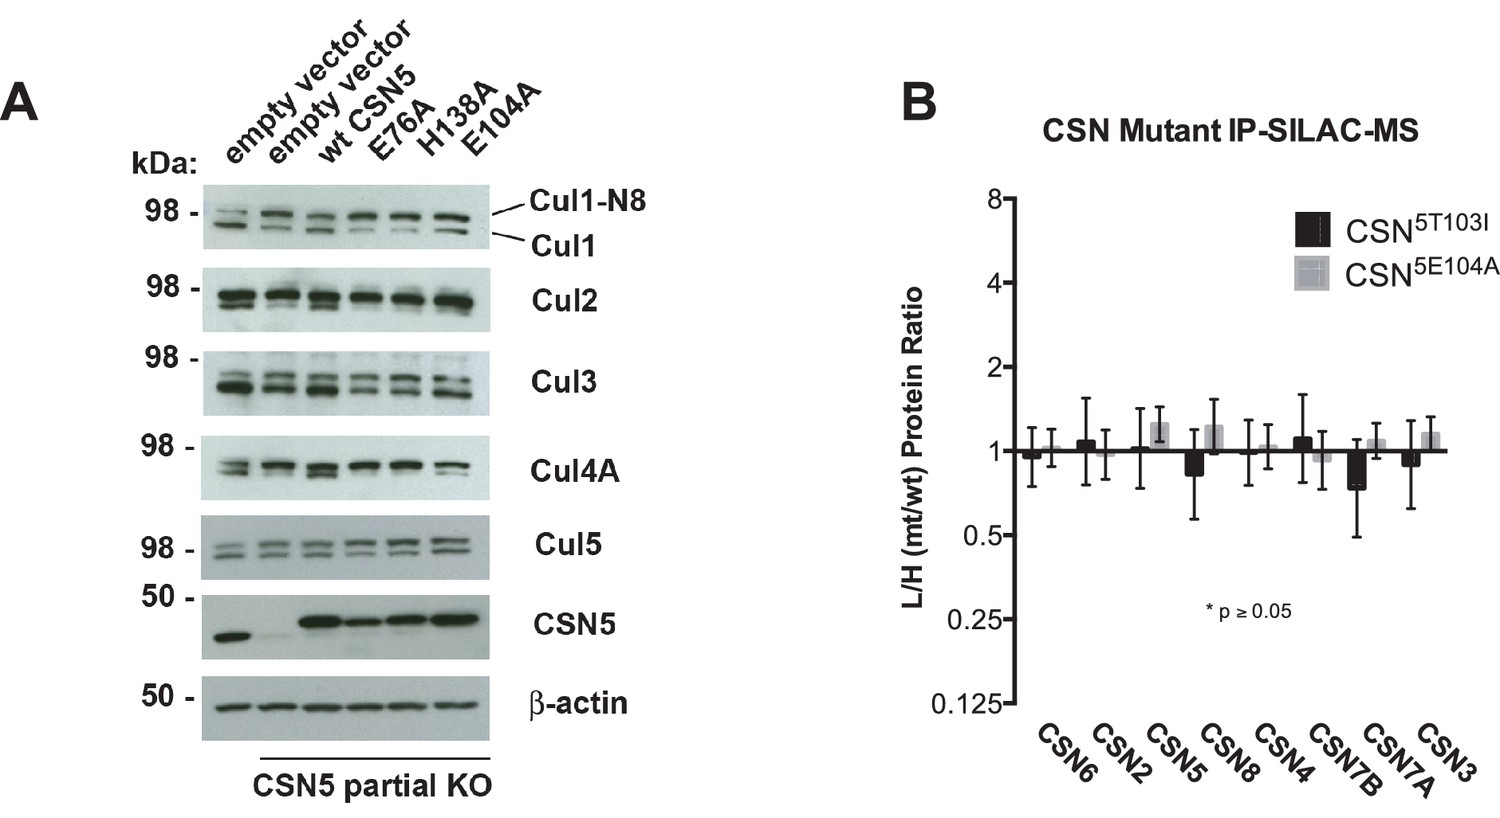
(A) Csn5-E104 is important for CSN function in cells. CSN5 alleles in HEK293T cells were partially knocked out (KO) by CRISPR/Cas9 to yield a major decrease in Csn5 that was nonetheless compatible with viability. Wild type and the indicated Flag-tagged CSN5 mutants were reintroduced by transduction of recombinant retroviruses that co-expressed GFP. Lysates of transduced cells were separated by SDS-PAGE and blotted with antibodies to the indicated proteins. CSN5 long refers to a long exposure of the Csn5 blot, captured to reveal residual Csn5 in the knock-out cells. # refers to transduced FlagCsn5 and * refers to endogenous Csn5. (B) Any mutation of a core JAMM domain residue in Csn5 results in enhanced binding to Cul1. Same as (A), except additional Csn5 mutants were tested and the cell lysates were immunoprecipitated with anti-Flag and the immunoprecipitates were blotted for the indicated proteins. (C) Csn5-T103 is important for CSN function in cells. Same as (A) except that the Csn5-T103I mutant was analyzed in parallel with Csn5-E104A and wild type. (D) SILAC mass spectrometry of endogenous proteins bound to FlagCsn5-E104A or FlagCsn5-T103I, relative to wild type FlagCsn5. Cells expressing mutant and wild type FlagCsn5 proteins were grown in light and heavy medium, respectively. L:H ratios >1 indicate higher recovery of the listed protein from cells expressing mutant FlagCsn5, whereas ratios <1 indicate higher recovery from cells expressing wild type FlagCsn5. Gray bars: FlagCsn5-E104A; black bars: FlagCsn5-T103I. Error bars represent the 95% confidence interval as calculated by limma (Smyth, 2005). Each protein was quantified in at least two of the four biological replicates and error bars represent standard deviations. Ratios indicated by * differed significantly from 1.0 (p<0.05). For CSN, only Csn5 is shown; the remainder is shown in Figure 6—figure supplement 1B.
Figure 6—figure supplement 1
Analysis of Csn5 mutations in cells.
(A) Same as Figure 6A except that samples were immunoblotted for different cullins. (B) SILAC data for CSN subunits from pull-down analysis shown in Figure 6D.
Figure 7
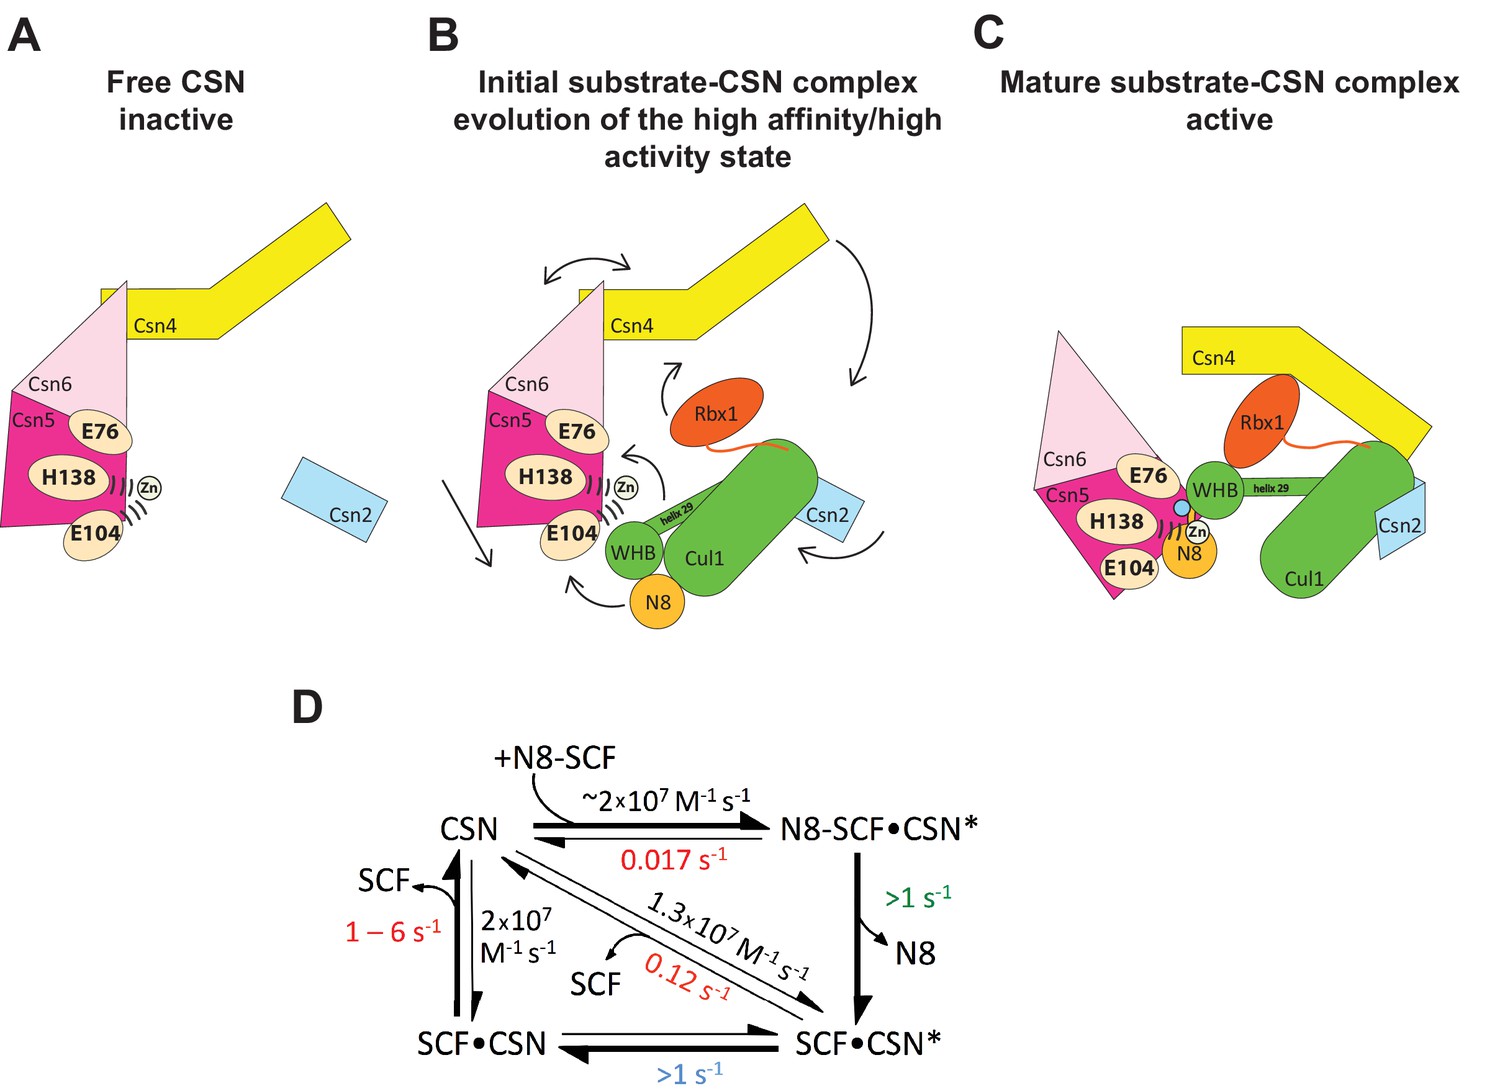
Structural and kinetic models for CSN activation and the CSN enzyme cycle.
(A-C) Proposed conformational changes that precede substrate cleavage. (D) Kinetic model for the deneddylation cycle. The asterisk denotes the activated form of CSN. Numbers in red, black, green, and blue represent koff (sec-1), kon (M-1 sec-1), kcat (sec-1), and conformational change (sec-1) rates, respectively. For rates specified as >1, the actual rate has not been measured but it is inferred to be >1 sec-1 because the overall rate for multiturnover catalysis is at least 1.1 sec-1 and thus all sub-steps must be at least this fast. The koff of SCF from CSN varied depending upon whether the rate was measured directly or inferred from Kd and kon (see Figure 3C). The arrow connecting CSN and N8-SCF•CSN* combines two separate steps: binding of N8-SCF to CSN, and activation of CSN to CSN*.
Author response image 1
Videos
Video 1
Morphing CSN and Cul1-N8/Rbx1 conformational changes, occurring upon binding.
Color code as in Figure 1.
Additional files
-
Supplementary file 1
Cross-links within CSN5H138A-SCF-N8Skp2/Cks1.
"Id" gives the amino acid sequence of the cross-linked peptides and the exact position of the two cross-linked lysine residues is indicated by the numbers of the letters a and b respectively for the first and second peptide. “Protein1” and “Protein2” denote the cross-linked protein names and “Residue 1” and “Residue 2” respectively defines the position of the cross-linked lysine within the sequence of the protein. “deltaS” is the delta score of the respective cross-link, which serves as a measure for how close the best assigned hit was scored in regard to the second best. “Id_Score” is a weighted sum of four subscores: xcorrc, xcorrx, match-odds and TIC that is used to assess the quality of the composite MS2 spectrum as calculated by xQuest. “FDR” denotes the false-discovery rate as calculated by xProphet. The measured distance in Å is given for all cross-links, which fall within modeled residues.
- https://doi.org/10.7554/eLife.12102.021
-
Supplementary file 2
Cross-links within CSN5H138A-SCFSkp2/Cks1.
- https://doi.org/10.7554/eLife.12102.022
-
Supplementary file 3
Cross-links within CSN-Cul1/Rbx1.
- https://doi.org/10.7554/eLife.12102.023
-
Supplementary file 4
Cross-links within CSN-SCF-N8Fbxw7FL.
- https://doi.org/10.7554/eLife.12102.024
-
Supplementary file 5
Cross-links within CSN-SCF-N8Fbxw7trunc.
- https://doi.org/10.7554/eLife.12102.025
-
Supplementary file 6
Cross-links within CSN-Cul3/Rbx1.
- https://doi.org/10.7554/eLife.12102.026
Download links
A two-part list of links to download the article, or parts of the article, in various formats.
Downloads (link to download the article as PDF)
Open citations (links to open the citations from this article in various online reference manager services)
Cite this article (links to download the citations from this article in formats compatible with various reference manager tools)
Structural and kinetic analysis of the COP9-Signalosome activation and the cullin-RING ubiquitin ligase deneddylation cycle
eLife 5:e12102.
https://doi.org/10.7554/eLife.12102


