A common mechanism underlies changes of mind about decisions and confidence
- Cambridge University, United Kingdom
- Columbia University, United States
- Howard Hughes Medical Institute, Columbia University, United States
- New York University, United States
Figures
Figure 1
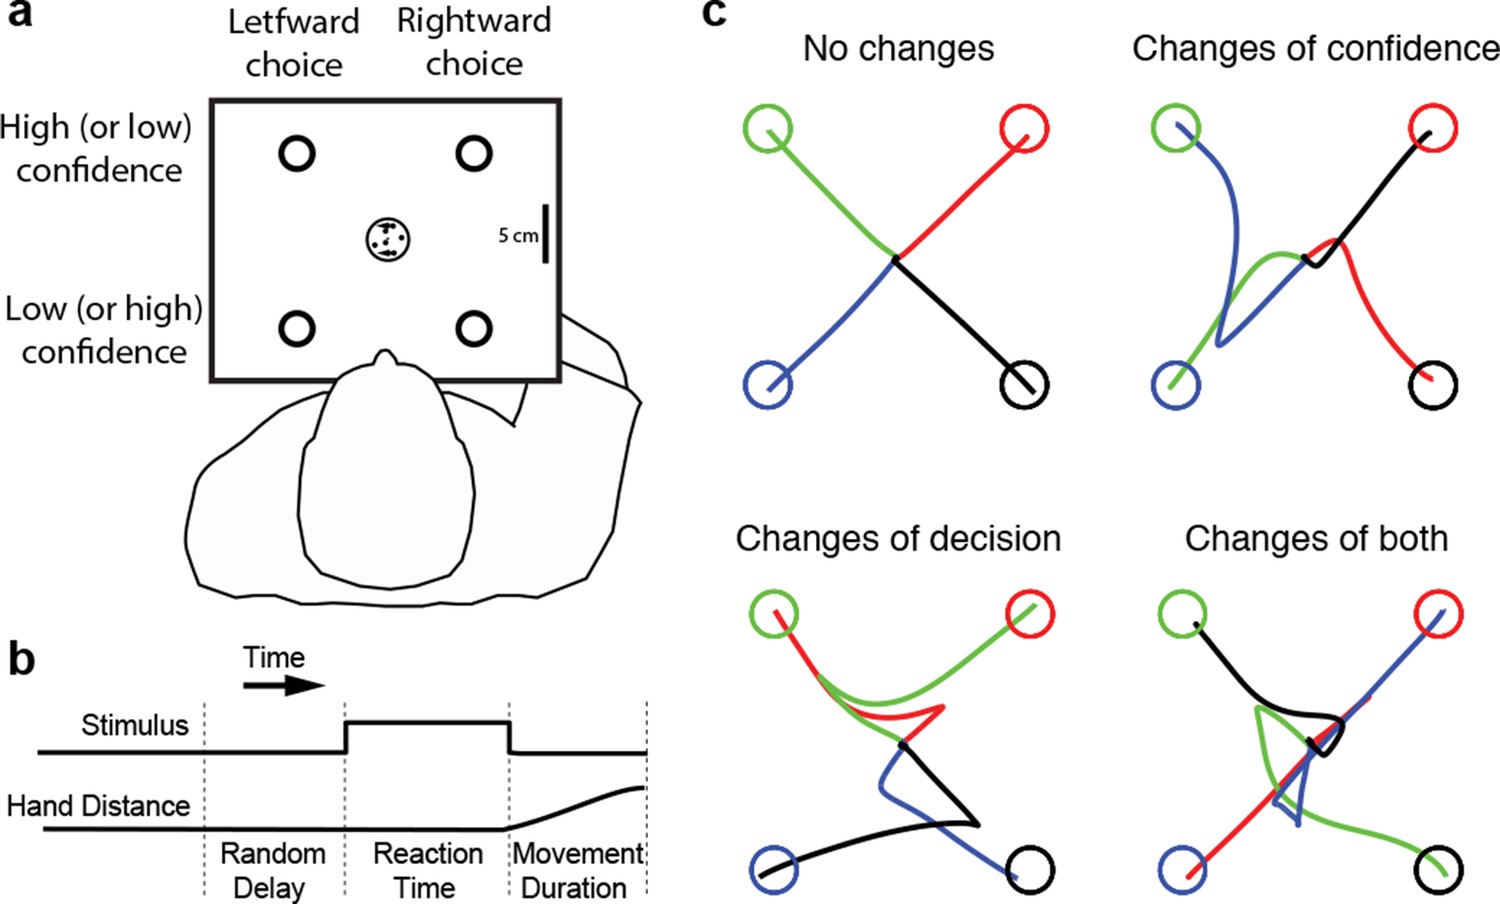
Experimental paradigm and sample trajectories.
(a) Schematic of the visual display (rectangle). Participants judged the perceived direction of motion of a central random-dot display and whenever ready, moved a handle from the central home position to one of four choice targets, thereby indicating simultaneously the direction decision (leftward vs. rightward targets) and confidence level (top vs. bottom targets). (b) The time course of events that make up a trial. Each trial started when the participant’s hand was in the central home position. The subject controlled motion viewing duration, as the motion stimulus was extinguished when the handle left the central homeposition. The trial ended when the participant reached one of the targets. (c) Sample hand trajectories from one participant. Most trajectories extend directly from the central home position to one of the choice targets. In a fraction of trials, the trajectories change course during the movement, indicating a change of confidence, change of direction-decision and occasionally change of both direction-decision and confidence. The trajectory colors indicate the target of their initial choice.
Figure 2 with 2 supplements
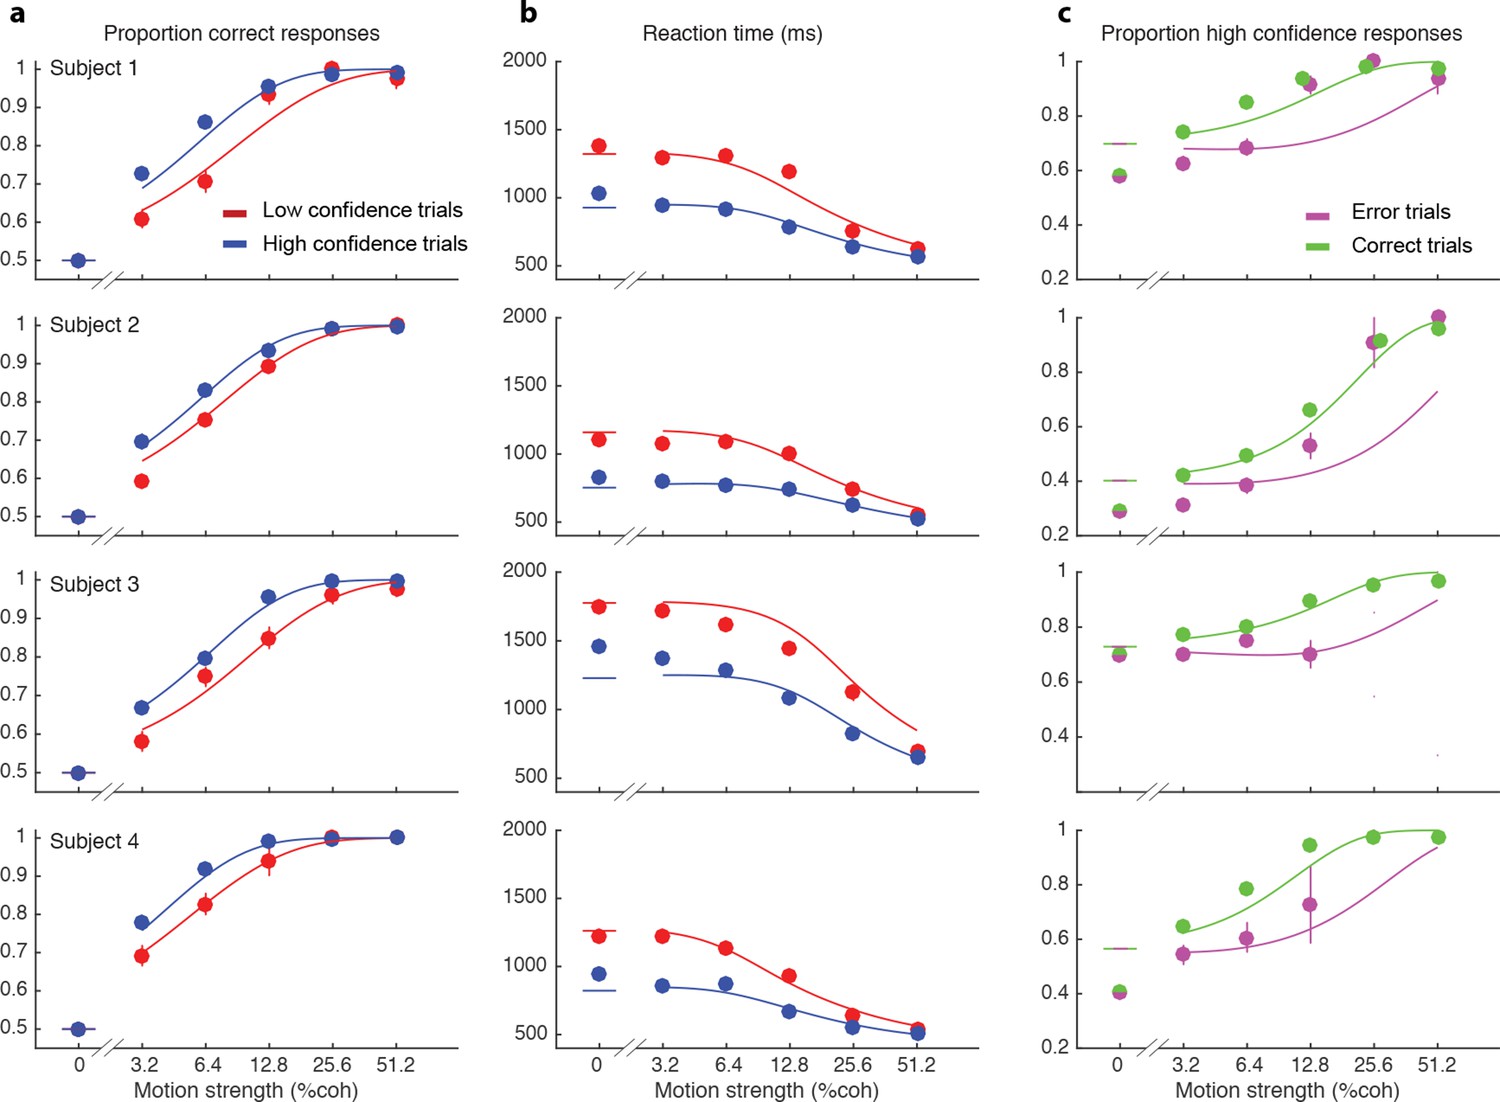
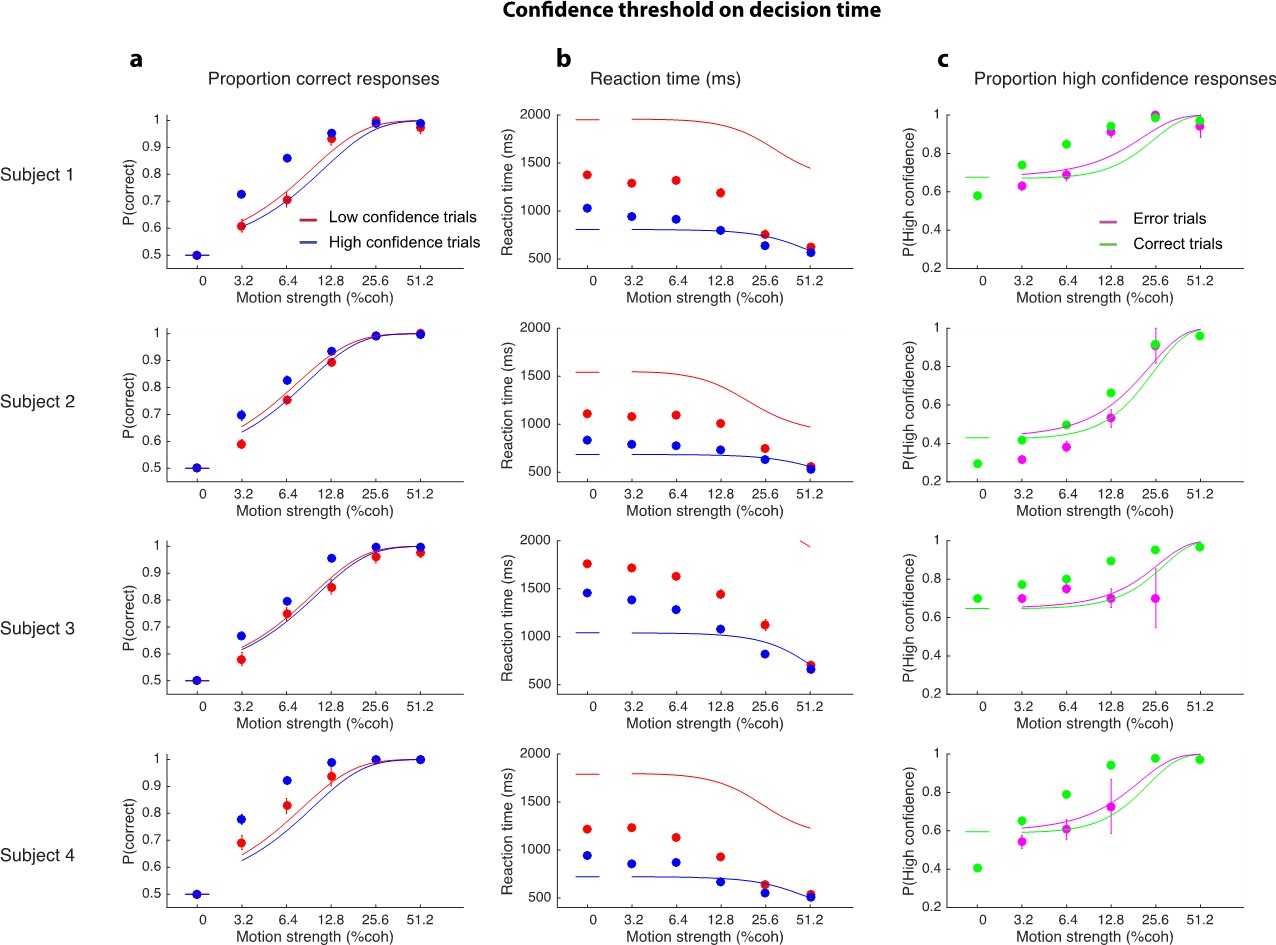
Interplay between initial confidence, accuracy, and reaction time.
(a) Proportion correct responses as a function of motion coherence split by high (blue) and low (red) confidence decisions. (b) Mean reaction time as a function of motion strength as in (a). (c) Probability of a high confidence initial choice as a function of motion coherence, split by correct (green) and error (magenta) trials. Data are means and s.e.m.; curves are model fits. Only data with 10 or more trials are plotted. For clarity some of the points have been jittered horizontally.
Figure 2—figure supplement 1
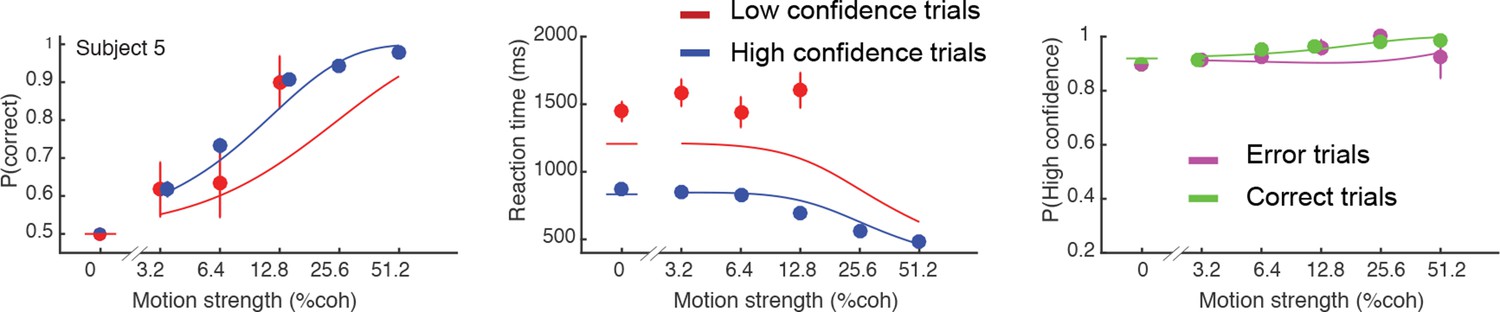
Initial choice behavior for Subject 5.
Data and fits in the same format as Figure 2. This subject responded with high confidence on over 95% of trials.
Figure 2—figure supplement 2
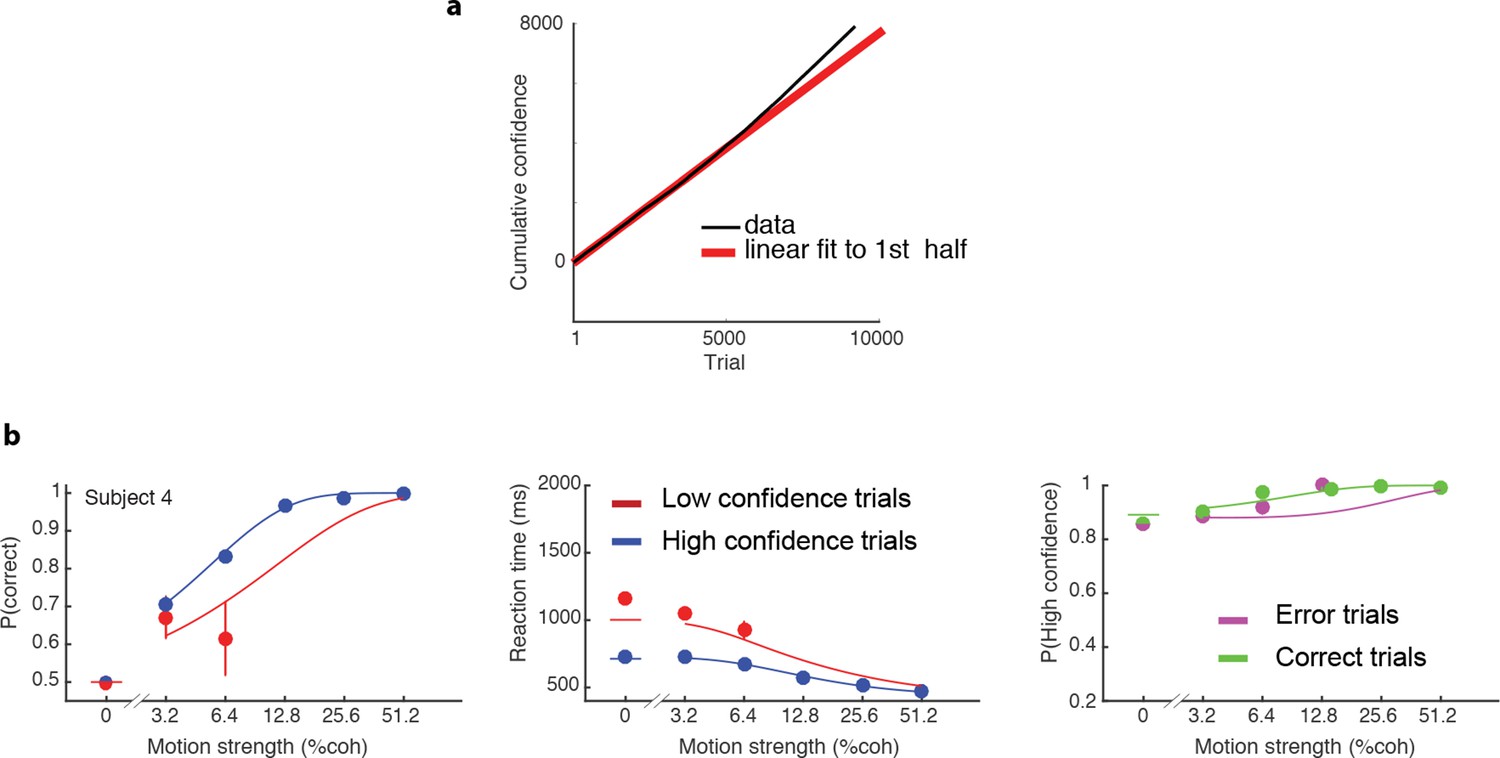
Non-stationary behavior of Subject 4.
(a) Cumulative of number of trials with high confidence (back line) as a function of trial number shows a change in slope around trial 5000, corresponding to an increase in the rate of responding with high confidence. Red line shows linear regression fit to the first 5000 trials. (b) Data and fits for trials of this subject’s data in the same format as Figure 2.
Figure 3 with 1 supplement
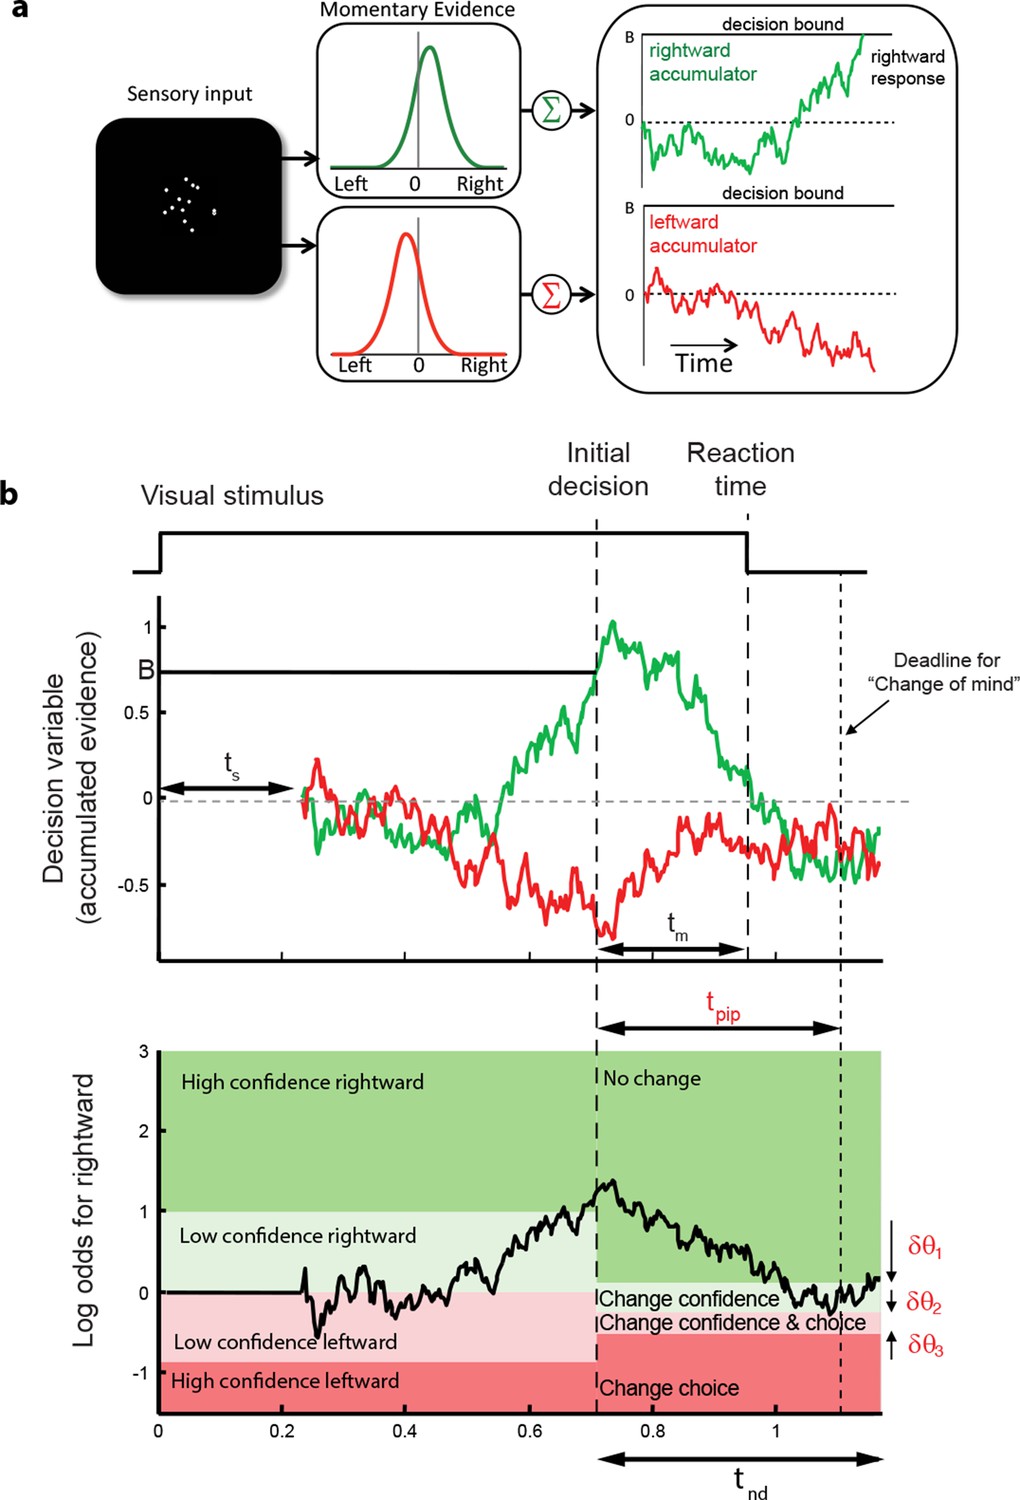
Information flow diagram showing visual stimulus and neural events leading to an initial decision, response time, and a possible change of mind.
(a) Competing accumulator model of the initial decision. Noisy sensory evidence from the random dot motion supports a race between a mechanism that accumulates evidence for right (and against left) and a mechanism that integrates evidence for left (and against right). Samples of momentary evidence are drawn from two (anti-correlated) Gaussian distributions with opposite means, which depend on the direction and motion strength of the stimulus. In this case the motion is rightward; therefore, the momentary evidence for right has a positive mean, and the rightward accumulator has positive drift. The first accumulation to reach an upper decision bound determines the choice and decision time. In this case the decision is for a rightward response. (b) Evolution of the decision variables (top) and log-odds (bottom) in the task. For simplicity we plot both accumulations on the same graph. At the initial decision time, the state of both the winning and losing processes as well as decision time confer the log-odds that a decision rendered on the evidence is likely to be correct, what we term confidence or belief. The bottom plot shows the log-odds of a rightward choice being correct, calculated from the decision variable and time. We assume that subjects adopt a consistent criterion θ on “degree of belief” to decide in favor of high or low confidence. Note that the decision is terminated by the decision variable (top), not the log-odds (bottom). Although the motion stimulus is displayed up to the reaction time, the decision does not benefit from all of the information, owing to sensory and motor delays (ts and tm, respectively). In the post-decision period, the accumulation therefore continues. Changes of confidence and/or decision are determined by which region the log-odds is in after processing for an additional time, tpip ≤ ts + tm. To incorporate energetics costs of changing a decision and having to reach mid-movement to a new target we allow the initial bounds to move from their initial levels (δθ1-δθ3). This example uses the parameter fits for Subject 1 and a 3.2% coherence with an initial high confidence correct rightward decision followed by a change of confidence to a rightward, low-confidence decision (for an initial low-confidence example see Figure 3-figure supplement 1).
Figure 3—figure supplement 1
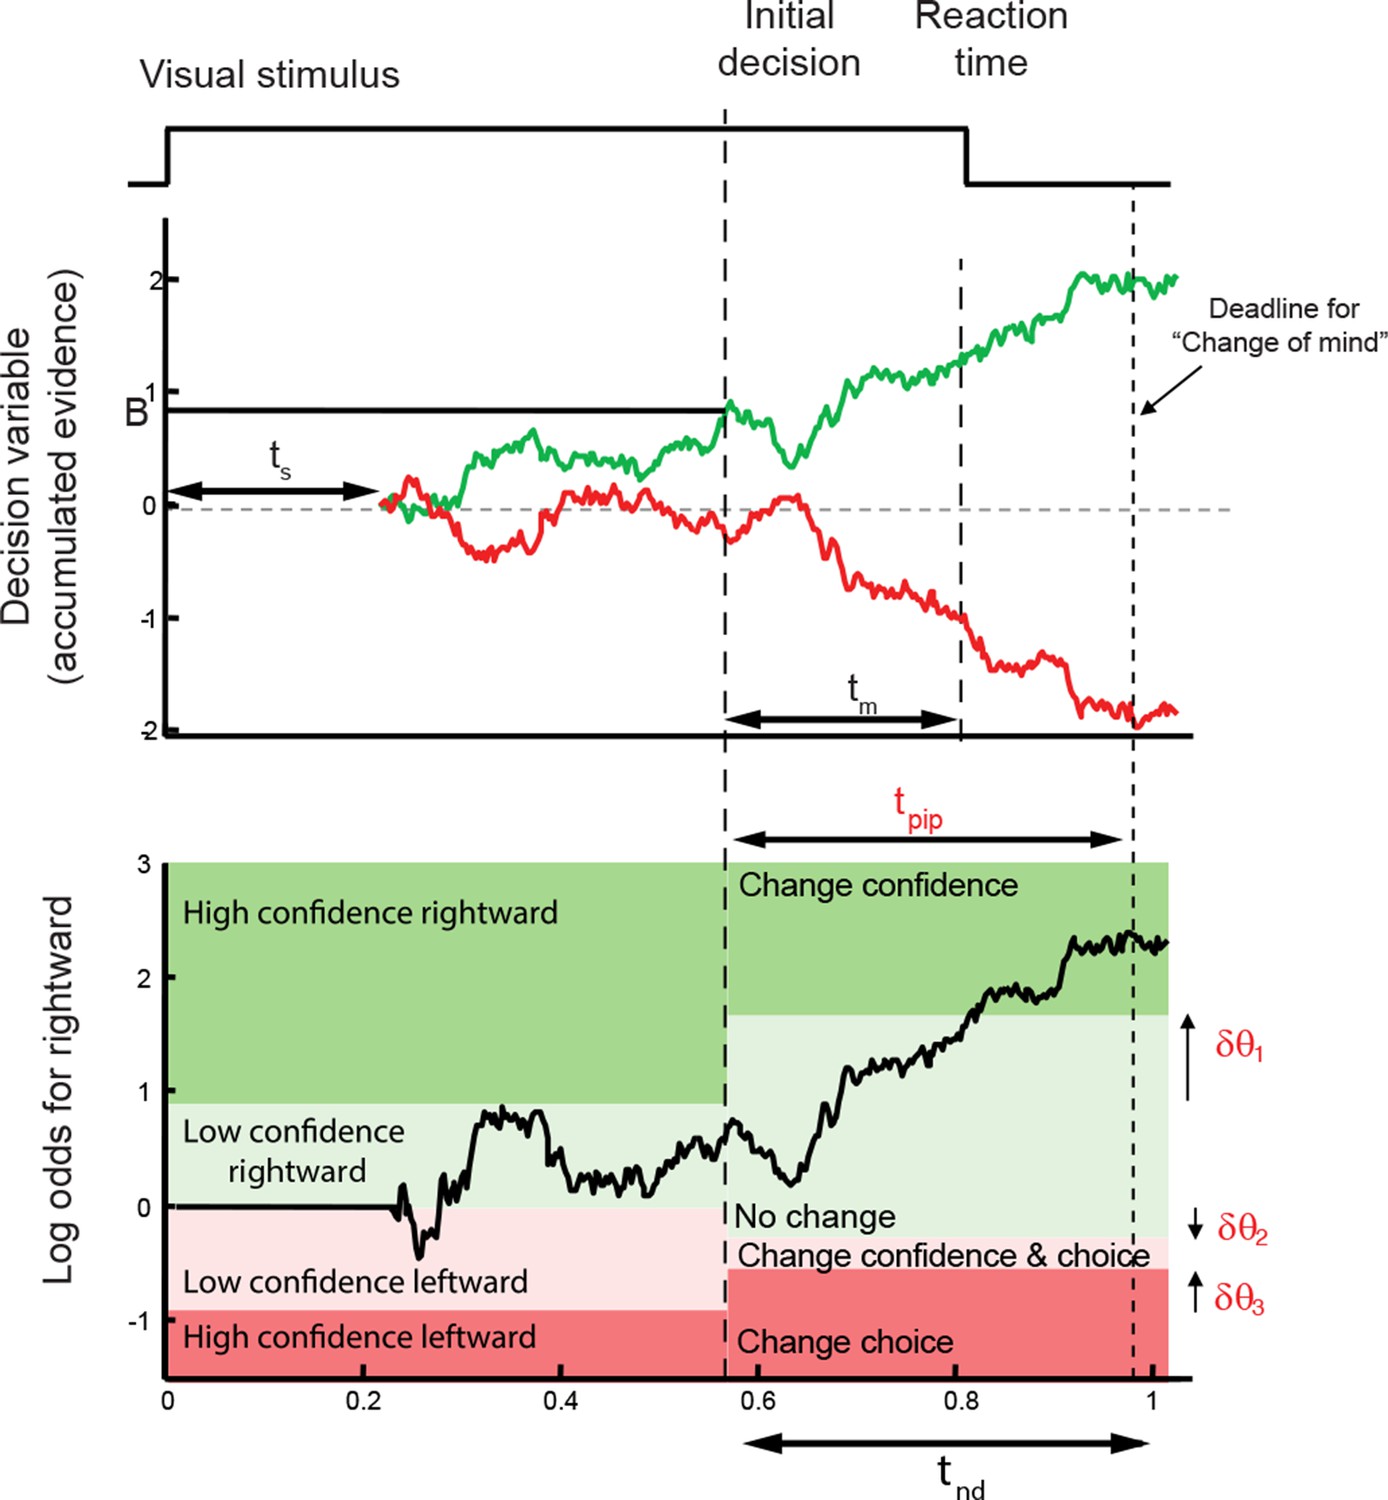
A second example of the evolution of decision variables (top) and log-odds (bottom) in the task.
The example is in the same format as Figure 3b but for an initial low confidence, correct decision with a change to high confidence.
Figure 4 with 1 supplement
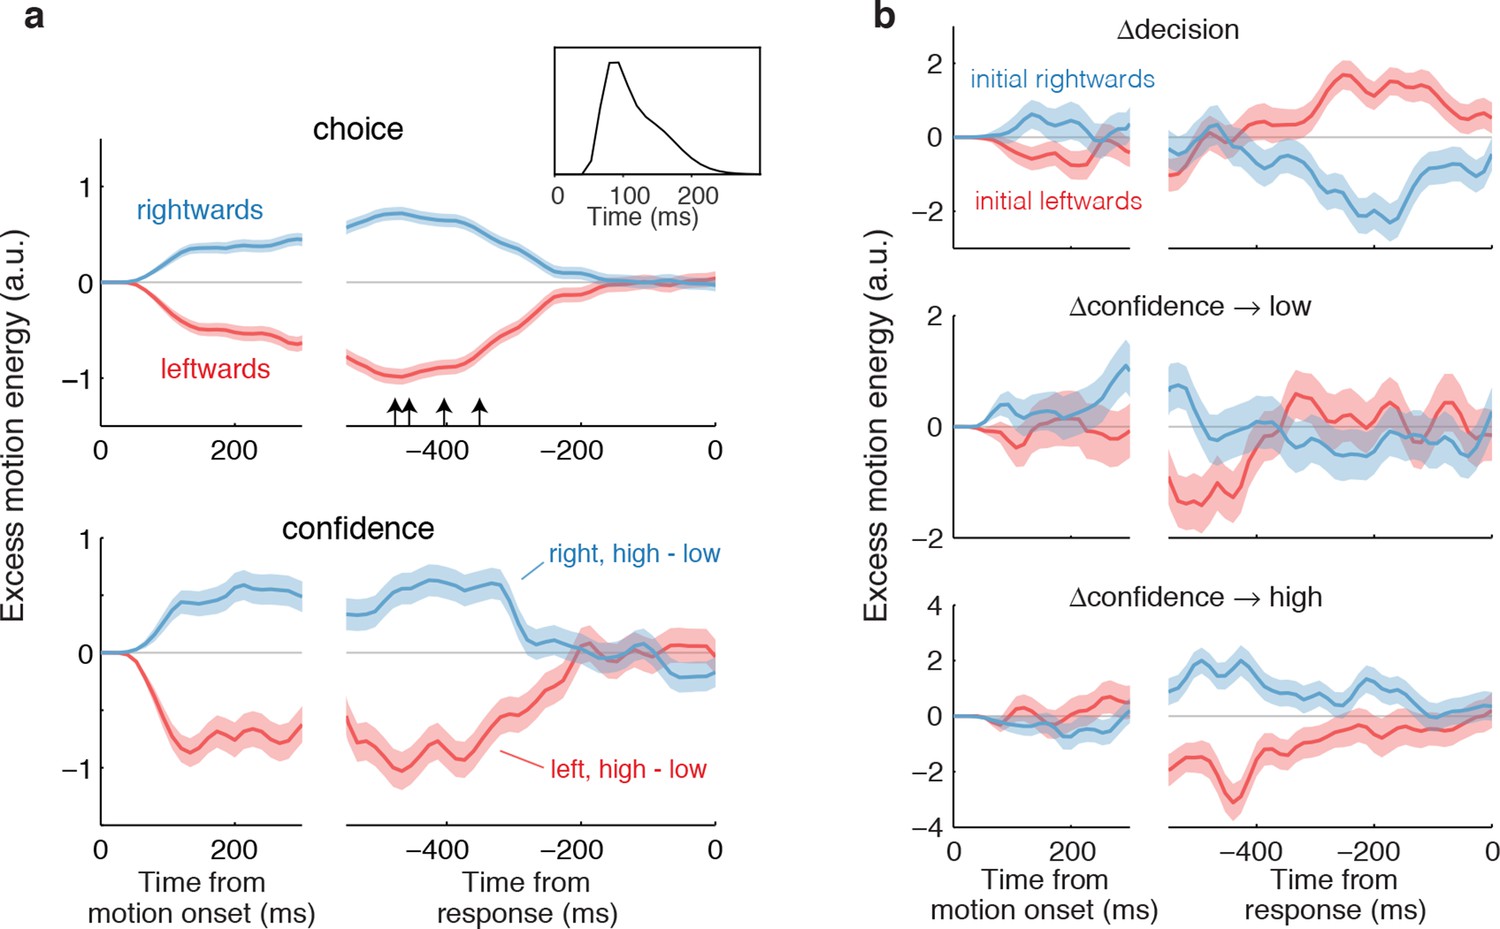
Influence of motion information on choice and confidence.
(a) Stimulus information supporting initial choice and confidence coincide. Motion-energy residuals were obtained by applying a motion energy filter to the sequence of random dots presented on each trial, and subtracting the mean of all trials having the same coherence and direction of motion. Positive (negative) residuals indicate an excess of rightward (leftward) motion. In each panel, data are aligned to stimulus onset (left) and movement initiation (right). Only motion coherences ≤6.4% are included in the analysis. Inset shows the impulse response of the motion filter to a two-stroke rightward motion “impulse” at t = 0. The upper panel shows the average of the motion energy residuals for rightward (blue) and leftward (red) choices, irrespective of confidence level. Arrows indicate, for each subject, the time prior to the movement initiation when the motion energy fluctuations cease to affect choice. The estimates correct for the delays of the filter (see Figure 4—figure supplement 1). The lower panel shows the difference in motion energy residuals between high and low confidence, for each direction choice. Shading indicates s.e.m. (b) Influence of motion energy residuals on changes of mind about direction and confidence. When subjects changed their initial decision about direction (top panel), motion information changed sign just before movement initiation. When confidence changed from high to low (middle panel), residuals were positive or negative for the two direction choices, respectively, and attenuated or reversed sign just before movement initiation. In contrast, late information provided additional support for the initial choice when confidence changed from low to high (bottom panel).
Figure 4—figure supplement 1
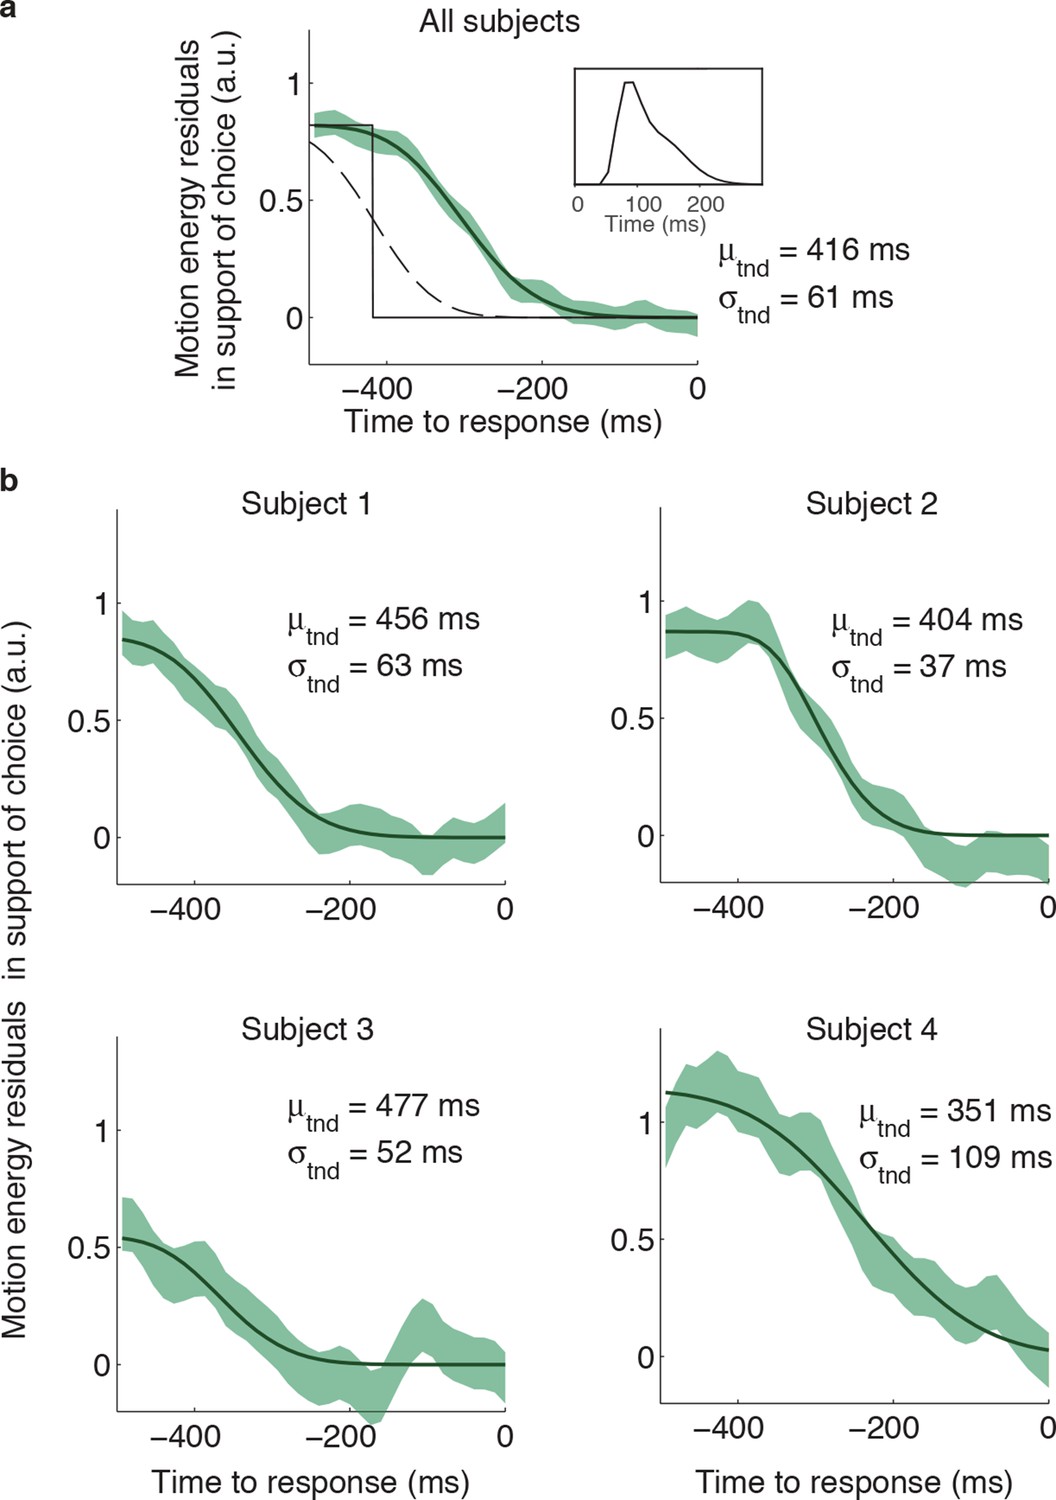
Estimation of the non-decision times from the psychophysical kernels.
Although some previous studies measured the non-decision time as the point in time at which motion fluctuations no longer exert a significant influence on the initial choice, this method is biased because estimates of latency become shorter if non-decision times are more variable across trials, or if more trials are included. We used an alternative approach, which involves fitting a function, f(t), to the psychophysical kernels. (a) The shape of f(t) was derived assuming that the slow decay of the psychophysical kernels when aligned on movement onset is due to: (i) trial-to-trial variability in the non-decision time, and (ii) the smoothing introduced by the impulse response of the motion energy (inset; same as in Figure 4a). Without these influences, the influence of motion fluctuations on choice would step to zero at a fixed latency (μtnd) before movement (black solid line). Inter-trial variability in the non-decision time reduces the number of trials that contribute to the psychophysical kernel for times closer to movement onset. If this variability is assumed Gaussian, the step function is smoothed into a cumulative Gaussian (g[t μtnd, σtnd]; dashed line). To fit the psychophysical kernels, we also need to consider the additional smoothing introduced by the motion filter, which we do by convolving g(t) with the impulse response of the motion filter, IR(t), such that, where is is an arbitrary scaling parameter. The final fit, that is f(t), is shown by the black line. To increase the statistical power, we combined the motion energy residuals from rightward and leftward choices, such that positive residuals indicate an excess of motion in the direction of the initial choice. The green shaded area represents s.e.m. for the average of the motion energy residuals, including trials from all subjects. We fit μtnd, σtnd and to minimize the deviance between f(t) and the average of the motion energy residuals. The best-fitting parameters μtnd and σtnd are indicated in the panel. (b) Same analysis as in (a), but conducted separately for each subject. Latencies are similar to those obtained by fitting a bounded accumulation model (Table 1).
Figure 5 with 1 supplement
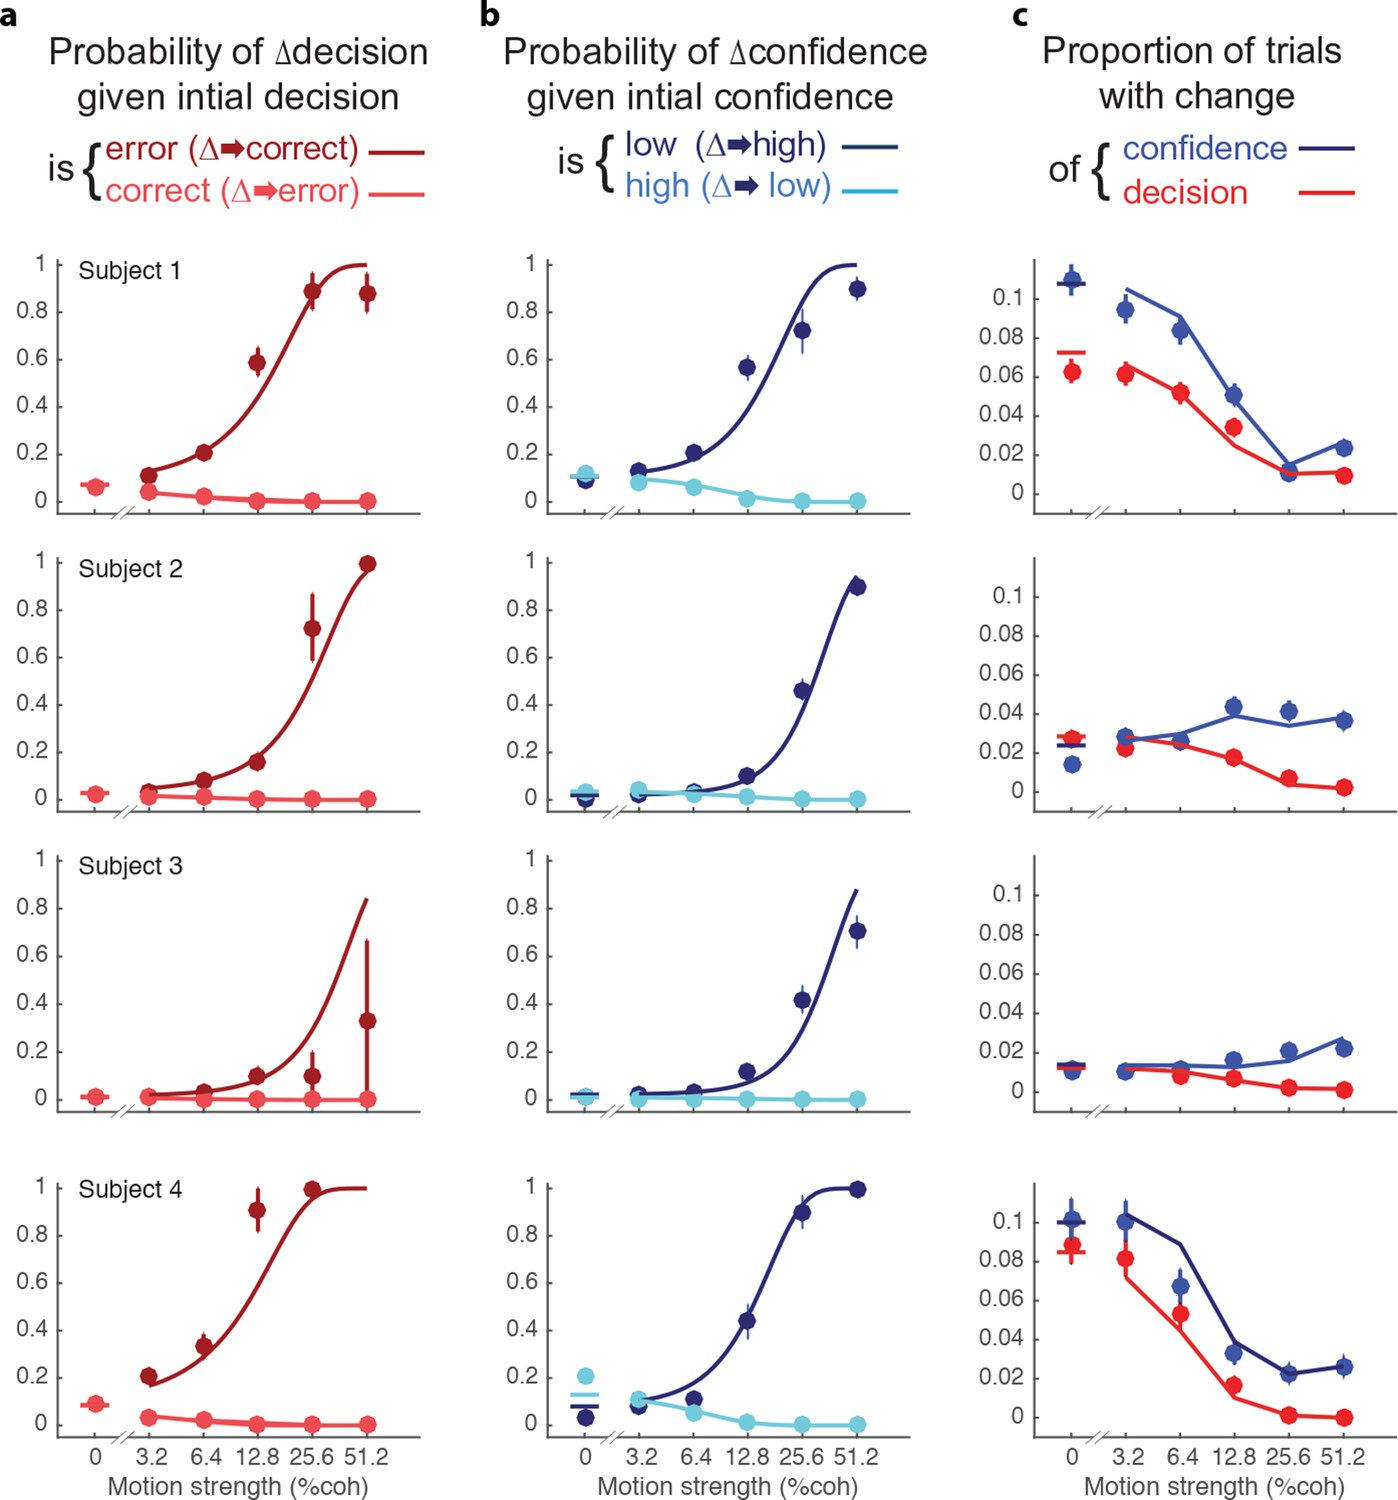
Changes of confidence and decision.
(a) Probability of changes of decision when the initial decision was an error (dark red) or correct (light red) as a function of motion strength. Circles show subject data (mean ± s.e.m) and curves are model fits. (b) Probability of changes of confidence when the initial decision was low confidence (dark blue) or high confidence (light blue) as a function of motion strength. (c) Proportion of trials with changes of confidence (blue) and changes of decision (red) as a function of motion strength. These predictions (curves) are evaluated only at the motion strengths that were presented to the subjects, because they were obtained by using the fits from (a and b) together with the proportion of actual initial choices (error/correct and high/low confidence) for each motion strength. Figure 5—figure supplement 1 shows the empirical and model fit proportion of trials corresponding to panels and (b).
Figure 5—figure supplement 1
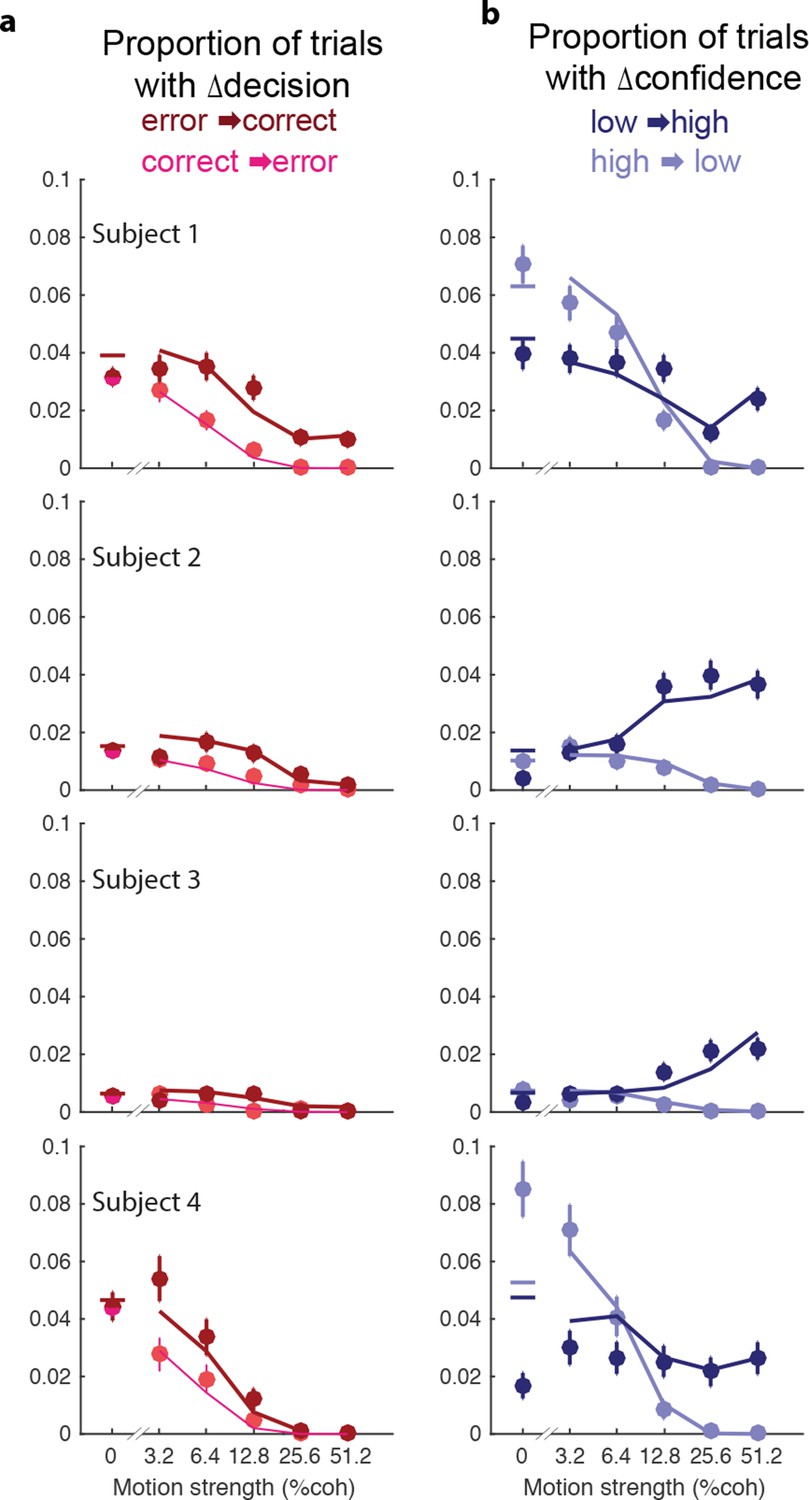
Proportion of trials with a change of decision or confidence.
In the main figure, we show the conditional probability that a subject would change her decision about direction or confidence, given the initial decision. Here, we show the empirical proportions. (a) (a) Proportion of trials with a change of decision from error to correct (dark red) or correct to error (light red) as a function of motion strength. (b) Proportion of of trials with a change of confidence from low to high (dark blue) and high to low (light blue) as a function of motion strength. Circles show subject data (mean ± s.e.m). Model fits (curves) are evaluated only at the motion strengths that were presented, because they were obtained by using the fits from Figure 5a and b together with the observed proportion of initial choices (error/correct and low/high confidence) for each participant.
Figure 6
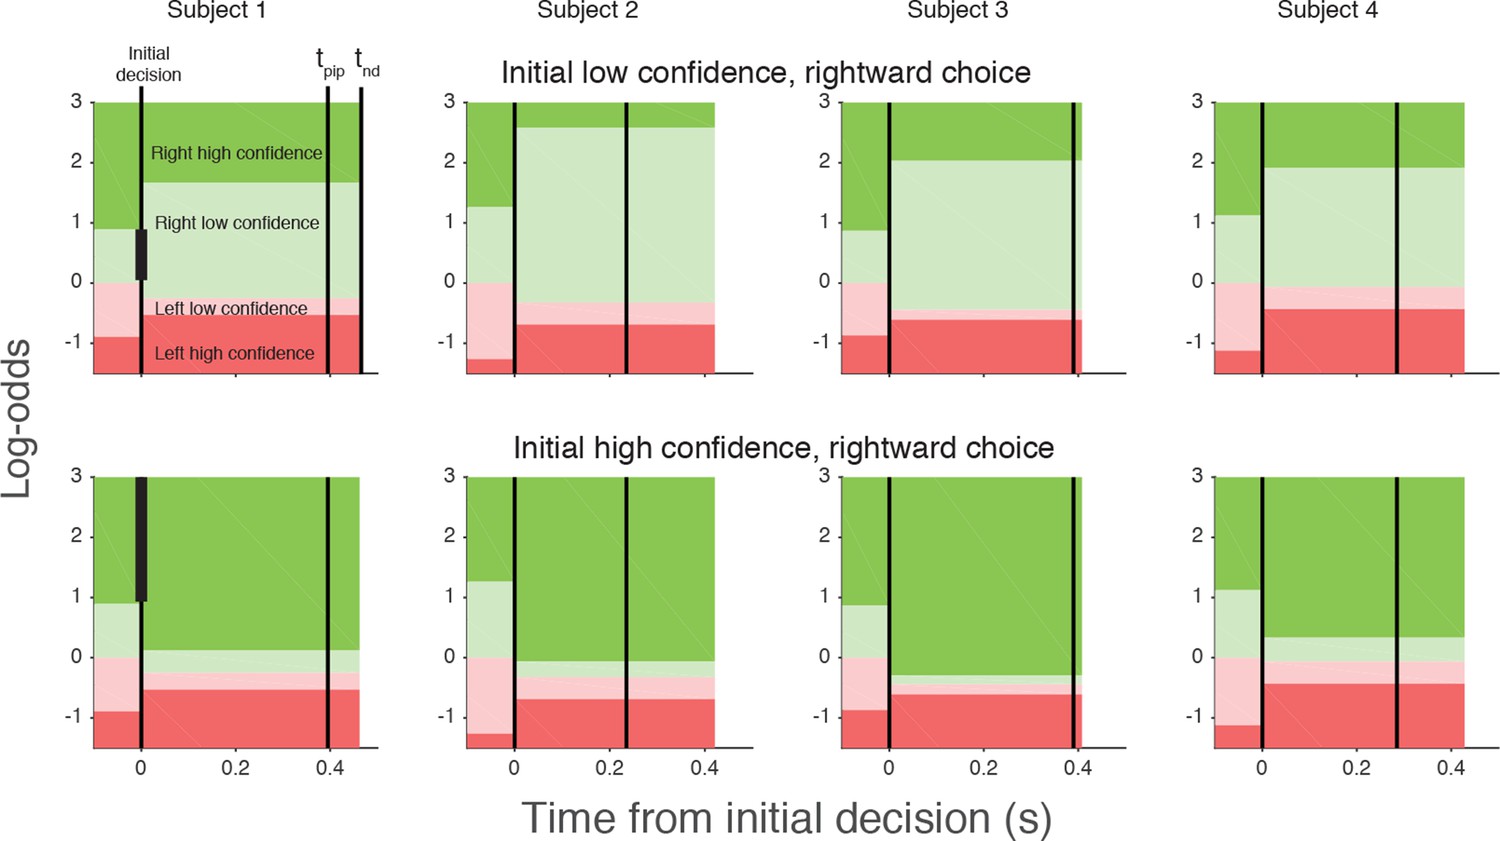
Log-odds thresholds for initial decisions and changes of mind for each participant.
For initial decisions, the confidence threshold ( ± θ for t<0, marked by the boundaries between light and dark colors) determines whether the decision has high or low confidence. The initial direction decision is consistent with the sign of the log-odds (rightward for green and leftward for red). Rows show the thresholds for an initial low- (top) and high- (bottom) confidence rightward decision (i.e., initial decisions that end in the region indicated by the vertical black bar in the plot for Subject 1). Thresholds in the post-initiation stage (right of the initial decision line) tend to “move away” from the initial log-odds threshold, consistent with resistance to change. For all participants, the opposite-choice, high-confidence threshold “moves towards” the initial decision, thereby reducing the width of the pink zone. Because initial confidence was more often high (lower row), the narrow pink zone can be interpreted as resistance to a double change of mind about both direction and confidence. Note that the model parameterization requires the pink and red regions to be same for both initial high and low confidence decisions. The non-decision time (tnd) and time of post-initiation processing (tpip) are also shown for each participant (labels in left top graph).
Figure 7
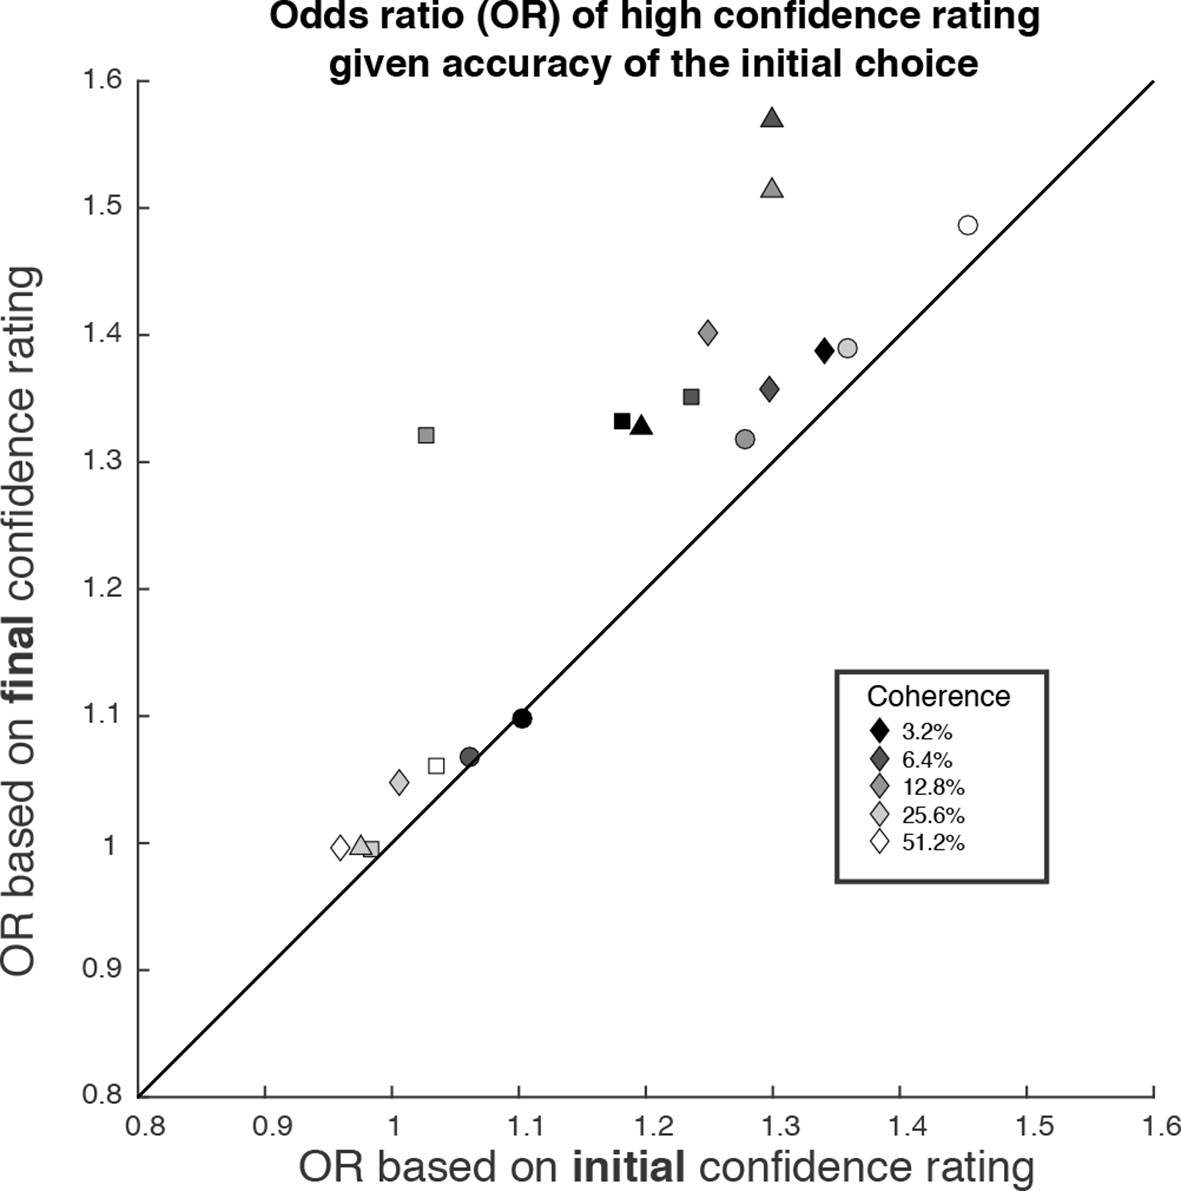
The possibility of change of confidence introduces an apparent dissociation between accuracy and confidence.
The odds ratio (OR) statistic captures the relative tendency to report high confidence on correct versus error trials. The scatter plot compares ORs calculated from the participants’ data using the initial and final confidence report. Both ORs use the correct/error designation for the initial direction decision. The ORs calculated from the initial confidence report establish a baseline: the breakdown of confidence associated with the information that explains the accuracy at each motion strength. The ORs calculated from the final confidence report are larger and might thus be mistakenly interpreted as support for a dissociation between determinants of choice and confidence. Symbol shapes correspond to the four subjects; symbol shading denotes motion strength. An odds ratio can only be calculated if there are error trials (or the ratio is infinite). This necessitated exclusion of one of the points at the highest coherence level.
Author response image 1

Fits to alternative model 1 that uses a threshold on the balance of evidence (BoE) to assign confidence and ignores time.
Graphs follow the same format as in Figure 2 and display the same data (symbols) and axes. The BoE will tend to be greater with longer times. Therefore, this model produces a qualitative mismatch in the middle column. It also predicts that confidence on errors should decrease as a function of motion strength (magenta curves, 3rd column).
Author response image 2
Fits to alternative model 2 that uses a threshold on decision time to assign confidence (shorter decision times are more confident to match the data) and ignores BoE.
The striking failure in the middle column arises because for any criterion, the mean of all decision times greater than this criterion will be large and mean of the times less than this criterion will be small (n.b., the red curve for S3, middle column, is mostly off the graph; only the right end of curve is visible). The other qualitative failures are best appreciated by drawing on intuitions associated with a simpler diffusion model – with symmetric, flat bounds for right and left choices. This is mathematically identical to our competing accumulators but with perfect anti-correlation. In the simpler 1-dimensional model, (1) there is no balance of evidence; (2) the DV is at the level of the upper or lower bound at decision termination, (3) the proportion correct is independent of decision time, and (4) mean RT on correct and error choices are the same for any motion coherence. Based on point 3, we would expect the choice functions in the left column to be identical. They are not exactly the same because our model is a race between two negatively correlated but non-redundant accumulators, and in our particular instantiation (e.g., no reflecting lower bounds), this yields slightly faster errors, which are assigned higher confidence (left column). The same logic applies to the right column.
Tables
Table 1
Parameter fits for the initial decision parameters and post-initiation processing parameters.
| Subject 1 | Subject 2 | Subject 3 | Subject 4 | ||
|---|---|---|---|---|---|
| Initial decision parameters | B | 0.74 | 0.73 | 1.07 | 0.74 |
| κ | 13.64 | 12.86 | 8.69 | 19.50 | |
| μtnd (s) | 0.461 | 0.421 | 0.409 | 0.427 | |
| θ | 0.89 | 1.26 | 0.87 | 1.12 | |
| Post-initiation processing parameters | tpip (s) | 0.395 | 0.235 | 0.390 | 0.285 |
| δθ1 | 0.77 | 1.32 | 1.16 | 0.79 | |
| δθ2 | 0.24 | 0.32 | 0.44 | 0.06 | |
| δθ3 | -0.36 | -0.57 | -0.26 | -0.69 |
Table 2
Pattern of changes of mind for each subject. Total trials performed with percentage of trials for different types of changes of mind. The average additional points earned is the difference in the points earned on change of minds trials compared to those that would have been earned had the subject not changed their mind, divided by the total number of change of mind trials.
| Subject | Total trials | %Trials | Average additional points earned per trial with a change | |||
|---|---|---|---|---|---|---|
| Δconfidence only | Δdecision only | Δconfidence & Δdecision | All changes | |||
| 1 | 9022 | 4.97 | 2.57 | 1.30 | 8.83 | 1.12 |
| 2 | 9023 | 2.78 | 1.31 | 0.40 | 4.49 | 0.90 |
| 3 | 9018 | 1.38 | 0.49 | 0.17 | 2.03 | 0.72 |
| 4 | 5000 | 4.26 | 2.40 | 1.62 | 8.28 | 0.90 |
Download links
A two-part list of links to download the article, or parts of the article, in various formats.
Downloads (link to download the article as PDF)
Open citations (links to open the citations from this article in various online reference manager services)
Cite this article (links to download the citations from this article in formats compatible with various reference manager tools)
A common mechanism underlies changes of mind about decisions and confidence
eLife 5:e12192.
https://doi.org/10.7554/eLife.12192


