Sequential phenotypic constraints on social information use in wild baboons
- University of Cambridge, United Kingdom
- Institute of Zoology, United Kingdom
Figures
Figure 1
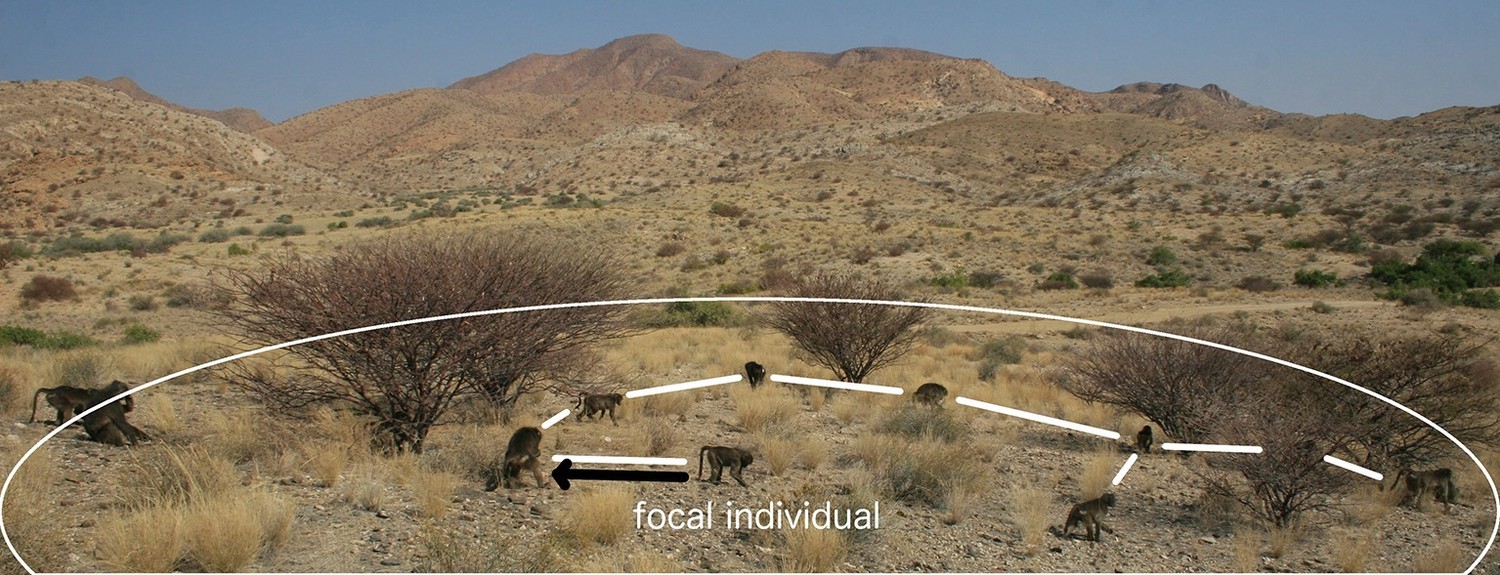
A visual representation of proximity methods used to define a connection.
The black arrow represents a connection via the 5 m nearest neighbour rule; the white lines, connections via the 5 m chain rule; and the white circle represents the 10 m threshold distance for a connection (measures not to scale).
Figure 2 with 1 supplement
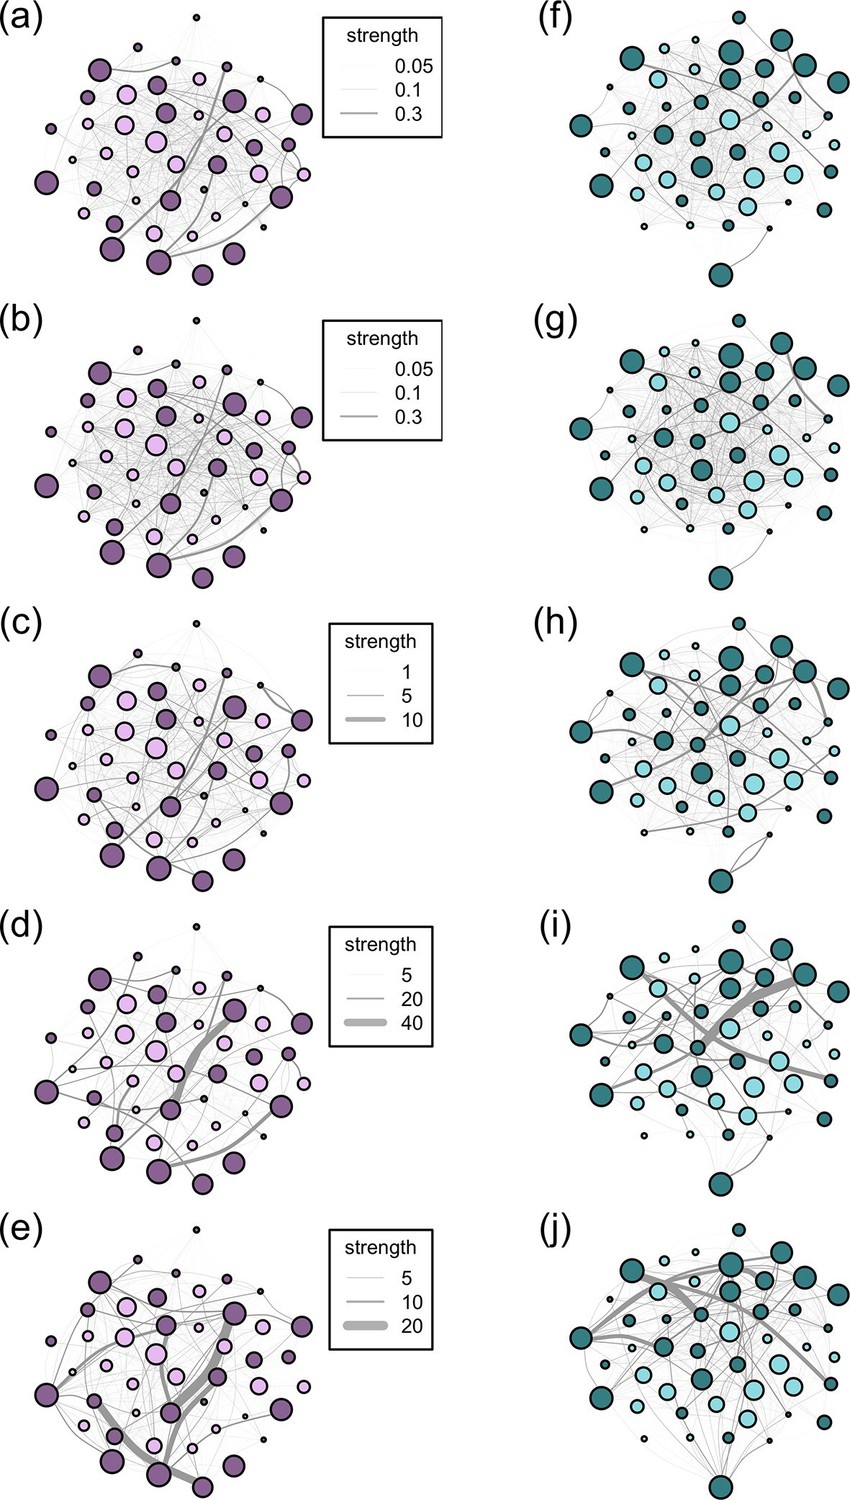
Networks diagrams created from the 5 association rules in two troops of baboons.
Nodes (J troop: purple nodes, panels a-e; L troop: green nodes, panels f-j) represent individual baboons and edges between them indicate the strength of the measured relationship (see key). Presented are the networks based on the 10 m rule (a, f), 5 m chain rule (b, g), directed nearest neighbour rule (c, h), directed grooming interactions (d, i) and directed dominance interactions (e, j). Adults are represented by darker nodes, juveniles by lighter nodes (though we note that age was analysed as a continuous variable). Node size represents individuals’ ranks, where larger nodes are higher ranks. Node positions are conserved between network diagrams in each troop.
Figure 2—figure supplement 1
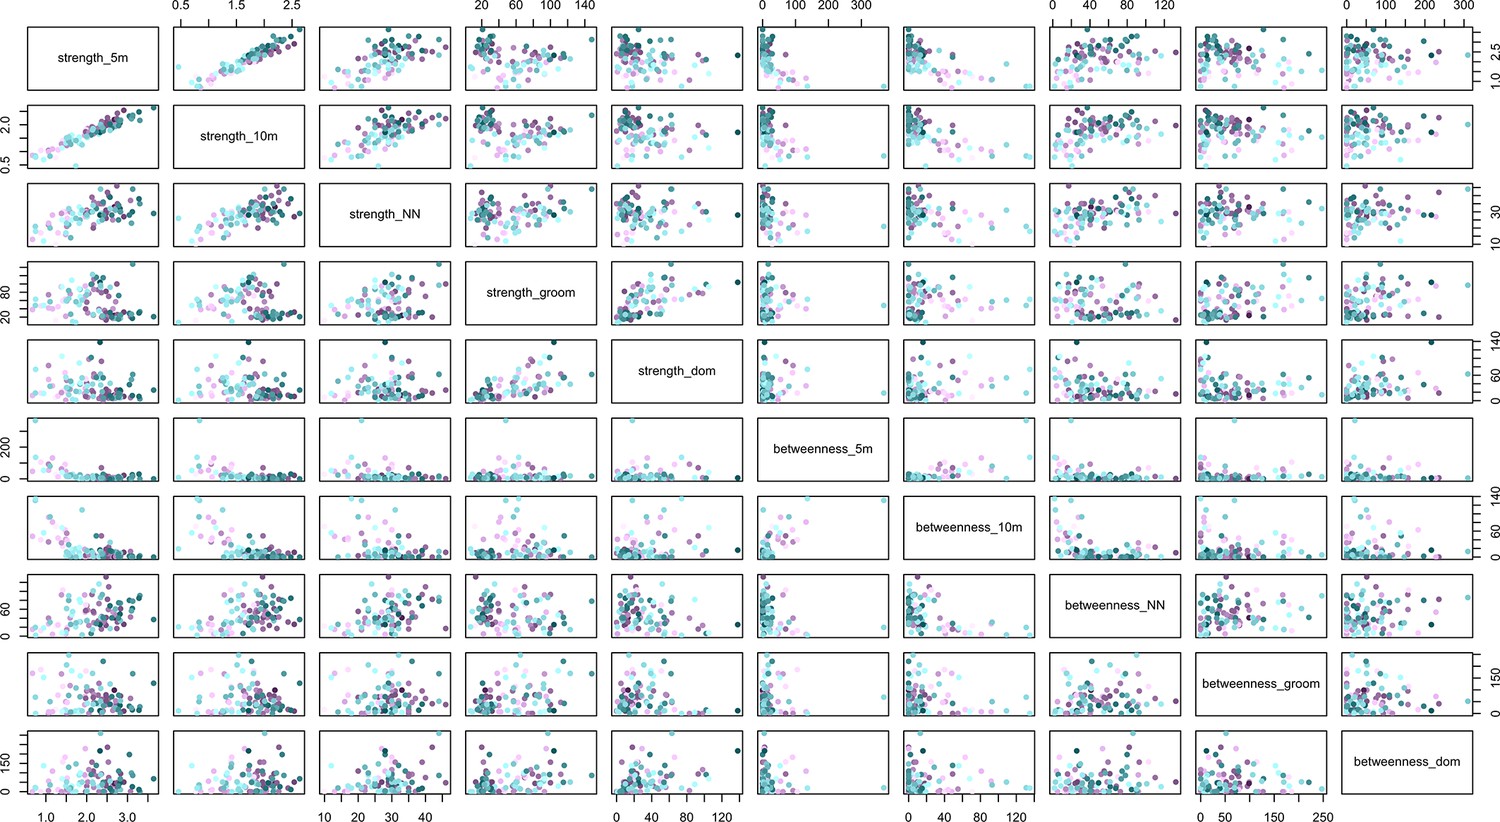
The relationships between social network metrics (strength and betweenness) within and between social networks created with five different rules for defining a connection between individuals.
The rules were the 5 m chain rule (5 m), 10 m proximity (10 m), directed nearest neighbour (NN), directed grooming interactions (groom) and directed dominance interactions (dom). Colouration is conserved from Figures 2 and 3, where J troop is represented by purple points and L troops by green points, and point luminance represents the number of times the individual acquired information (darker nodes acquired social information on more occasions).
Figure 3

The relationships between social network centrality and successive steps of the social information process.
The relationships between social information (c, d) acquired, (e) applied and (f) exploited by wild baboons and their degree strengths in the social networks. Presented are the proximity networks from which degree strengths were calculated for (a) J and (b) L troops, where nodes represent individuals, node size represents the rank of the individual, and node luminance represents the number of times the individual acquired information (darker nodes acquired social information on more occasions; this colouration is conserved throughout the figure). Lines connecting nodes represent the strengths of the connections between dyads where thicker lines are stronger connections (see legend). Presented below the networks is the relationship between (c, d) social information acquired in (c) J and (d) L troops, (e) social information applied and (f) social information exploited (both troops plotted together).
Videos
Video 1
Information diffusion experiments.
The video shows rapid diffusion of information about the location of the food patch after its initial discovery. In the first experiment, several individual baboons successively enter the patch and are supplanted by more dominant individuals. In the second experiment, the patch is discovered by a low ranking female and then monopolised by high ranking juvenile male. The diffusion path is comparatively short. Please note that the videos were used to facilitate data extraction by dictating identities during rapid diffusions; we did not aim to capture all activity in the field of view of the camera.
Video 2
Information acquisition, application and exploitation.
The video shows an adult male monopolising the food patch, surrounded by juveniles who are obviously aware of the location of the patch, but cannot enter because of their lower rank. After the patch is depleted, the adult male exits the patch and many of the individuals subsequently apply the information they have acquired, even though it is outdated. One juvenile female (just off the bottom of the screen), has the lowest rank in the troop and could not apply the social information she had acquired. In this case, there was no social information exploitation, because the patch discoverer (the adult male) depleted the patch.
Video 3
Tolerated queuing, co-feeding and vocal protest.
The first video (tolerated queuing) shows an adult male monopolising the food patch, with adult females and juvenile males and females queuing to check the patch after the male leaves. They enter the patch in the same order in which they were queuing. Two lower ranking adult females leave the area after queuing without entering the patch, demonstrating these females’ unwillingness to apply the social information they had acquired after patch depletion. The second video (tolerated co-feed followed by protest) shows the initial patch discovery by an adult female who has come within 1 m of the patch (directly after she has been startled by the higher-ranking juvenile male foraging behind her). The pair subsequently co-feed in the patch, before the juvenile male vocally protests with pant-grunting.
Video 4
Information diffusion through a social network.
The animation shows the diffusion of information about the location of one of the food patches through the 5 m proximity social network of L troop. The nodes are scaled to the ranks of the individuals; the lines connecting the nodes are indicative of the strength of the connection between individuals. The nodes turn from pink to purple as they acquire social information about the location of the food patch by the initial discoverer (the original purple node).
Tables
Table 1
The information use sequence: definitions and examples.
| Stage | Definition | Example(s) of stage |
|---|---|---|
| Acquisition | An individual gains knowledge | 1. Gaining knowledge of the location of a food patch. 2. Gaining knowledge of the location or form of a novel task. |
| Application | An individual uses the information that it has acquired in a relevant (but not necessarily successful) way | 1. Entering a food patch. Because information can become outdated, ‘application’ can occur even after the patch has been fully depleted, leading to no reward. 2. Using stimulus or local enhancement to manipulate a novel task, but not necessarily successfully. |
| Exploitation | An individual successfully uses information that it has acquired and applied to gain a benefit | 1. Gaining food from a patch. 2. Solving a novel task. |
Table 2
Results of Spearman rank correlations testing whether there is a correlation between strengths and betweennesses in social networks created with different proximity and interaction rules. Presented is the rule, test statistic (S), rho (ρ), and p-value.
| Rule | S | ρ | p |
|---|---|---|---|
| 5 m chain | 217907.6 | -0.57 | <0.001 |
| 10 m | 220939.0 | -0.59 | <0.001 |
| Nearest neighbour directed | 81586.8 | 0.41 | <0.001 |
| Nearest neighbour | 9218.6 | 0.43 | 0.003 |
| Groom directed | 98412.9 | 0.30 | 0.005 |
| Groom | 15346.0 | 0.05 | 0.72 |
| Dominance directed | 67342.1 | 0.51 | <0.001 |
| Dominance | 7950.4 | 0.51 | <0.001 |
Table 3
Correlation matrix of the phenotypes used in the analyses. Presented are the Spearman’s rank correlation (S) estimates.
| Phenotype | Sexa | Age | Rank | Boldness | Proximityb | Groomc |
|---|---|---|---|---|---|---|
| Sex | 1 | |||||
| Age | -0.49 | 1 | ||||
| Rank | 0.43 | 0.16 | 1 | |||
| Boldness | 0.16 | -0.55 | -0.24 | 1 | ||
| Proximity | 0.29 | -0.60 | -0.02 | 0.51 | 1 | |
| Groom | -0.58 | 0.63 | 0.15 | -0.46 | -0.29 | 1 |
-
acoded as an integer: females = 0, male = 1.
-
b, cRefer to strength in the identified network.
Table 4
Comparisons of the additive and multiplicative OADA models with social transmission versus the asocial learning model.
| Model | Add/Multi | Predictor network | df | LogLik | AICC |
|---|---|---|---|---|---|
| Social transmission | Add | 10 m | 5 | 1984.7 | 3979.4 |
| Social transmission | Multi | 5 | 1979.4 | 3968.9 | |
| Social transmission | Add | 5 m | 5 | 1992.9 | 3995.9 |
| Social transmission | Multi | 5 | 1991.7 | 3993.4 | |
| Social transmission | Add | NN directed | 5 | 2037.4 | 4085.0 |
| Social transmission | Multi | 5 | 2036.6 | 4083.3 | |
| Social transmission | Add | NN | 5 | 2024.4 | 4059.0 |
| Social transmission | Multi | 5 | 2020.5 | 4051.0 | |
| Social transmission | Add | Groom directed | 5 | 2045.7 | 4101.4 |
| Social transmission | Multi | 5 | 2043.0 | 4096.1 | |
| Social transmission | Add | Groom | 5 | 2045.2 | 4100.6 |
| Social transmission | Multi | 5 | 2044.8 | 4099.7 | |
| Social transmission | Add | Dom directed | 5 | 2076.8 | 4163.8 |
| Social transmission | Multi | 5 | 2076.8 | 4163.8 | |
| Social transmission | Add | Dom | 5 | 2076.6 | 4163.3 |
| Social transmission | Multi | 5 | 2076.7 | 4163.6 | |
| Asocial learning | - | - | 4 | 2076.8 | 4161.8 |
-
The predictor networks were the 10 m rule (10 m), 5 m chain rule (5 m), both of which were undirected, directed and undirected nearest neighbour rule (NN), directed and undirected grooming interactions (Groom) and directed and undirected dominance interactions (Dom). Presented are the models, degrees of freedom (df), -log-likelihoods (LogLik), corrected Akaike information criteria (AICC). Add/Multi refers to whether the model was additive (Add) or multiplicative (Multi).
Table 5
Parameter estimates of individual-level variables of the competing OADA models for asocial effects on social transmission in the 10 m networks.
| Model | Coefficient | Estimate | S.E. |
|---|---|---|---|
| 1 | Social transmission | 0.999 | |
| Sex | 0.132 | 0.107 | |
| Rank | 0.498 | 0.174 | |
| Age | -0.024 | 0.012 | |
| 2 | Social transmission | 0.999 | |
| Boldness | 0.001 | 0.001 | |
| Age | -0.020 | 0.011 | |
| 3 | Social transmission | 0.999 | |
| Sex | 0.328 | 0.086 | |
| 4 | Social transmission | 0.999 | |
| Sex | 0.250 | 0.093 | |
| Rank | 0.353 | 0.158 |
-
Presented are the bounded social transmission estimates (for completeness), the fixed effects in the models and their standard errors (S.E.).
Table 6
Parameter estimates of the minimal models investigating the effect of proximity and grooming strength on social information (i) acquisition, (ii) application and (iii) exploitation.
| Response | Predictor | Effect size | S.E. | t | P |
|---|---|---|---|---|---|
| Social information acquisition | Intercept | 0.23 | 0.21 | 1.11 | 0.27 |
| Proximity strength | 0.66 | 0.07 | 8.87 | <0.001 | |
| Social information application | Intercept | -1.30 | 0.38 | -3.40 | <0.001 |
| Proximity strength | 0.65 | 0.10 | 6.45 | <0.001 | |
| Grooming strength | 0.01 | <0.001 | 4.74 | <0.001 | |
| Sexa | 0.84 | 0.15 | 5.48 | <0.001 | |
| Social information exploitation | Intercept | -2.43 | 0.39 | -6.17 | <0.001 |
| Grooming strength | 0.02 | <0.001 | 4.67 | <0.001 | |
| Sexa | 0.73 | 0.33 | 2.21 | 0.03 | |
| Boldness | 0.01 | <0.001 | 3.74 | <0.001 | |
| Rank | 1.39 | 0.51 | 2.71 | 0.01 |
-
Presented are the predictor variables, their effect sizes, standard errors (S.E.), t values and p-values.
-
aReference category: female
Additional files
-
Supplementary file 1
Comparisons of the different models used to assess the effect of individual-level variables on the transmission of information among individuals, with ∆AICc <2 considered to have good support.
Shown are the combinations of individual-level variables, whether the model was multiplicative, additive or neither (when the individual-level variables were not included) (model type), whether individual-level variables were included (0 = no, 1 = yes); whether the process was modelled as a social or asocial diffusion (social/asocial); the AICc of the model; the difference from the AICc of the best model (∆AICc); the support for the model (model weight); and the relative weight of the model in comparison to the model set.
- https://doi.org/10.7554/eLife.13125.017
Download links
A two-part list of links to download the article, or parts of the article, in various formats.
Downloads (link to download the article as PDF)
Open citations (links to open the citations from this article in various online reference manager services)
Cite this article (links to download the citations from this article in formats compatible with various reference manager tools)
Sequential phenotypic constraints on social information use in wild baboons
eLife 5:e13125.
https://doi.org/10.7554/eLife.13125


