Resistome diversity in cattle and the environment decreases during beef production
- Colorado State University, United States
- Agriculture and Agri-Food Canada Research Centre, Canada
- University of Saskatoon, Canada
- University of Colorado Denver School of Medicine, United States
Figures
Figure 1
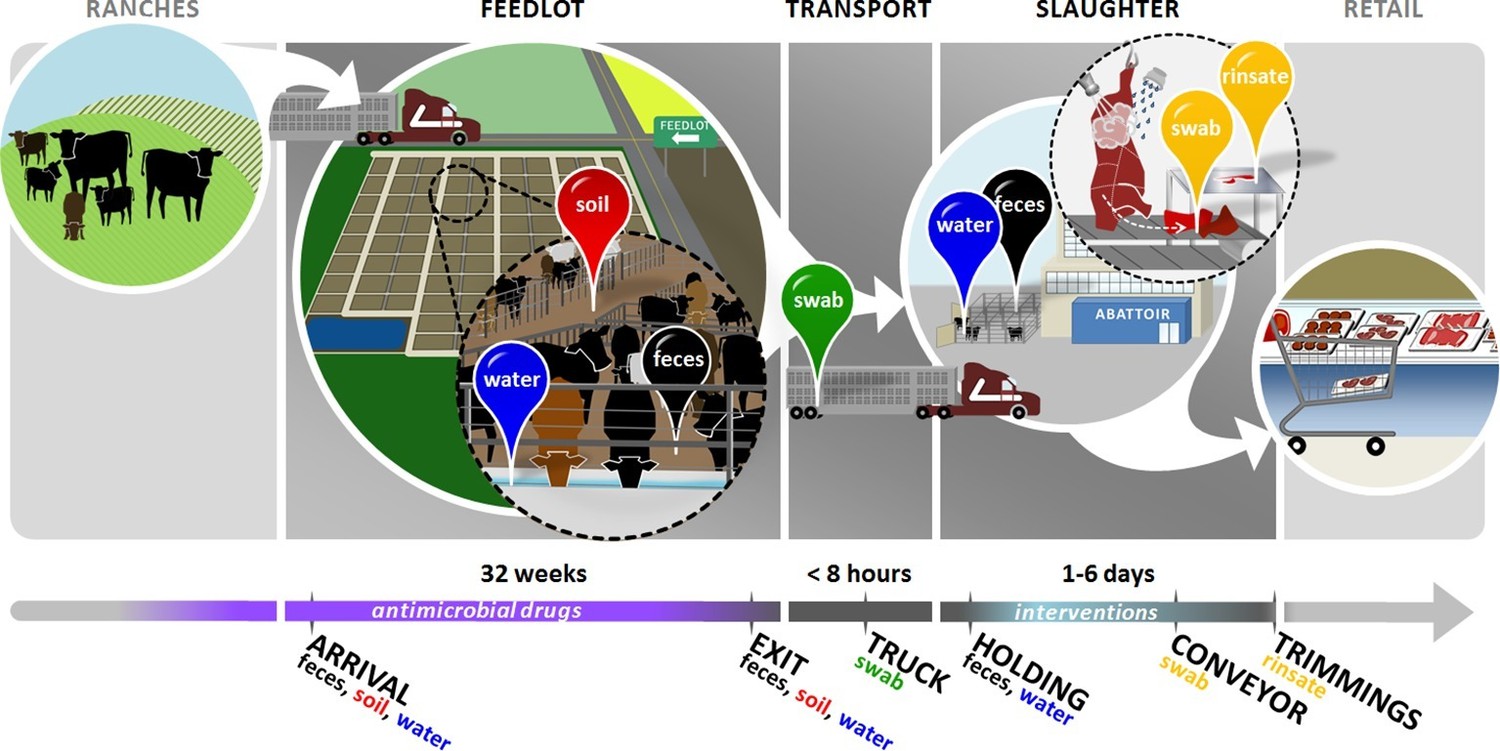
Overview of sampling design.
Cattle in this study were born on ranches and entered the feedlots between 3 and 12 months of age. In the feedlots, we collected pooled fecal (black pin), soil (red pin), and drinking water (blue pin) samples from 2 pens of cattle in each of 4 feedlots. These samples were collected once around the time that study cattle arrived in the feedlot ('arrival'), and then once when the same cattle had reached slaughter weight and were ready to exit the feedlot ('exit'). Study cattle were then loaded onto transport trucks for shipment to the abattoir. Pooled swabs (green pin) from the inside walls of the transport trucks were collected immediately after the cattle had been unloaded at the abattoir ('truck'). Cattle were then placed into a holding pen outside of the abattoir, where pooled fecal (black pin) and drinking water (blue pin) samples were collected ('holding'). Cattle then entered the abattoir, where they were humanely slaughtered and their carcasses disassembled into beef products for retail. At the end of this process, we collected swabs (yellow pin) from the conveyor belts used to move carcass parts ('conveyor'), as well as rinsates (yellow pin) of the carcass trimmings used to make ground beef ('trimmings'). See Figure 1—source data 1 for sampling details, including exact sampling dates for all 8 pens in this study.
-
Figure 1—source data 1
Sample collection details, by location, sample matrix and pen.
- https://doi.org/10.7554/eLife.13195.004
Figure 2
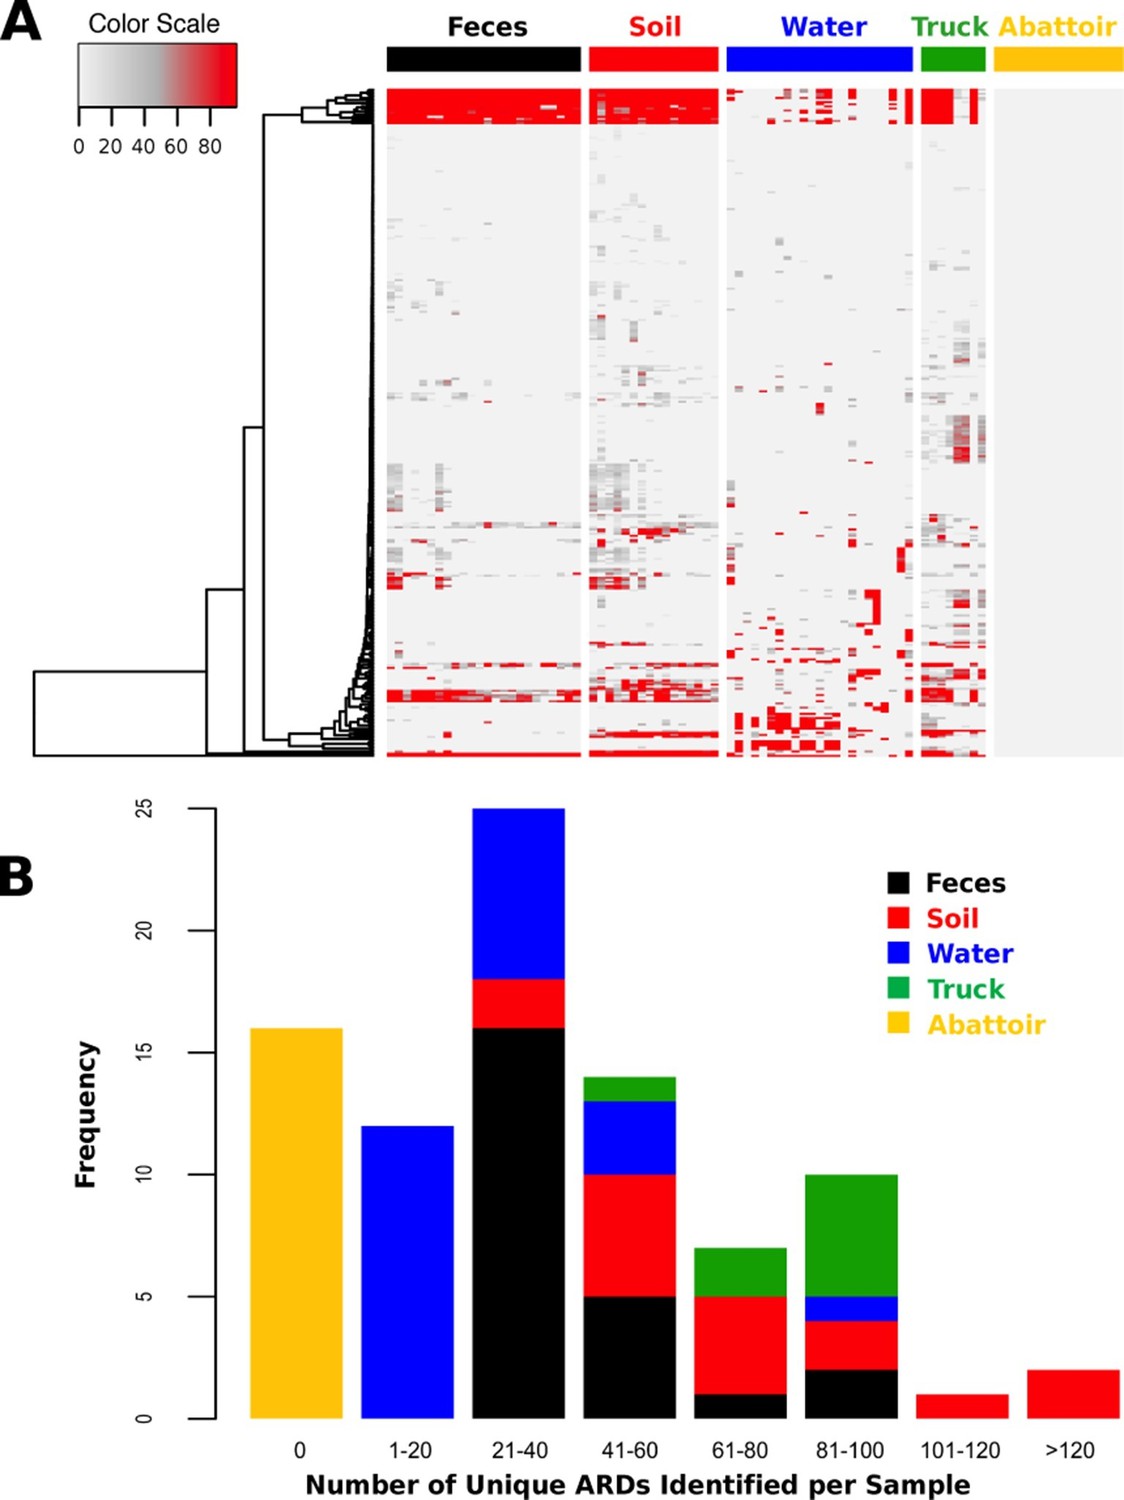
ARD abundance and frequency, by sample type.
(A) Heatmap of the 319 ARDs (rows) identified in 87 samples (columns) collected from the beef production system. Columns are grouped by sampling location but are unclustered. ARDs are clustered along rows using Euclidean distances with complete linkage. ARD names by row can be viewed in the source data for Figure 2. Color scale values indicate the number of normalized alignments per ARD per sample. (B) Histogram of unique ARDs identified per sample (N=87). See Figure 2—source data 1 for raw count matrix of ARDs by sample, which was used to produce heatmap and histogram.
-
Figure 2—source data 1
Raw and normalized count matrix of ARDs (rows) identified by sample (columns).
- https://doi.org/10.7554/eLife.13195.007
Figure 3
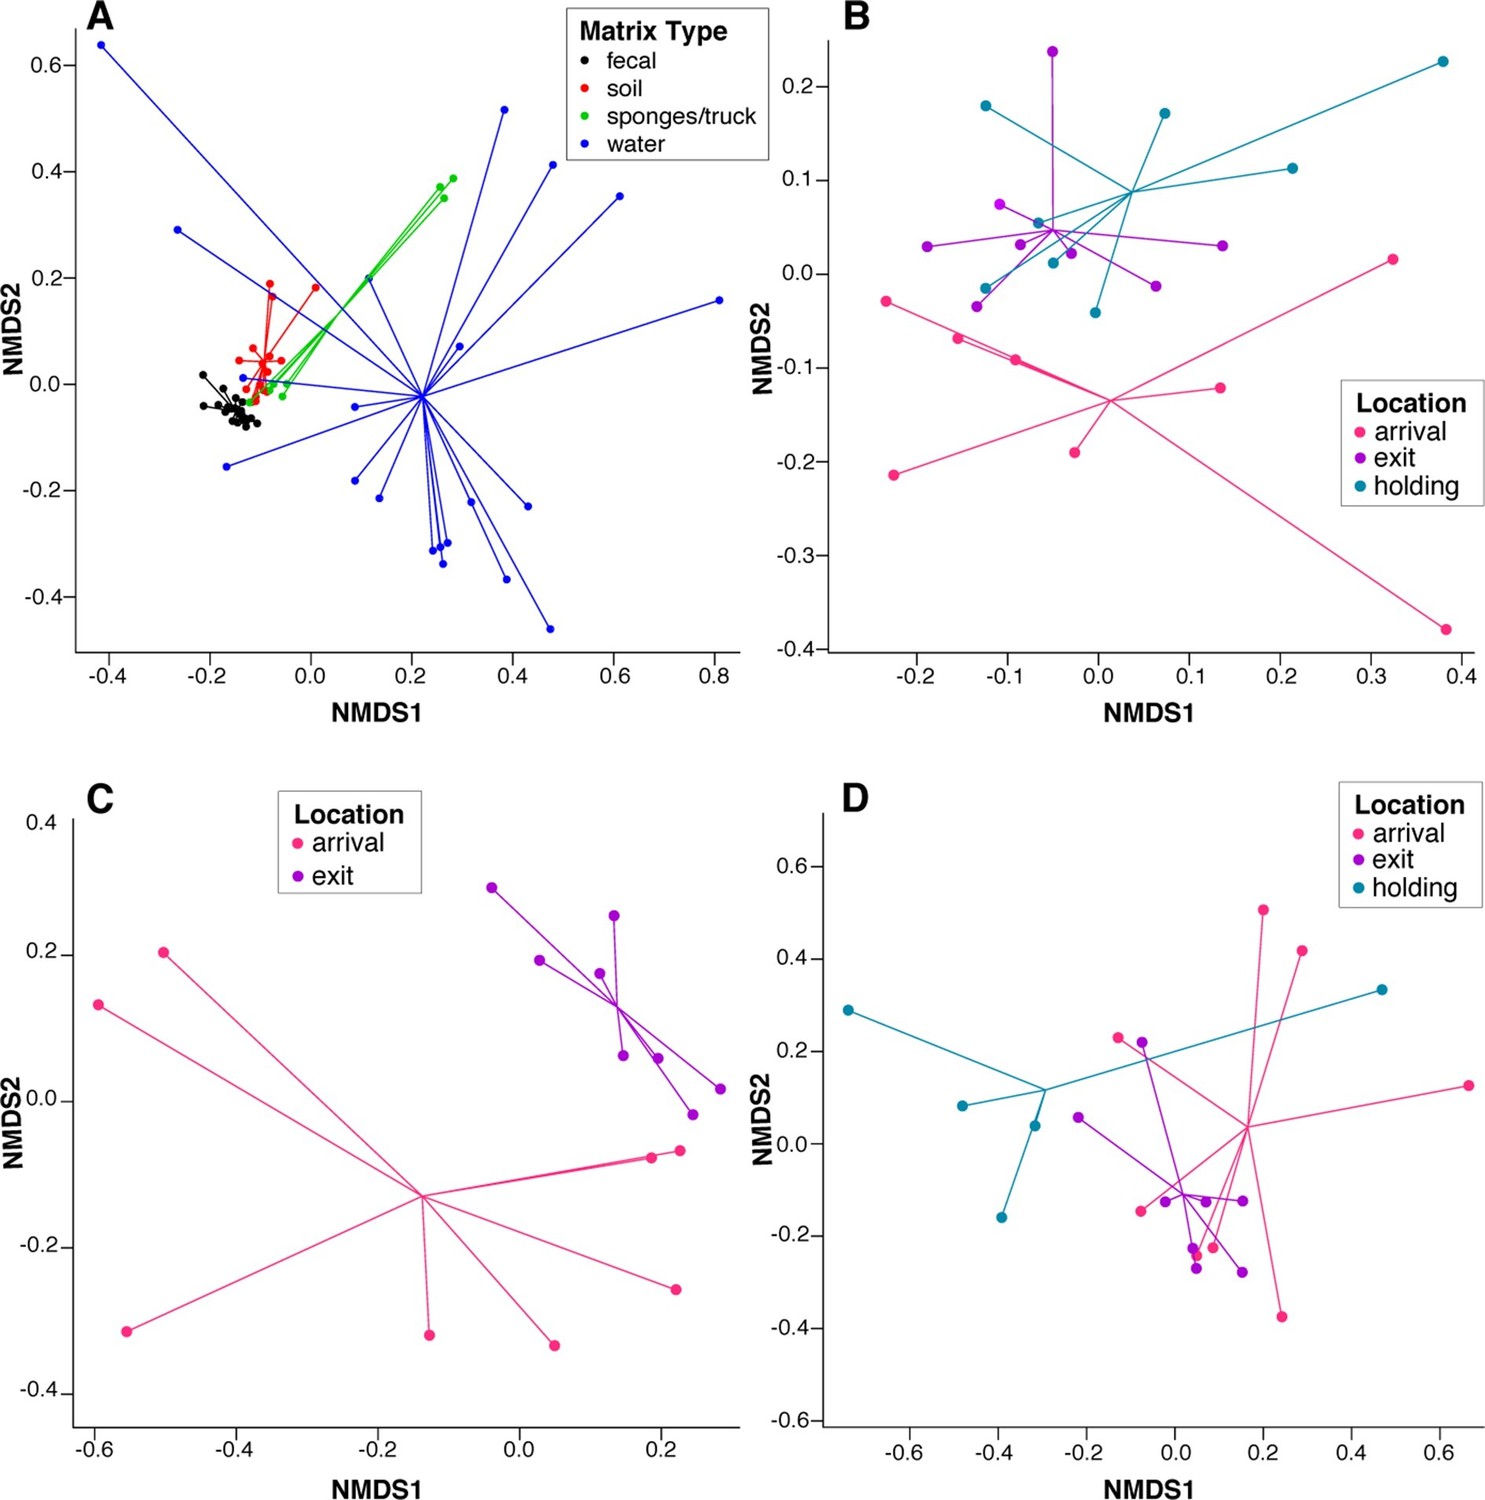
NMDS ordination plots of ARD composition, by sample type and location.
Non-metric multidimensional scaling (NMDS) ordination plots of pre-slaughter sample ARD composition, depicting significant sample separation by (A) matrix (Stress=0.13, R=0.41, p=0.001), and location within (B) feces (Stress = 0.10, R=0.03, p=0.04), (C) soil (Stress = 0.05, R=0.34, p=0.006) and (D) water (Stress=0.10, M=0.29, p=0.005).
Figure 4
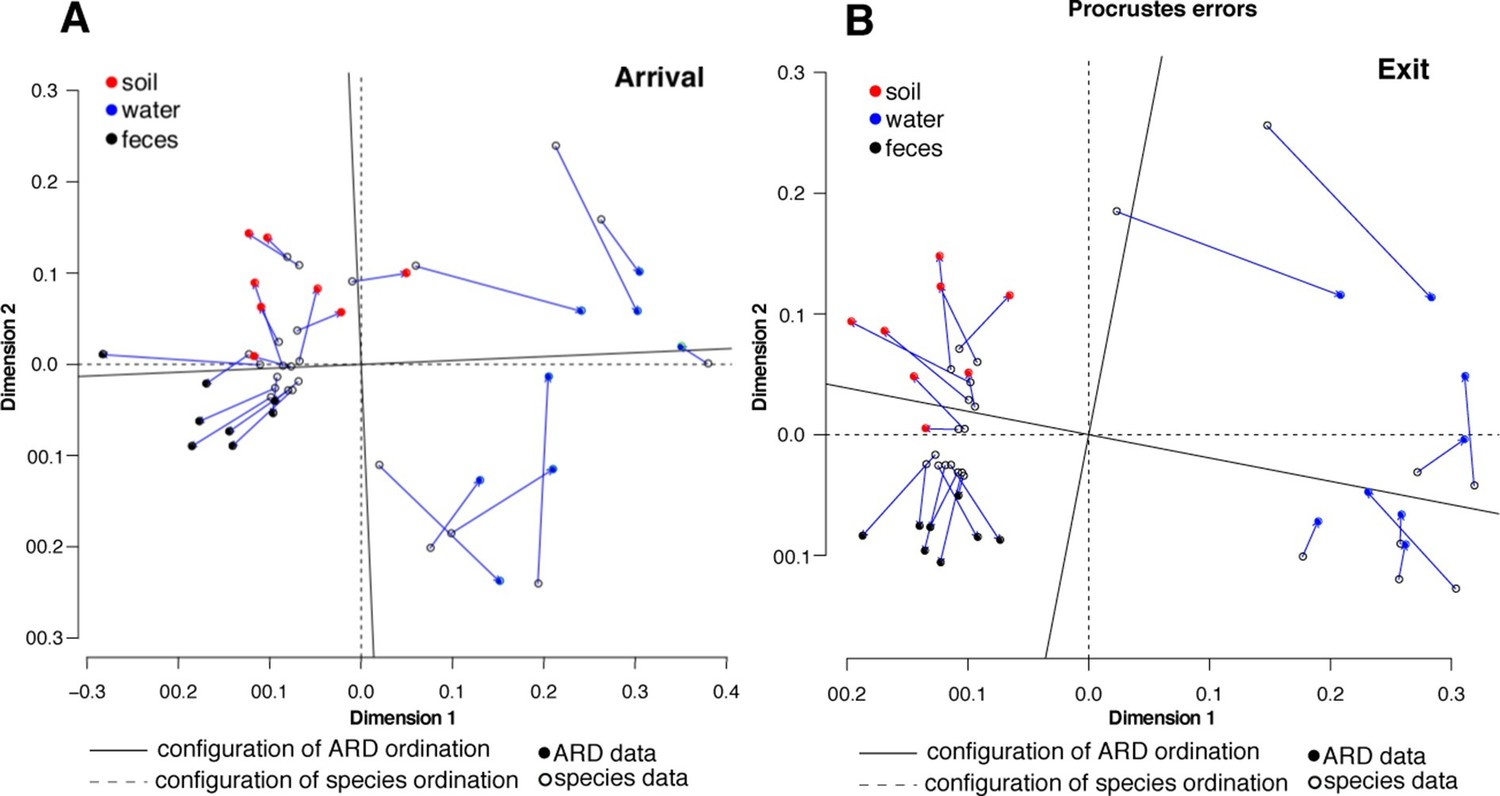
Procrustes analysis of ARD content (filled circles) and species composition (open circles) at arrival (A) and exit (B) using Hellinger transformation and NMDS ordination (Legendre and Gallagher, 2001).
Stress values for ARD ordination at arrival and exit were 0.08 and 0.03, respectively, and for microbiome species ordination at arrival and exit were 0.06 and 0.07, respectively. Soil (red), water (blue) and fecal (black) samples clustered significantly in the microbiome and resistome data. Procrustes configurations were correlated in the arrival and exit samples, but less so in the exit samples (M2 = 0.29 and 0.18, respectively).
Figure 5

Changes in prevalence of resistance mechanisms during the feedlot period (arrival to exit).
Proportion of arrival (n=8 soil, 8 fecal, 8 water) and exit (n=8 soil, 8 fecal, 8 water) samples that contained at least one ARD in each resistance mechanism (n=33), grouped by resistance class.
Figure 6
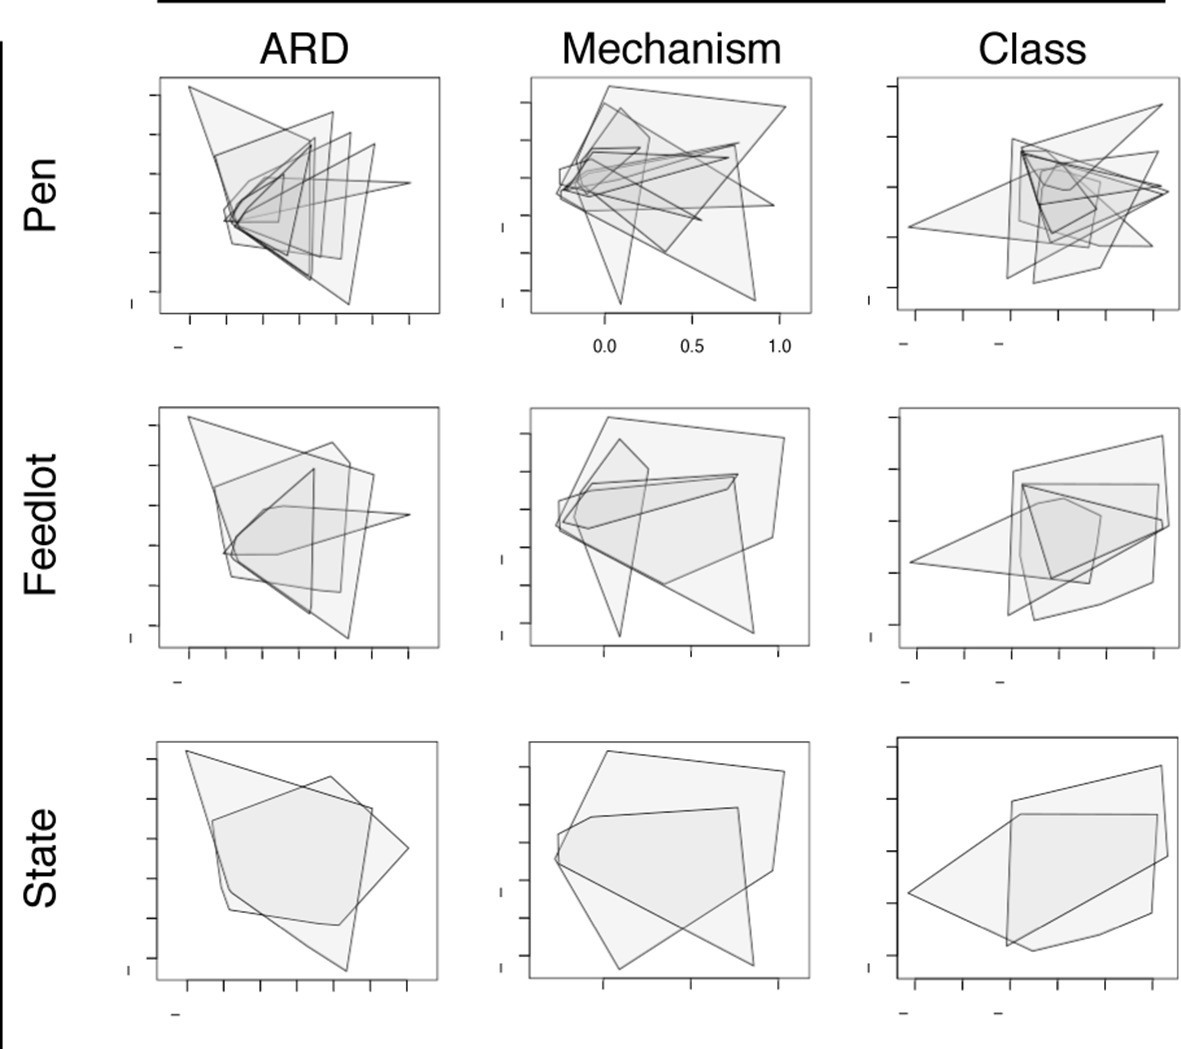
Non-metric multidimensional scaling (NMDS) ordination plots at the ARD, mechanism and class levels, visualized by pens (n=8), feedlots (n=4) and states (n=2).
In each NMDS plot, a polygon corresponds to one unit (i.e., pen, feedlot or state) and represents the convex hull for that unit (i.e. the smallest amount of space within the graph that contains all points (or samples) within that unit). To view results of NMDS ordination, as well as adonis and anosim statistics, see Figure 6—source data 1.
-
Figure 6—source data 1
NMDS ordination, adonis, and anosim results at the ARD, mechanism and class levels, by pen, feedlot, and state variables.
- https://doi.org/10.7554/eLife.13195.013
Figure 7 with 1 supplement
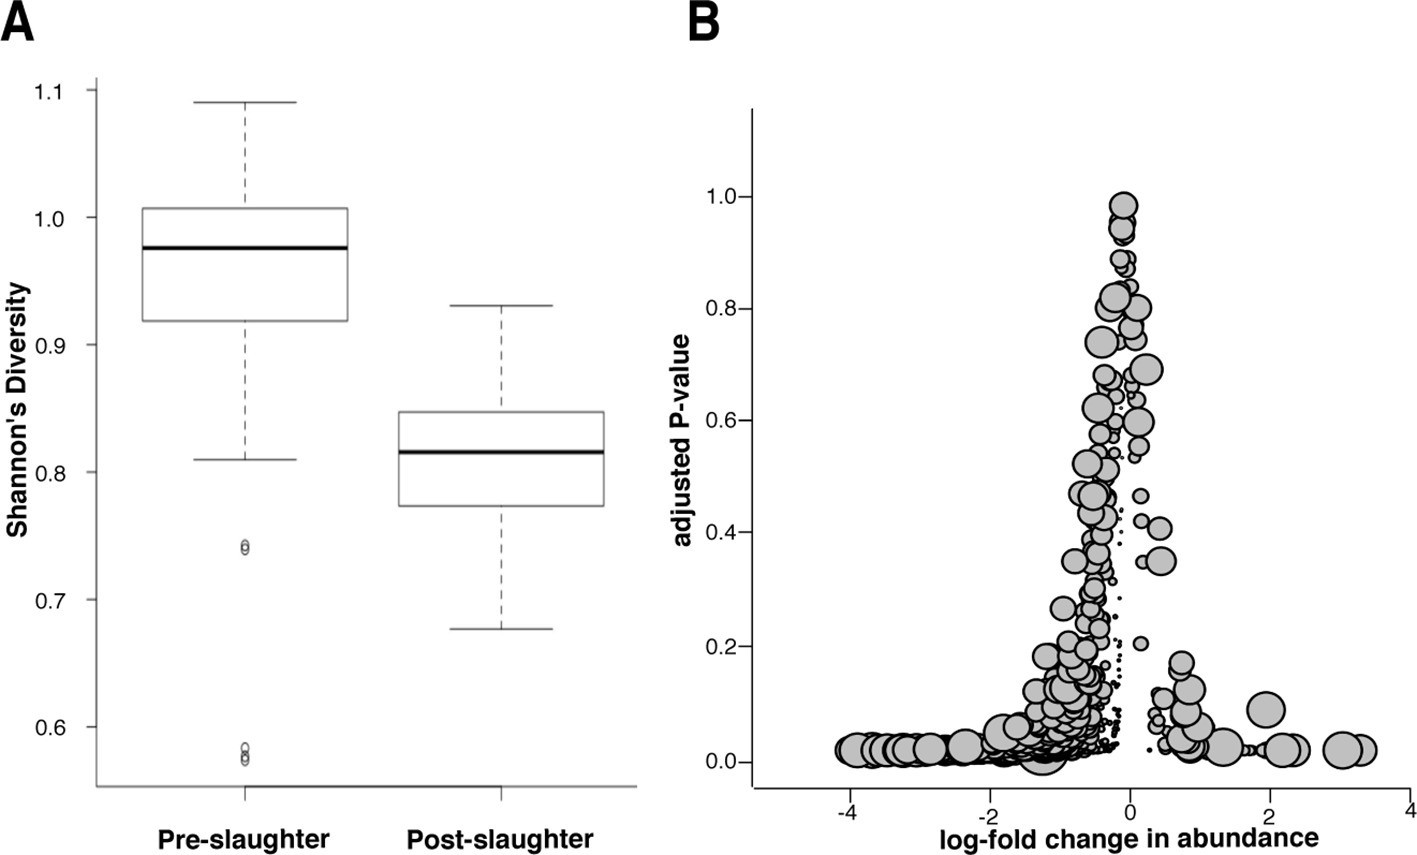
Microbiome changes from pre- to post-slaughter in all samples.
(A) Boxplot of Shannon’s diversity at the species level, pre- vs. post-slaughter across all sample matrices. Shannon’s diversity was significantly lower in post-slaughter samples when tested using Wilcoxon paired rank test (P<0.0001). See source data for Figure 7 (sheet 'Figure 7A') for Shannon’s Diversity Index by sample, which was used to produce boxplots. (B) Log2-fold change in abundance of genera from pre- to post-slaughter versus adjusted P–value, across all samples matrices. Dot size is proportional to the average abundance of the genus across all samples. For taxa table and counts used to produce model of log2-fold change in abundance, see Figure 7—source data 1 (sheet 'Figure 7B taxa table'); for model output, see Figure 7—source data 1 (sheet 'Figure 7B model output').
-
Figure 7—source data 1
Shannon’s diversity, taxa table and model output for Figure 7.
Sheet 1 ('Figure 7A') includes sample metadata and Shannon's Diversity Index calculated at the species level. Sheet 2 ('Figure 7B taxa table') includes the taxa count matrix, by sample, that was used to model log2-fold changes in abundance for Figure 7B and Figure 7—figure supplement 1. Sheet 3 ('Figure 7B model output') shows model output for log2-fold change in abundance at the genus level across all pre- and post-slaughter samples. Sheet 4 ('Figure 7 supp. Model output') shows model output for log2-fold change in abundance at the genus level between pre- and post-slaughter swab samples.
- https://doi.org/10.7554/eLife.13195.015
Figure 7—figure supplement 1
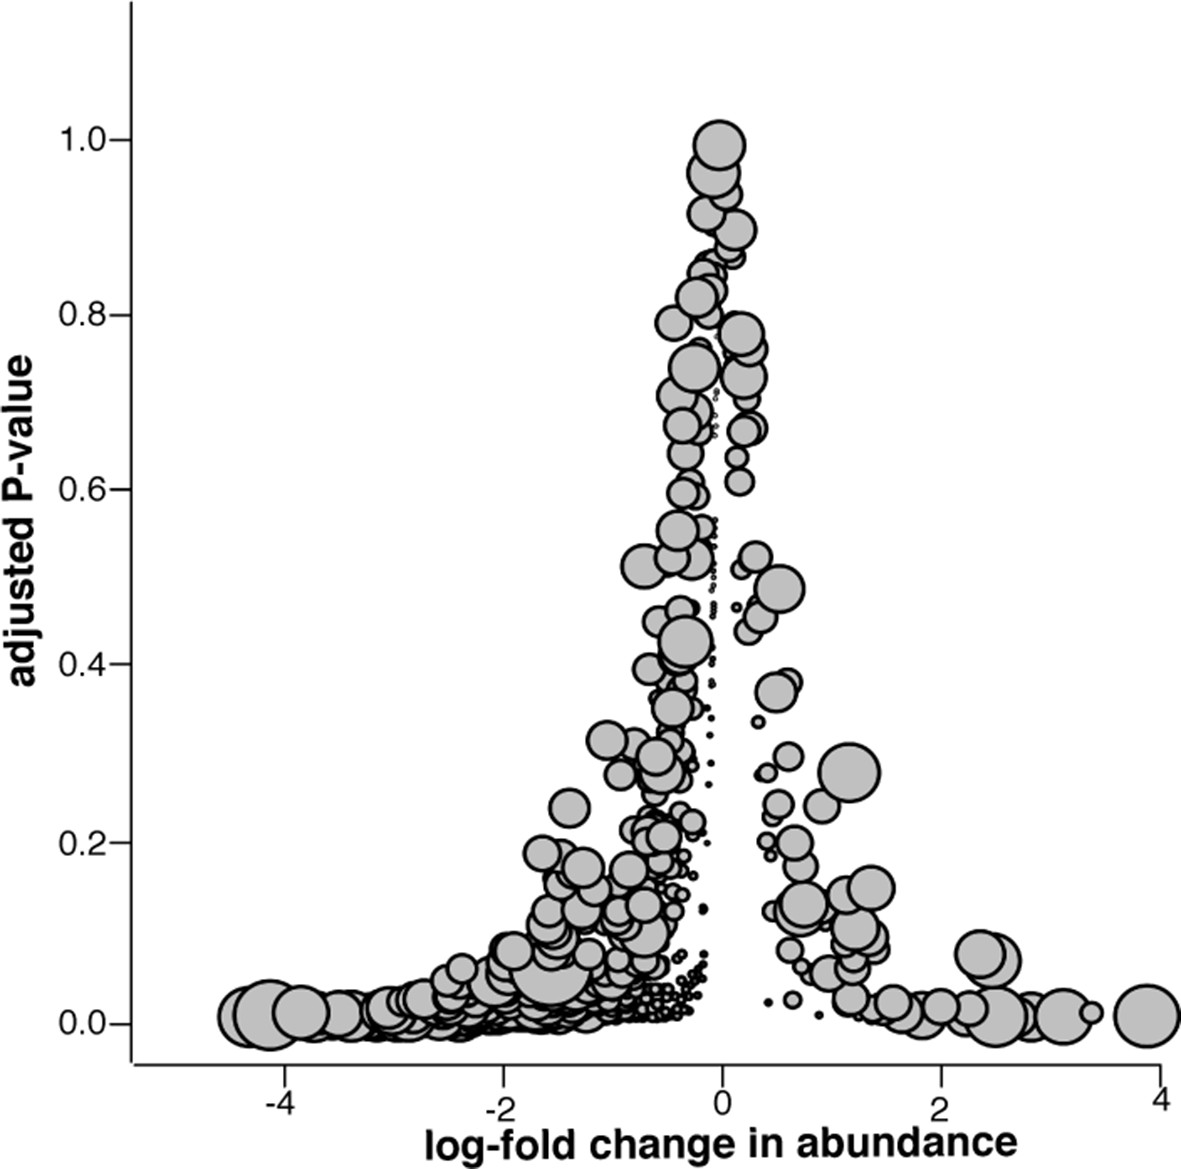
Microbiome changes from pre- to post-slaughter in swab samples only.
Log2-fold change in abundance of genera from pre- to post-slaughter versus adjusted P–value, using only swab samples. Dot size is proportional to the average abundance of the genus across all samples. See Figure 7—source data 1 (sheet 'Figure 7 supp. model output') to view model output for the genus-level analysis of log2-fold change in abundance for swab samples only.
Tables
Table 1
Antimicrobial drug usage in the study population.
| Drug (dosage) | Drug Class | Primary Reason for Use | Number of Animals treated (%) | |||||||
|---|---|---|---|---|---|---|---|---|---|---|
| Pen A | Pen B | Pen C | Pen D | Pen E | Pen F | Pen G | Pen H | |||
| Tylosin phosphate (11 mg/kg diet dry matter)a | Macrolide | Liver abscess prevention | 244 (100) | 281 (100) | 152 (100) | 189 (100) | 230 (100) | 230 (100) | 265 (100) | 150 () |
| Tulathromycinb (2.5 mg/kg BWc) | Macrolide | BRDd Treatment | 15 (6.1) | 16 (5.7) | 12 (7.9) | 3 (1.6) | 19 (8.3) | 3 (1.3) | 8 (3.0) | 5 (3.3) |
| Oxytetracyclinee (20 mg/kg BW) | Tetracycline | BRD Treatment | 1 (0.4) | 1 (0.4) | 43 (28.3) | 9 (4.8) | 6 (2.6) | 2 (0.9) | 13 (4.9) | 10 (6.7) |
| Oxytetracycline and Flunixin meglumineb (30 mg/kg BW and 2 mg/kg BW) | Tetracycline | BRD Treatment | 0 (0.0) | 0 (0.0) | 0 (0.0) | 0 (0.0) | 1 (0.4) | 0 (0.0) | 0 (0.0) | 0 (0.0) |
| Danofloxacin mesylateb (8 mg/kg BW) | Fluoroquinolone | BRD Treatment | 0 (0.0) | 4 (1.4) | 1 (0.7) | 0 (0.0) | 4 (1.7) | 7 (3.0) | 2 (0.8) | 0 (0.0) |
| Enrofloxacinb (7.7 mg/kg BW) | Fluoroquinolone | BRD Treatment | 0 (0.0) | 0 (0.0) | 0 (0.0) | 0 (0.0) | 0 (0.0) | 0 (0.0) | 2 (0.8) | 0 (0.0) |
| Ceftiofur sodiume (1 mg/kg BW) | β-lactam | BRD Treatment | 0 (0.0) | 0 (0.0) | 2 (1.3) | 0 (0.0) | 0 (0.0) | 0 (0.0) | 0 (0.0) | 0 (0.0) |
| Ceftiofur crystalline free acidb (6.6 mg/kg BW) | β-lactam | BRD Treatment | 0 (0.0) | 0 (0.0) | 0 (0.0) | 0 (0.0) | 0 (0.0) | 0 (0.0) | 4 (1.5) | 1 (0.7) |
-
aThis AMD was in all rations of all cattle for the duration of the feeding period
-
bEach treated animal received a dose that persisted in target tissues at effective therapeutic concentrations for 3 days, according to the drug label.
-
cBW = body weight
-
dBRD = bovine respiratory disease
-
eEach treated animal received a dose that persisted in target tissues at effective therapeutic concentrations for 1 day, according to the drug label.
Table 2
ARDs to critically important antimicrobials that were specifically searched for in all 87 samples.
| Classification | Group | ARD ID (database) | Sample Type, Location | Alignment characteristics |
|---|---|---|---|---|
| Carbapenemases | bla(OXA) | Bla)OXA-347:JN086160 (ARG-ANNOT)a (Bla)OXA-235:JQ820240 (ARG-ANNOT) | 1 x water, holding 1 x soil, arrival 1 x soil, arrival | 100% nucleotide homology with reference across ≥ 80% of gene (≥ 1x coverage) 100% nucleotide homology to KSG, FGN and STFK motifs |
| bla(SME) | Not identified | Not identified | Not identified | |
| bla(IMI) | Not identified | Not identified | Not identified | |
| bla(NDM) | Not identified | Not identified | Not identified | |
| bla(GES) | Not identified | Not identified | Not identified | |
| bla(KPC) | Not identified | Not identified | Not identified | |
| bla(cphA)b | cphA1_2_AYAY261377 (Resfinder) | 3 x water, holding | 100% amino acid homology to reference (4 silent substitutions) | |
| Extended-spectrum β-lactamase | bla(TEM) | (Bla)TEM-116:AY425988 (ARG-ANNOT) | 1 x water, holding | 100% nucleotide homology with reference across ≥ 80% of gene (≥ 1x coverage) |
| bla(SHV) | Not identified | Not identified | Not identified | |
| bla(CTX-M) | Not identified | Not identified | Not identified | |
| bla(CMY) | Not identified | Not identified | Not identified | |
| Quinupristin-dalfopristin resistance | vga/vat | GQ205627.2.gene3 (CARD) AND (MLS)VgaD:GQ205627:1394-2971:1578 | 1 x soil, arrival | 100% nucleotide homology to Walker A and B motifs; silent substitution in RSGG motif 100% nucleotide homology to LβH hexapeptide repeat domain |
| Multi-drug resistance to PhLOPSA c | cfr | (MLS)CfrA:AM408573 (ARG-ANNOT) | 4 x swab, truck (all in Texas) | 100% nucleotide homology with reference across ≥ 95% of gene (≥ 1x coverage) |
-
aNote that phenotypic resistance to carbapenems has not been confirmed for this ARD
-
bbla(cphA) is a strict carbapenemase
-
cConfers multi-drug resistance to phenicol, lincosamide, oxazolidinones (linezolid), pleuromutilins, and streptogramin A
Additional files
-
Supplementary file 1
Sequencing, filtering and host removal statistics for all samples.
- https://doi.org/10.7554/eLife.13195.017
-
Supplementary file 2
List of 319 ARDs identified across all 87 samples.
- https://doi.org/10.7554/eLife.13195.018
-
Supplementary file 3
Resistance classification by class and mechanism
- https://doi.org/10.7554/eLife.13195.019
Download links
A two-part list of links to download the article, or parts of the article, in various formats.
Downloads (link to download the article as PDF)
Open citations (links to open the citations from this article in various online reference manager services)
Cite this article (links to download the citations from this article in formats compatible with various reference manager tools)
Resistome diversity in cattle and the environment decreases during beef production
eLife 5:e13195.
https://doi.org/10.7554/eLife.13195


