Uncertainty leads to persistent effects on reach representations in dorsal premotor cortex
- McCormick School of Engineering, Northwestern University, United States
- Feinberg School of Medicine, Northwestern University, United States
- Northwestern University, United States
Figures
Figure 1
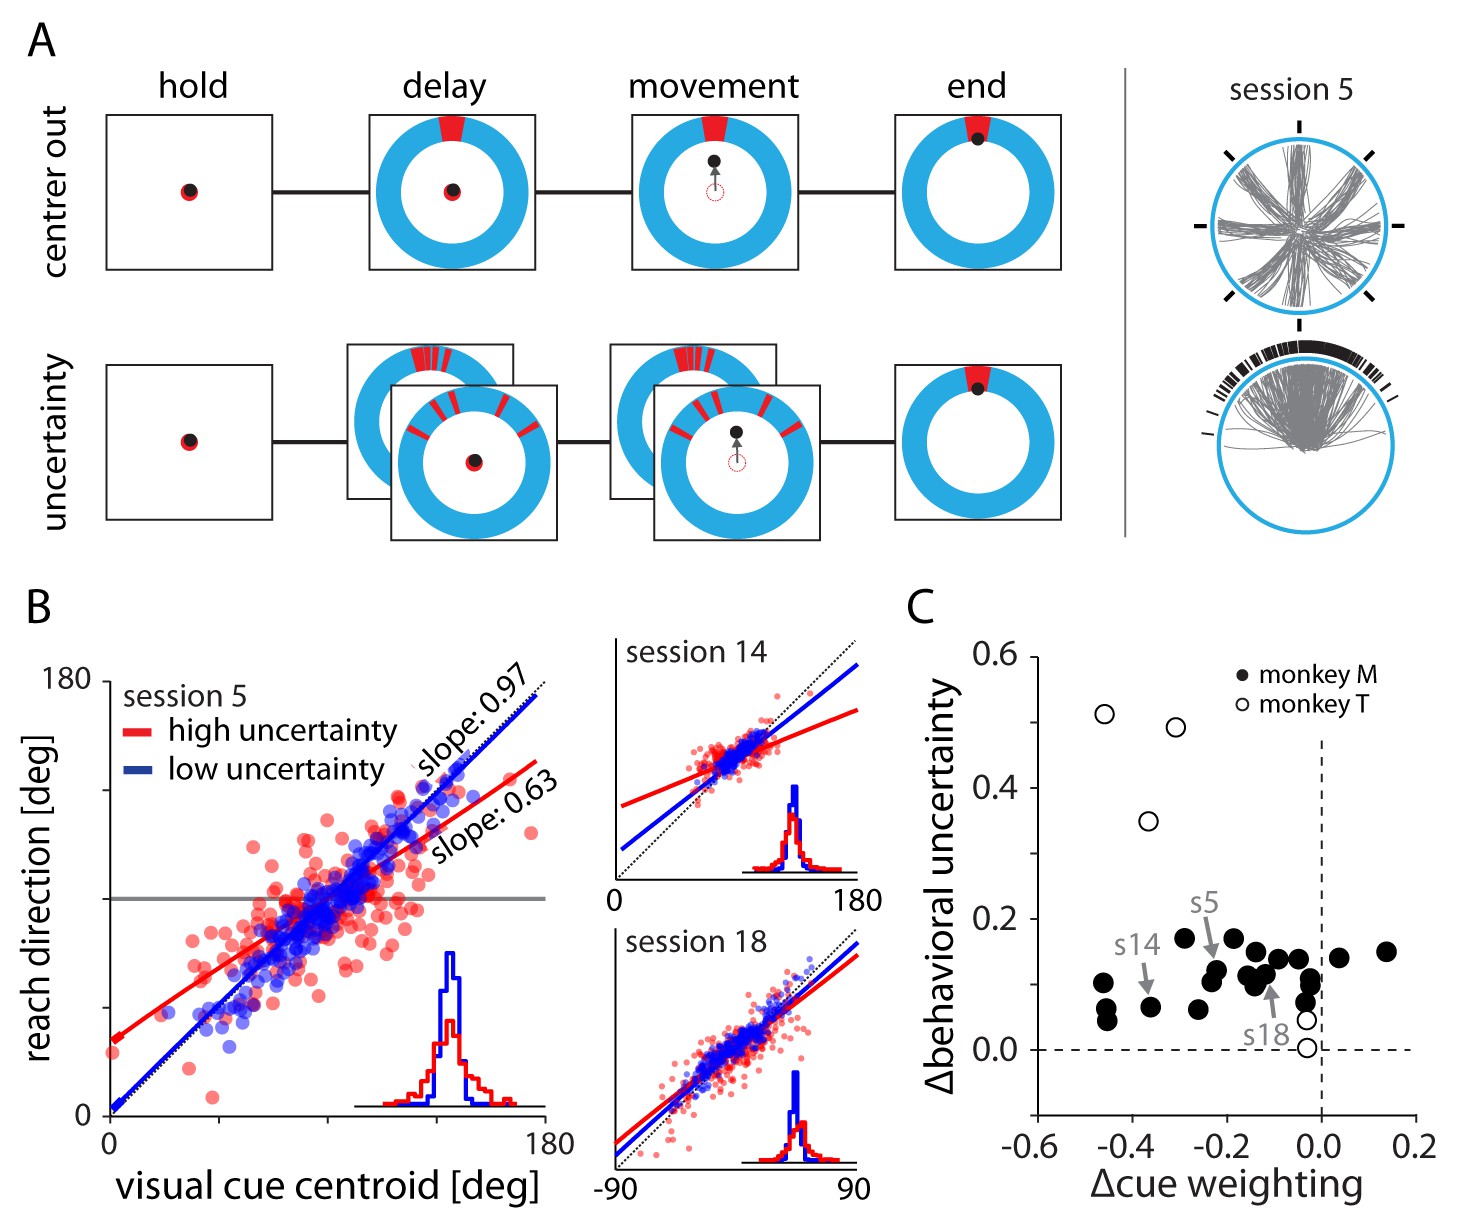
Experimental setup and behavior.
(A) Monkeys made planar center-out reaches with instructed delay to visual targets. Illustrations on right show target locations (black) and reach trajectories (gray) for trials in the center out and uncertainty blocks for an example session. In the center-out block, targets were distributed uniformly across eight directions and were cued with no uncertainty. In the uncertainty block, targets were sampled from a von Mises distribution and cued with stochastically sampled lines with either low or high variance. (B) Scatter plots of cue centroid versus reach direction for three sessions, with each dot representing a single trial. Under high uncertainty, the endpoints reflected an increased bias toward the average target location – indicated by a reduction in slope – and increased variability surrounding the fit line. (C) With the exception of two datasets from monkey M, fits to the behavioral scatter plots reveal reduced slope (negative ∆cue weighting) for higher uncertainty targets. All datasets show greater residual variance with greater uncertainty.
-
Figure 1—source data 1
Experimental details for all sessions.
In some instances we obtained multiple sessions from the same day (sessions 3–4, 5–7, 8–10, 11–12, 13–14, 16–17, and 26–27). In these cases, the sessions shared the same sorted neurons and center out trials. Uncertain trial blocks could differ in either target distribution or visual cue properties.
- https://doi.org/10.7554/eLife.14316.004
Figure 2
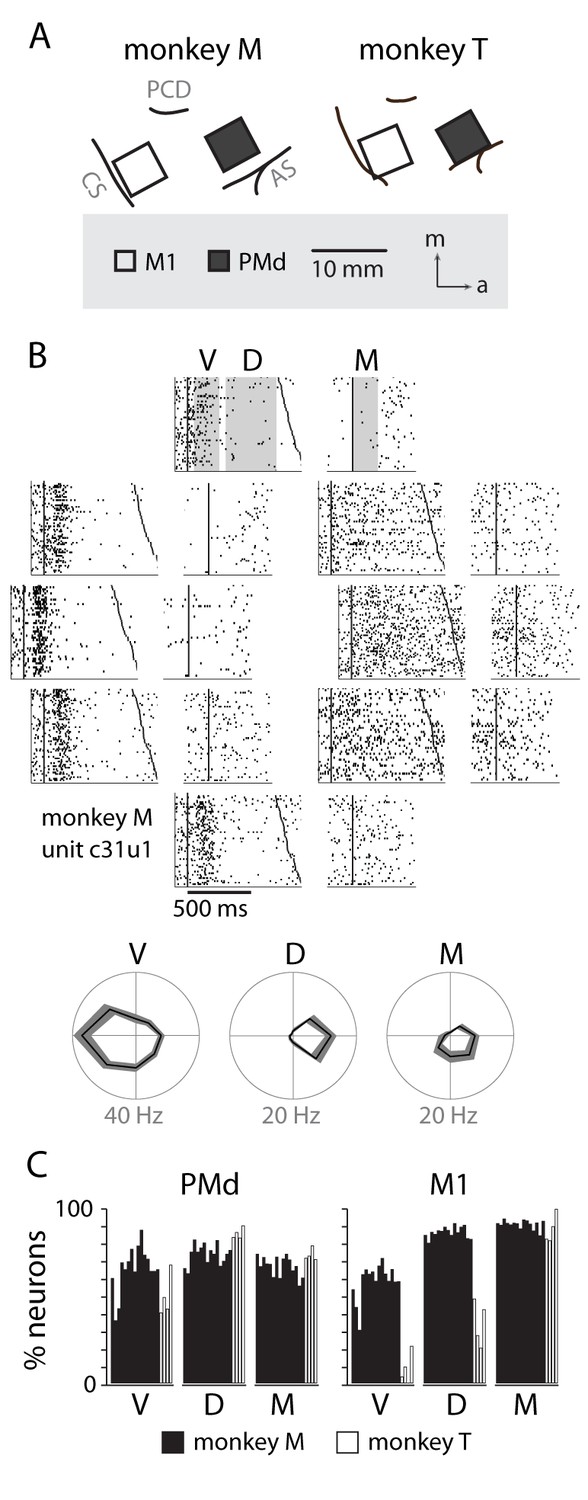
Neural recordings and directional tuning.
(A) Each monkey was implanted with two 96-channel microelectrode arrays, targeting the primary motor cortex (M1) and dorsal premotor cortex (PMd). (B) An example raster of a neuron in PMd displaying directional tuning, summarized below in three temporal periods: visual (V), delay (D) and movement (M). (C) Percentage of neurons from each session with significant tuning in each of the temporal periods.
Figure 3
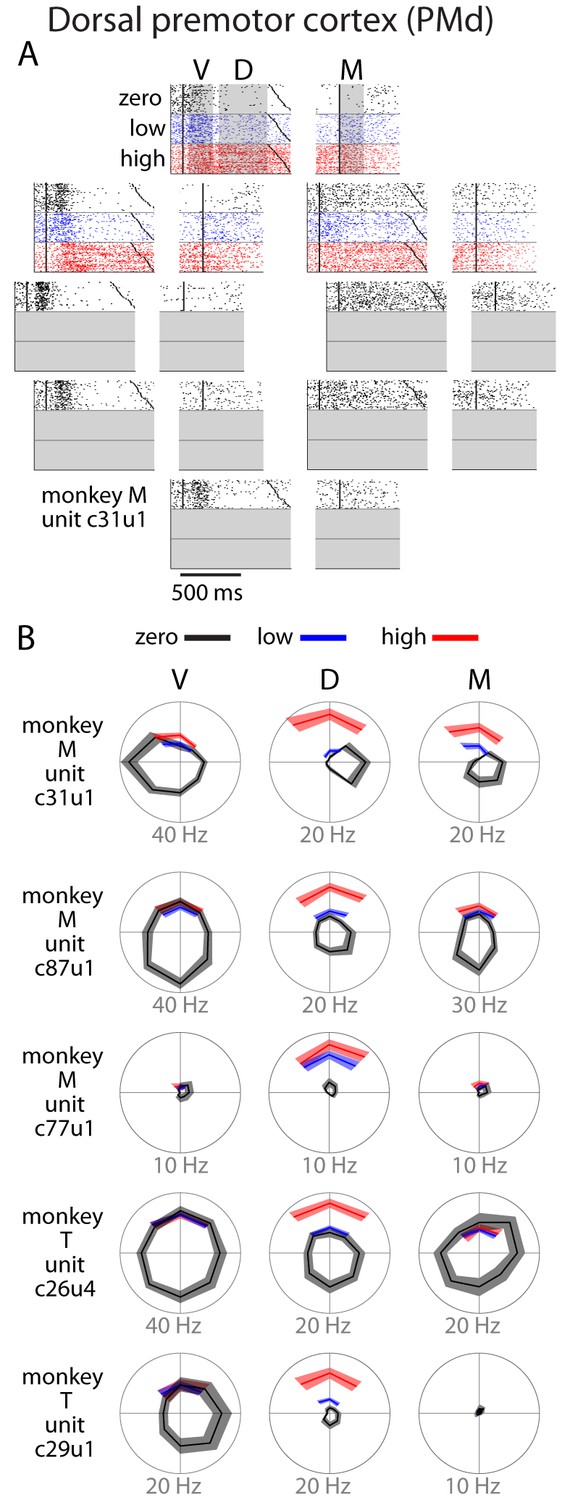
Single unit activity in PMd.
(A) Raster plot for an example neuron. Activity is aligned to either the visual cue appearance (left) or movement onset (right). Colors indicate zero (black), low (blue), and high (red) uncertainty conditions. Dark black points indicate target onset, go cue, and movement onset (B) Directional tuning for other example neurons. Due to the nature of the task, reaches made during uncertain conditions with a non-uniform prior did not span all directions. Many neurons showed an increase in delay (D) or movement (M) activity as a function of uncertainty. Bounds on the tuning plots represent bootstrapped 95% confidence of the mean estimate.
Figure 4
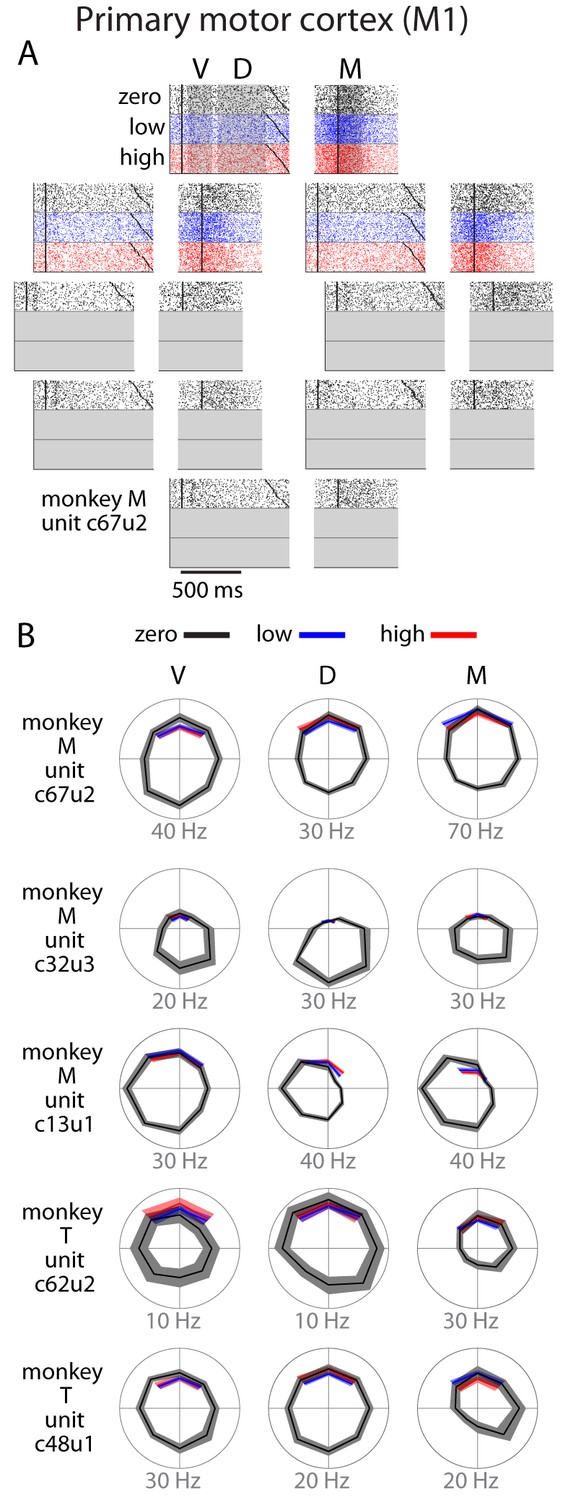
Single unit activity in M1.
(A) Raster plot for an example neuron with same conventions as Figure 3. (B) Directional tuning for other example neurons. In general, M1 activity was well-modulated by reach direction, but appeared to be largely unaffected by the uncertainty condition. Bounds on the tuning plots represent bootstrapped 95% confidence of the mean estimate.
Figure 5

Tuning-related changes in activity with uncertainty.
(A) Spatiotemporal activity maps for PMd and M1. Neurons were binned on each trial by the distance between their preferred directions and the reach direction. Color indicates average change in firing rate from baseline in spikes per second. Left and right plots in each panel are aligned to target onset (T) and reach onset (R) respectively. (B) Average change from baseline for SD and OD neurons in the initial center-out block (zero uncertainty; top) and subsequent blocks with low (bue) and high (red) uncertainty targets (bottom). High uncertainty trials resulted in reduced early activity for both SD and OD neurons in PMd, but an increase in OD activity for the remainder of the delay and movement phases. ORTH neurons were omitted for visibility. Error bars represent bootstrapped 95% confidence bounds on the mean estimate. For all plots, PDs were calculated separately for visual, delay, and movement epochs.
Figure 6
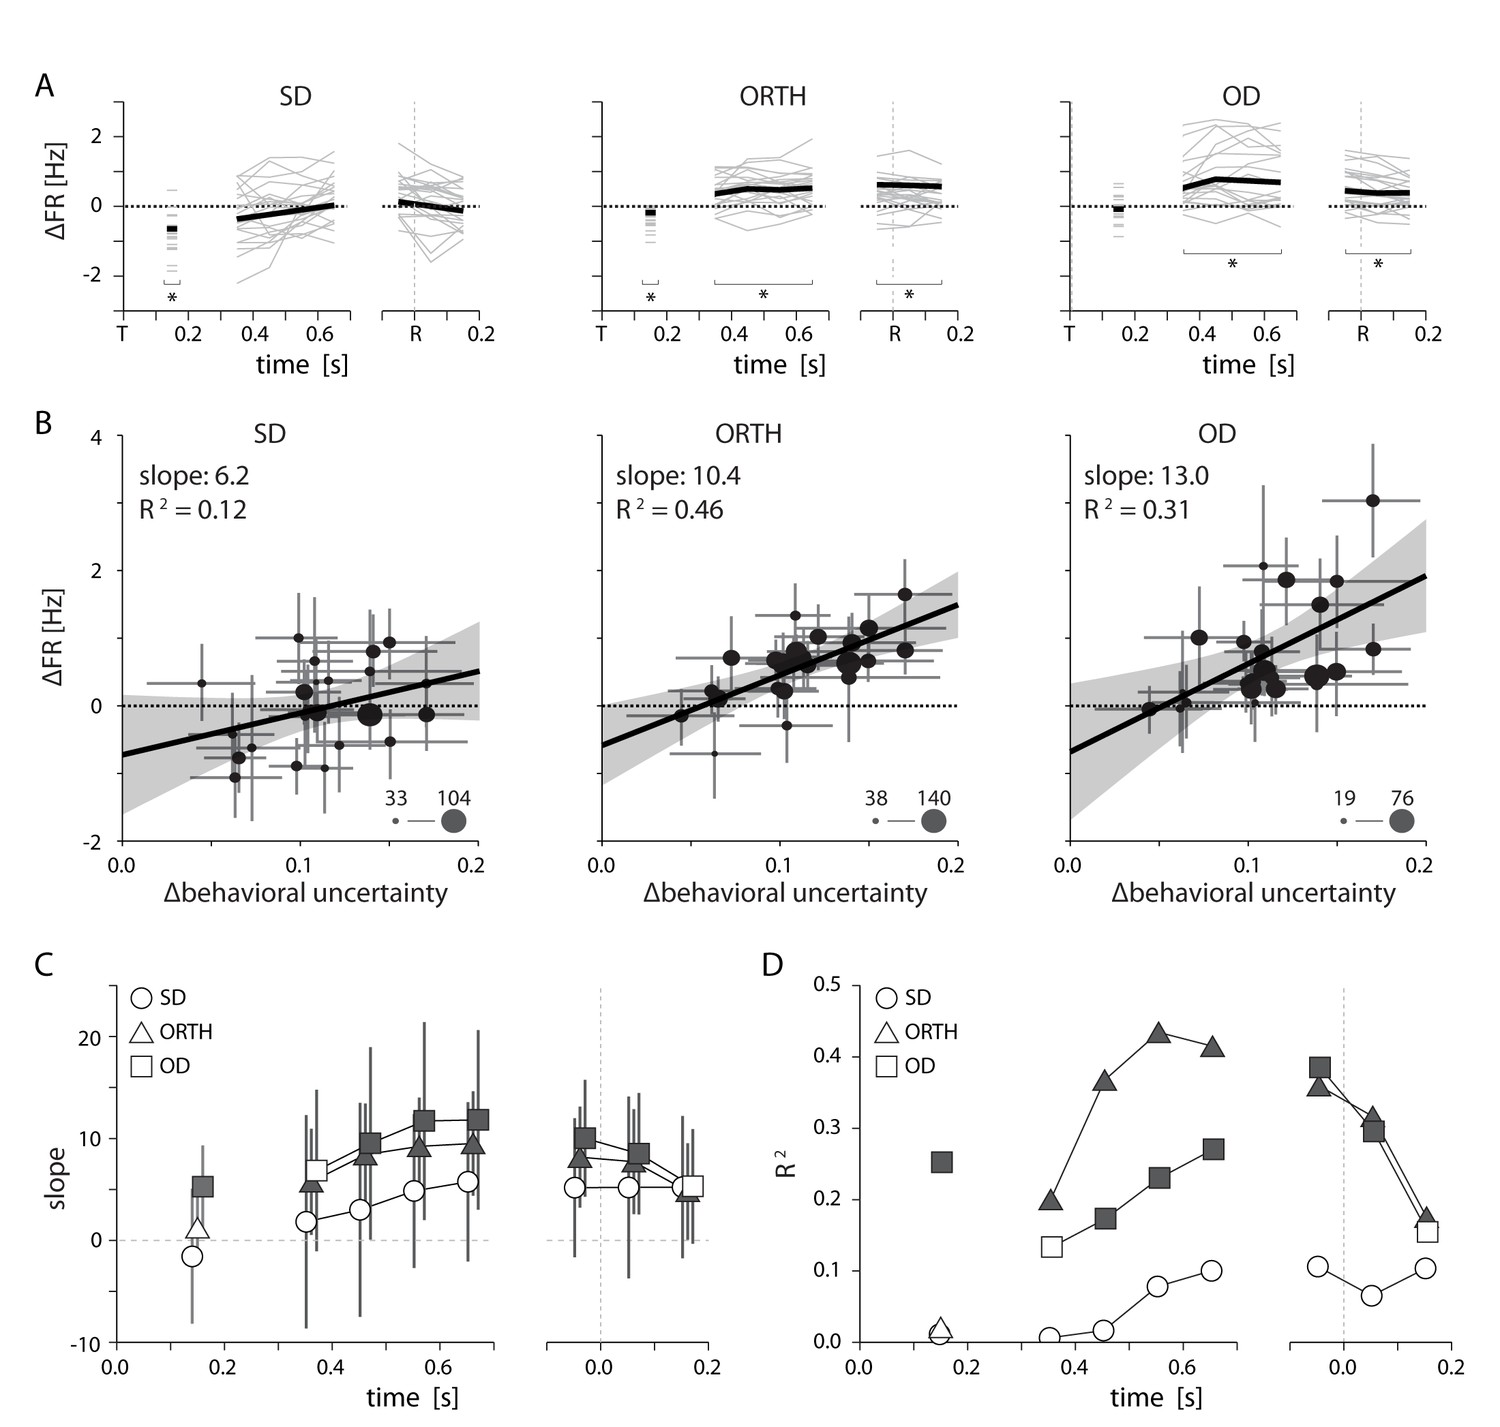
Relationship between PMd activity and behavioral uncertainty.
(A) Thin lines indicate the average difference in firing rate between high and low uncertainty trials for individal sessions. Heavy lines mark the mean across sessions. While SD neurons displayed an average change near zero, activity for ORTH and OD neurons was consistently higher for high uncertainty trials (B) Differences in firing rate between high and low uncertainty conditions as a function of the difference in behavioral uncertainty for a single time window 500–700 ms after target appearance. The correlation was weak for same-direction neurons, but strongly positive for orthogonal- and opposite-direction neurons. Thus, the greater the difference in behavioral uncertainty, the larger the difference in activity for ORTH and OD neurons. Marker size indicates the number of contributing neurons for each session (C) The slopes from B calculated during the visual period (50–250 ms after target appearance; left) and for 100 ms time windows throughout the delay (middle) and movement (right) periods. The larger effect of behavioral uncertainty on OD and ORTH activity compared to SD activity persisted throughout planning and execution. (D) R2 values for the linear fits in C. Filled symbols in C and D represent significant correlations, p<0.05. All error bars represent bootstrapped 95% confidence bounds on the mean estimates.
Figure 7
Summary of uncertainty related effects in PMd for Monkey T. All conventions as in Figure 6.
Although we had only five sessions for monkey T, by splitting larger sessions into multiple blocks we obained 11 total data points. Specifics are given in Figure 7—source data 1.
-
Figure 7—source data 1
Subsampling of sessions for monkey T.
Due to low sample size for monkey T, we subdivided larger sessions to obtain separate blocks of 100+ trials each. Here we show the trials contributing to each trial block and the subsequent numbers of low- and high-uncertainty trials.
- https://doi.org/10.7554/eLife.14316.011
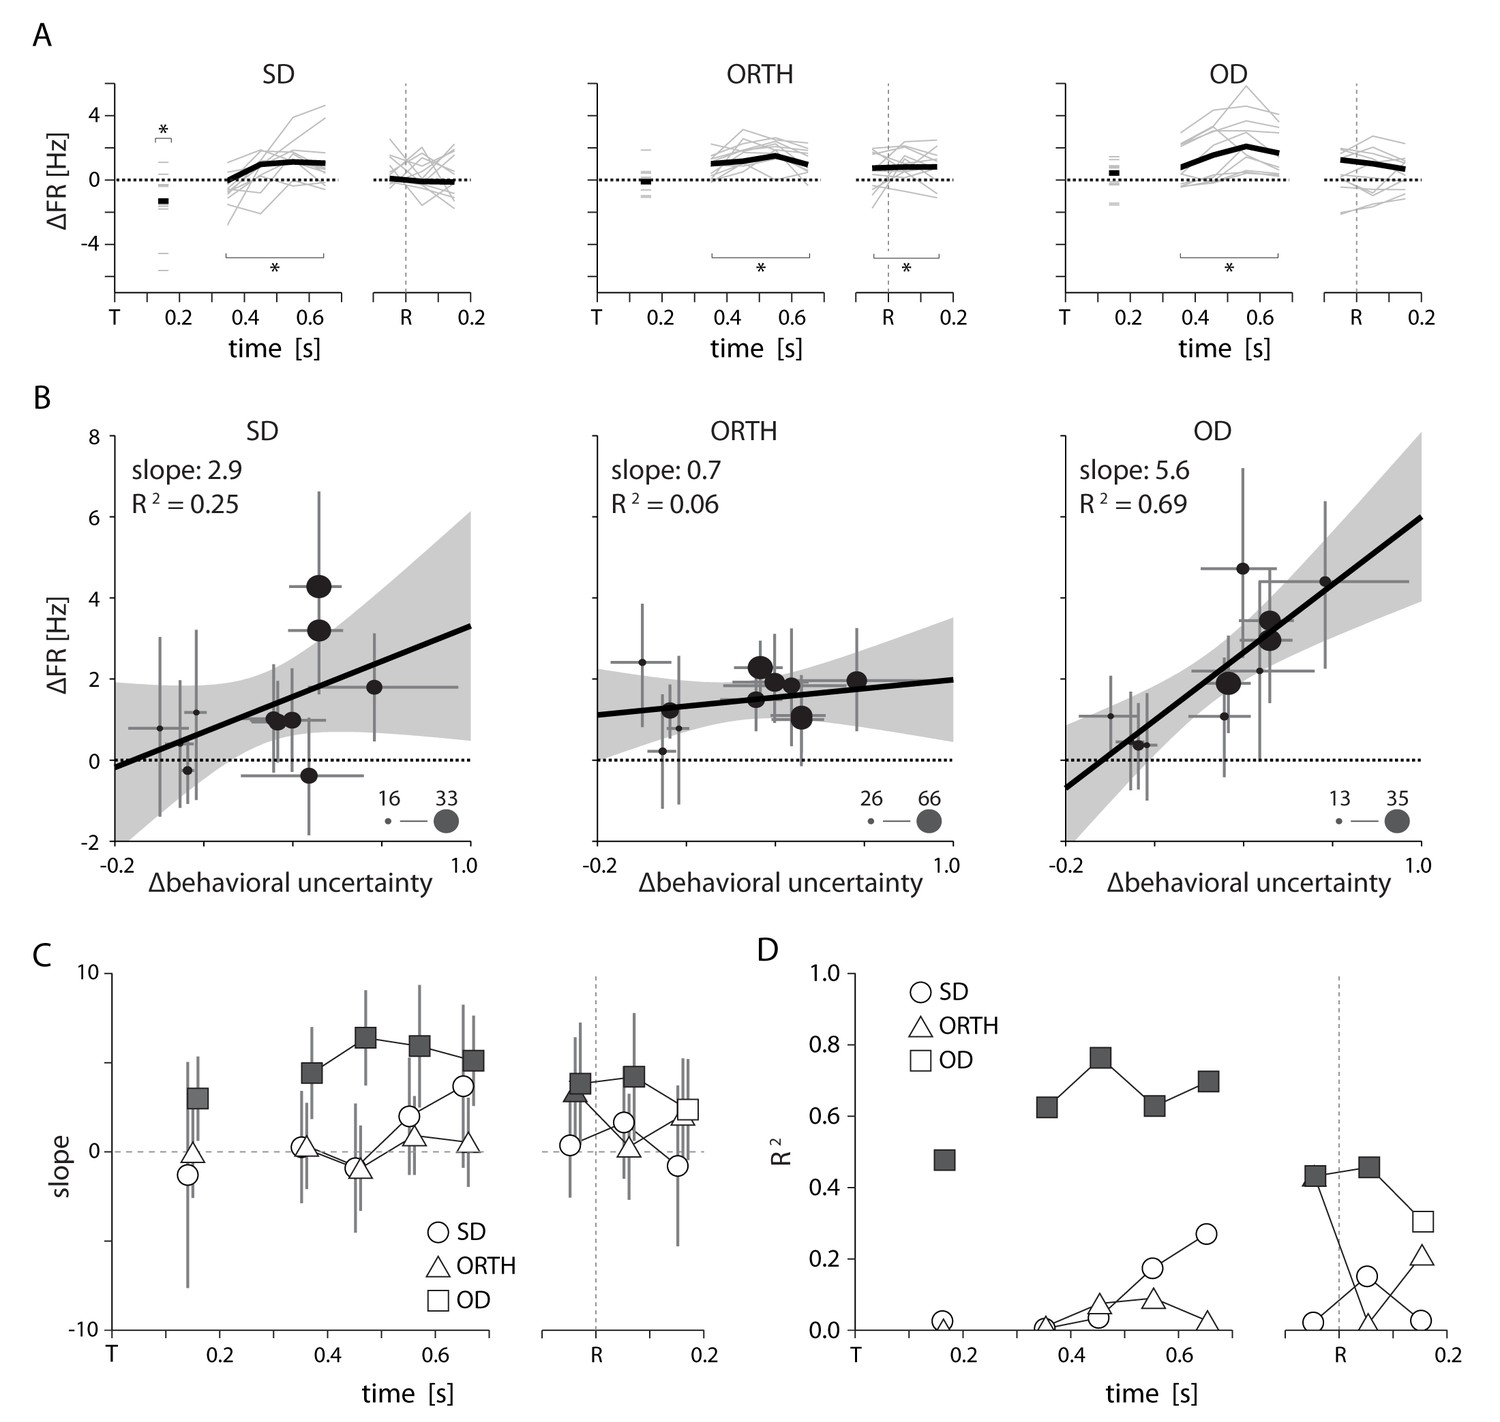
Figure 8

Summary of uncertainty-related actvity in M1 for both monkeys.
All conventions as in Figures 6,7. Specifics of how we obtained datapoints for monkey T in panels B and D are given in Figure 7—source data 1.
Figure 9
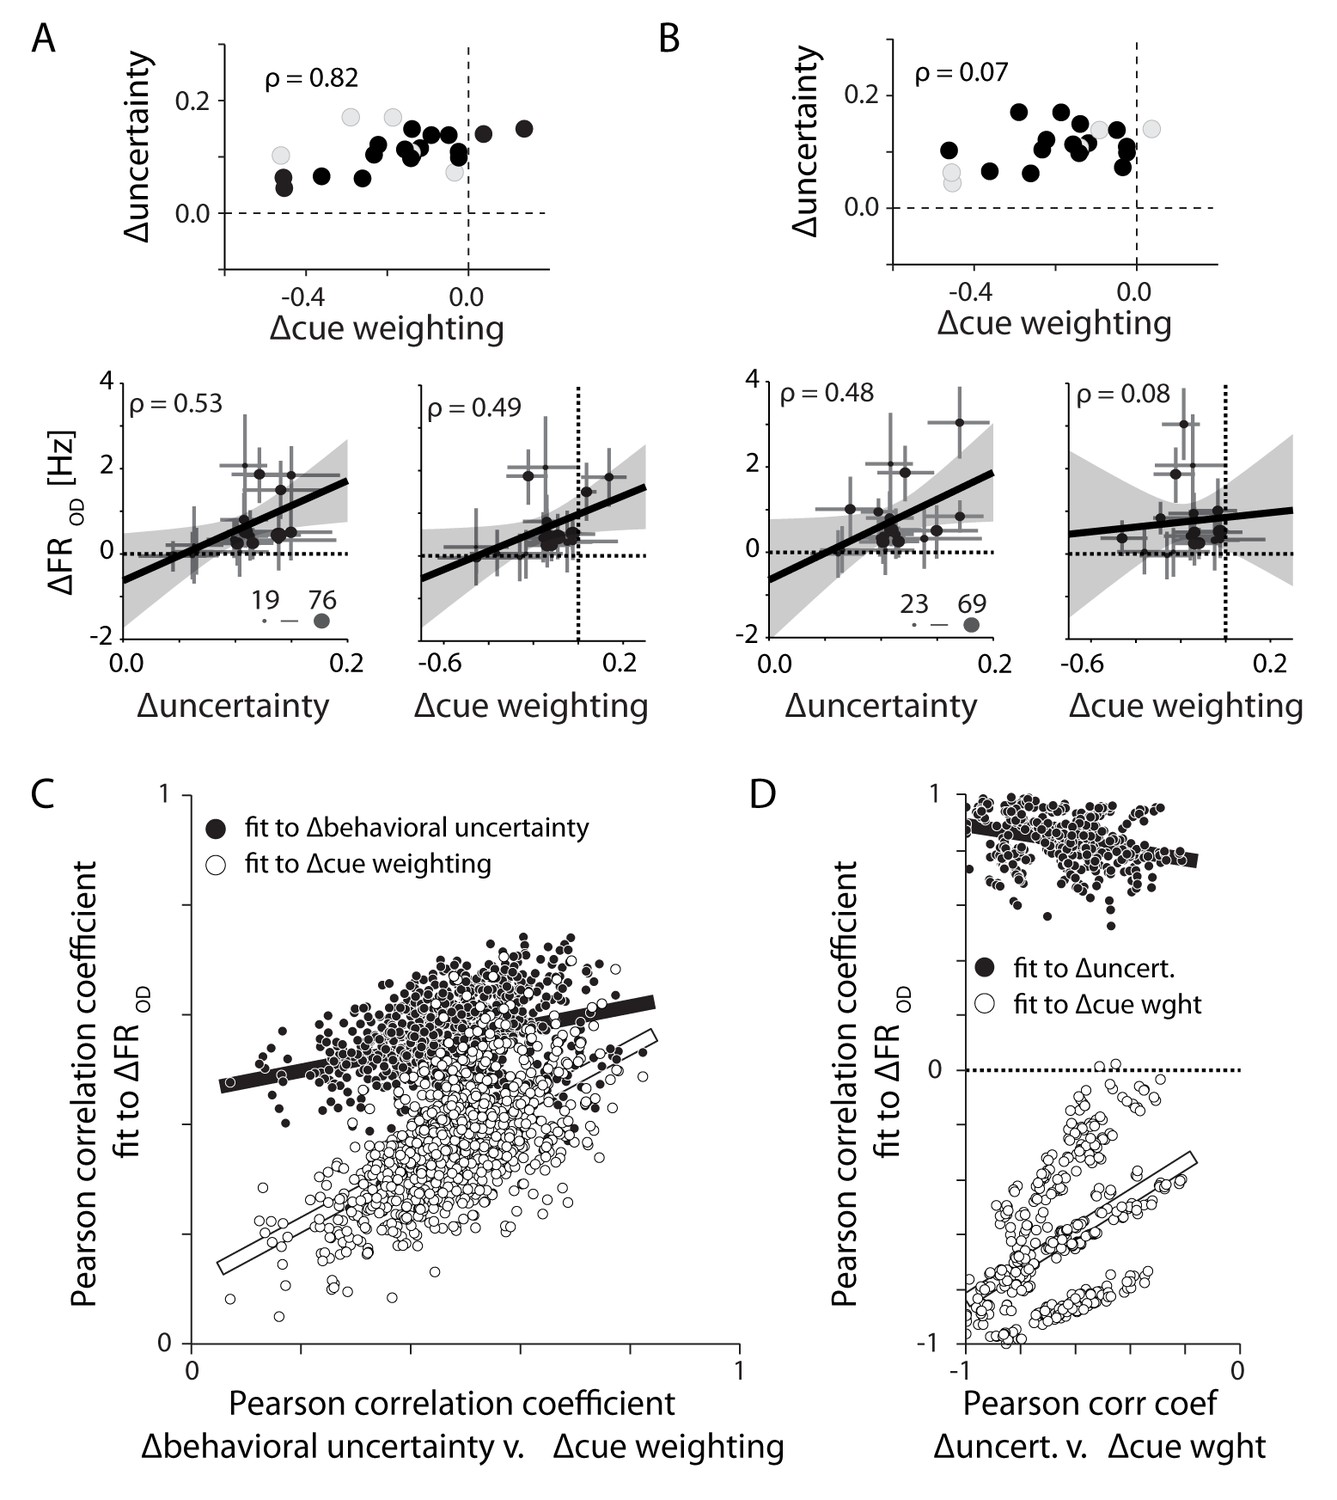
Differences in PMd activity correlate with differences in behavioral uncertainty rather than differences in the weighting of the visual cue.
(A) Eighteen sessions (filled symbols) selected for monkey M in order to increase the correlation between ∆behavioral uncertainty and ∆cue weighting (top). Across these select sessions both metrics could explain the observed differences in OD activity (bottom). (B) Alternate subsampling that minimized the correlation between the two behavioral metrics (top). This resampling did not change the correlation between changes in OD activity and ∆behavioral uncertainty (lower left). However, it eliminated the correlation between ∆cue weighting and OD activity (lower right). (C) Correlations of OD differences with ∆behavioral uncertainty (filled) and ∆cue weighting (open) for 1000 unique 18-session subsamples. Each is plotted against the correlation between ∆behavioral uncertainty and ∆cue weighting. The correlation with ∆behavioral uncertainty was consistently stronger than with ∆cue weighting. The correlation with ∆cue weighting was only strong when ∆cue weighting and ∆behavioral uncertainty were well correlated with each other. (D) Same as in C, but for monkey T. Each subsample contains six trial blocks. Unlike monkey M, ∆cue weighting and ∆behavioral uncertainty were negatively correlated across sessions. Regardless, OD activity in PMd was still positively correlated with ∆behavioral uncertainty.
Figure 10

Decoding reach direction from neural activity measured on single trials from PMd and M1, based on PDs computed during center-out (zero-uncertainty) reaches.
(A) The performance of PMd (left) and M1 (right) decoders as a function of time for one example session. Performance is defined as one minus the circular variance of the decoder error. (B) PMd decoder performance in low v. high uncertainty conditions for four 200 ms time windows spanning target appearance to movement in all sessions for both monkeys. Each point represents a single session from monkey M (closed) or monkey T (open) (C) Same as in B, but for M1.
Figure 11 with 1 supplement
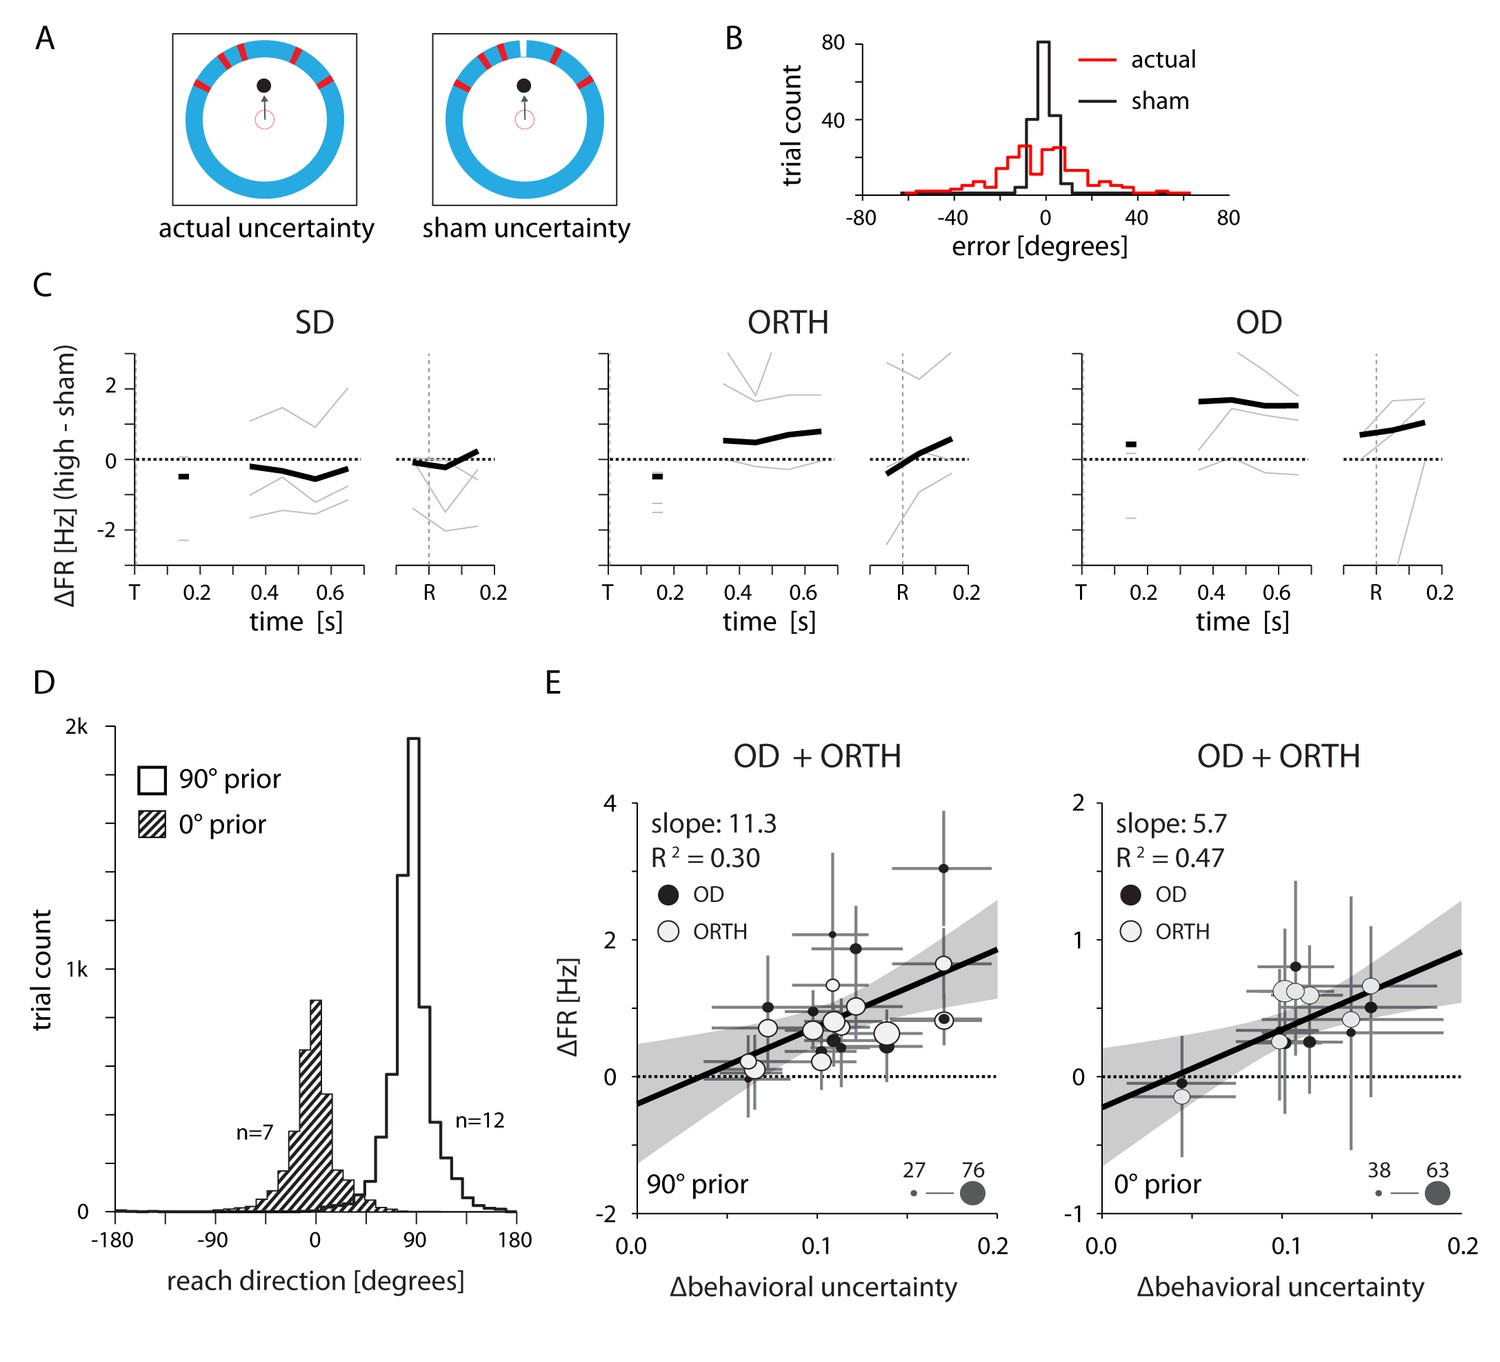
Neural effects cannot be explained by either the visual qualities of the target cue or changes in the average reach direction across sessions.
(A) Design of a control experiment to test whether the uncertainty-related effect could be explained solely by differences in the visual stimuli between conditions. Half of the trials contained a high-uncertainty cue (top left) and the other half contained sham high-uncertainty trials that included an additional line of a different color to indicate the veridical target location (top right). (B) Reaching errors were much smaller for the sham trials, indicating that the monkey learned to rely on the veridical cue. (C) Thin lines indicate the average difference in firing rate between actual and sham uncertainty trials for individal sessions. Heavy lines mark the mean across sessions. OD activity was higher during actual high uncertainty trials, despite the nearly equivalent visual properties. (D) Control to test whether the neural effects could be explained by differences in the average target location across sessions. We selected two groups of sessions that each contained a consistent average reach direction. (E) Correlations between changes in OD and ORTH activity and ∆behavioral uncertainty for the two groups of sessions, 500–700 ms after target appearance. OD and ORTH activity within each group of sessions still correlated with ∆behavioral uncertainty.
Figure 11—figure supplement 1
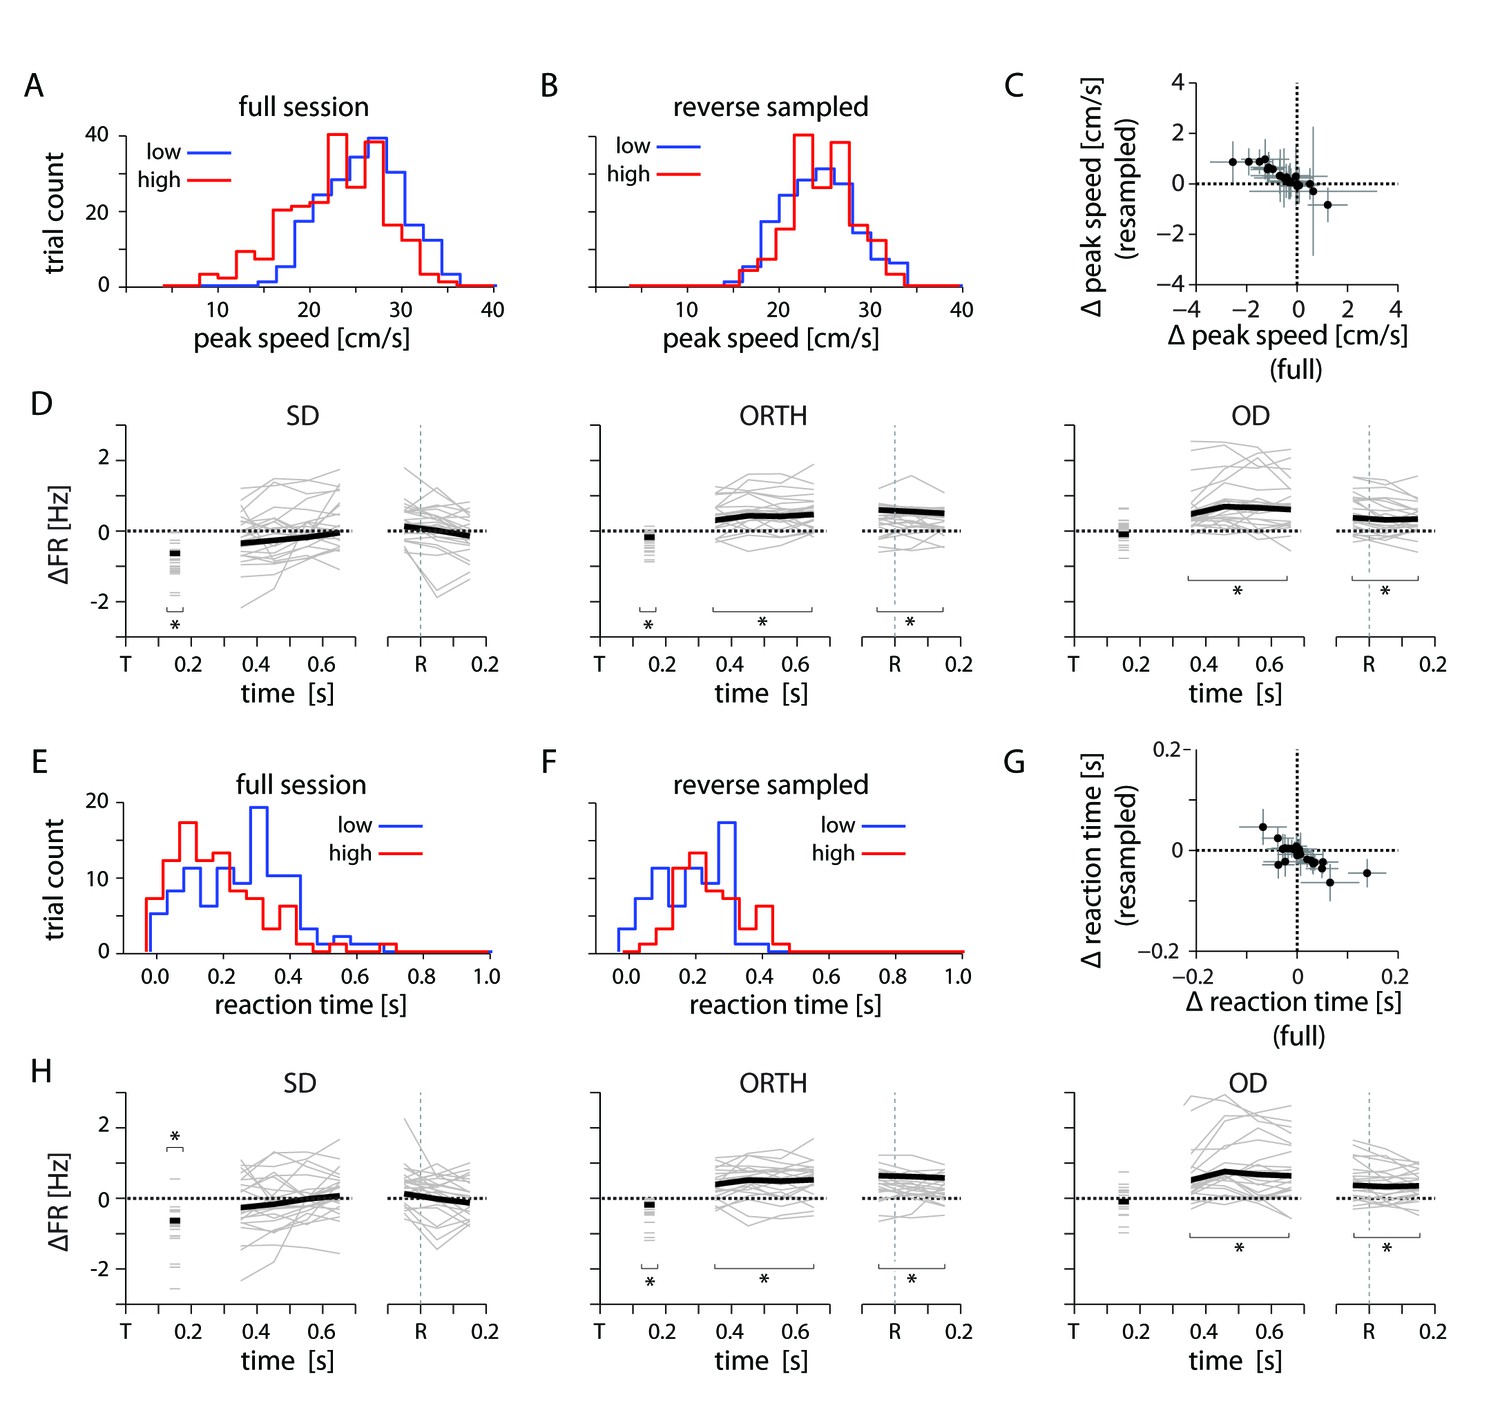
Kinematic controls.
(A) Example distribution of peak reach speed for high and low uncertainty conditions. (B) Distribution of peak speeds for same session as in A, subsampled to reverse the condition-dependent difference. (C) Plot showing the difference in average peak speed between low and high uncertainty conditions for the full and reverse-sampled datasets. (D) Thin lines indicate the average difference in firing rate between high and low uncertainty conditions for an individal session, subsampled to reverse the trend of peak speed. Heavy lines mark the mean across sessions. (E) Example distribution of reaction time for high and low uncertainty conditions. (F) Distribution of reaction times for same session as E, subsampled to reverse the condition-dependent difference. (G) Plot showing the difference in average reaction time between low and high uncertainty conditions for the full and reverse-sampled datasets. (H) Same as in D. Average differences in peak speed and reaction time cannot explain the neural effect.
Download links
A two-part list of links to download the article, or parts of the article, in various formats.
Downloads (link to download the article as PDF)
Open citations (links to open the citations from this article in various online reference manager services)
Cite this article (links to download the citations from this article in formats compatible with various reference manager tools)
Uncertainty leads to persistent effects on reach representations in dorsal premotor cortex
eLife 5:e14316.
https://doi.org/10.7554/eLife.14316


