Characterisation of the opposing effects of G6PD deficiency on cerebral malaria and severe malarial anaemia
- University of Oxford, United Kingdom
- The Wellcome Trust Sanger Institute, United Kingdom
- Medical Research Council Unit The Gambia, Gambia
- Independence Drive, Gambia
- London School of Hygiene and Tropical Medicine, United Kingdom
- University of Bamako, Mali
- University of Rome La Sapienza, Italy
- Centre National de Recherche et de Formation sur le Paludisme (CNRFP), Burkina Faso
- Navrongo Health Research Centre, Ghana
- University of Ghana, Ghana
- Komfo Anoyke Teaching Hospital, Ghana
- Bernhard Nocht Institute for Tropical Medicine, Germany
- Kumasi Centre for Collaborative Research, Ghana
- University of Ibadan, Nigeria
- University of Buea, Cameroon
- KEMRI-Wellcome Trust Research Programme, Kenya
- Imperial College, United Kingdom
- Kilimanjaro Christian Medical College, Tanzania
- University of Malawi, Malawi
- University of Oxford, Vietnam
- Pembroke Place, United Kingdom
- The University of Melbourne, Australia
- Hospital for Tropical Diseases, Viet Nam
- Papua New Guinea Institute of Medical Research, Papua New Guinea
- University of Western Australia, Australia
- Swansea University, United Kingdom
- Oxford University, United Kingdom
- Divine Word University, Papua New Guinea
- Walter and Eliza Hall Institute of Medical Research, Australia
- Barcelona Centre for International Health Research, Spain
- The Ethox Centre, University of Oxford, United Kingdom
- National Institute of Allergy and Infectious Diseases, National Institutes of Health, United States
- Kwame Nkrumah University of Science and Technology, Ghana
- Center for Tropical Medicine, Oxford University, United Kingdom
Figures
Figure 1 with 3 supplements
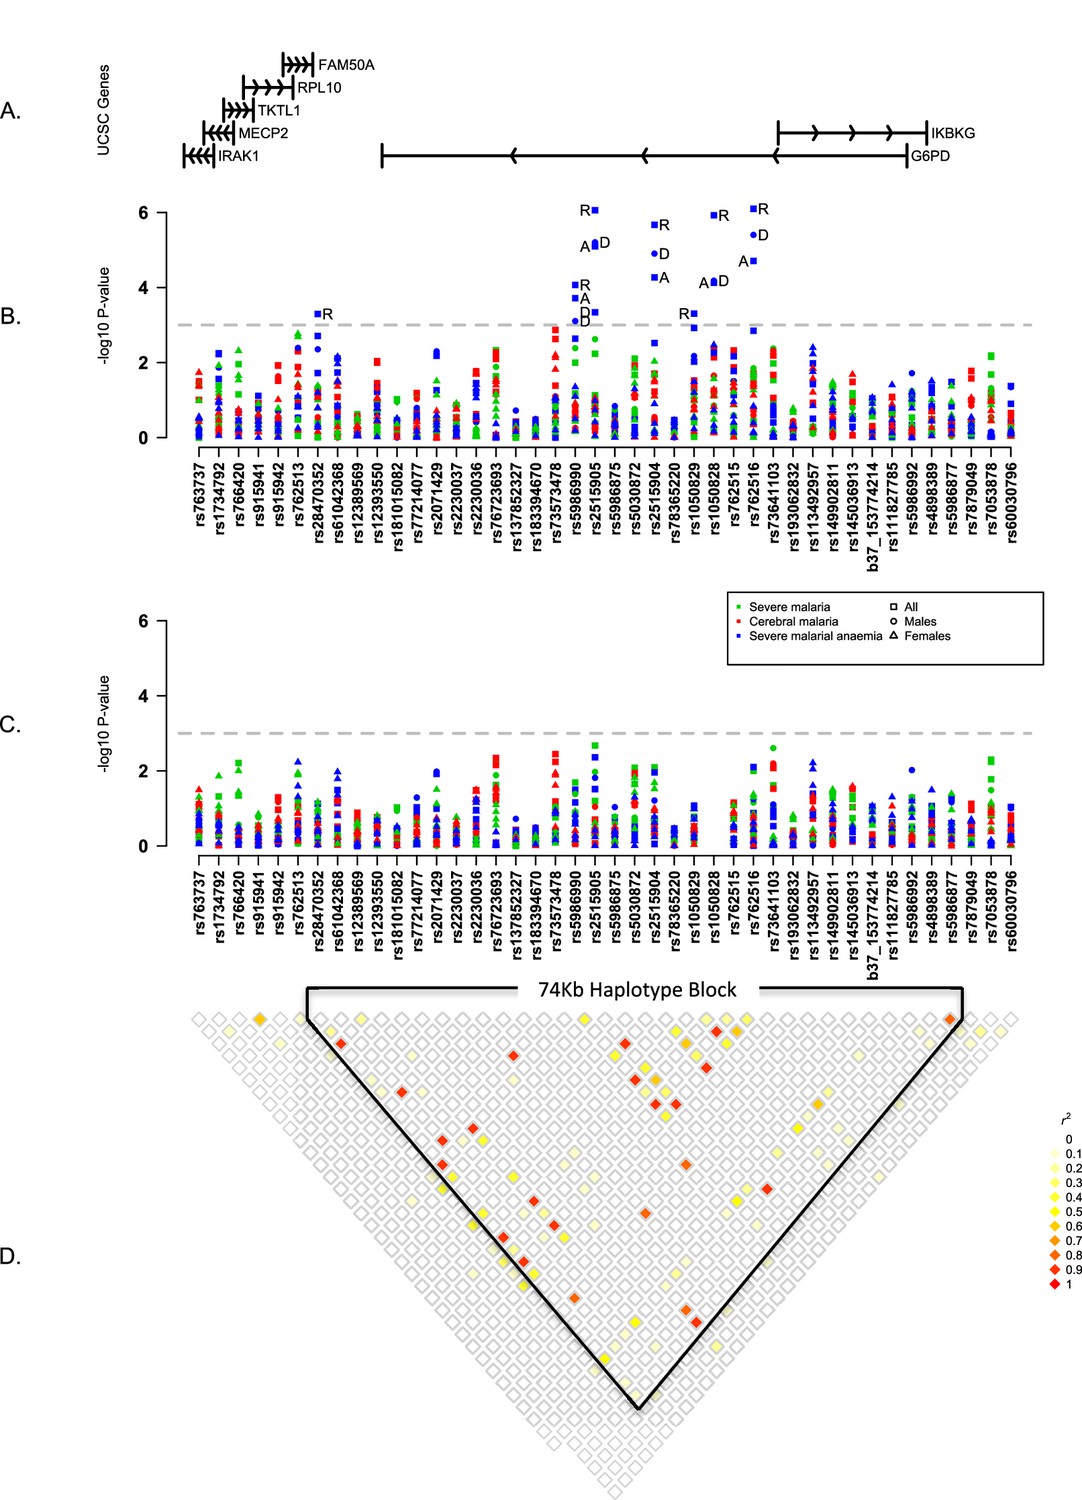
Summary of single SNP tests of association at all sites combined.
(A) Schematic of genes across the genotyped region plotted relative to evenly spaced positions of SNPs in (B). (B) Manhattan plot showing the results of all single SNP tests of association with all severe malaria and with cerebral malaria and severe malarial anaemia for males, females and all individuals combined for models of association with additive, dominant, recessive and heterozygous (females only) modes of inheritance. Mode of inheritance is indicated as additive (A), dominant (D), recessive (R) or heterozygous (H) only for SNPs with a P value <1×10⁻³, as indicated by the horizontal dashed grey line. See Figure 1—source data 1 for detailed association results. (C) As for (B), but results are adjusted for additive effects at G6PD+202. See Figure 1—source data 2 for detailed association results with adjustment for G6PD+202. (D) Pairwise r2 between pairs of SNPs in control individuals. Samples are excluded from analysis at sites where an SNP is monomorphic; this accounts for a variation in sample size across SNPs. Results for SNPs that are monomorphic or extremely rare across all sites (maximum minor allele frequency <0.01) are not shown. All results are adjusted for gender, ethnicity and the sickle-cell trait. See Figure 1—figure supplement 1 for detailed forest plots of association at G6PD+202. See Figure 1—figure supplement 2 for a summary of genetic heterogeneity of cerebral malaria and severe malarial anaemia within and across African sites.
-
Figure 1—source data 1
Single SNP association test results.
- https://doi.org/10.7554/eLife.15085.006
-
Figure 1—source data 2
Single SNP association test results with adjustment for additive effect of G6PD+202.
- https://doi.org/10.7554/eLife.15085.007
Figure 1—figure supplement 1
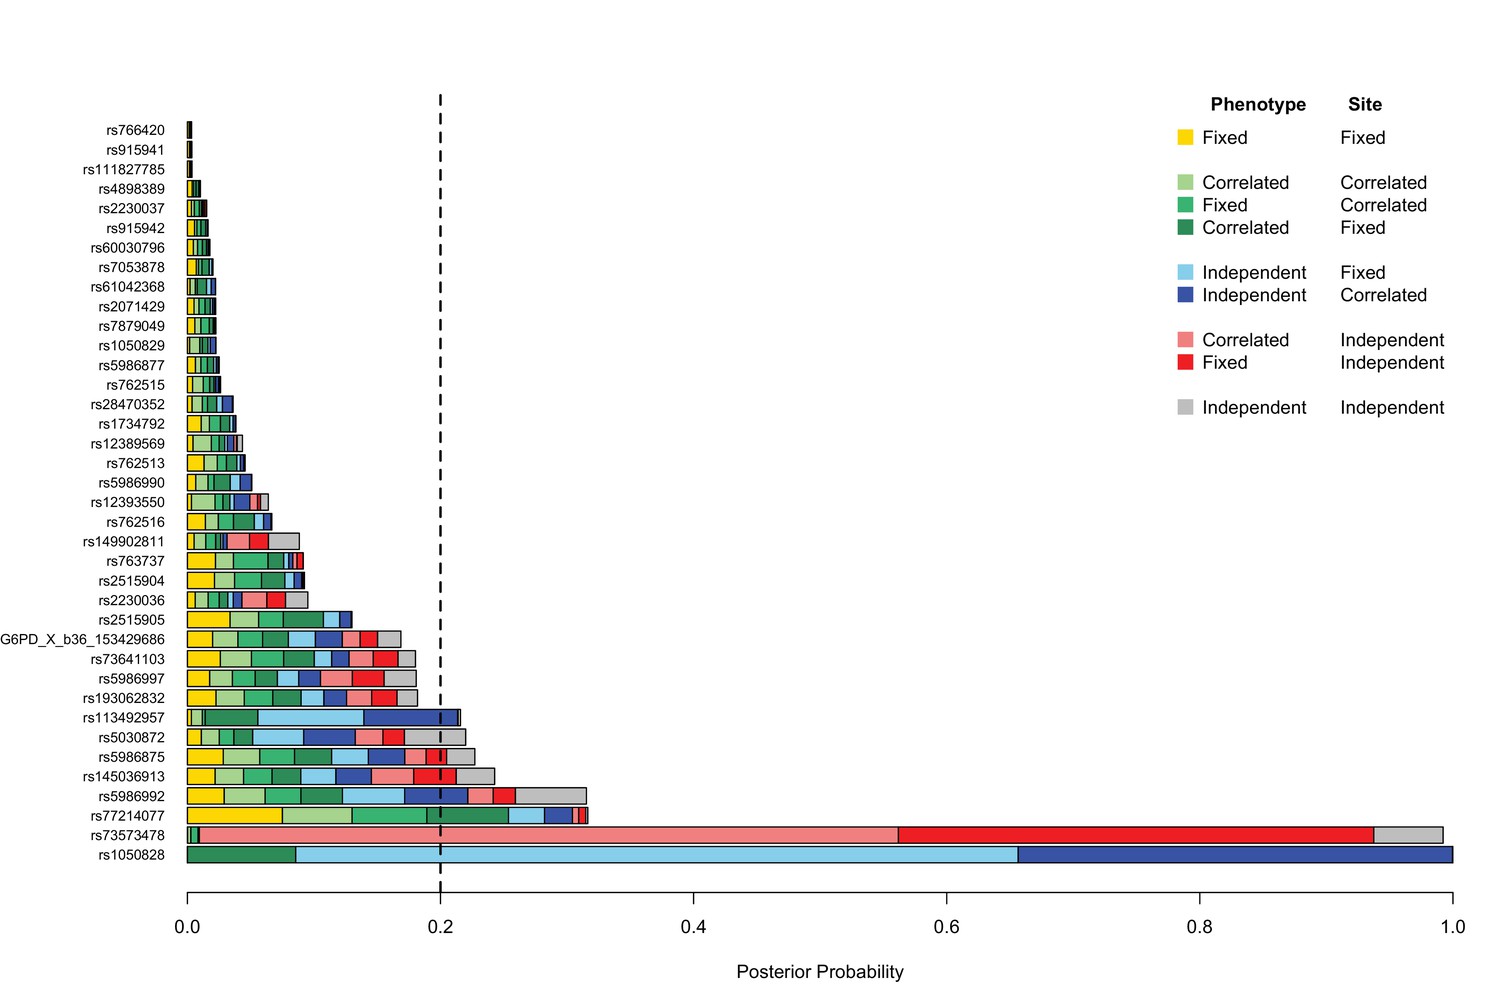
Genetic heterogeneity of severe malaria sub-phenotypes within and across African sites.
Bar plots show the posterior probability on each of nine models of association in which effects on cerebral malaria and severe malarial anaemia sub-phenotypes are fixed, independent or correlated within a site combined with being fixed independent or correlated across all the sites, as indicated by the different colours; the remainder of the posterior probability is on the null model. The null model is assumed to be most likely 80% of the time; the remaining models are equally likely. Approximate Bayes Factors (ABFs), calculated as the ratio of the marginal likelihoods of a given model and the null model in which there is no effect on any of the subtypes, are used to compare the evidence between models. (See Methods and materials for details and specification of priors.) Estimated effects are calculated for all individuals within each site and adjusted for the sickle-cell trait, ethnicity and sex. Dashed line at posterior probability = 0.2 indicates where the posterior expectation of a non-null model is greater than the prior expectation. Only variants with valid estimates of effect at at least two sites are shown.
Figure 1—figure supplement 2
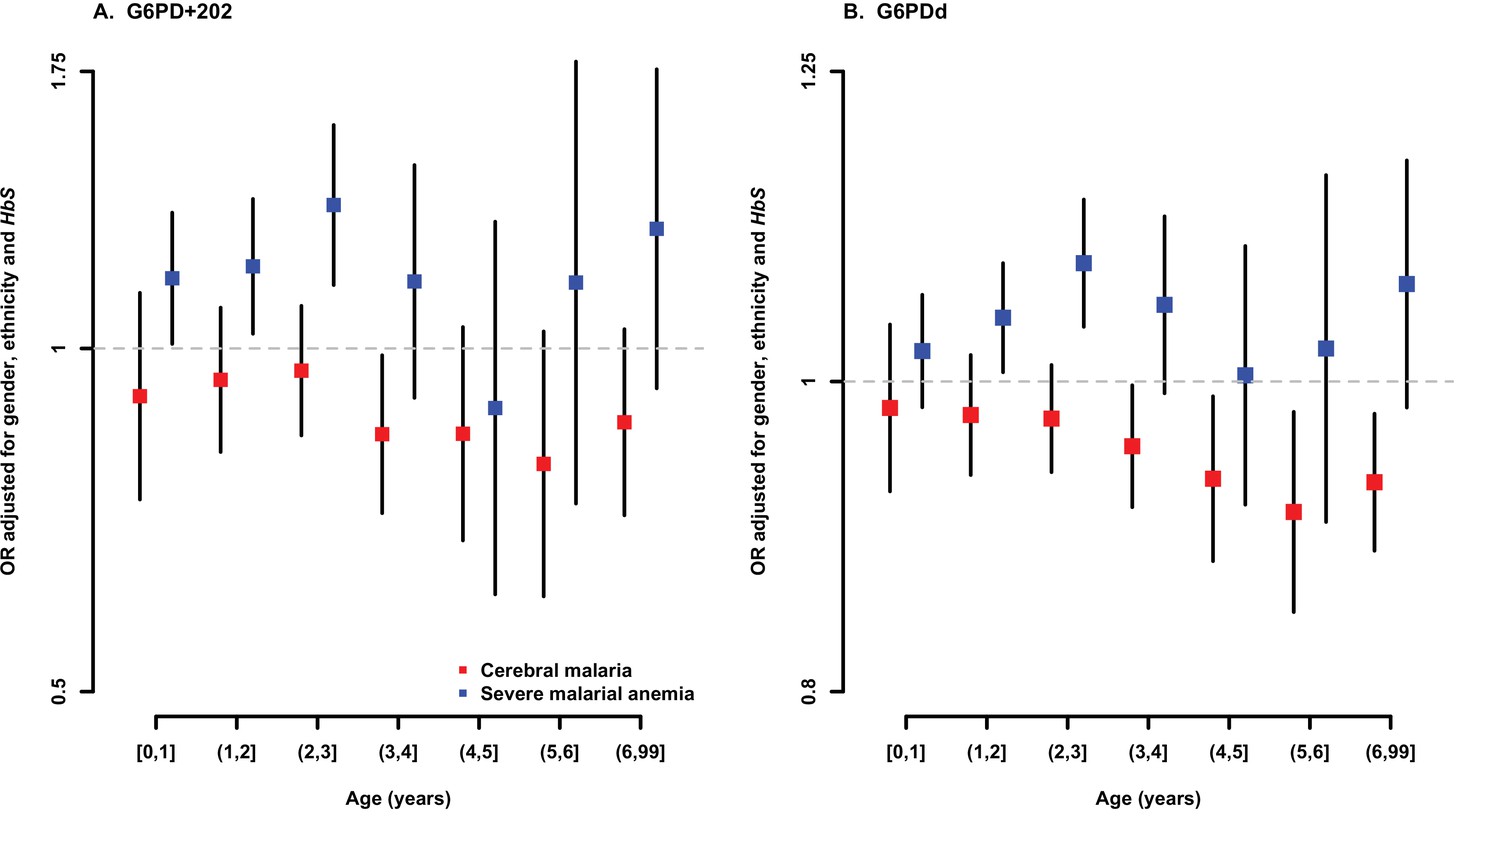
Association between G6PD deficiency and severe malaria sub-phenotypes stratified by age.
ORs and 95% confidence intervals for association with (A) G6PD+202 assuming an additive mode of inheritance, and (B) for each 10% increase in G6PDd score, adjusted for gender, ethnicity and sickle-cell trait (HbS) in yearly age categories. Results are shown for association with cerebral malaria and severe malarial anaemia for all samples combined excluding (A) Vietnam and Papua New Guinea, where G6PD+202T is not found, and (B) Vietnam, where the median age of cases is outside the range considered here.
Figure 1—figure supplement 3
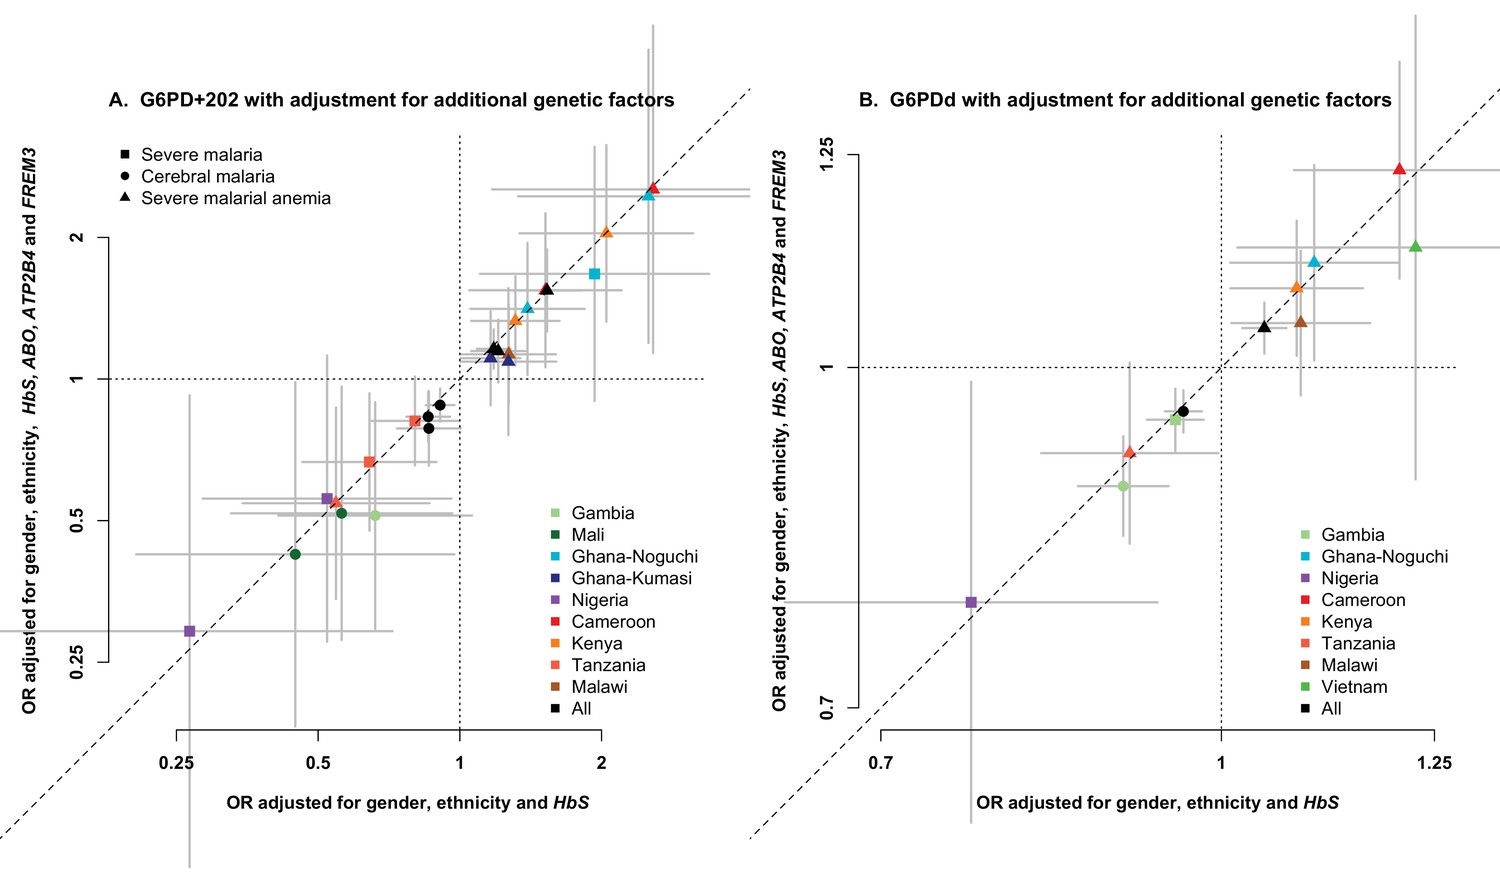
Association between G6PD deficiency and severe malaria with and without adjustment for additional genetic factors.
ORs and 95% confidence intervals for association with (A) G6PD+202 under additive, dominant and recessive modes of inheritance, and (B) for each 10% increase in G6PDd score, adjusted for gender, ethnicity and the sickle-cell trait (HbS) compared to results with additional adjustment for HbC, ABO, ATP2B4 and FREM3 (as proxy for GYPE). Results are shown for all associations with p<0.05 in tests of association with all severe malaria and with cerebral malaria and severe malarial anaemia at each site and for all samples combined.
Figure 2
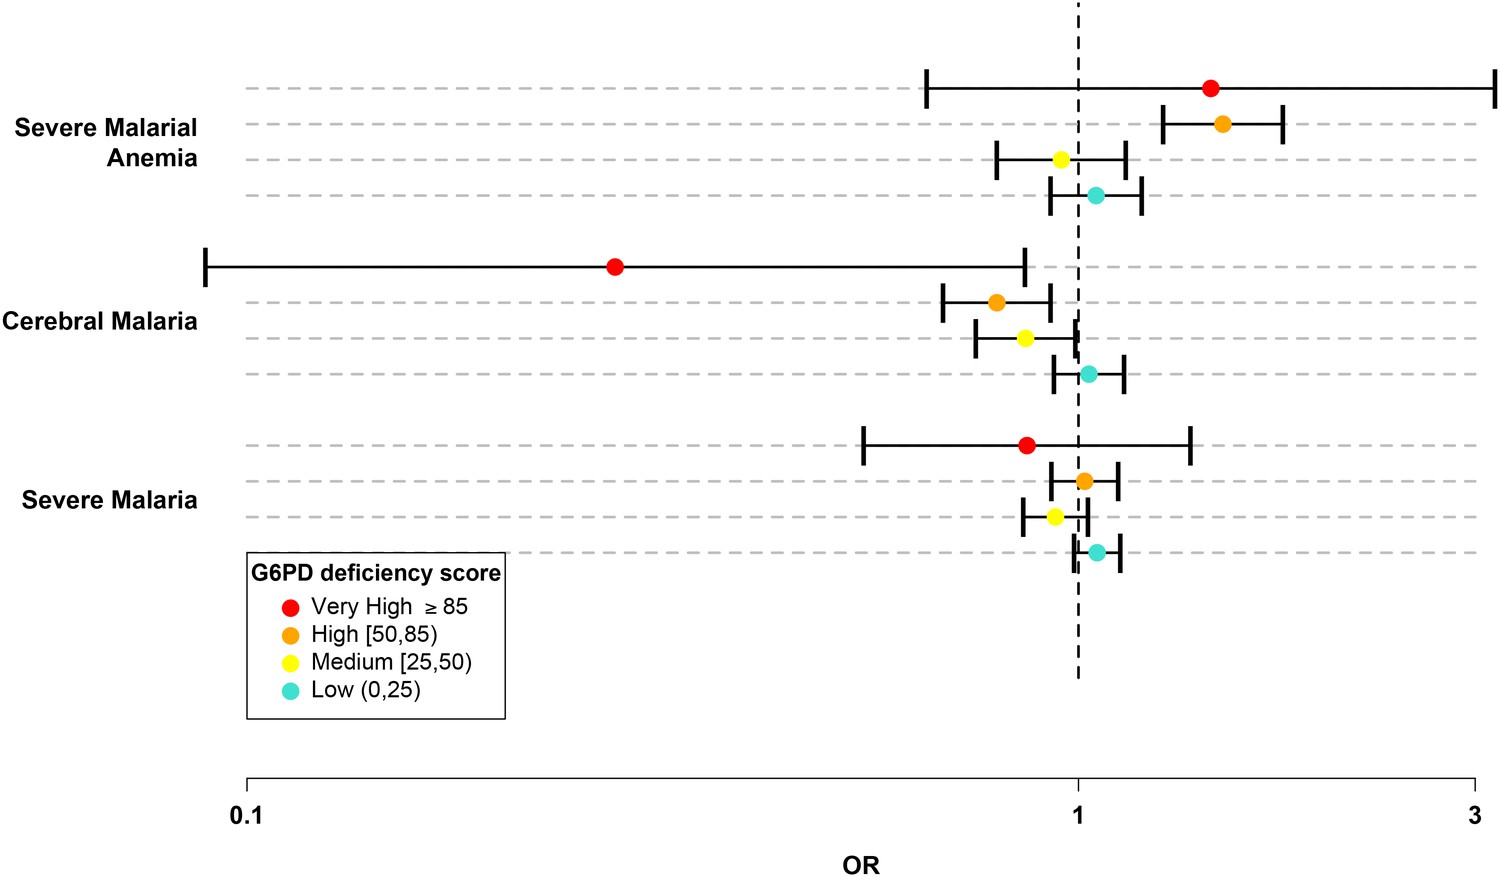
G6PD deficiency score forest plot.
Forest plots showing 95% confidence intervals for the effect of each category of G6PDd score on all severe malaria and on two sub-phenotypes, cerebral malaria and severe malarial anaemia. Results are shown for all individuals across all sites combined and are adjusted for the sickle-cell trait, ethnicity and sex. See Table 6 for details and Supplementary files 1H–J for results at all sites for males, females and all individuals combined.
-
Figure 2—source data 1
G6PDd score association test results.
- https://doi.org/10.7554/eLife.15085.015
Figure 3
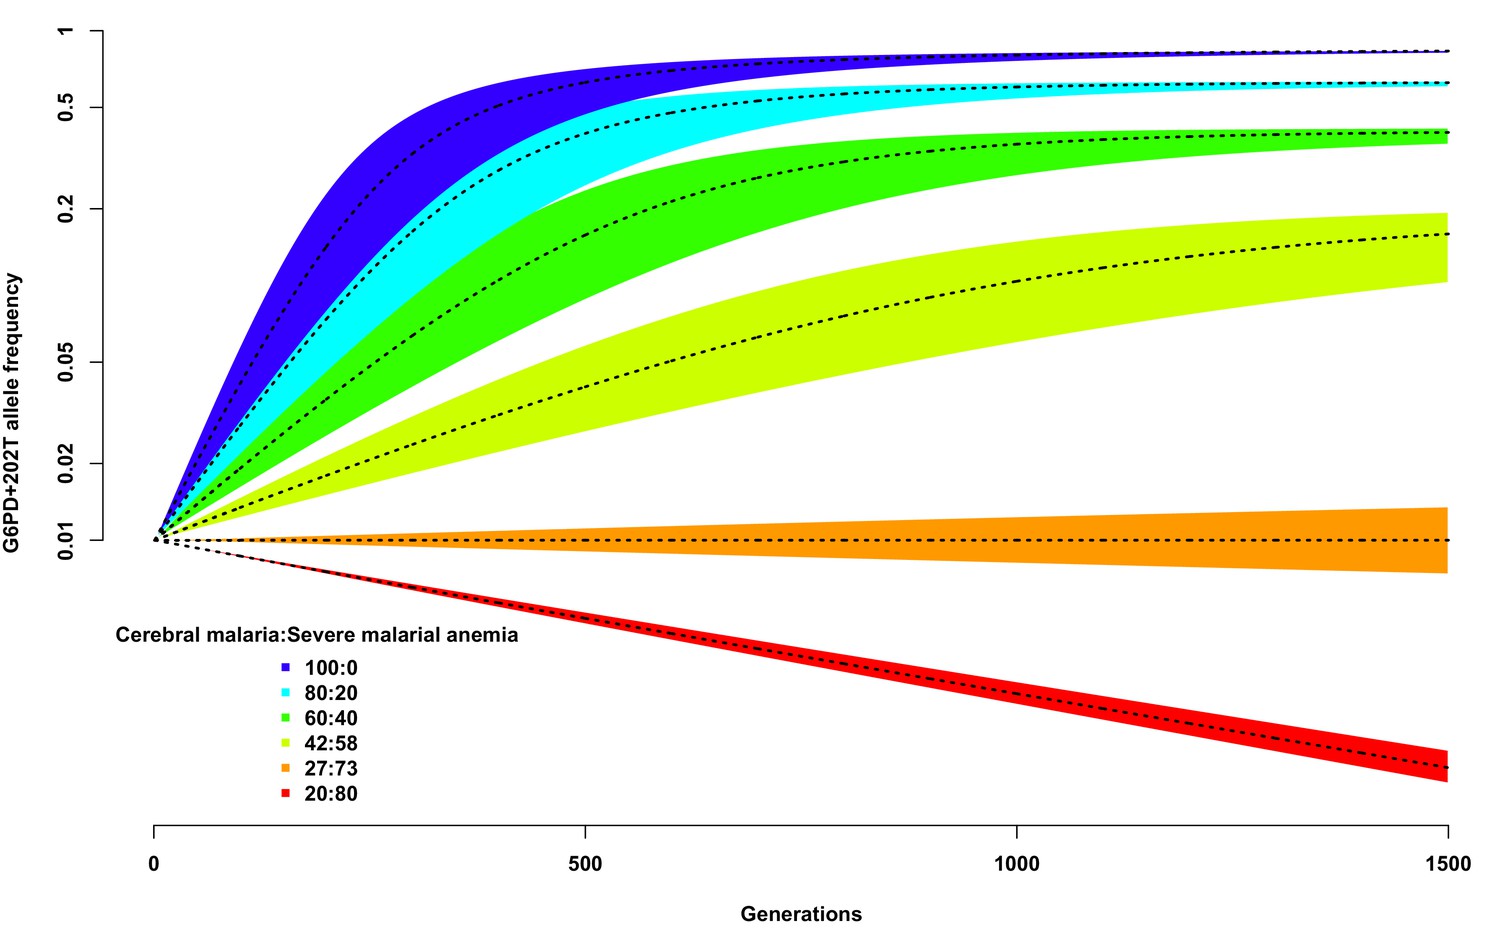
Allele frequency of G6PD+202T.
Change in the allele frequency of G6PD+202T under the adapted Levene model. We assume an initial frequency of 0.01 in both males and females and that the change in allele frequency depends only on genotype fitness as a consequence of relative exposure to three selective forces: cerebral malaria, severe malarial anaemia and no selection (see Materials and methods). Here we have assumed that, in each generation, 50% of children suffer from severe malaria and show results for different ratios of cerebral malaria to severe malarial anaemia cases, as indicated for each coloured polygon. Within each of these polygons, the solid black lines shows the allele frequencies when thefatality rate of cerebral malaria (severe malarial anaemia) is 20% (10%); the lower bound to 15% (8%); and the upper bound to 25% (12%).
Figure 4
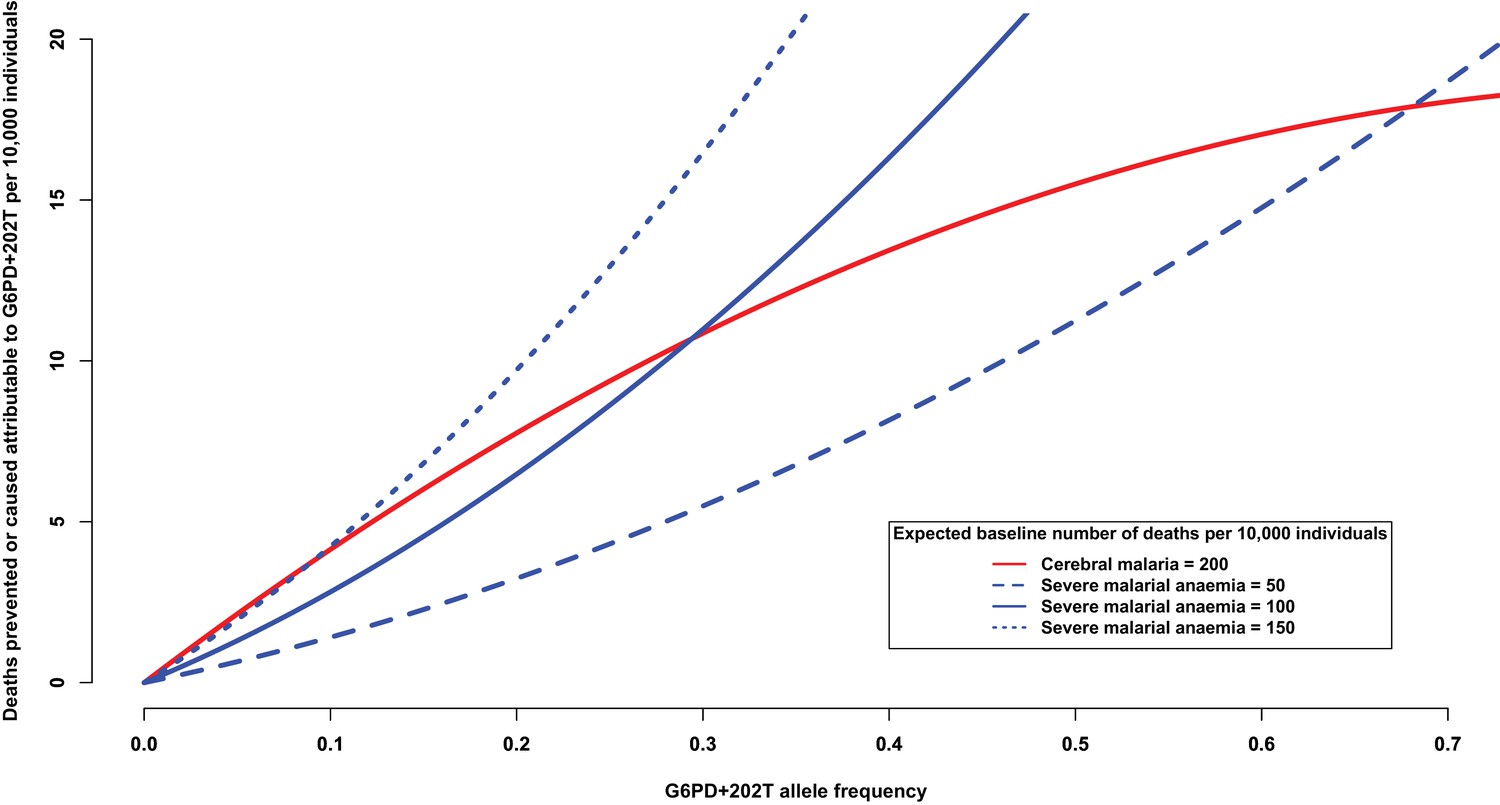
Deaths prevented or caused attributable to the genetic effects at G6PD+202.
The solid red line shows the number of deaths due to cerebral malaria that are prevented by the presence of G6PD+202T, assuming a baseline risk of death due to cerebral malaria of 200/10,000 individuals. The blue lines show the number of deaths due to severe malarial anaemia that are caused by the presence of G6PD+202T for various baseline risks of death due to severe malarial anaemia, as indicated. The baseline risk of death is the expected number of deaths per 10,000 wild-type individuals, i.e. when the frequency of G6PD+202T is zero. Results are shown as the allele frequency of G6PD+202T increases. Relative risks of disease are estimated by odds ratios observed in this study.
Tables
Table 1
Clinical phenotype case counts, percentage of fatalities and descriptive statistics. Numbers are given for cases and controls of all severe malaria by study site, with the percentage of case fatalities shown in parentheses. Cases are further divided into those with cerebral malaria, severe malarial anaemia, both cerebral malaria and severe malarial anaemia, and other severe malaria. Percentage of males refers to cases and controls. CM, cerebral malaria; SMA, severe malarial anaemia.
Study site | Case and control counts (% fatality) | % males | Age in years (IQR) | ||||||||
|---|---|---|---|---|---|---|---|---|---|---|---|
CM | SMA | CM and SMA | Other severe malaria | Total cases | Total controls | CM | SMA | All severe malaria | Controls* | ||
Gambia | 815 (26) | 470 (5) | 139 (24) | 1,082 (7) | 2,506 (14) | 3,281 | 51.2 | 4.5 (3–7) | 2.3 (1.5–3.9) | 3.8 (2.2–5.9) | 0 |
Mali | 78 (27) | 182 (8) | 69 (22) | 107 (12) | 436 (15) | 328 | 53.3 | 5 (3.5–7.2) | 2 (1.2–3.4) | 3 (1.7–5) | 3 (2–5) |
Burkina Faso | 107 (20) | 38 (11) | 20 (20) | 681 (1) | 846 (5) | 721 | 54.0 | 4 (3–6) | 2.8 (2–4) | 3.8 (2–6) | 3 (2–4) |
Ghana (Navrongo) | 21 (24) | 244 (2) | 14 (36) | 389 (3) | 668 (4) | 197 | 56.7 | 1.8 (1.1–2.4) | 1.1 (0.8–1.8) | 1.3 (0.9–2) | 1.2 (0.8–1.7) |
Ghana (Kumasi) | 230 (10) | 548 (2) | 76 (13) | 635 (2) | 1,489 (4) | 2,027 | 52.2 | 2.5 (1.5–4) | 1.3 (0.8–2.5) | 2 (1–3.7) | 0 |
Nigeria | 6 (17) | 7 (14) | 0 (0) | 64 (2) | 77 (4) | 40 | 57.0 | 1.7 (1–5.6) | 2.2 (1.6–4.5) | 3 (1.6–4) | 2.6 (1.1–3.9) |
Cameroon | 39 (18) | 82 (7) | 8 (50) | 493 (2) | 622 (5) | 576 | 60.7 | 3 (1.4–4.2) | 2 (1.2–3.5) | 2.1 (1.2–4) | 21 (7.5–28) |
Kenya | 901 (13) | 158 (8) | 213 (16) | 972 (8) | 2,244 (11) | 3,935 | 50.9 | 2.6 (1.6–3.8) | 1.8 (1–3) | 2.2 (1.2–3.6) | 0.5 (0.4–0.7) |
Tanzania | 34 (41) | 179 (4) | 28 (29) | 186 (11) | 427 (11) | 455 | 49.0 | 2.3 (1.7–3.8) | 1.5 (0.9–2.5) | 1.7 (1.1–2.7) | 2.9 (2.1–3.9) |
Malawi | 875 (15) | 129 (7) | 157 (20) | 219 (27) | 1380 (17) | 2,582 | 52.0 | 3 (2–4.7) | 2.2 (1.1–3.1) | 2.8 (1.8–4.2) | 0 |
Vietnam | 209 (18) | 31 (6) | 8 (12) | 545 (9) | 793 (11) | 2,505 | 58.6 | 30 (22–42) | 24 (17.5–37.5) | 29 (22–41) | 0 |
Papua New Guinea | 44 (5) | 116 (2) | 9 (11) | 214 (1) | 383 (2) | 242 | 55.3 | 3.8 (2.6–5) | 2.2 (1.3–3.2) | 2.9 (2.1–4.3) | 3.3 (2.2–4.8) |
Total | 3,359 (18) | 2,184 (5) | 741 (20) | 5,587 (6) | 11,871 (10) | 16,889 | 53.1 | 3.4 (2.1–5.8) | 1.8 (1–3) | 2.8 (1.5–5) | 0 (0–0.7) |
-
*Four sites used cord blood controls (i.e. age 0).
Table 2
WHO-classified G6PD deficiency alleles observed in this study. Locus refers to GRCh37, dbSNP137 and Ensembl build 84. WHO refers to grade of G6PD deficiency based on the WHO classification scheme. Allele frequency is calculated in population controls. GM Gambia; ML, Mali; BF, Burkina Faso; GH-N, Ghana (Noguchi); GH-K, Ghana (Kumasi); NG Nigeria; CM, Cameroon; KY, Kenya; TZ, Tanzania; MW, Malawi; VN, Vietnam; PNG, Papua New Guinea.
SNP | Locus | Base change | WHO | Allele frequency | |||||||||||
|---|---|---|---|---|---|---|---|---|---|---|---|---|---|---|---|
GM | ML | BF | GH-N | GH-K | NG | CM | KY | TZ | MW | VN | PNG | ||||
CM973154 | 153760261 | A/C | I | 0.0004 | 0.0000 | 0.0000 | 0.0000 | 0.0000 | 0.0000 | 0.0000 | 0.0000 | 0.0000 | 0.0000 | 0.0000 | 0.0000 |
rs72554665 | 153760484 | C/A | II | 0.0004 | 0.0000 | 0.0000 | 0.0000 | 0.0000 | 0.0000 | 0.0000 | 0.0000 | 0.0000 | 0.0000 | 0.0055 | 0.0000 |
CM920290 | 153760605 | G/A | II | 0.0002 | 0.0000 | 0.0000 | 0.0000 | 0.0000 | 0.0000 | 0.0000 | 0.0000 | 0.0000 | 0.0000 | 0.0014 | 0.0028 |
rs137852342 | 153761184 | G/A | III | 0.0000 | 0.0020 | 0.0000 | 0.0000 | 0.0000 | 0.0000 | 0.0000 | 0.0000 | 0.0000 | 0.0000 | 0.0014 | 0.0000 |
rs76723693 | 153761240 | 968T>C | III | 0.0695 | 0.0082 | 0.0009 | 0.0000 | 0.0003 | 0.0000 | 0.0000 | 0.0000 | 0.0000 | 0.0000 | 0.0000 | 0.0000 |
rs137852327 | 153761337 | C/T | II | 0.0006 | 0.0000 | 0.0000 | 0.0000 | 0.0000 | 0.0000 | 0.0000 | 0.0000 | 0.0000 | 0.0000 | 0.0096 | 0.0141 |
CM014189 | 153761820 | T/A | II | 0.0004 | 0.0000 | 0.0000 | 0.0000 | 0.0008 | 0.0000 | 0.0000 | 0.0004 | 0.0000 | 0.0000 | 0.0000 | 0.0000 |
rs137852328 | 153762340 | 680G>T | III | 0.0002 | 0.0000 | 0.0000 | 0.0000 | 0.0000 | 0.0000 | 0.0000 | 0.0000 | 0.0000 | 0.0000 | 0.0000 | 0.0000 |
rs137852330 | 153762605 | G/A | II | 0.0004 | 0.0000 | 0.0000 | 0.0000 | 0.0000 | 0.0000 | 0.0000 | 0.0000 | 0.0000 | 0.0000 | 0.0003 | 0.0000 |
rs5030868 | 153762634 | 563G>A | II | 0.0000 | 0.0000 | 0.0000 | 0.0000 | 0.0000 | 0.0000 | 0.0000 | 0.0003 | 0.0000 | 0.0000 | 0.0000 | 0.0085 |
rs5030872 | 153762655 | 542A>T | II | 0.0145 | 0.0041 | 0.0009 | 0.0000 | 0.0003 | 0.0000 | 0.0000 | 0.0000 | 0.0000 | 0.0000 | 0.0000 | 0.0000 |
CM970547 | 153763462 | G/A | II | 0.0008 | 0.0000 | 0.0000 | 0.0000 | 0.0000 | 0.0000 | 0.0000 | 0.0000 | 0.0000 | 0.0000 | 0.0000 | 0.0000 |
rs78365220 | 153763485 | A/G | II | 0.0002 | 0.0000 | 0.0000 | 0.0000 | 0.0000 | 0.0000 | 0.0000 | 0.0000 | 0.0000 | 0.0000 | 0.0000 | 0.0366 |
rs1050829 | 153763492 | 376T>C | IV | 0.3206 | 0.4132 | 0.4186 | 0.4476 | 0.4267 | 0.5574 | 0.3429 | 0.4060 | 0.3787 | 0.3920 | 0.0000 | 0.0000 |
rs1050828 | 153764217 | 202C>T | III | 0.0273 | 0.1616 | 0.1447 | 0.1713 | 0.1847 | 0.3167 | 0.1075 | 0.1930 | 0.2071 | 0.1988 | 0.0000 | 0.0000 |
Table 3
G6PD+202 best model association test results. p values and odds ratios, with 95% confidence interval, for association at G6PD+202 with all cases of severe malaria and with the two sub-types cerebral malaria and severe malarial anaemia, for all samples combined and separately for males and females. Results are shown for all sites combined and are adjusted for sickle-cell trait, ethnicity and sex.
Sample | Case phenotype | Case frequency* | Control frequency* | Model† | Model OR (95% CI) | P | Sites excluded‡ |
|---|---|---|---|---|---|---|---|
All | Cerebral malaria | 0.13 (2,528/337/231) | 0.15 (11,155/1,701/1,229) | A | 0.91 (0.85–0.97) | 7.22×10⁻³ | VN, PNG |
0.13 (2,528/337/231) | 0.15 (11,155/1,701/1,229) | D | 0.86 (0.77–0.95) | 4.54×10⁻³ | VN, PNG | ||
0.13 (2,528/337/231) | 0.15 (11,155/1,701/1,229) | R | 0.86 (0.74–1) | 0.06 | VN, PNG | ||
Severe malarial anaemia | 0.17 (1,566/212/256) | 0.15 (11,155/1,701/1,229) | A | 1.18 (1.09–1.28) | 7.48×10⁻⁵ | VN, PNG | |
0.17 (1,566/212/256) | 0.15 (11,155/1,701/1,229) | D | 1.21 (1.06–1.38) | 5.44×10⁻³ | VN, PNG | ||
0.17 (1,566/212/256) | 0.15 (11,155/1,701/1,229) | R | 1.53 (1.29–1.82) | 1.19×10⁻⁶ | VN, PNG | ||
Severe malaria | 0.14 (8,536/1,138/986) | 0.15 (11,155/1,701/1,229) | A | 1.01 (0.97–1.06) | 0.65 | VN, PNG | |
0.14 (8,536/1,138/986) | 0.15 (11,155/1,701/1,229) | D | 0.98 (0.92–1.05) | 0.58 | VN, PNG | ||
0.14 (8,536/1,138/986) | 0.15 (11,155/1,701/1,229) | R | 1.09 (0.99–1.2) | 0.08 | VN, PNG | ||
Females | Cerebral malaria | 0.14 (1,145/337/38) | 0.15 (4,933/1,701/168) | A | 0.91 (0.81–1.03) | 0.15 | VN, PNG |
0.14 (1,145/337/38) | 0.15 (4,933/1,701/168) | D | 0.88 (0.77–1.01) | 0.08 | VN, PNG | ||
0.14 (1,145/337/38) | 0.15 (4,933/1,701/168) | H | 0.87 (0.75–1) | 0.05 | VN, PNG | ||
0.14 (1,145/337/38) | 0.15 (4,933/1,701/168) | R | 1.06 (0.73–1.54) | 0.75 | VN, PNG | ||
Severe malarial anaemia | 0.16 (673/212/40) | 0.15 (4,933/1,701/168) | A | 1.11 (0.95–1.29) | 0.19 | VN, PNG | |
0.16 (673/212/40) | 0.15 (4,933/1,701/168) | D | 1.04 (0.87–1.24) | 0.68 | VN, PNG | ||
0.16 (673/212/40) | 0.15 (4,933/1,701/168) | H | 0.93 (0.77–1.13) | 0.47 | VN, PNG | ||
0.16 (673/212/40) | 0.15 (4,933/1,701/168) | R | 1.86 (1.23–2.81) | 3.40×10⁻³ | VN, PNG | ||
Severe malaria | 0.14 (3,729/1,138/132) | 0.15 (4,933/1,701/168) | A | 0.95 (0.88–1.03) | 0.21 | VN, PNG | |
0.14 (3,729/1,138/132) | 0.15 (4,933/1,701/168) | D | 0.92 (0.84–1.01) | 0.07 | VN, PNG | ||
0.14 (3,729/1,138/132) | 0.15 (4,933/1,701/168) | H | 0.9 (0.82–0.99) | 0.03 | VN, PNG | ||
0.14 (3,729/1,138/132) | 0.15 (4,933/1,701/168) | R | 1.13 (0.88–1.45) | 0.33 | VN, PNG | ||
Males | Cerebral malaria | 0.12 (1,379/–/193) | 0.15 (6,207/–/1,058) | M | 0.82 (0.69–0.98) | 0.03 | NG, VN, PNG |
Severe malarial anaemia | 0.19 (893/–/216) | 0.15 (6,222/–/1,061) | M | 1.48 (1.22–1.8) | 6.58×10⁻⁵ | VN, PNG | |
Severe malaria | 0.15 (4,807/–/854) | 0.15 (6,222/–/1,061) | M | 1.08 (0.97–1.2) | 0.14 | VN, PNG |
-
*Derived allele frequency and counts of wild-type homozygotes, heterozygotes and derived homozygotes, where male hemizygotes are counted as female homozygotes.
-
†Models are additive (A), dominant (D), recessive (R) heterozygous model (H) or male hemizygous (M).
-
‡Sites at which an SNP is monomorphic in either cases or controls are excluded from the combined analysis. NG, Nigeria; VN, Vietnam; PNG, Papua New Guinea.
Table 4
Association signals at loci previously reported to be in association with severe malaria and at loci with the strongest association signals in all individuals at all sites combined, after adjustment for G6PD+202. Odds Ratios (OR), 95% Confidence Intervals (95% CI) and P values (P) for the optimal genetic model for association with all severe malaria and with two sub-types, cerebral malaria and severe malarial anaemia, at loci previously reported to be associated with severe malaria or where the best model association P value is <0.01 in fixed effect tests of association at all sites combined. Results are only shown for loci with a minor allele frequency in controls of >1% or count of >5: this excludes previously reported loci rs137852328 and rs5030868. Signals are adjusted for the sickle-cell trait, ethnicity, sex and G6PD+202.
SNP | Locus* | Base change | Control frequency† | Case phenotype | Case frequency† | Model‡ | Model OR(95% CI) | P | Sites excluded§ |
|---|---|---|---|---|---|---|---|---|---|
Previously reported loci | |||||||||
rs76723693 | 153761240 | 968T>C | 0.07 (3,254/210/129) | Cerebral malaria | 0.05 (835/36/20) | D | 0.65 (0.48–0.87) | 4.60×10⁻³ | All except GM, ML |
0.07 (2,930/208/127) | Severe malarial anaemia | 0.07 (421/29/20) | A | 1.06 (0.85–1.31) | 0.63 | All except GM | |||
0.07 (3,254/210/129) | Severe malaria | 0.05 (2,737/128/70) | A | 0.83 (0.73–0.95) | 6.83×10⁻³ | All except GM, ML | |||
rs5030872 | 153762655 | 542A>T | 0.01 (3,530/48/24) | Cerebral malaria | 0.004 (885/5/1) | A | 0.42 (0.21–0.82) | 1.15×10⁻² | All except GM, ML |
0.01 (3,530/48/24) | Severe malarial anaemia | 0.02 (636/7/6) | R | 1.62 (0.62–4.26) | 0.33 | All except GM, ML | |||
0.01 (6,258/50/24) | Severe malaria | 0.01 (5,234/19/12) | D | 0.56 (0.36–0.85) | 6.99×10⁻³ | All except GM, ML, BF | |||
rs1050829 | 153763492 | 376T>C | 0.39 (7,039/3,244/3,771) | Cerebral malaria | 0.36 (1,620/710/746) | A | 0.97 (0.92–1.03) | 0.30 | VN, PNG |
0.39 (7,039/3,244/3,771) | Severe malarial anaemia | 0.42 (955/427/629) | R | 1.12 (0.98–1.28) | 0.08 | VN, PNG | |||
0.39 (7,039/3,244/3,771) | Severe malaria | 0.39 (5,332/2,278/2,966) | R | 1.05 (0.98–1.13) | 0.17 | VN, PNG | |||
Strongest association signals | |||||||||
rs766420 | 153554404 | C/G | 0.57 (5,333/3,529/7,792) | Cerebral malaria | 0.60 (975/715/1628) | D | 1.02 (0.93–1.11) | 0.74 | None |
0.57 (5,333/3,529/7,792) | Severe malarial anaemia | 0.64 (550/443/1,168) | R | 0.97 (0.87–1.09) | 0.63 | None | |||
0.57 (5,333/3,529/7,792) | Severe malaria | 0.6 (3,462/2,464/5,812) | R | 0.93 (0.88–0.98) | 6.20×10⁻³ | None | |||
rs73573478 | 153761564 | G/A | 0.10 (11,710/1,311/740) | Cerebral malaria | 0.12 (2,538/330/196) | D | 1.18 (1.06–1.32) | 3.30×10⁻³ | NG, VN, PNG |
0.10 (11,745/1,315/740) | Severe malarial anaemia | 0.10 (1,721/168/117) | D | 0.94 (0.8–1.09) | 0.40 | VN,PNG | |||
0.10 (11,745/1,315/740) | Severe malaria | 0.11 (8,904/990/660) | R | 1.11 (0.99–1.25) | 0.08 | VN, PNG | |||
rs2515905 | 153762075 | G/A | 0.19 (10,201/2,061/1,611) | Cerebral malaria | 0.18 (2,315/432/342) | R | 1.13 (0.94–1.36) | 0.20 | VN, PNG |
0.19 (10,201/2,061/1,611) | Severe malarial anaemia | 0.21 (1,444/265/302) | R | 1.39 (1.11–1.75) | 4.36×10⁻³ | VN, PNG | |||
0.19 (10,201/2,061/1,611) | Severe malaria | 0.19 (7,861/1,423/1,325) | R | 1.21 (1.07–1.37) | 2.12×10⁻³ | VN,PNG | |||
rs73641103 | 153769889 | G/A | 0.01 (11,932/183/82) | Cerebral malaria | 0.02 (2,774/46/36) | R | 1.83 (1.21–2.77) | 4.20×10⁻³ | ML, BF, NG, CM, VN, PNG |
0.02 (13,485/206/92) | Severe malarial anaemia | 0.02 (1,961/28/17) | R | 1.56 (0.9–2.7) | 0.11 | NG, VN, PNG | |||
0.02 (13,522/208/93) | Severe malaria | 0.02 (10,379/150/94) | R | 1.51 (1.11–2.05) | 8.11×10⁻³ | VN, PNG | |||
rs7053878 | 153834100 | T/A | 0.06 (15,249/739/597) | Cerebral malaria | 0.06 (2,996/153/134) | A | 1.09 (0.99–1.21) | 0.09 | GH-N, NG |
0.06 (15,437/744/600) | Severe malarial anaemia | 0.09 (1,920/77/134) | D | 1.02 (0.82–1.28) | 0.84 | NG | |||
0.06 (15,437/744/600) | Severe malaria | 0.07 (10,505/475/622) | A | 1.1 (1.03–1.17) | 6.98×10⁻³ | NG | |||
-
*Locus refers to NCBI Build 37.
-
†Derived allele frequency and counts of wild-type homozygotes, heterozygotes and derived homozygotes where male hemizygotes are counted as female homozygotes.
-
‡Models are additive (A), dominant (D) or recessive (R).
-
§Sites at which an SNP is monomorphic in either cases or controls are excluded from the combined analysis. GM, Gambia; ML, Mali; BF, BurkinaFaso; GH_N, Ghana (Noguchi); NG, Nigeria; CM, Cameroon; VN, Vietnam; PNG, Papua New Guinea.
Table 5
Calculation of the G6PD deficiency (G6PDd) score. The G6PDd score is calculated on the basis of the haplotypes at the 15 WHO-classified SNPs. For each haplotype, the loss of normal G6PD function is determined according to the WHO severity class (0, I, II, III or IV) of the most severe mutation carried. See Materials and methods for more details. The G6PDd score for each individual is then the average loss of function across the two haplotypes, where males are treated as homozygous females. For example, the assigned loss of normal G6PD function for a haplotype where the most severe mutation is the class III mutation G6PD+202T is 65, so an individual with this haplotype and another with no deficiency mutations will average a G6PDd score of 32.5. Individuals were further categorized on the basis of their G6PDd score as normal G6PDd (G6PDd score = 0); Low G6PDd (0 < G6PDd score < 25, blue boxes); Medium G6PDd (25 ≤ G6PDd score < 50, yellow boxes); High G6PDd (50 ≤ G6PDd score < 85, orange boxes); or Very High (G6PDd ≥ 85, red box). Scores not observed in our study are shown in grey boxes.
G6PDd score | Haplotype 1 | ||||||
|---|---|---|---|---|---|---|---|
Severity class (loss of normal G6PD function) | |||||||
0 (0) | IV (20) | III (65) | II (95) | I (100) | |||
Haplotype 2 | Severity class (Loss of normal G6PD function) | 0 (0) | 0 | 10 | 32.5 | 47.5 | 50 |
IV (20) | 10 | 20 | 42.5 | 57.5 | 60 | ||
III (65) | 32.5 | 42.5 | 65 | 80 | 82.5 | ||
II (95) | 47.5 | 57.5 | 80 | 95 | 97.5 | ||
I (100 | 50 | 60 | 82.5 | 97.7 | 100 | ||
Table 6
G6PD deficiency score categorical model association test results. Counts, odds ratios (ORs), 95% confidence intervals (95% CI) and P-values are presented for the effect of each category of G6PD deficiency (G6PDd) score, compared to individuals with G6PDd score = 0, for all severe malaria cases and for the two subtypes cerebral malaria and severe malarial anaemia. P-value shown in bold is for overall model fit. P-value for the overall model fit. Results are shown for all individuals combined at each site and across all sites. Results are adjusted for the sickle-cell trait, ethnicity and sex. n.c., not calculated.
Sample | G6PDd score category | Controls | Severe malaria | Cerebral malaria | Severe malarial anaemia | ||||||
|---|---|---|---|---|---|---|---|---|---|---|---|
N (%) | N (%) | OR (95% CI) | P | N (%) | OR (95% CI) | P | N (%) | OR (95% CI) | P | ||
Females | 0 | 3,761 (46.4) | 2,299 (42.6) | – | – | 672 (42.3) | -– | -– | 400 (39.8) | -– | -– |
All | (0–25) | 2,132 (26.3) | 1,626 (30.1) | 0.98 (0.9–1.08) | 0.72 | 495 (31.2) | 1.02 (0.89–1.17) | 0.81 | 306 (30.4) | 1.08 (0.9–1.29) | 0.41 |
(25–50) | 2,001 (24.7) | 1,310 (24.3) | 0.88 (0.8–0.97) | 8.59E-03 | 377 (23.7) | 0.83 (0.71–0.96) | 1.04E-02 | 252 (25.1) | 1 (0.83–1.21) | 0.99 | |
All | (50–85) | 210 (2.6) | 156 (2.9) | 1.02 (0.81–1.28) | 0.85 | 44 (2.8) | 0.93 (0.66–1.31) | 0.67 | 45 (4.5) | 1.71 (1.16–2.53) | 6.86E-03 |
≥85 | 2 (0) | 8 (0.1) | 7.3 (1.43–37.24) | 0.02 | 0 (0) | n.c | n.c. | 2 (0.2) | 9.72 (1.01–93.12) | 0.05 | |
Overall | 8,106 | 5,399 | 3.68E-03 | 1,588 | – | 0.06 | 1,005 | – | 0.03 | ||
Males | 0 | 5,960 (67.9) | 4,216 (65.1) | -– | -– | 1,212 (68.4) | – | – | 707 (60) | – | – |
All | (0–25) | 1,572 (17.9) | 1,303 (20.1) | 1.08 (0.99–1.19) | 0.08 | 342 (19.3) | 1.01 (0.88–1.16) | 0.86 | 227 (19.3) | 1.05 (0.87–1.25) | 0.63 |
(25–50) | 0 (0) | 0 (0) | n.c | n.c. | 0 (0) | n.c | n.c. | 0 (0) | n.c | n.c. | |
All | (50–85) | 1,196 (13.6) | 923 (14.3) | 1.05 (0.95–1.16) | 0.35 | 214 (12.1) | 0.79 (0.67–0.94) | 6.31E-03 | 236 (20) | 1.44 (1.2–1.74) | 1.17E-04 |
≥85 | 55 (0.6) | 30 (0.5) | 0.65 (0.4–1.04) | 0.07 | 3 (0.2) | 0.26 (0.08–0.85) | 0.03 | 9 (0.8) | 1.24 (0.58–2.67) | 0.58 | |
Overall | 8,783 | 6,472 | -– | 0.08 | 1,771 | -– | 1.49E-03 | 1,179 | – | 1.97E-03 | |
All | 0 | 9,721 (57.6) | 6,515 (54.9) | – | – | 1,884 (56.1) | – | – | 1,107 (50.7) | – | – |
All | (0–25) | 3,704 (21.9) | 2,929 (24.7) | 1.05 (0.99–1.12) | 0.12 | 837 (24.9) | 1.03 (0.93–1.13) | 0.56 | 533 (24.4) | 1.05 (0.93–1.19) | 0.45 |
(25–50) | 2,001 (11.8) | 1,310 (11) | 0.94 (0.86–1.03) | 0.16 | 377 (11.2) | 0.86 (0.75–0.99) | 0.04 | 252 (11.5) | 0.95 (0.8–1.14) | 0.6 | |
(50–85) | 1,406 (8.3) | 1,079 (9.1) | 1.02 (0.93–1.12) | 0.71 | 258 (7.7) | 0.8 (0.69–0.93) | 2.95E-03 | 281 (12.9) | 1.49 (1.26–1.76) | 2.22E-06 | |
≥85 | 57 (0.3) | 38 (0.3) | 0.87 (0.55–1.36) | 0.54 | 3 (0.1) | 0.28 (0.09–0.86) | 0.03 | 11 (0.5) | 1.44 (0.66–3.17) | 0.36 | |
All | Overall | 16,889 | 11,871 | – | 0.14 | 3,359 | – | 2.29E-04 | 2184 | – | 1.02E-04 |
Table 7
Fitness arrays suggested by observed OR estimates of effect at G6PD+202 on cerebral malaria and severe malarial anaemia. A1 represents the wild-type allele and A2 the derived allele. In females, odds ratios (ORs) for association with cerebral malaria in derived homozygotes and heterozygotes compared to wild-type homozygotes are 0.87 and ~1, respectively, suggesting a symmetrical heterozygous advantage. In males, the OR for association with cerebral malaria in derived, compared to wild-type, hemizygotes is 0.82, suggesting a moderate fitness difference between male genotypes. For severe malarial anaemia, in females, the ORs in derived homozygotes and heterozygotes, compared to wild-type heterozygotes, are 1.84 and 1, respectively, suggesting selection against derived homozygotes; in males, the OR in derived hemizygotes, compared to wild-type, is 1.48, suggesting selection against derived male hemizygotes. The case fatality rate is estimated to be 20% (m = 0.2) for cerebral and 10% (m = 0.1) for severe malarial anaemia.
Genotype | Females | Males | |||||
|---|---|---|---|---|---|---|---|
A1A1 | A1A2 | A2A2 | A1 | A2 | |||
w11 | w 12 | w 22 | w 1 | w 2 | |||
Cerebral malaria selection | |||||||
Observed OR* | 1 | 0.87 (0.75–1) | 1.02 (0.7–1.48) | 1 | 0.82 (0.69–0.97) | ||
Fitness Array† | 1–sfCM | 1 | 1–sfCM | 1–smCM | 1 | ||
Fitness (w) | 0.974 | 1 | 0.974 | 0.964 | 1 | ||
Severe malarial anaemia selection | |||||||
Observed OR* | 1 | 0.97 (0.8–1.17) | 1.84 (1.21–2.79) | 1 | 1.48 (1.22–1.8) | ||
Fitness Array‡ | 1 | 1 | 1–sfSMA | 1 | 1–smSMA | ||
Fitness (w) | 1 | 1 | 0.954 | 1 | 0.968 | ||
-
*Odds ratios are estimated from a genotypic model and are adjusted for sickle-cell trait and ethnicity.
-
†sfCM = m(1–OR) = 0.2 (1 0.87) = 0.26. smCM = 0.2(1–0.82) = 0.036.
-
‡sfSMA = m (1–1/OR) = 0.1 (1–1/1.84) = 0.046; smSMA = m(1–1/OR) = 0.1 (1 1/1.48) = 0.032.
Additional files
-
Supplementary file 1
(A) Summary of study designs of contributing partner studies to MalariaGEN Consortial Project 1 (CP1). (B) Genotyped sample distribution. (C) Summary of 65 SNPs selected for analysis and successfully genotyped. (D) G6PD+202 female association test results. (E) G6PD+202 male association test results. (F) G6PD+202 all individuals association test results. (G) G6PD-deficiency score female categorical model female association test results. (H) G6PD-deficiency score categorical model male association test results. (I) G6PD-deficiency score categorical model all individuals association test results. (J) G6PD-deficiency score additive model association test results.
- https://doi.org/10.7554/eLife.15085.019
-
Supplementary file 2
(A) SNP selection across G6PD region for genotyping. (B) SpectroDESIGNER assay design file for 135 G6PD locus SNPs in four multiplexes. (C) SpectroDESIGNER assay design file for 107 G6PD locus SNPs in four multiplexes. (D) SpectroDESIGNER assay design file for 68 G6PD locus SNPs in three multiplexes.
- https://doi.org/10.7554/eLife.15085.020
Download links
A two-part list of links to download the article, or parts of the article, in various formats.
Downloads (link to download the article as PDF)
Open citations (links to open the citations from this article in various online reference manager services)
Cite this article (links to download the citations from this article in formats compatible with various reference manager tools)
Characterisation of the opposing effects of G6PD deficiency on cerebral malaria and severe malarial anaemia
eLife 6:e15085.
https://doi.org/10.7554/eLife.15085


