Optical electrophysiology for probing function and pharmacology of voltage-gated ion channels
- Harvard University, United States
- Howard Hughes Medical Institute, Harvard University, United States
Figures
Figure 1
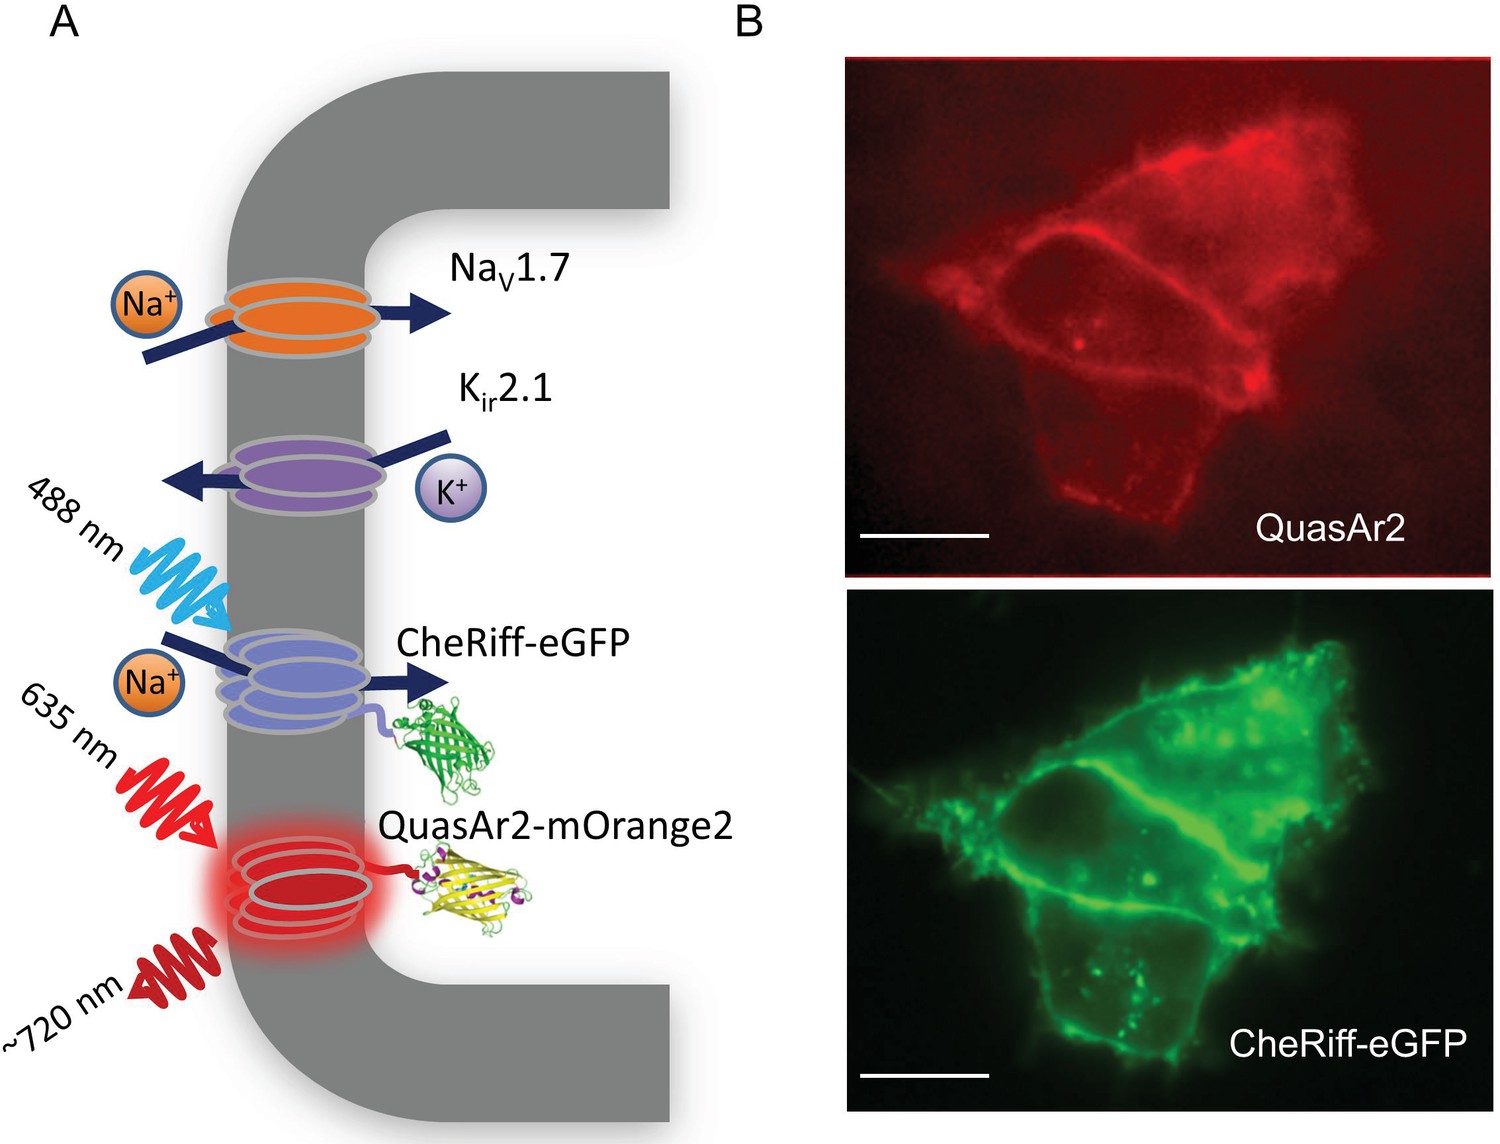
NaV1.7 Optopatch Spiking (NaV1.7-OS) HEK cells.
(A) Genes expressed heterologously in NaV1.7-OS HEK cells. Kir2.1 maintains a hyperpolarized resting potential close to the K+ reversal potential. NaV1.7 imparts electrical excitability. CheRiff depolarizes the cells upon optical excitation and can trigger a NaV1.7-mediated action potential. QuasAr2 is excited by red light and emits near infrared fluorescence in a voltage-dependent manner. (B) Epifluorescence images of QuasAr2 and CheRiff-eGFP expressed in NaV1.7-OS HEK cells. Scale bar 10 μm.
Figure 2 with 4 supplements
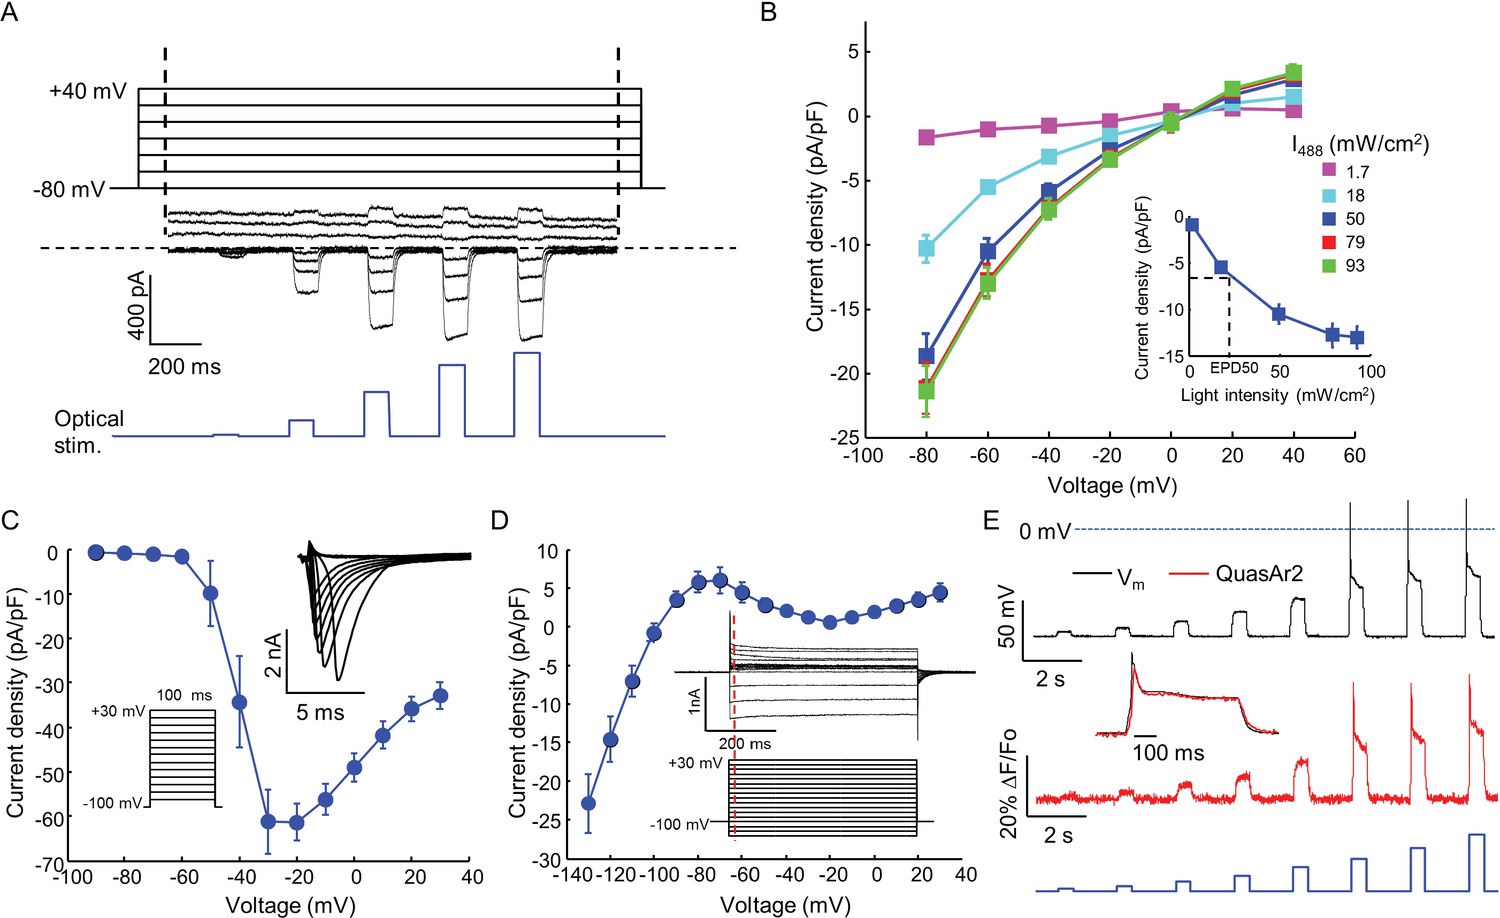
Biophysical characterization of NaV1.7-OS HEK cells.
(A) CheRiff current in a NaV1.7-Optopatch HEK cell. Membrane potential was held at −80 mV and then stepped for 2 s to −80 to +40 mV in 20 mV increments. During each depolarization, the cell was exposed to 5 pulses of blue light, 100 ms duration, with increasing intensity (1.7, 18, 50, 79, 93 mW/cm2). The horizontal dashed line indicates zero current. (B) I-V relation of CheRiff, under different light intensities. Currents were measured relative to baseline without blue light. Inset: Steady state photocurrent density as a function of blue light intensity, with a holding potential of −60 mV. (C) Peak NaV1.7 current densities as a function of depolarization potential. Membrane potential was held at -100 mV and then stepped for 100 ms to −90 mV to + 30 mV in 10 mV increments. These measurements were performed prior to transient expression of Kir2.1. Inset: currents in the 10 ms interval following each voltage step. (D) I-V relationship of Kir2.1 expressed in NaV1.7-OS HEK cells. Membrane potential was held at -100 mV and stepped for 500 ms to −130 mV to +30 mV in 10 mV increments. Inset: representative Kir2.1 current recording. Red line indicates the time point (4 ms after voltage step) at which the current was quantified. (E) Simultaneous voltage and QuasAr2 fluorescence recording from NaV1.7-OS HEK cells. The cell was exposed to a series of blue laser pulses, 500 ms duration, with increasing intensities (1.1, 2.3, 4.3, 7.0, 11, 15, 20, 26 mW/cm2) and QuasAr2 fluorescence was monitored with 640 nm excitation, 400 W/cm2. Inset: overlay of the voltage and fluorescence recordings from the most intense blue pulse (26 mW/cm2).
Figure 2—figure supplement 1
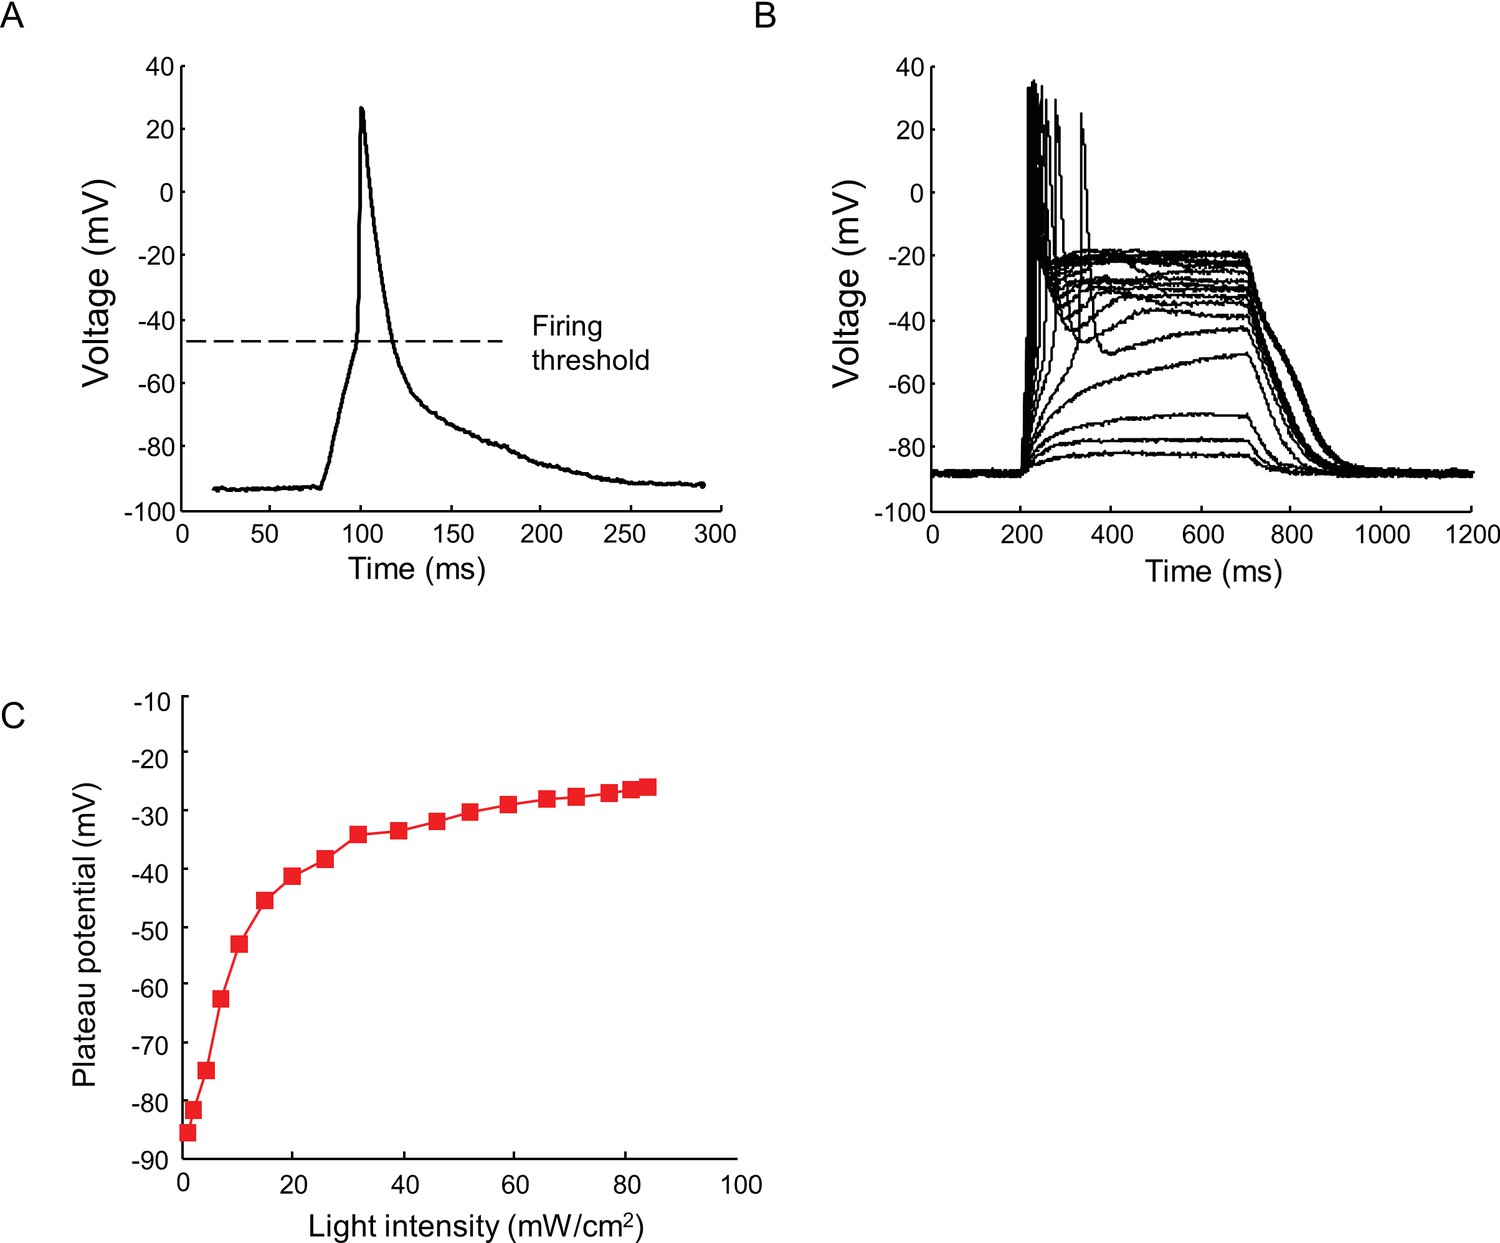
Current clamp recording of light triggered action potentials in Nav1.7-OS HEK cells.
(A) An action potential recorded via manual patch clamp from a Nav1.7-OS HEK cell cluster stimulated by 20 ms blue light pulse at 50 mW/ cm2. The dashed line indicates the firing threshold. (B) Plateau potential induced by different intensities of blue light stimulation. Current clamp recordings were performed on Nav1.7-OS HEK cell clusters stimulated with 500 ms blue light ranging from 1.1 to 84 mW/ cm2. (C) Membrane potential at 400 ms after onset of blue light stimulus as a function of the blue light intensity.
Figure 2—figure supplement 2

Relationship between Nav1.7 current density and spike height.
(A) Combined current clamp and voltage clamp protocol in the presence of 3 μM amitriptyline to prepare cells with varying NaV1.7 capacities. Initially, a current clamp protocol was applied in which a depolarizing pulse led to amitriptyline binding and complete channel block. After a variable recovery period, Δt, a test pulse of current induced a voltage spike whose amplitude was recorded. The voltage during the prepulse and recovery periods was then replayed in voltage clamp mode to induce an identical level of channel block. A step depolarization to -20 mV induced a spike in NaV1.7 current whose amplitude was recorded. For details see Materials and methods. (B) Upper trace: current clamp recording showing voltage during 500 ms prepulse intervals, variable recovery period, and test pulses (asterisks). Bottom left: magnified view of voltage during test pulses. Bottom right: magnified view of NaV1.7 current during test pulse under voltage clamp. (C) Voltage spike amplitude as a function of NaV1.7 current amplitude for paired current-clamp and voltage-clamp recordings. Error bars represent s.e.m. of n = 8 cells.
Figure 2—figure supplement 3
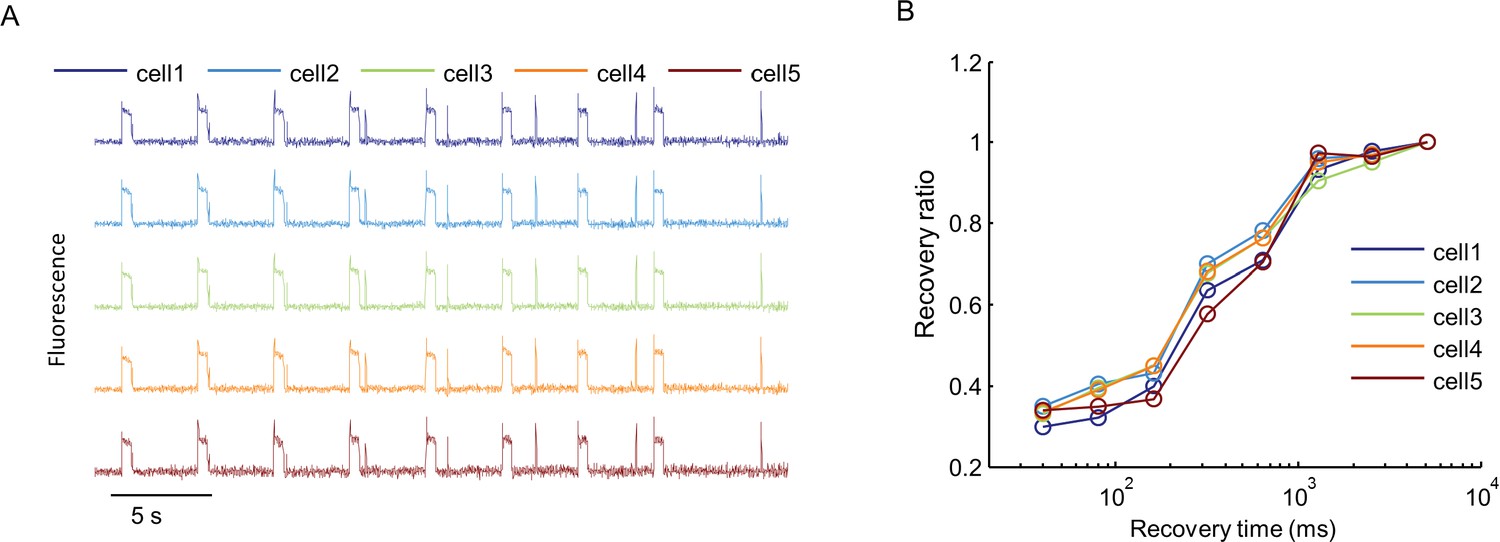
Cell-to-cell variability in Optopatch measurements.
(A) Nav1.7-OS HEK cells in a confluent monolayer were imaged in the presence of 3 μM amitriptyline with a 60× oil immersion objective (numerical aperture 1.45). Cells were illuminated with a red laser at 400 W/cm2. A blue prepulse (500 ms, 50 mW/cm2) depolarized membrane potential and allowed drug binding. A variable recovery period (40 ms to 5120 ms) led to partial unbinding. A blue test pulse (20 ms, 50 mW/cm2) probed the voltage spike induced by residual NaV1.7 capacity. Traces show fluorescence of QuasAr2 from five different single cells recorded in parallel. (B) Ratio of spike amplitude in test pulse to spike amplitude at the longest recovery time (5120 ms), as a function of recovery time for the five single cells shown in (A).
Figure 2—figure supplement 4

Effects of intense red laser illumination.
(A) Heating by red laser illumination (635 nm, 400 W/cm2). Temperatures were recorded with a small thermocouple not directly illuminated by the laser. Measurements were performed in a single well of a 384-well plate with 36 μL buffer, and in a 35 mm dish with 2 mL buffer (error bars represent s.e.m., n = 4 replicates). (B) Test for photobleaching and phototoxicity. Nav1.7-OS HEK cell were illuminated with red laser (635 nm, 400 W/cm2) continuously for 10 min. Every one minute, the cells were stimulated with blue light (6 pulses of 20 ms, 5 Hz, 50 mW/cm2). The first, sixth and the tenth spike trains are shown above. (C) SNR and spike height (ΔF/F0) for each spike train in (B) as a function of red laser illumination time. Error bars represent s.d. of n = 6 spikes. (D) Effect of red laser intensity on SNR of QuasAr2 fluorescence spikes. Cells were illuminated with red laser at varying intensities and stimulated with pulses of blue light (8 pulses of 20 ms, 10 Hz, 50 mW/cm2). (E) SNR of spikes recorded in (D) as a function of red laser intensity. Error bars represent s.d. of n = 8 spikes.
Figure 3 with 1 supplement
Mechanistic studies of NaV1.7 blockers.
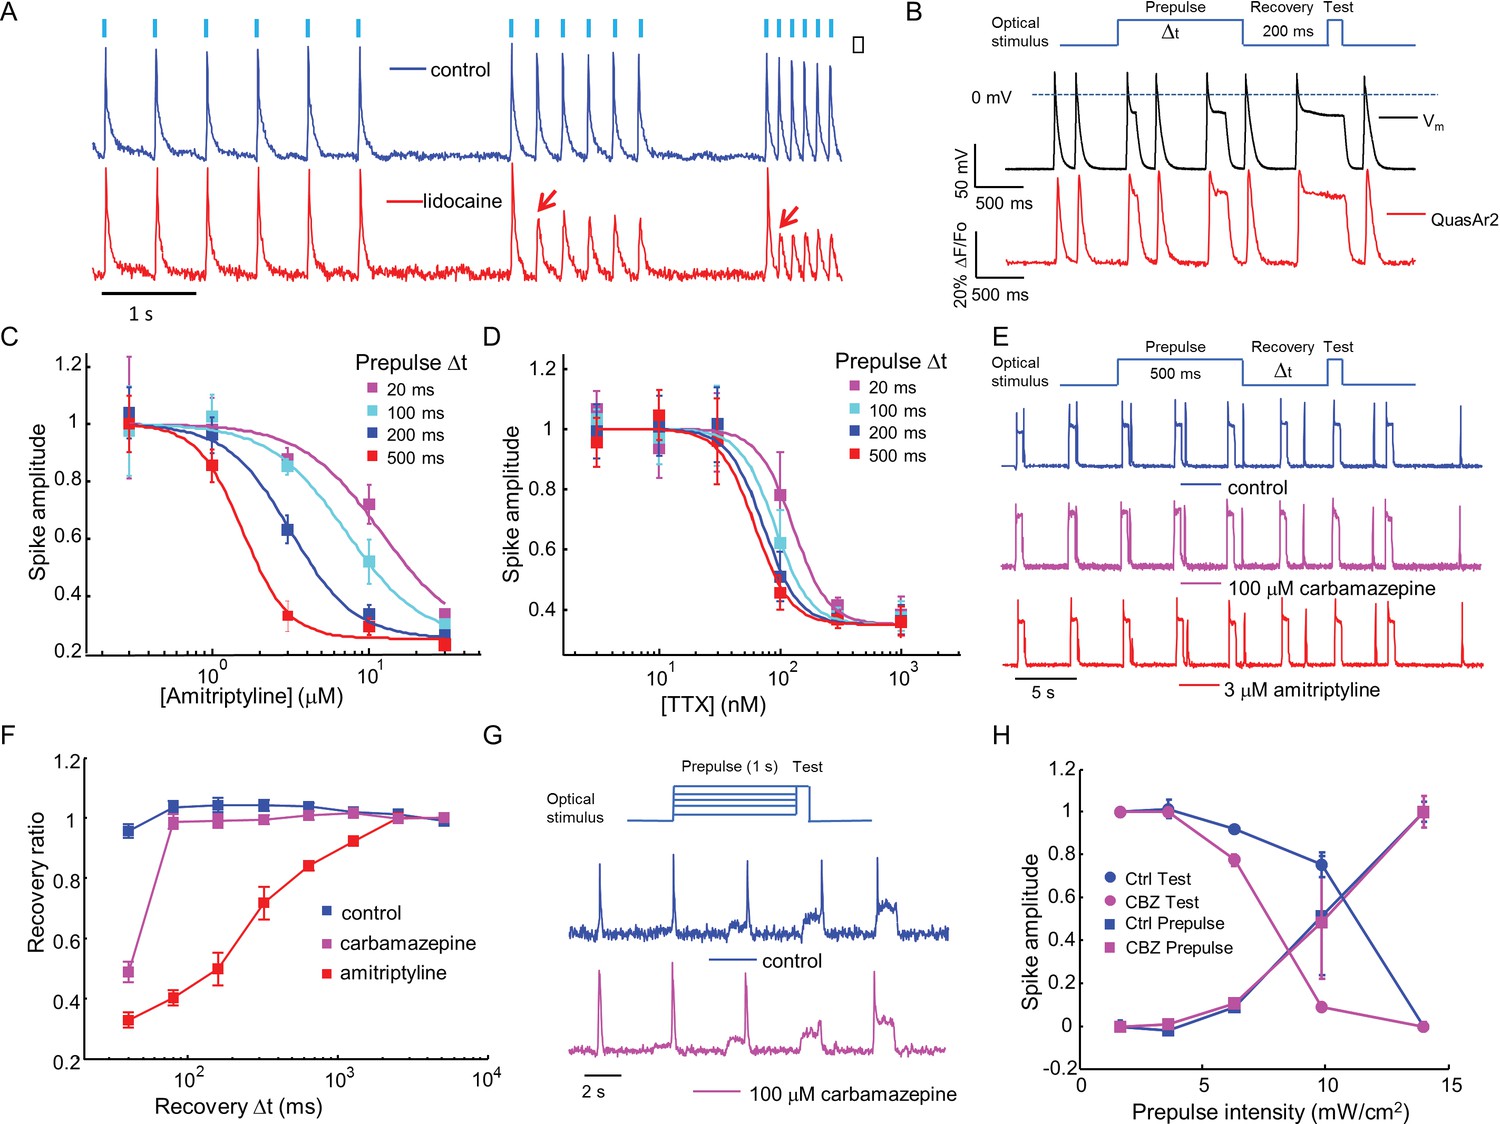
(A) Approximately 150 NaV1.7-OS HEK cells were stimulated with pulses of blue light (20 ms, 50 mW/cm2) at increasing frequencies (2 Hz, 4 Hz, 8 Hz) and their total QuasAr2 fluorescence was recorded with 635 nm excitation, 400 W/cm2. In control cells (blue), the fluorescence indicated spiking in response to each stimulus. After exposure to 200 μM lidocaine (red), cells showed activity-dependent block at 4 Hz and 8 Hz, but not at 2 Hz (red arrows). (B) Simultaneous current clamp and QuasAr2 fluorescence recordings from a NaV1.7-OS HEK cell cluster (4 cells) stimulated with prepulses of varying length (20, 100, 200 and 500 ms; 50 mW/cm2) followed by 200 ms recovery and a test pulse (30 ms, 50 mW/cm2). (C,D) Application of the protocol in (B) to dose-response curves for (C) amitriptyline or (D) TTX. Test pulse spike amplitude was normalized to its value in the presence of the lowest tested concentration of drug (n = 3–5 wells for amitriptyline per data-point; n = 4–6 wells for TTX per data-point; ~150 cells per well). (E) Optical assay of NaV1.7 recovery from fast inactivation. A 500 ms prepulse (50 mW/cm2) populated the fast inactivated state and allowed drug binding. A variable recovery period (40 ms to 5120 ms) was followed by a 20 ms test pulse (50 mW/cm2). Traces show fluorescence of QuasAr2 for control cells and after addition of either 100 μM carbamazepine or 3 μM amitriptyline. (F) Ratio of spike amplitude in test pulse to spike amplitude at the longest recovery time (5120 ms), as a function of recovery time. Carbamazepine modestly slowed recovery and amitriptyline dramatically slowed recovery (n = 9–11 wells per curve, ~150 cells per well). (G) Optical protocol to measure voltage-dependent NaV1.7 activation and inactivation. Cells were stimulated with 1000 ms prepulse with increasing intensity (1.7, 3.6, 6.3, 9.8, 14 mW/cm2), immediately followed by a test pulse (150 ms, 14 mW/cm2). Traces show representative fluorescence recordings of control and 100 μM carbamazepine. (H) Effect of carbamazepine on activation and inactivation curves. Spike amplitudes were normalized to the maximum spike amplitude in the trace and were then plotted against prepulse intensity (n = 3 wells per curve). Carbamazepine left-shifted the inactivation curve, decreasing the optically measured overlap between activation and inactivation.
Figure 3—figure supplement 1
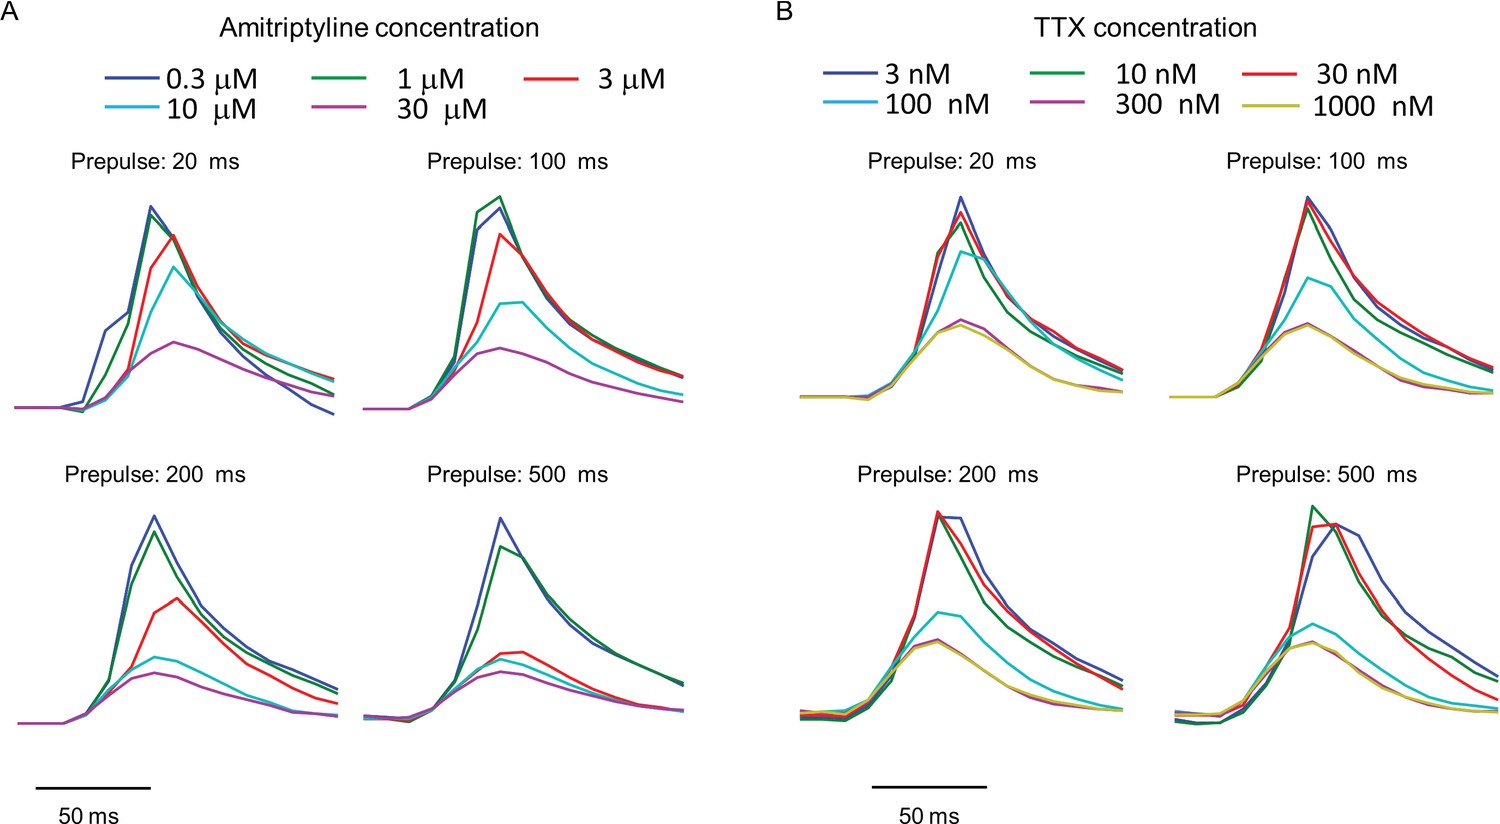
Use-dependent inhibition of NaV1.7 by amitriptyline and TTX.
Data used to produce Figures 3C,D. Plots show the fluorescence response evoked by the test pulse with variable duration prepulses. Each trace is the average of n = 3–5 wells for amitriptyline or n = 4–6 wells for TTX.
Figure 4
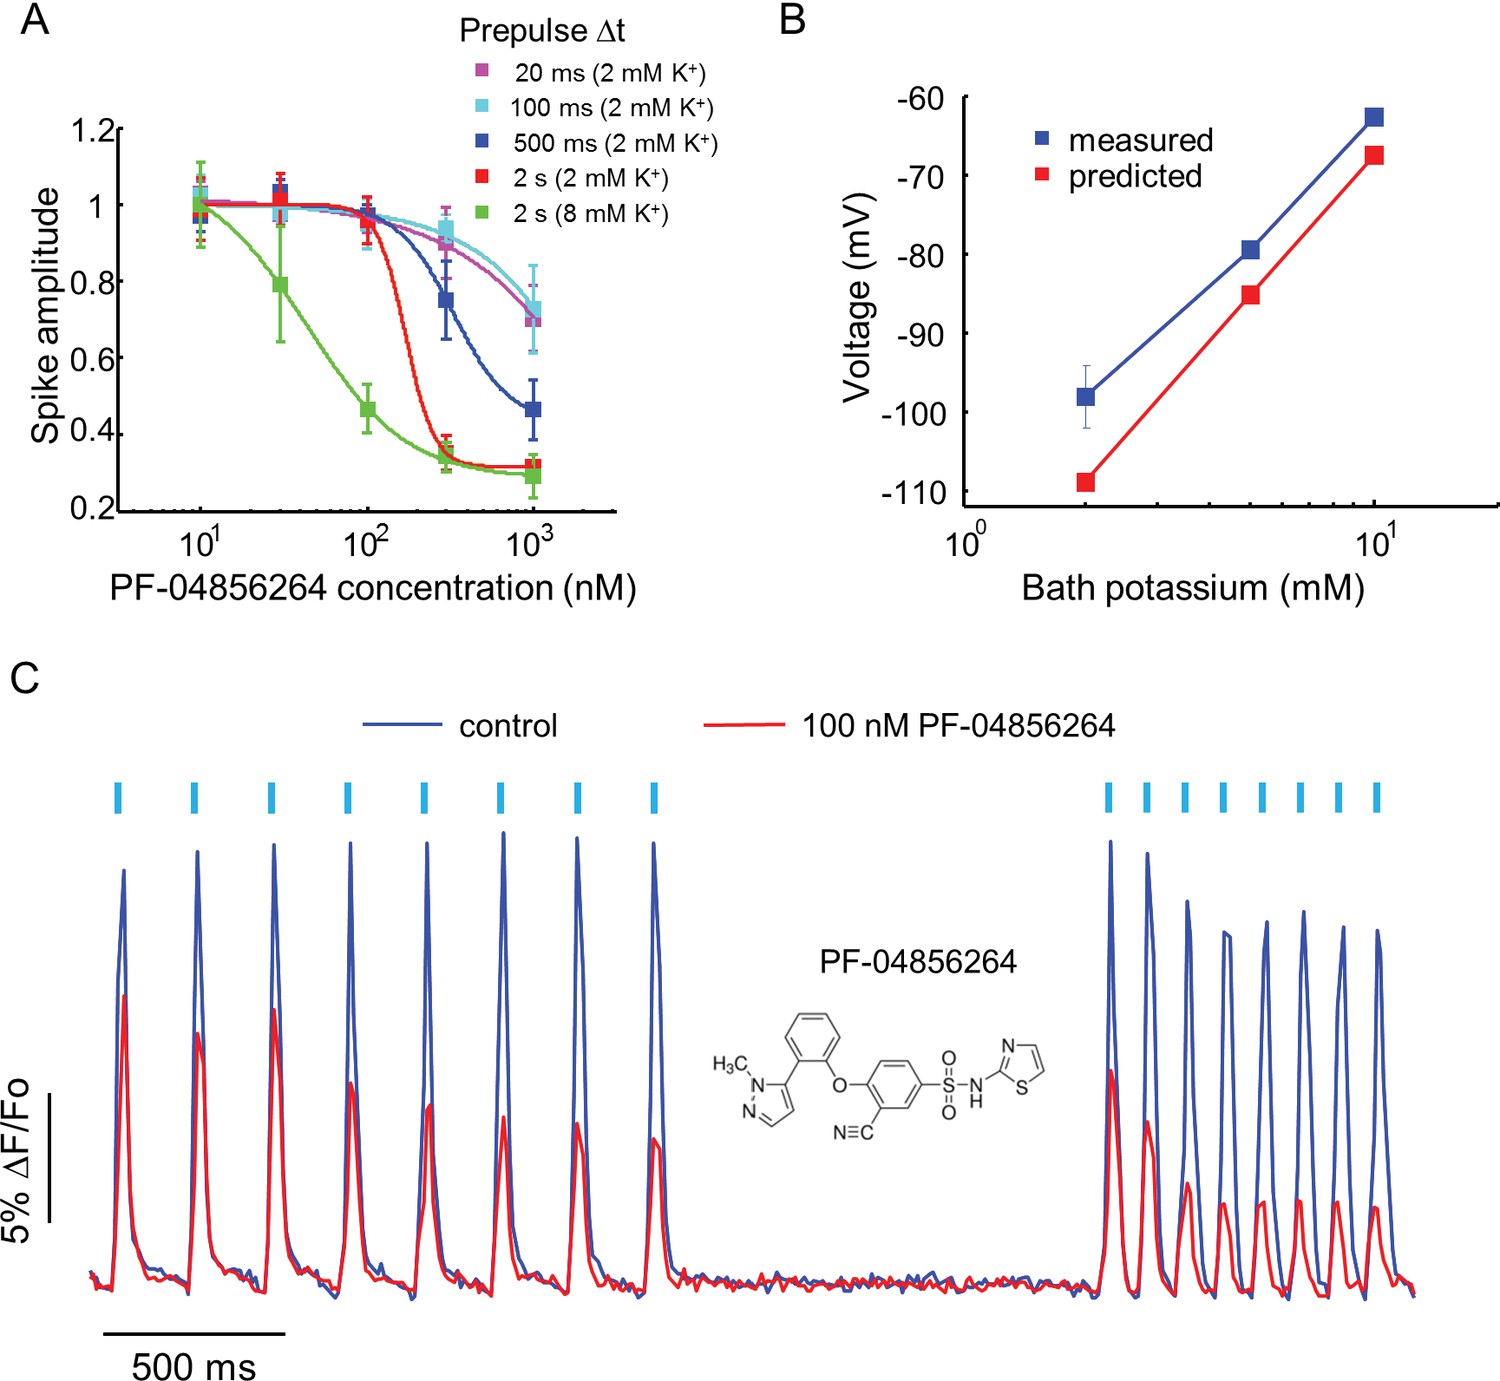
Effect of PF-04856264, a subtype-specific blocker, on NaV1.7-OS HEK cells.
(A) Dose-response curves for PF-04856264 when stimulated with prepulses of different durations and with different bath K+ concentrations (n = 4 wells for each concentration). The optical protocol was as in Figure 3B, with prepulse duration specified in figure legends. (B) Comparison between membrane voltage predicted by the Nernst Equation (assuming pure K+ conductance) and recorded by manual patch clamp, as a function of bath [K+] (n = 4–7 cell clusters per data point). (C) Use-dependent inhibition of spiking in NaV1.7-OS HEK cells by PF-04856264, at 8 mM external K+. Cells were stimulated with eight pulses of blue light (20 ms, 50 mW/cm2) at 5 Hz and 10 Hz and QuasAr2 fluorescence was monitored with 635 nm excitation, 400 W/cm2. After photobleaching correction, the QuasAr2 fluorescence in the absence or in the presence of 100 nM PF-04856264, was normalized to peak amplitude of the first spike at 5 Hz in the absence of the drug. Each trace was averaged from 4 wells. Inset: structure of PF-04856264.
Figure 5 with 2 supplements
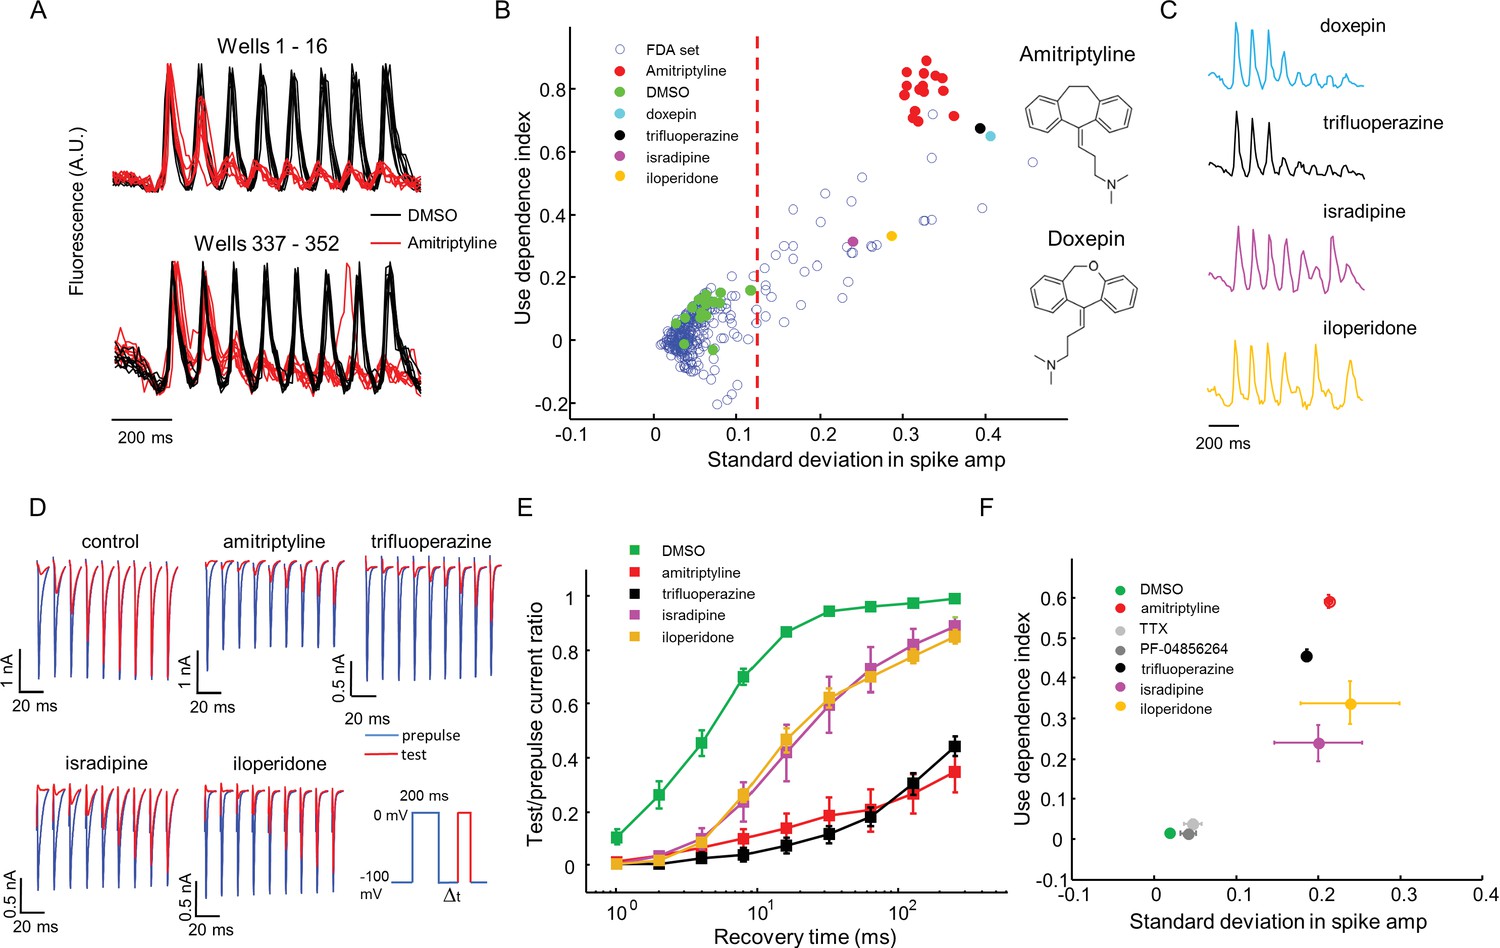
High throughput screening of a FDA-approved drug library in NaV1.7-OS HEK cells.
(A) QuasAr2 fluorescence from positive (amitriptyline) and negative (DMSO) control wells. Cells were stimulated with eight pulses of blue light (20 ms, 50 mW/cm2) at 10 Hz, and QuasAr2 fluorescence was monitored with 635 nm excitation, 400 W/cm2. (B) Screen results. The response of each well was parameterized by its use dependence index and standard deviation in spike amplitude. Positive controls (red) and negative controls (green) were well separated. Selected hits were chosen for further analysis. Inset: structures of amitriptyline and doxepin. (C) QuasAr2 fluorescence traces of doxepin, trifluoperazine, isradipine and iloperidone recorded in the screen. (D) Validation of select hits by manual electrophysiology. Nav1.7-Optopatch cells were held at −100 mV. A 200 ms prepulse to 0 mV allowed drug binding. Recovery times at −100 mV ranged from 1 ms to 256 ms. A test pulse to 0 mV, 100 ms duration, probed the degree of channel recovery. Blue: NaV1.7 current during prepulse. Red: NaV1.7 current during test pulse. (Prepulse and test pulse currents have been time-shifted and overlaid for easy comparison). Each compound was tested at 10 μM. (E) Quantification of compound effects on NaV1.7 recovery from inactivation. The plots show ratio of current amplitude at test pulse to prepulse, as a function of recovery period (n = 3 cells for each compound, n = 12 cells for control). (F) Characterization of select hits from (B) in NaV1.5-OS HEK cells. Cells were stimulated with eight pulses of blue light (20 ms, 50 mW/cm2) at 4 Hz. The 4 Hz stimulus was selected because action potential width of Nav1.5-OS cells lasted longer than 200 ms under control conditions. Data analyzed and plotted as in (B) (n = 4–6 wells per drug). Drug concentrations were TTX: 1 μM, PF-04856264: 1 μM, amitriptyline: 10 μM, trifluoperazine: 10 μM, isradipine: 10 μM, iloperidone: 30 μM).
-
Figure 5—source data 1
Spreadsheet containing compound names and screening results.
- https://doi.org/10.7554/eLife.15202.013
Figure 5—figure supplement 1
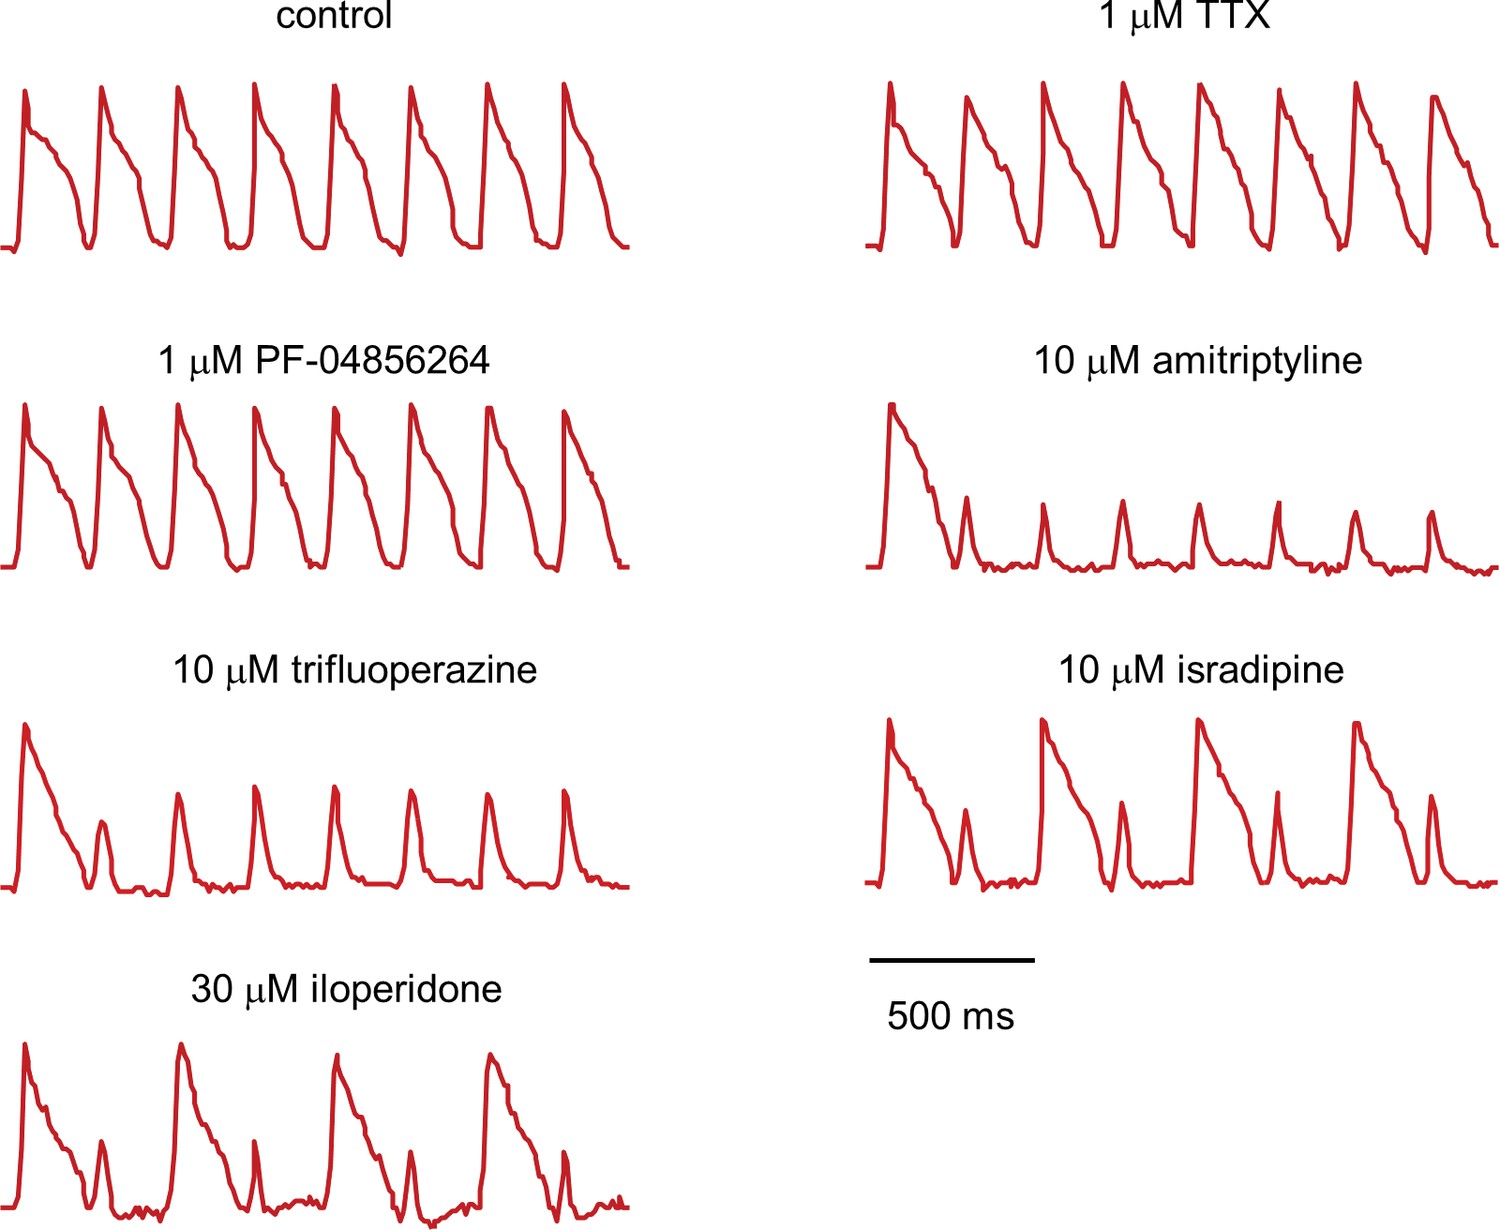
Fluorescence traces from NaV1.5-OS HEK cells with different drugs.
NaV1.5-OS HEK cells were stimulated with eight pulses of blue light (20 ms, 50 mW/cm2) at 4 Hz, and QuasAr2 fluorescence was monitored with 635 nm excitation, 400 W/cm2. TTX and PF-04856264 had little effect on channel function. Amitriptyline and trifluoperazine showed strong use-dependent block. Isradipine and iloperidone showed use-dependent block with fast recovery, leading to alternating response amplitudes.
Figure 5—figure supplement 2
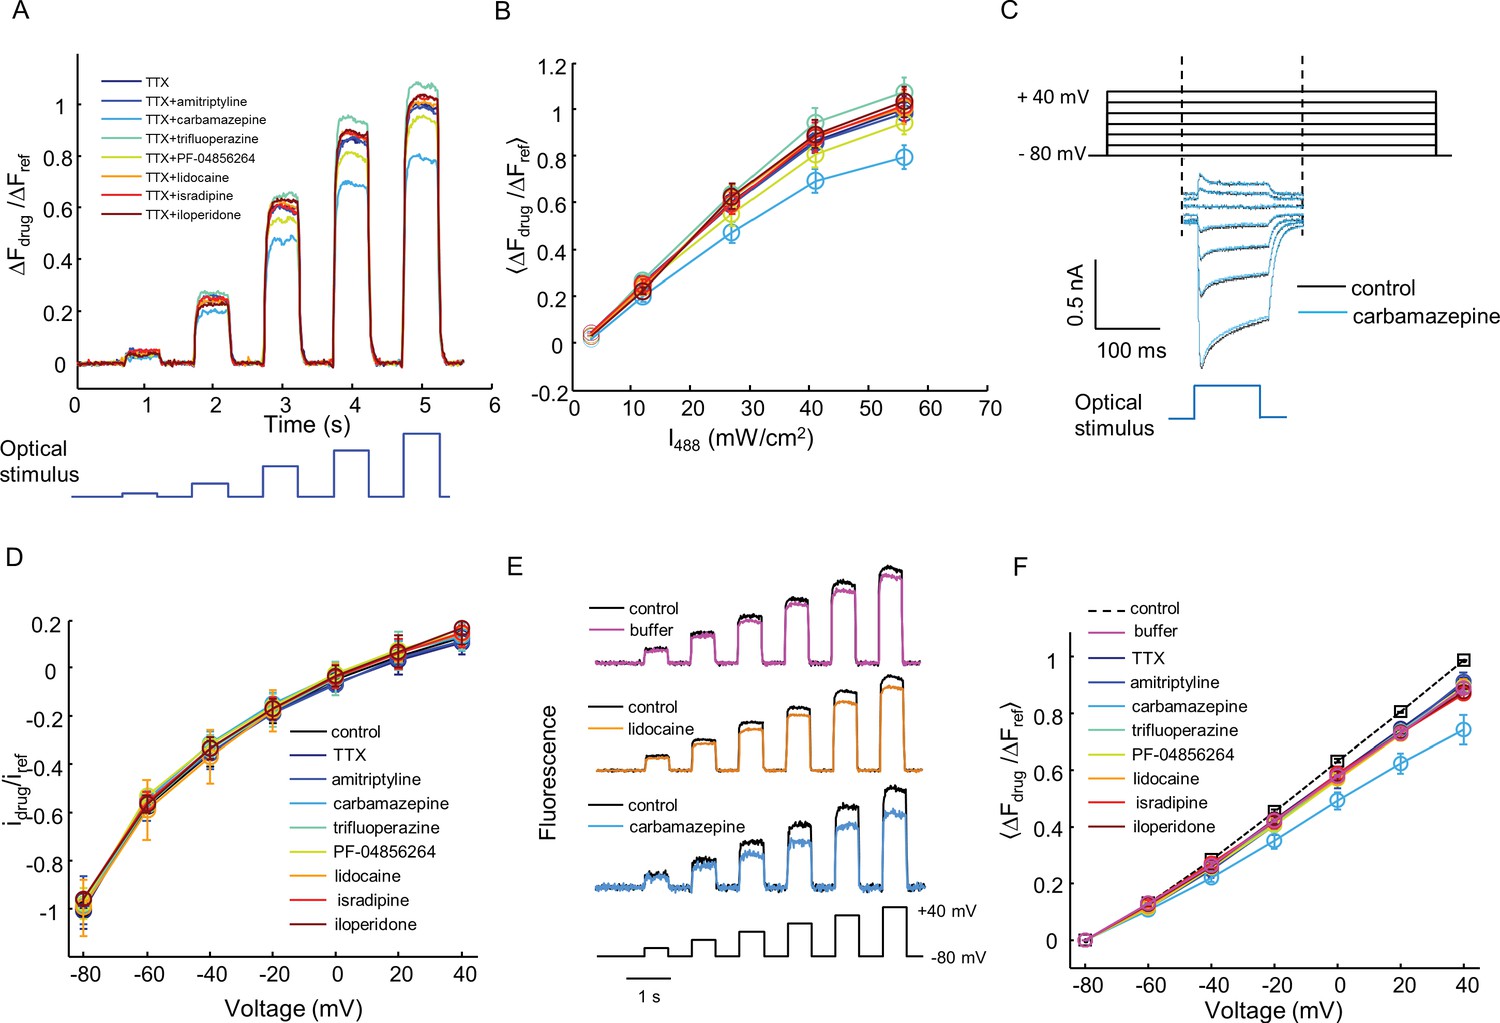
Characterization of off-target effects via optical and manual patch assays.
(A) Optical assay to detect perturbations to Kir2.1, CheRiff, or QuasAr2 in NaV1.7-OS HEK cells. NaV1.7 was blocked with 1 μM TTX. Cells were stimulated with increasing intensities of blue light (500 ms, 3.2, 12, 27, 41, 56 mW/cm2), and QuasAr2 fluorescence was monitored with 635 nm excitation, 400 W/cm2. Fluorescence with a test compound (10 μM amitriptyline, 100 μM carbamazepine, 10 μM trifluoperazine, 1 μM PF-04856264, 200 μM lidocaine, 10 μM isradipine, 10 μM iloperidone) was compared to TTX alone. The fluorescence changes were normalized to that of TTX only treated cells under 56 mW/cm2 stimulation. (B) Mean fluorescence changes in (A) during the blue stimuli as a function of stimulus intensity. Error bars represent s.e.m. of n = 9–10 wells. (C) Voltage clamp protocol to test for drug effects on CheRiff photocurrent. Cells were held at −80 mV and then stepped to −60 mV to +40 mV in 20 mV increments. During each step depolarization, a blue light pulse (100 ms, 0.5 W/cm2) was applied to activate CheRiff current. Control trace and trace after carbamazepine treatment are shown as an example. (D) I-V relationship of CheRiff current under control condition (before drug treatment) and with test compounds at the same concentrations as in (A). To control for cell-to-cell variations in CheRiff expression, the current amplitudes were normalized to that of control at −80 mV. Error bars represent s.e.m., n = 29 cells for control, n = 3–4 cells for each compound. (E) Voltage-clamp measurements to test for drug effects on QuasAr2 voltage sensitivity. QuasAr2 fluorescence was monitored with 640 nm excitation, 400 W/cm2 while membrane voltage was modulated as shown. Single cell recordings were performed before and after addition of drug or buffer control. Example traces show fluorescence before and after addition of buffer, lidocaine or carbamazepine. (F) Mean QuasAr2 fluorescence as a function of voltage in the presence of test compounds at the same concentrations as in (A). To control for cell-to-cell variation in QuasAr2 expression, the fluorescence changes were normalized to the pre-drug fluorescence at +40 mV. Error bars represent s.e.m., n = 30 cells for control, n = 3–4 cells for each compound.
Figure 6
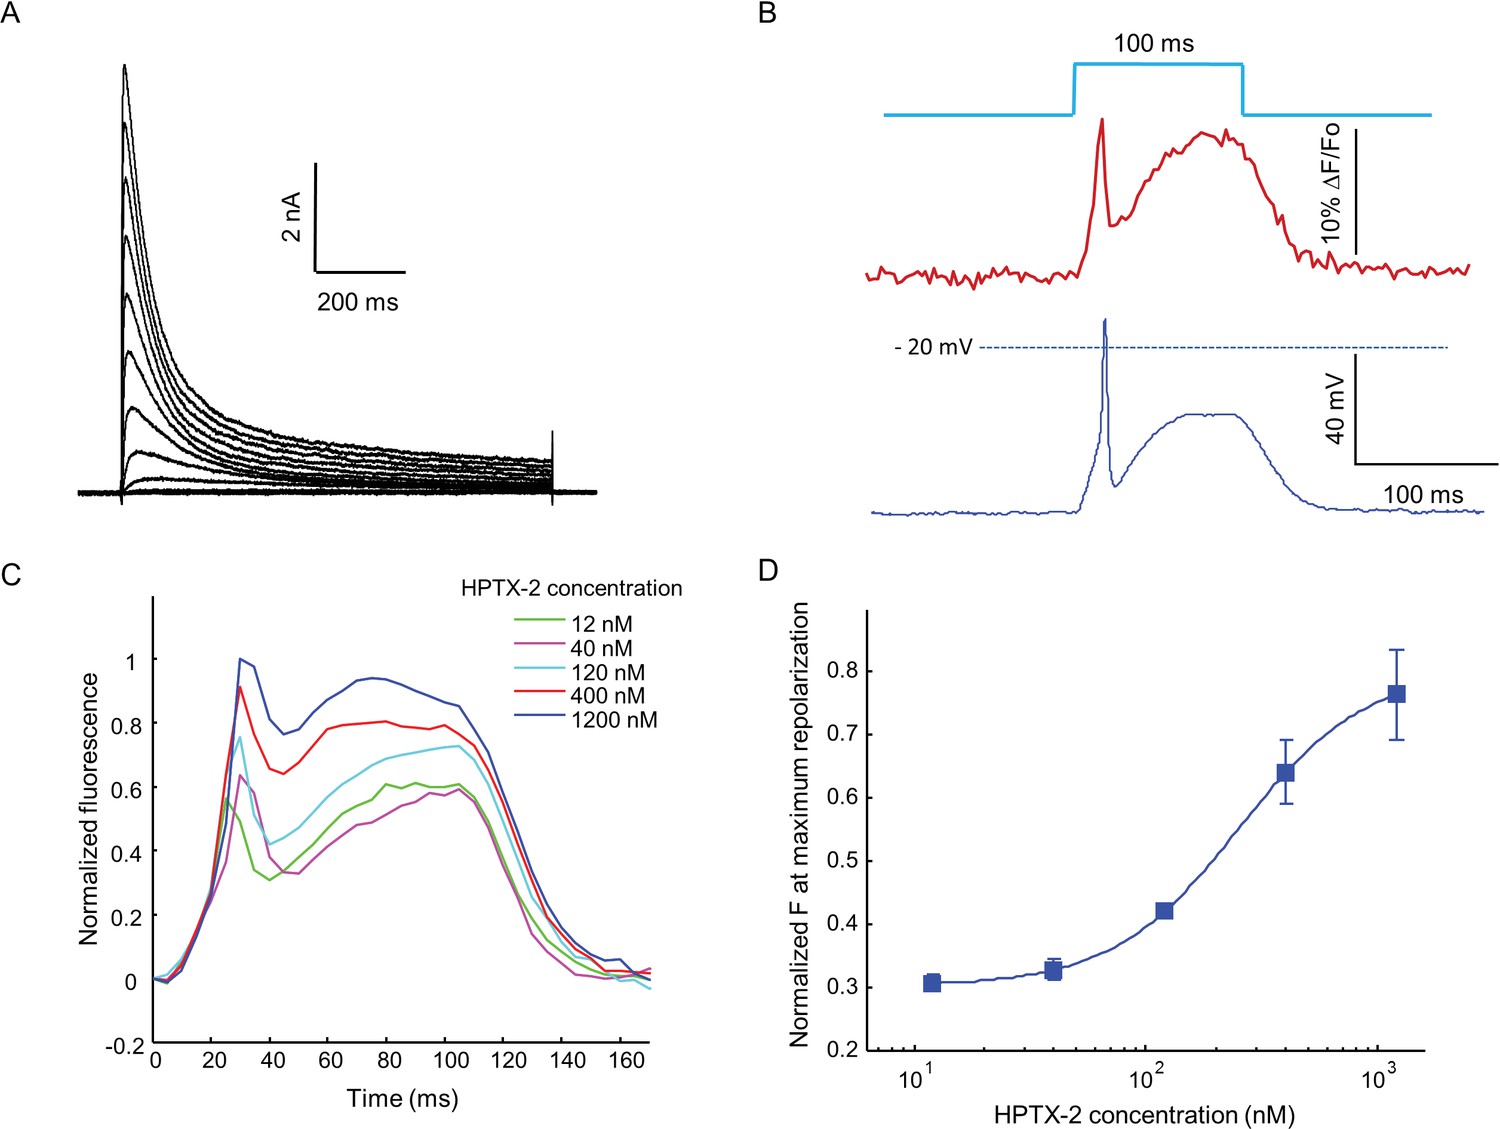
Optopatch assay of KV4.3 function.
(A) Voltage clamp recording of KV4.3 current in NaV1.5-KV4.3 Optopatch HEK cells. The bath contained 30 μM TTX to block the NaV1.5 current. Cells were held at −70 mV and then subjected to 1 s steps to −60 mV to +40 mV in 10 mV increments. Peak KV4.3 current densities were 218 pA/pF. (B) NaV1.5-KV4.3-OS HEK cells were probed with simultaneous current clamp and QuasAr2 fluorescence. The cells were stimulated with a pulse of blue light (100 ms, 50 mW/cm2), and QuasAr2 fluorescence was monitored with 640 nm excitation, 400 W/cm2. KV activation led to a narrow action potential width, followed by KV inactivation and a return to steady-state depolarization. (C) Average QuasAr2 fluorescence traces from NaV1.5-KV4.3-OS HEK cells treated with HpTx-2 (n = 3–4 wells for each concentration). (D) Dose-response curve of HpTx-2 on NaV1.5-KV4.3-OS HEK cells. Drug effect was quantified by the fluorescence at the peak repolarization (~40 ms after onset of stimulus) relative to peak fluorescence intensity under 1200 nM HPTX2 treatment.
Download links
A two-part list of links to download the article, or parts of the article, in various formats.
Downloads (link to download the article as PDF)
Open citations (links to open the citations from this article in various online reference manager services)
Cite this article (links to download the citations from this article in formats compatible with various reference manager tools)
Optical electrophysiology for probing function and pharmacology of voltage-gated ion channels
eLife 5:e15202.
https://doi.org/10.7554/eLife.15202


