Using evolution to generate sustainable malaria control with spatial repellents
- University of Exeter, Cornwall Campus, United Kingdom
- University of California, United States
Figures
Figure 1

Spread of deflection in a population over time.
(i) Phenotype and (ii) genotype proportions over time for a population subject to insecticide interventions applied in combination with an ESR. Illustrating (a) long-term establishment of ESR, (b) transient establishment of ESR, and (c) failure to establish ESR. The parameter values used to generate the plots in panels (a) are: 20% per cycle survival of susceptible phenotypes, 60% per cycle survival of resistant phenotypes 45% per cycle survival of deflected phenotypes, 0.5% initial proportion of resistance alleles and 25% initial proportion of deflection alleles. For the panels in (b) and (c) , the per cycle survival of deflected phenotypes is reduced to 40%. For panel (c), other parameters are also amended to 30% per cycle survival for susceptible phenotypes, 5% initial prevalence of resistance alleles and 10% initial prevalence of deflection alleles.
Figure 2 with 1 supplement
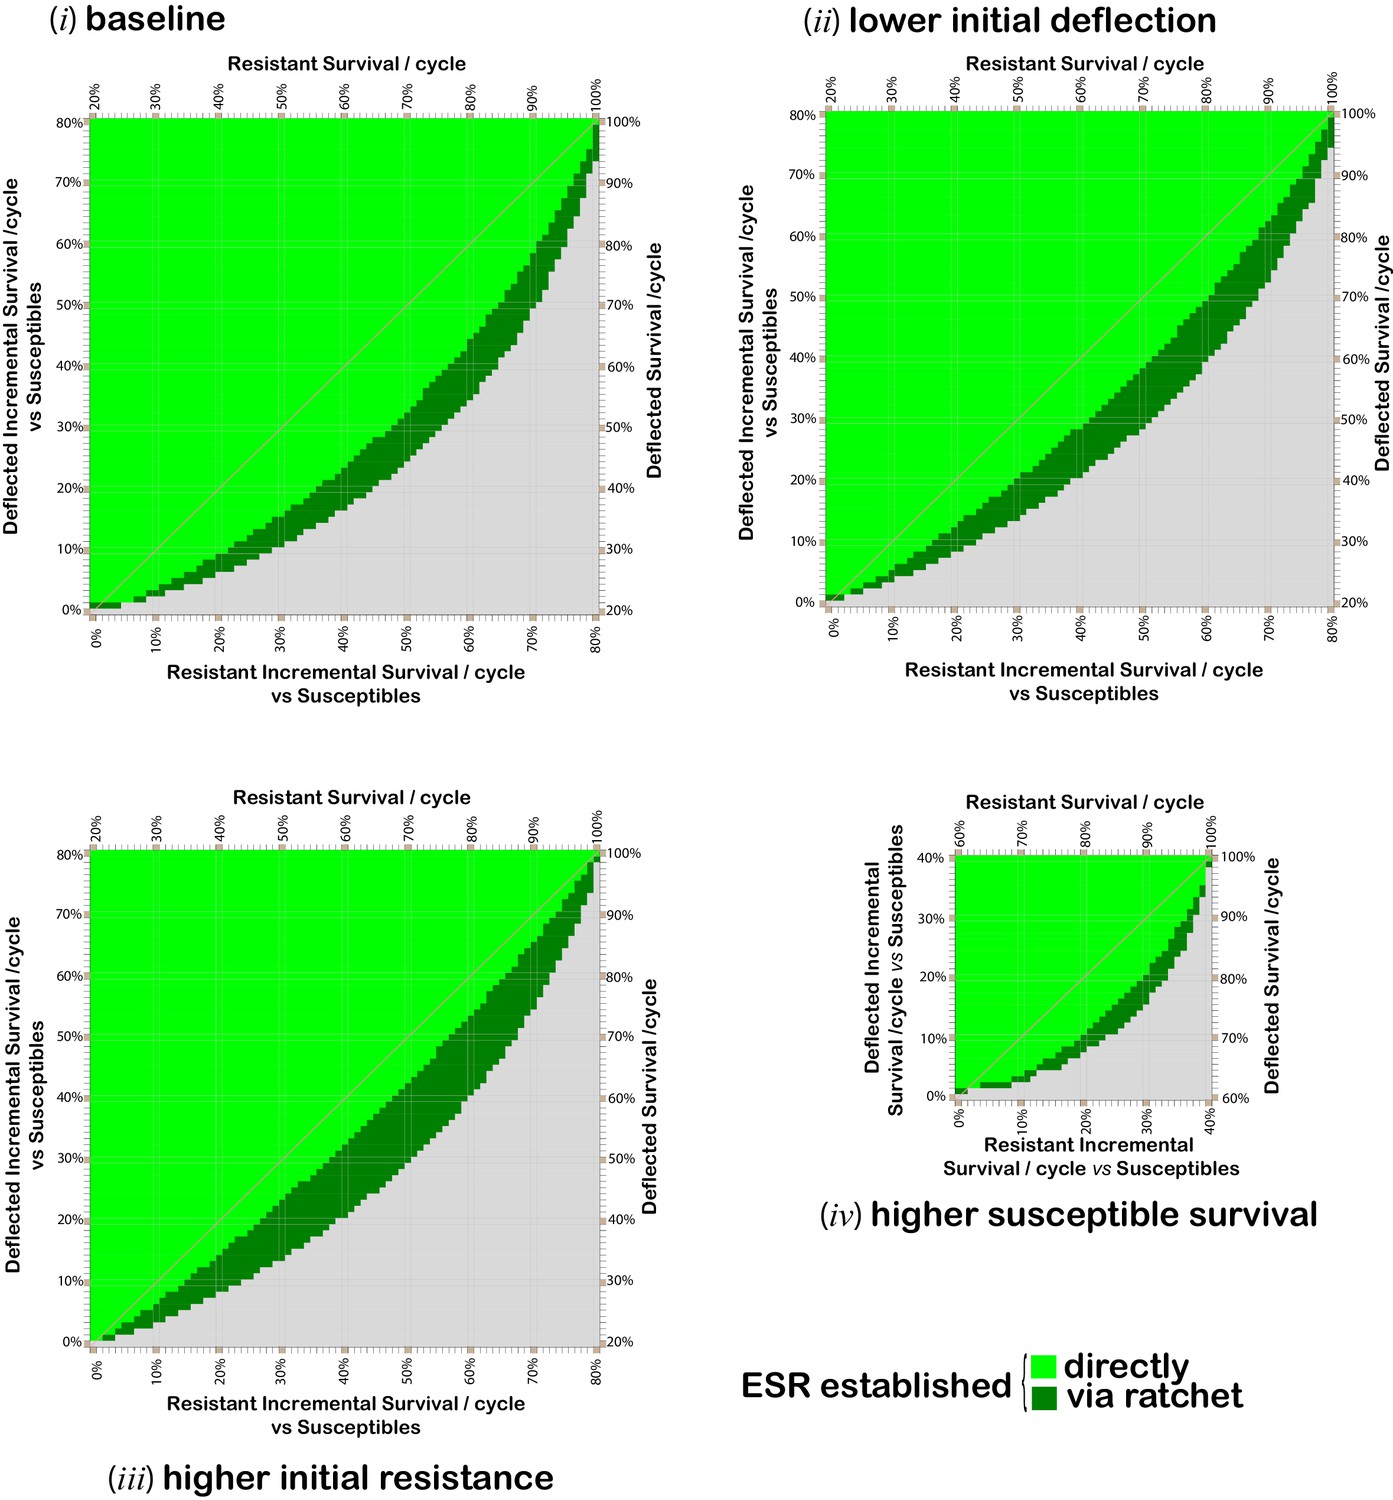
Combinations of per cycle survival values for deflected and non-deflected resistant phenotypes, which support the spread and maintenance of deflected phenotypes in the population.
Grid plots indicating which combinations of resistant (x-axis) and deflected (y-axis) phenotype per-cycle survival values (in 1% increments) give rise to a population comprising at least 80% deflected phenotypes after 300 modeled time periods. When this is achieved directly, the applicable square is bright green. Dark green squares indicate combinations for which the required outcome can be achieved via a ‘ratchet’ where the initial paired insecticide is swapped once for a new insecticide, with allele proportions at the time of the swap assumed to be 0.5% resistance alleles and the maximum percentage of deflection alleles achieved whilst using the first insecticide. Results are calculated for 1% increments in each survival value. Gridlines and diagonals are to aid visual location of results on the grid. The baseline parameters (panel i) are: 20% per cyclesurvival of susceptible phenotypes; resistant deflected phenotypes have the same survival probability as non-resistant deflected phenotypes; 0.5% initial prevalence of resistance alleles; and 25% initial prevalence of deflection alleles. Parameter values for panels (ii) to (iv) differ from the baseline values as follows: panel (ii) 10% initial prevalence of deflection alleles; panel (iii) 2% initial prevalence of resistance alleles; and panel (iv) 60% per cycle survival of susceptibles .
Figure 2—figure supplement 1
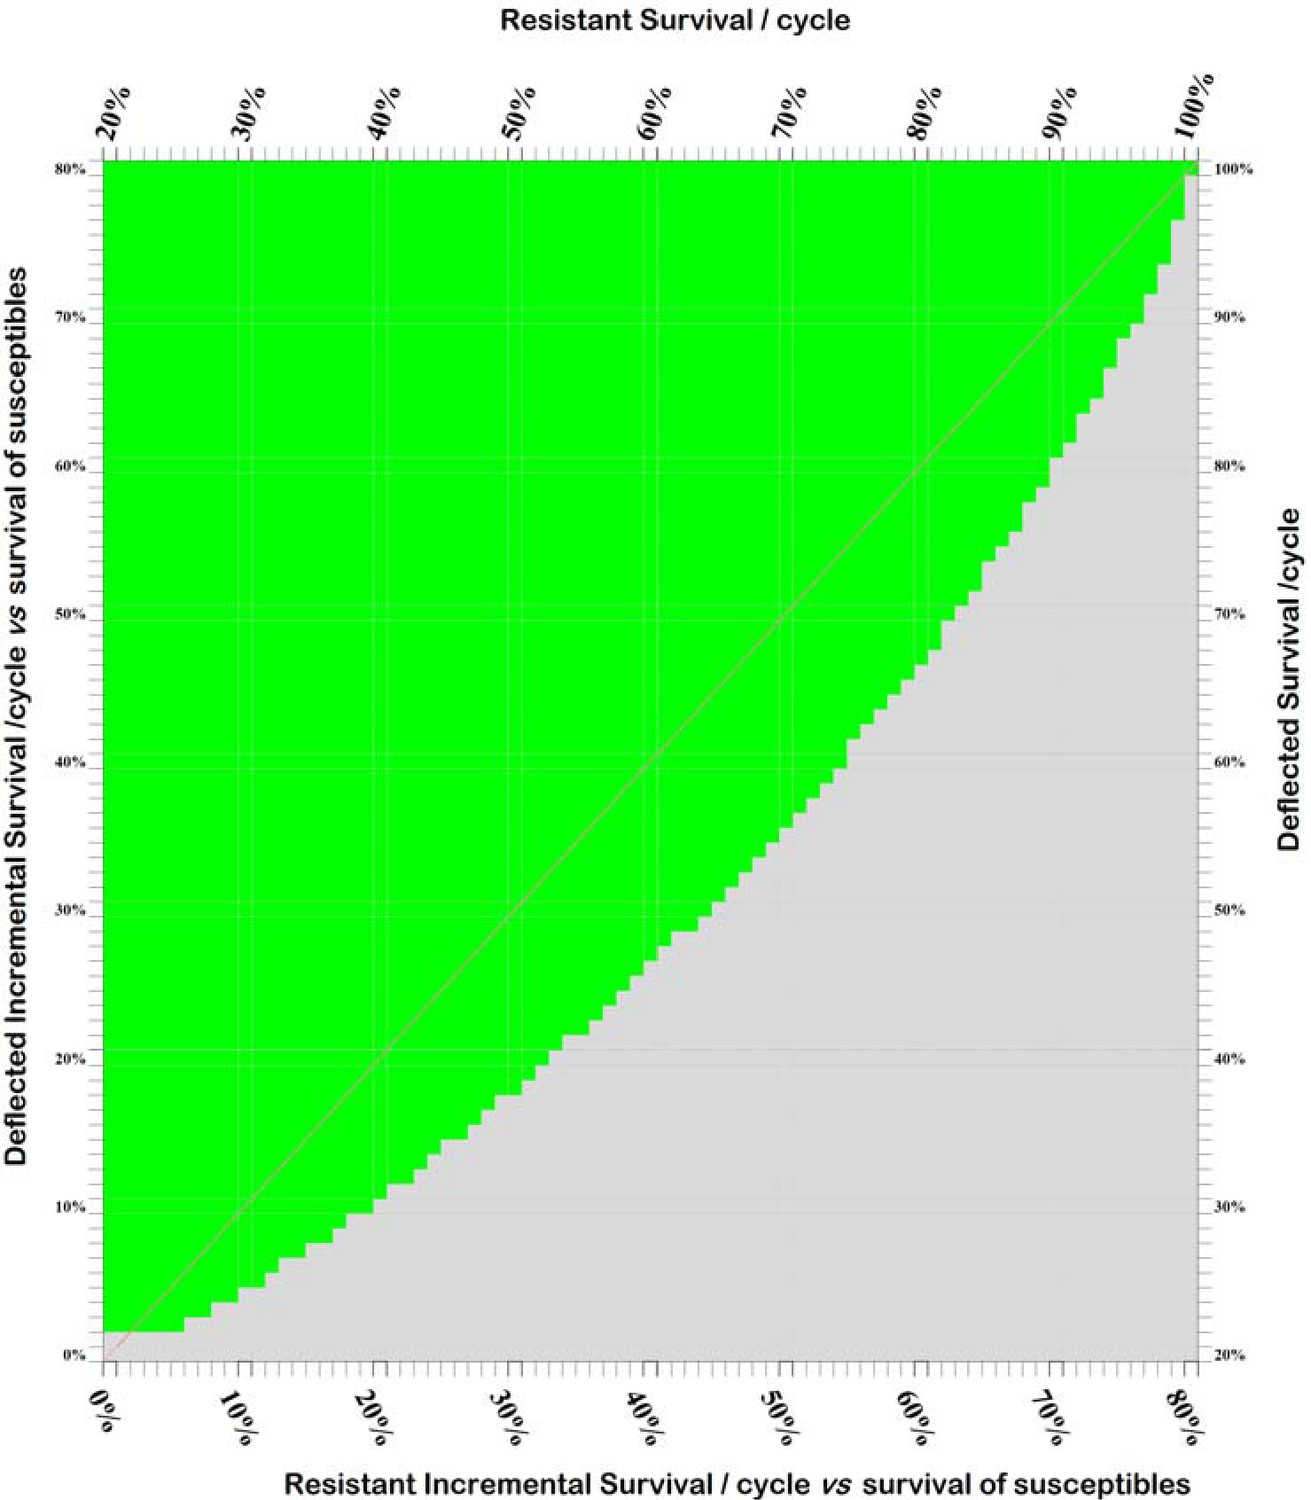
Effect of incomplete deflection on fitness combinations which support the spread and maintenance of deflection.
Grid plot indicating when the tested combinations of fitness values give rise to a population comprising at least 80% deflected phenotypes after 300 modeled time periods (corresponding to the length of 300 gonotrophic cycles). The baseline parameters are: 20% survival of susceptible phenotypes per cycle; resistant+deflected phenotypes have a fitness equal to 75% that of deflected phenotypes plus 25% that of resistant phenotypes; 0.5% initial prevalence of resistance alleles; and 25% initial prevalence of deflection alleles. The assumptions used are consistent with a situation in which deflected phenotypes are deflected 75% of the time and ESR is always and only applied with insecticide, or where 75% of insecticide-treated properties are treated with ESR, and deflected phenotypes are always deflected by the ESR. Comparison of this plot with the light-green elements of panel (i) of Figure 2 confirms that the establishment and maintenance of an ESR is possible when deflected+resistant phenotypes have greater fitness than deflected+susceptible phenotypes, but for a more limited range of combinations of deflected and resistant survival values.
Figure 3
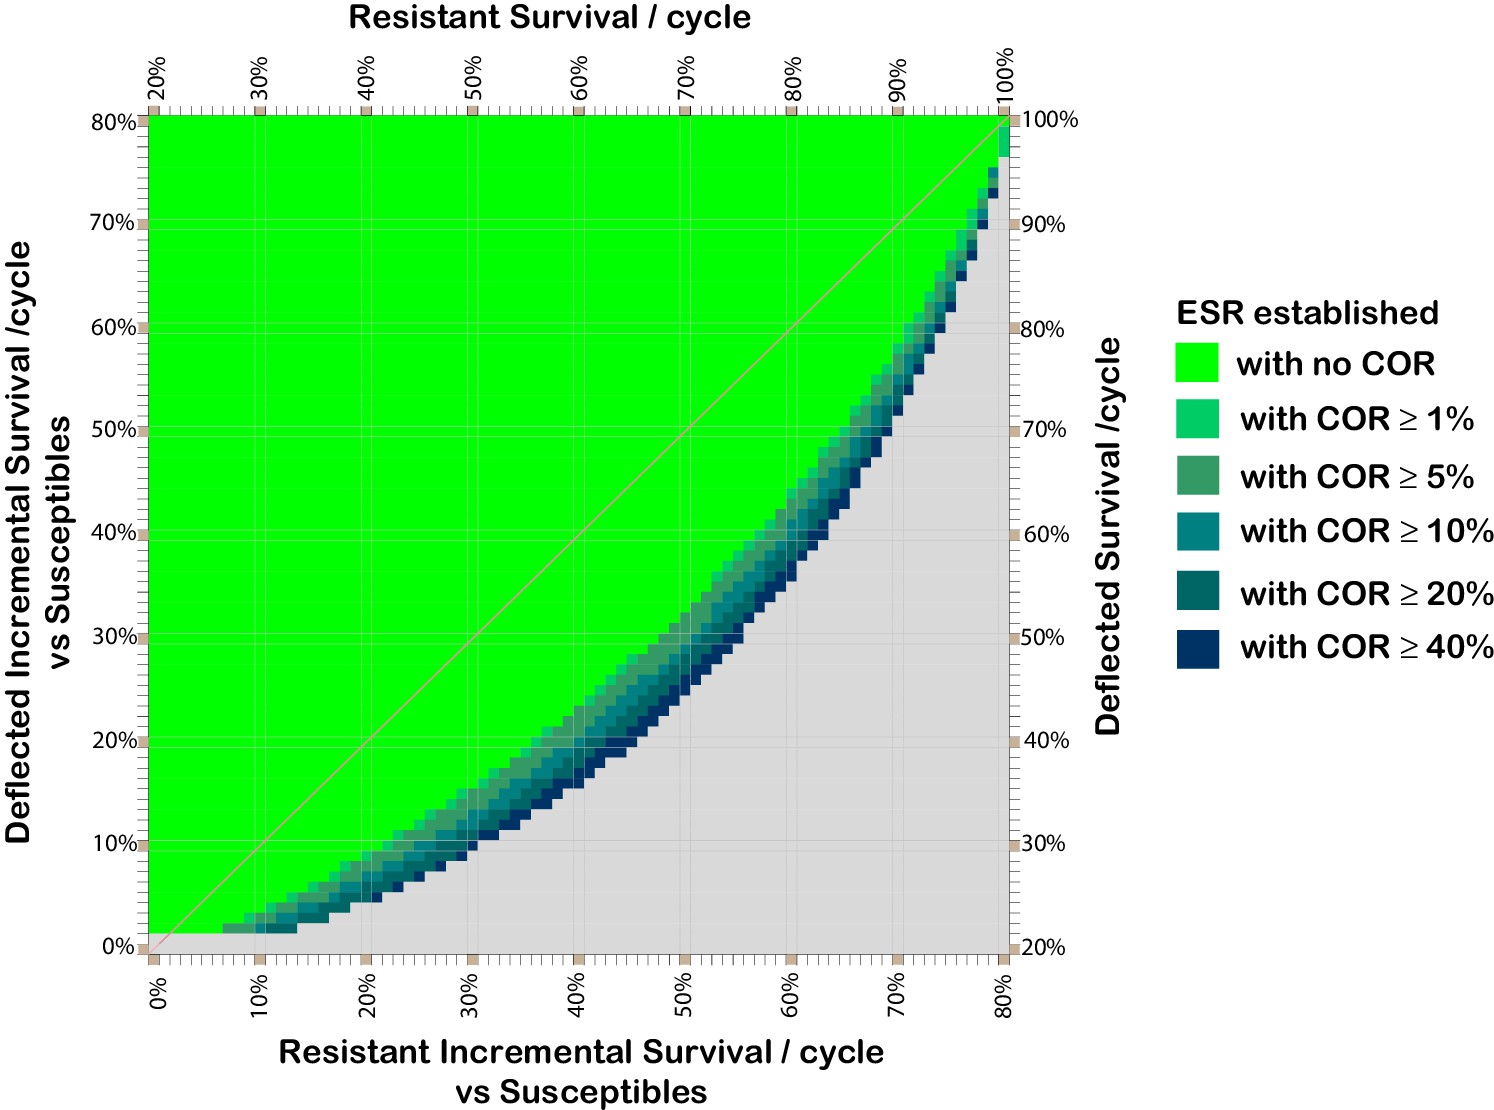
Effect of cost of resistance on resistant and deflected per-cycle survival combinations which support the spread and maintenance of deflected phenotypes in the population.
Combinations of phenotype survival values which can result in more than 80% of the population having deflected phenotypes after 300 cycles, assuming various costs of resistance. Colours indicate the lowest cost of resistance (COR) incurred by deflected resistant phenotypes which achieves the threshold 80% deflection phenotypes in the population after 300 cycles (without assuming any ratchet). COR here represents the reduction in per cycle survival of deflected resistant phenotypes arising as result of having a resistant phenotype, so the resistant deflected phenotype has per-cycle survival equal to that for the deflected phenotype (y-axis) less the applicable COR. The survival values shown for the resistant phenotype (x-axis) are those after taking account of any cost of resistance that affects non-deflected resistant phenotypes. The baseline parameters are: 20% per cycle survival of susceptible phenotypes; 0.5% initial prevalence of resistance alleles; and 25% initial prevalence of deflection alleles.
Figure 4
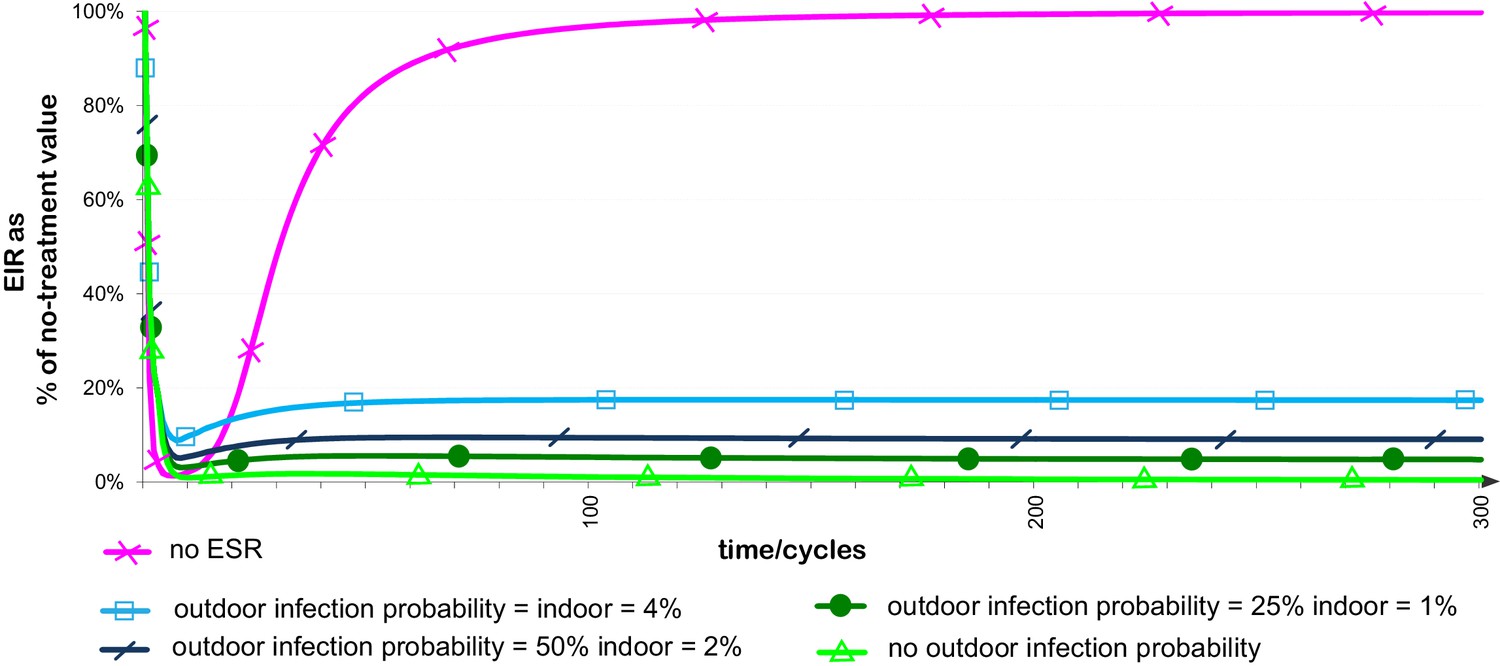
Effect of evolved spatial repellent on infectious bites from a vector population over time.
The plots represent the infectious bites from the vector population per unit of time as a proportion of that with no intervention, assuming use of insecticide with and without ESR and probabilities per feed that ESR-deflected mosquitoes will become infected with Plasmodium of 4%, 2%, 1% or 0%. Plots otherwise use baseline parameter values. Probability per feed that non-deflected mosquito acquires Plasmodium infection is assumed to be 4%. If the size of the human population is assumed to be the same for all treatments and time periods, this equates to the entomological inoculation rate (EIR) as a percentage of the EIR with no intervention.
Tables
Table 1
Phenotype definitions and characteristics.
| Phenotype | Fitness | Resistant | Deflected | Genotypes |
|---|---|---|---|---|
| Susceptible | No | No | rr\dd | |
| Resistant | Yes | No | Rr\dd RR\dd | |
| Deflected and not resistant | No | Yes | rr\Dd rr\DD | |
| Deflected and resistant | Yes | Yes | Rr\Dd Rr\DD RR\Dd RR\DD |
Table 2
Feeding related survival probabilities.
| Feeding-related survival probabilities | ||||||
|---|---|---|---|---|---|---|
| Proportion of properties | Y1 | Y2 | Y3 | Y4 | ||
| Phenotype | Baseline fitness adjustment | Untreated property | Insecticide only | ESR only | Insecticide and ESR | Average survival |
| Susceptible | ||||||
| Resistant | COR1 | |||||
| Resistant and deflected | COR2 | |||||
| Deflected | ||||||
-
=no-treatment survival, =survival reduction caused by insecticide in susceptible mosquitoes, =survival reduction caused by deflection from protected building, =proportion of properties in each treatment category, COR1=fitness cost of resistance experienced by resistant non-deflected phenotypes, COR2=fitness cost of resistance experienced by resistant deflected phenotypes.
Appendix 1—table 1
Variable and parameter definitions for the population genetics model.
Variable and parameter labels | ||
|---|---|---|
| Label | Description | Units |
| Index of model time periods length of one time period equivalent to duration of one gonotrophic cycle | Time | |
| Index of phenotypes 1= susceptible non-deflected 2 = resistant non-deflected 3 = resistant and deflected 4 = susceptible deflected | ||
| Index of genotypes 1=rrdd, 2=rRdd, 3=RRdd, 4=rrDd, 5=rRDd, 6=RRDd, 7=rrDD, 8=rRDD, 9=RRDD | ||
| The proportion of male gametes with allele pair in time period . Pairs are: 1=rd, 2=rD, 3=Rd, 4=RD | Proportion of male gametes | |
| Infectious bites from population in period as a proportion of baseline (pre-treatment) infectious bites per period | Proportion of baseline bites/time | |
| Females giving infectious bites in period as a proportion of females in baseline population | Proportion of baseline population | |
| Females of phenotype which are infectious with Plasmodium in period as a proportion of baseline population | Proportion of baseline population | |
| Baseline probability that an infectious female in the no-intervention baseline population will give an infectious bite when feeding | Probability | |
| Probability that an infectious female of phenotype will give an infectious bite when feeding | Probability | |
| Females newly infected with Plasmodium in period as a proportion of the baseline population | Proportion of baseline population | |
| Baseline average probability susceptible individuals survive one model time period (in the absence of any intervention) | Probability | |
| Average probability that individuals with phenotype will survive one time period in an environment including a given intervention | Probability | |
| Number of model time periods between start of Plasmodium infection in mosquito, and point from which infection has matured and mosquito can give infectious bites | Model time periods | |
| Probability that an uninfected mosquito in a baseline population subject to no interventions will acquire a Plasmodium infection during a single model time-period | Probability | |
| Probability that an uninfected mosquito with phenotype will acquire a Plasmodium infection during a single time-period | Probability | |
| Females with phenotype which are not infected with Plasmodium at start of time period , as a proportion of the baseline population | Proportion of baseline population | |
| New females of phenotype in period , as a proportion of the baseline population | Proportion of baseline population | |
| Proportion of new adults in time period with genotype | Proportion of new adults | |
| New (female) adults in period as proportion of baseline population | Proportion of baseline population | |
| Adults surviving from preceding period to start of period as proportion of baseline population | Proportion of baseline ppopulation | |
| New (female) adults in period as a proportion of total (female) population in period | Proportion of current population | |
| Adults surviving from preceding period to start of period as proportion of population in period | Proportion of current population | |
| Population in period as proportion of baseline population | Proportion of baseline population | |
| Probability a female with genotype will survive one model time period | Probability | |
| Proportion of all eggs laid in time period which have genotype | Proportion of eggs laid in period | |
| Proportion of adult females surviving at start of time period which have genotype | Proportion of adult females | |
| Number of time periods between egg-laying and emergence of new adults | Model time periods | |
| The proportion of all females (including new adult females) which have genotype at start of time period | Proportion of adult females | |
| Proportion of the population alive at start of time period which survive to start of time period | Proportion of population | |
| Number of eggs with genotype laid in period , relative to a normalized number of eggs assumed per mosquito per successful lay | Relative number of eggs | |
| Total number of eggs laid in period , relative to a normalized number of eggs assumed per mosquito per successful lay | Relative number of eggs | |
| The proportion of eggs produced by females which are new adults in time period and have genotype , which are genotype | Proportion of eggs | |
| Average number of eggs laid during time period by females with genotype alive at start of time period | Normalized number of eggs | |
| Normalized number of eggs assumed per mosquito per successful lay | Eggs/mosquito/lay | |
| Newly mated females in time period as a proportion of the baseline population | Proportion of baseline population | |
| Proportion of alleles at the resistance locus which are resistance alleles in model time period | Proportion of alleles | |
| Proportion of alleles at the deflection locus which are deflection alleles in model time period | Proportion of alleles | |
| Proportion of population with resistant phenotypes in model time period | Proportion of current population | |
| Proportion of population with deflected phenotypes in model time period | Proportion of current population | |
| Proportion of population with susceptible non-deflected phenotypes in model time period | Proportion of current population | |
| Proportion of population with genotype in model time period genotypes; 1=rr, 2=rR or RR, 3=dd, 4=dD or DD | Proportion of current population | |
Download links
A two-part list of links to download the article, or parts of the article, in various formats.
Downloads (link to download the article as PDF)
Open citations (links to open the citations from this article in various online reference manager services)
Cite this article (links to download the citations from this article in formats compatible with various reference manager tools)
Using evolution to generate sustainable malaria control with spatial repellents
eLife 5:e15416.
https://doi.org/10.7554/eLife.15416


