Hypothalamic transcriptomes of 99 mouse strains reveal trans eQTL hotspots, splicing QTLs and novel non-coding genes
- University of California, Los Angeles, United States
- University of California, Los Angeles, United states
- Pacific Northwest National Laboratory, United States
Figures
Figure 1
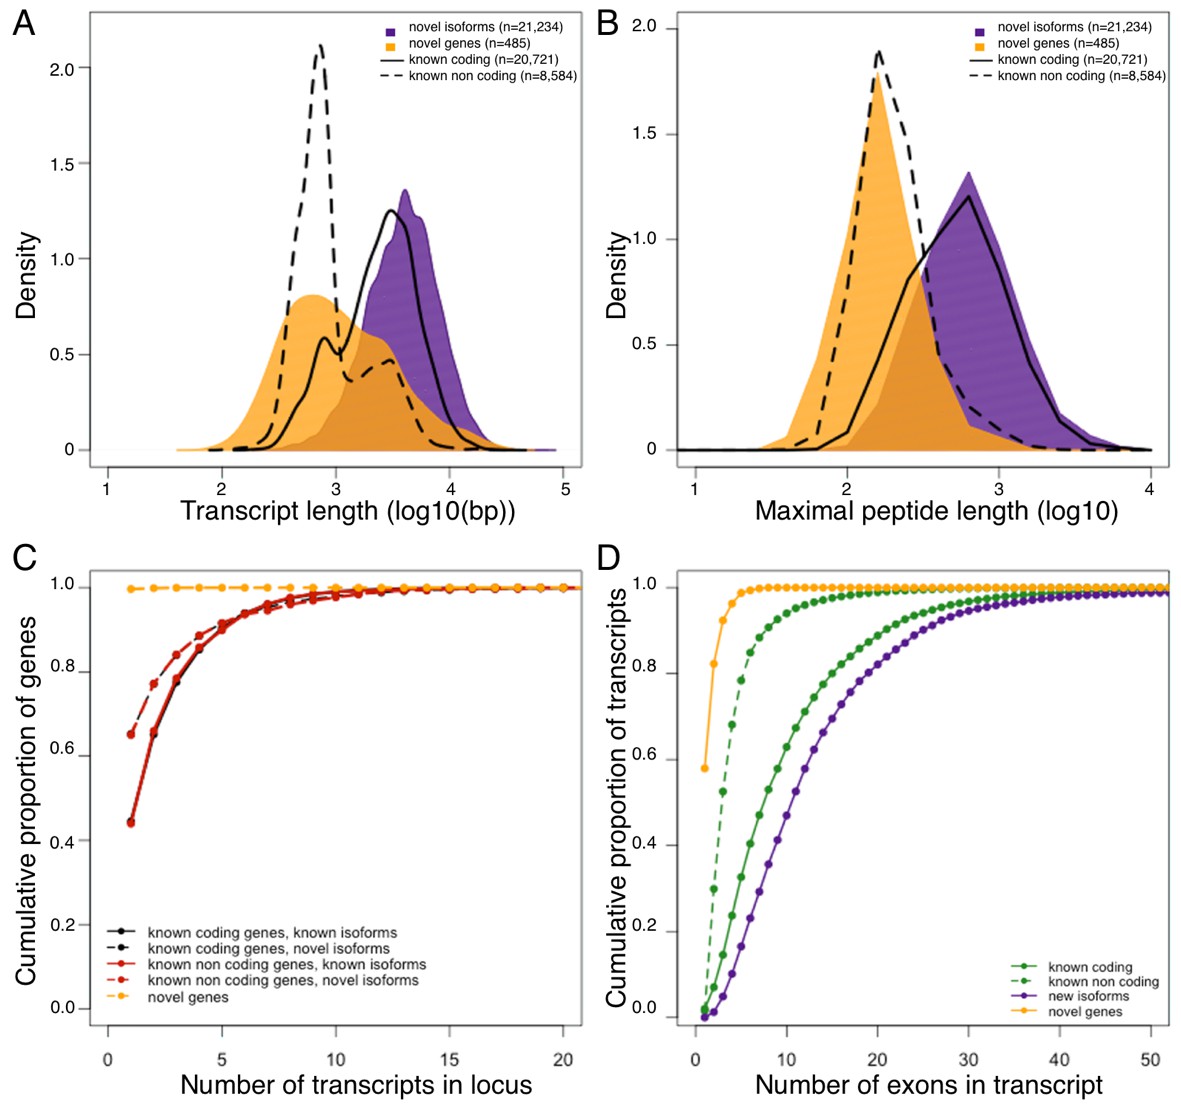
Genomic properties of novel genes are similar to known non coding genes.
Novel genes and isoforms are defined by Cufflinks class code 'u' and 'j' respectively. Distributions of transcript length (A), and maximal hypothetical peptide length (B) of novel genes (yellow), new isoforms (purple), known non coding transcripts (dashed line) and known coding transcripts (solid line). Transcriptional complexity (number of transcripts per locus, (C) and splicing complexity (number of exons per transcript, (D) of novel genes, novel isoforms, known coding and know non coding transcripts.
Figure 2 with 1 supplement
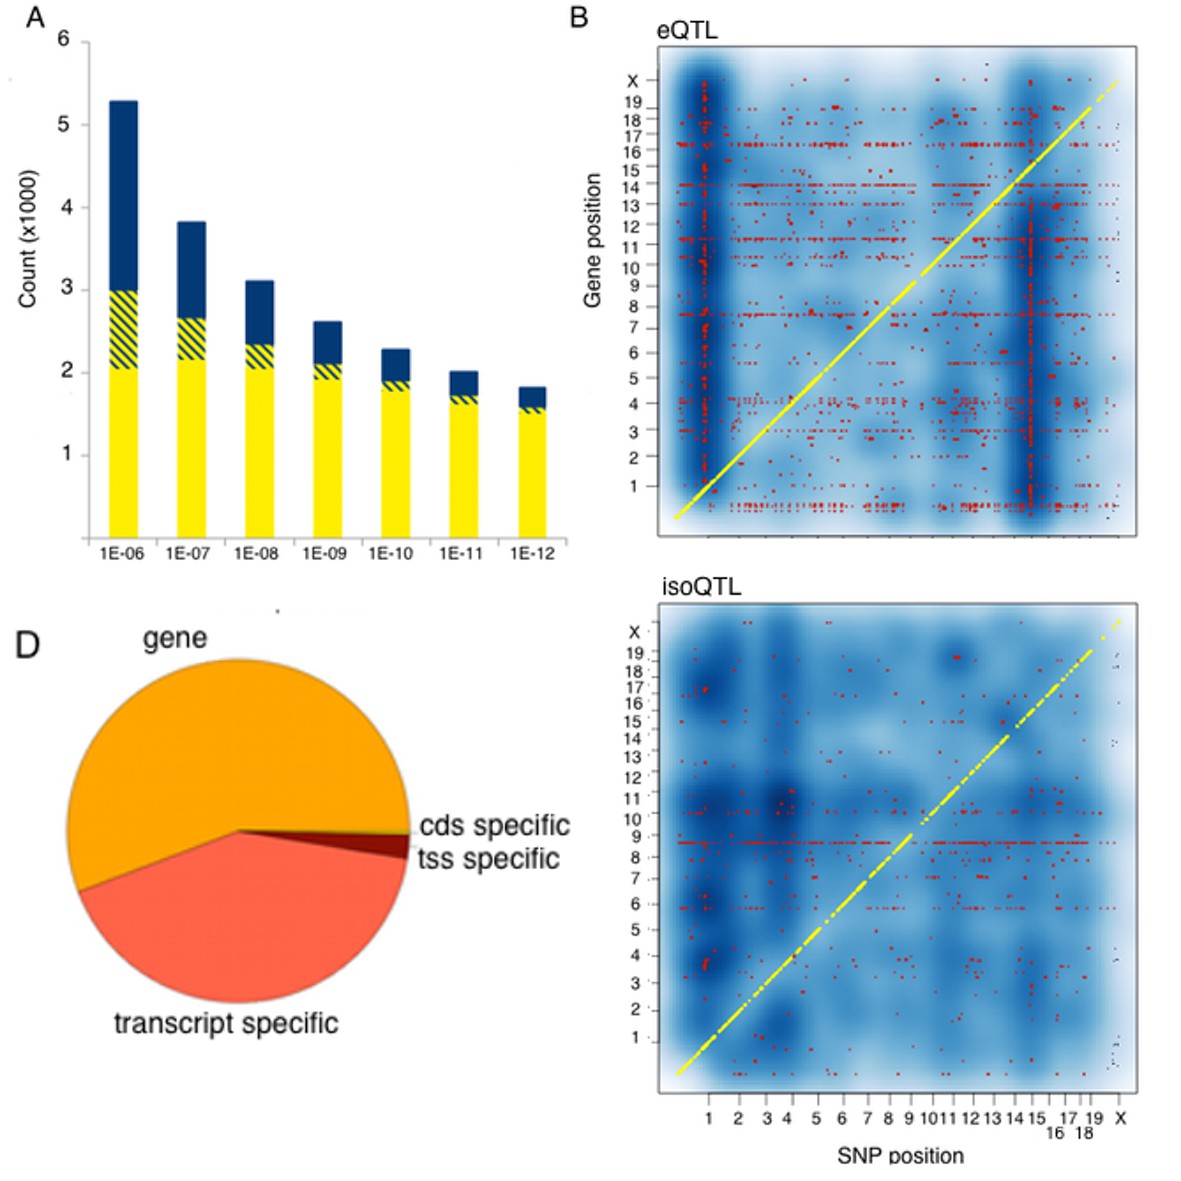
Genetic regulation of expression in the mouse hypothalamus.
(A) Number of genes affected by trans (blue), local (yellow) or both (striped) variants as a function of statistical threshold. (B) Gene level expression quantitative trait loci (eQTL, top) but not transcript specific (isoQTL, bottom) show trans eQTL hotspots. Density shows the number of interactions at lower statistical thresholds (1e–6), red shows interactions passing 1E-12 threshold. Yellow indicates cis acting variants. (C). Genetic regulation occurs on every level, but gene level regulation is more prevalent than transcript specific cases. Supplementary figure shows correlations between allele expression in F1 and local eQTLs identified in HMDP hypothalamus.
Figure 2—figure supplement 1
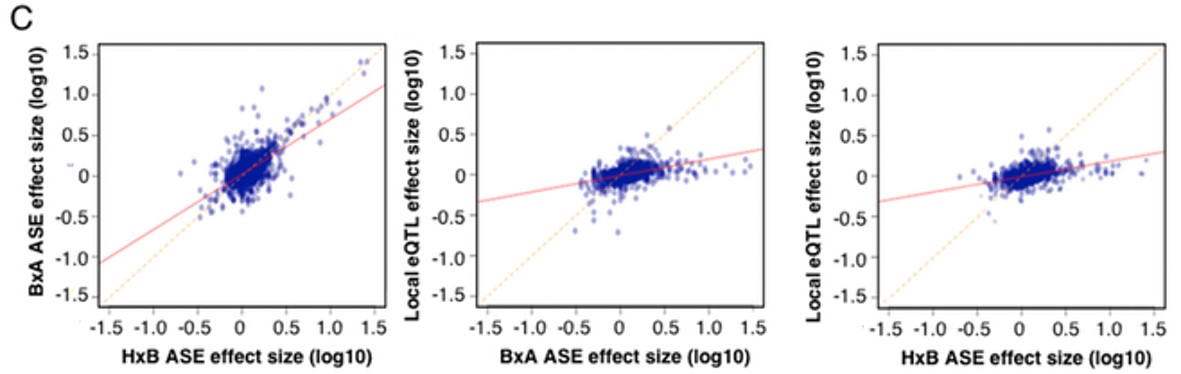
Allele specific expression in whole brain correlation to local eQTL.
https://doi.org/10.7554/eLife.15614.007
Figure 3
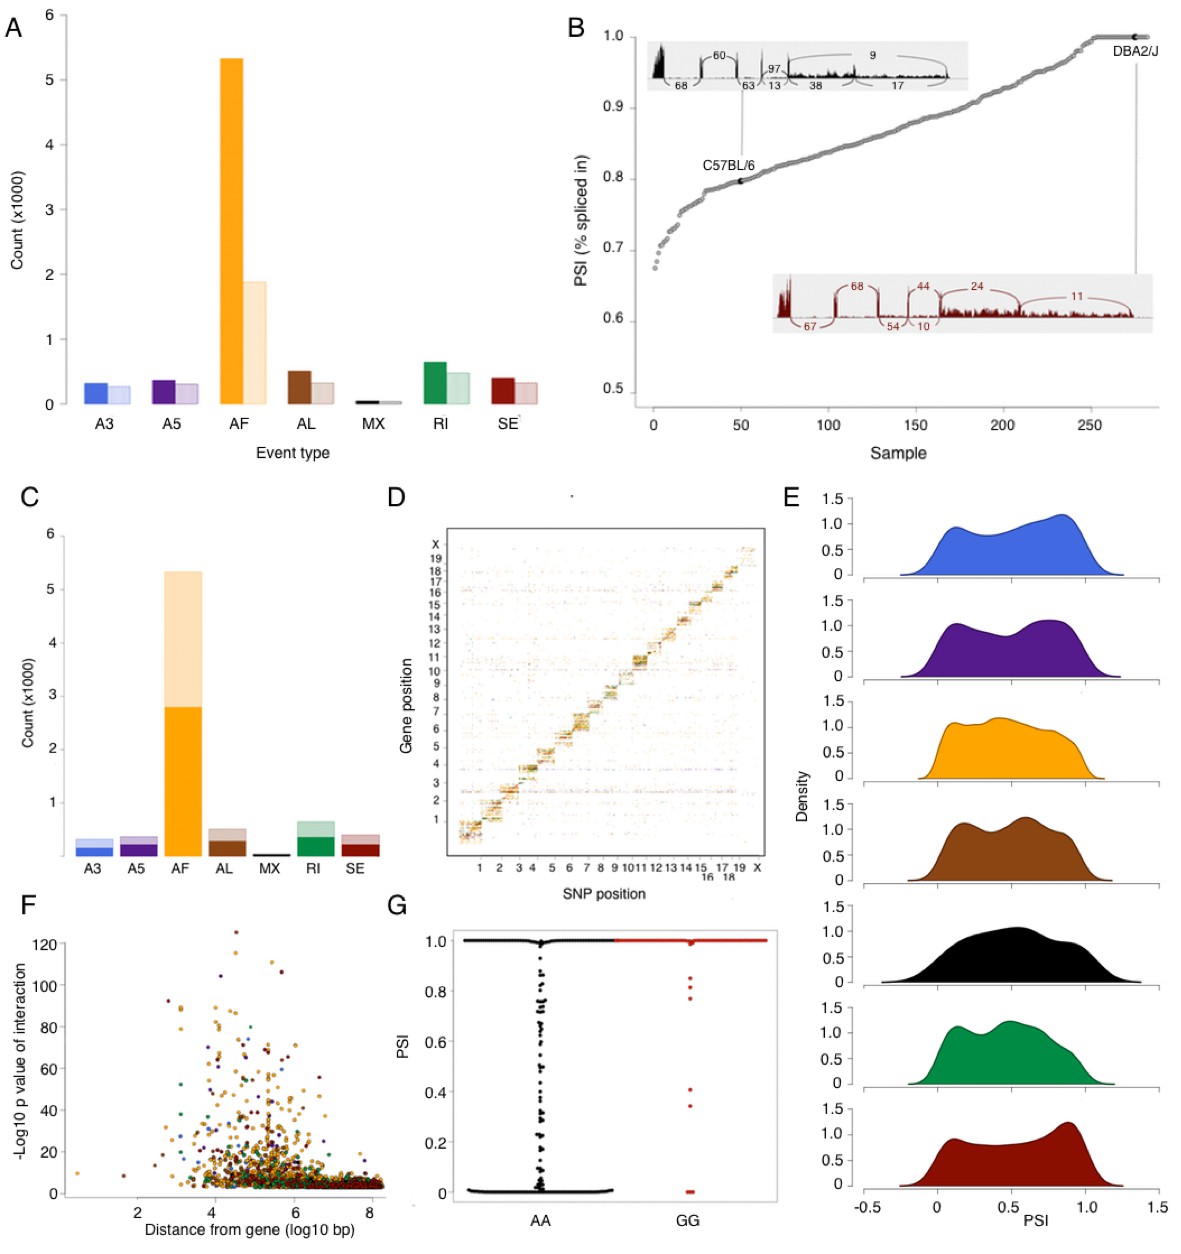
Alternative splicing in the mouse hypothalamus.
Alternative splicing events were classified (see Materials and methods) into 7 types: alternative 3’ splice (A3, blue), alternative 5’ splice (A5, purple), alternative first exon (AF, orange), alternative last exon (AL, brown), mutually exclusive exons (MX, black), retained intron (RI, green), and skipped exon (SE, dark red). All events were quantified in each sample for percent spliced in (PSI). (A) Number of alternative splicing events of each type (solid color), and number of genes affected by these events (light color). (B) Example of partial exon skipping in Colq gene. DBA shows the complete inclusion of the exon (therefore PSI = 1), while in C57BL/6 there is partial exon skipping (PSI = 0.78). (C) Number of alternative splicing events with and without local QTL signal (solid and light color respectively). (D) Alternative splice QTLs are mapping to the same chromosome, for all types of events, indicating that most of genetic regulation is by local (and likely cis acting) variants. (F) Distance between most significant SNP for each event and gene start. The largest effect is typically within 1 Mb of the gene. (G) An example of mapping of mutually exclusive exon event in Nnat gene mapping to SNP rs32019082. (E) Distribution of all PSI values of each event type in all samples.
Figure 4
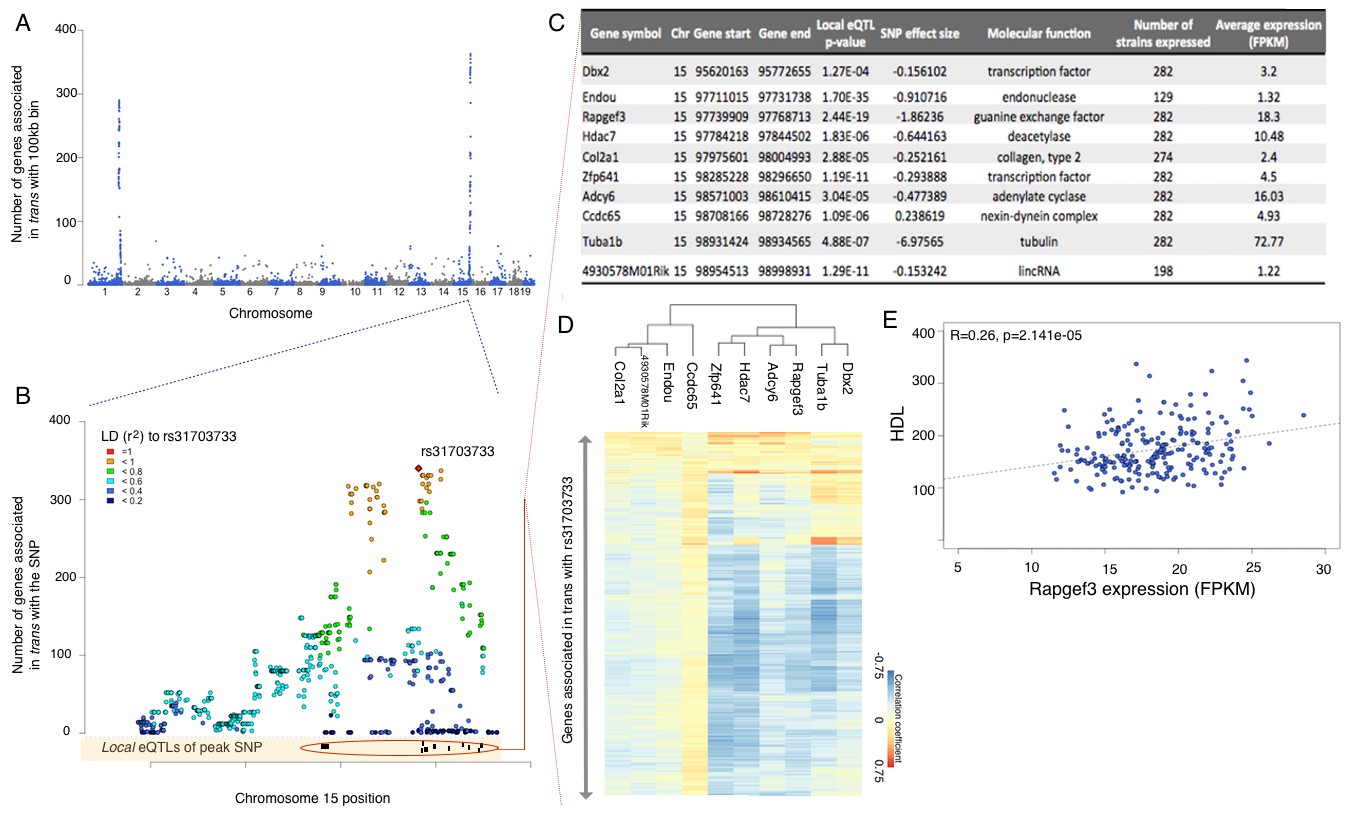
eQTL mapping suggests trans eQTL hotspots in the hypothalamus regulate expression of hundreds of genes.
(A) Mouse genome was broken into 100 kb bins. The plot presents genome wide counts of genes which expression is associated with SNPs in that region, in trans. (B) Zoom of trans eQTL locus on chromosome 15. Peak SNP (associated with most genes in trans, rs31703733) is shown in red, color of other SNPs indicates r2 to rs31703733. Lower track shows the 10 genes which expression is associated with rs31703733 locally. C,D,E pertain to the 10 genes associated locally with rs31703733 and therefore potentially mediate the trans effects. (C) Summary table about each gene. (D) Heatmap showing correlation of expression between genes associated with rs31703733 locally, and genes associated with rs31703733 in trans. Color indicates Pearson correlation coefficient. (E) Example correlation between potential regulator (RApgef3) and trait (HDL levels).
Figure 5
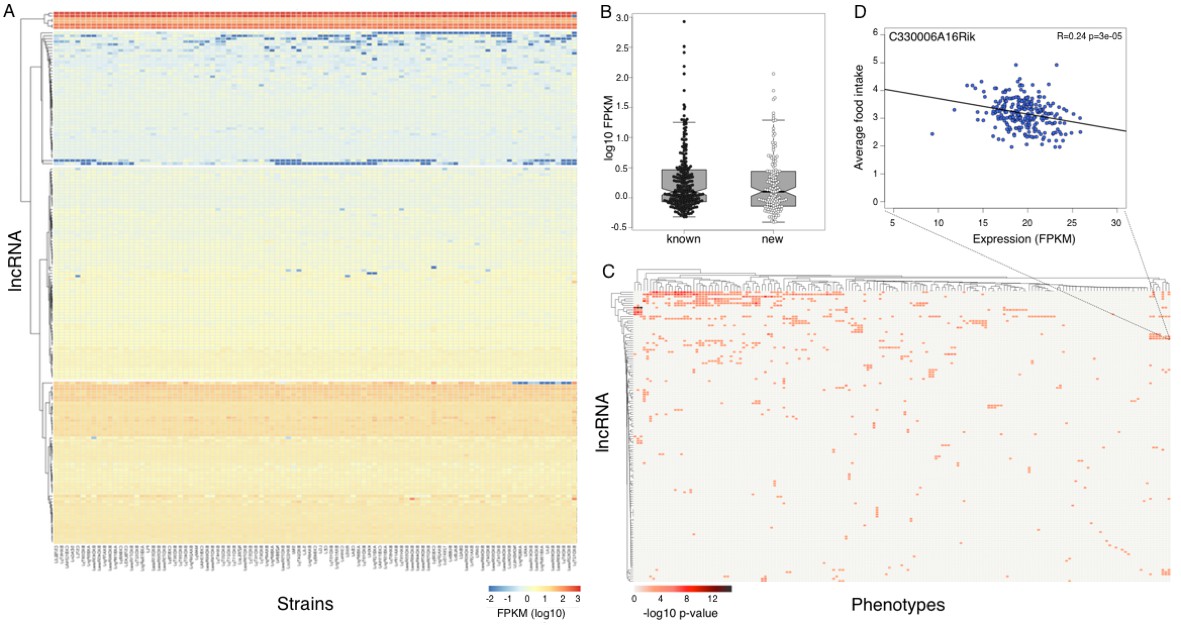
Expression of long non coding RNAs in the hypothalamus is phenotypically relevant.
(A) Expression of heatmap known non coding RNAs and novel isoforms of these genes n the HMDP. Six lncRNAs (top cluster, Meg3, Gm26924, Snhg4, Miat, 6330403K07Rik, and Malat1) are highly expressed in almost all samples. (B) Novel isoforms of lncRNAs are expressed at a similar level of known ones. (C) Long non coding RNAs are associated with multiple phenotypes in the HMDP. (D) An example of association between a non coding RNA C330006A16Rik and average food intake.
Figure 6
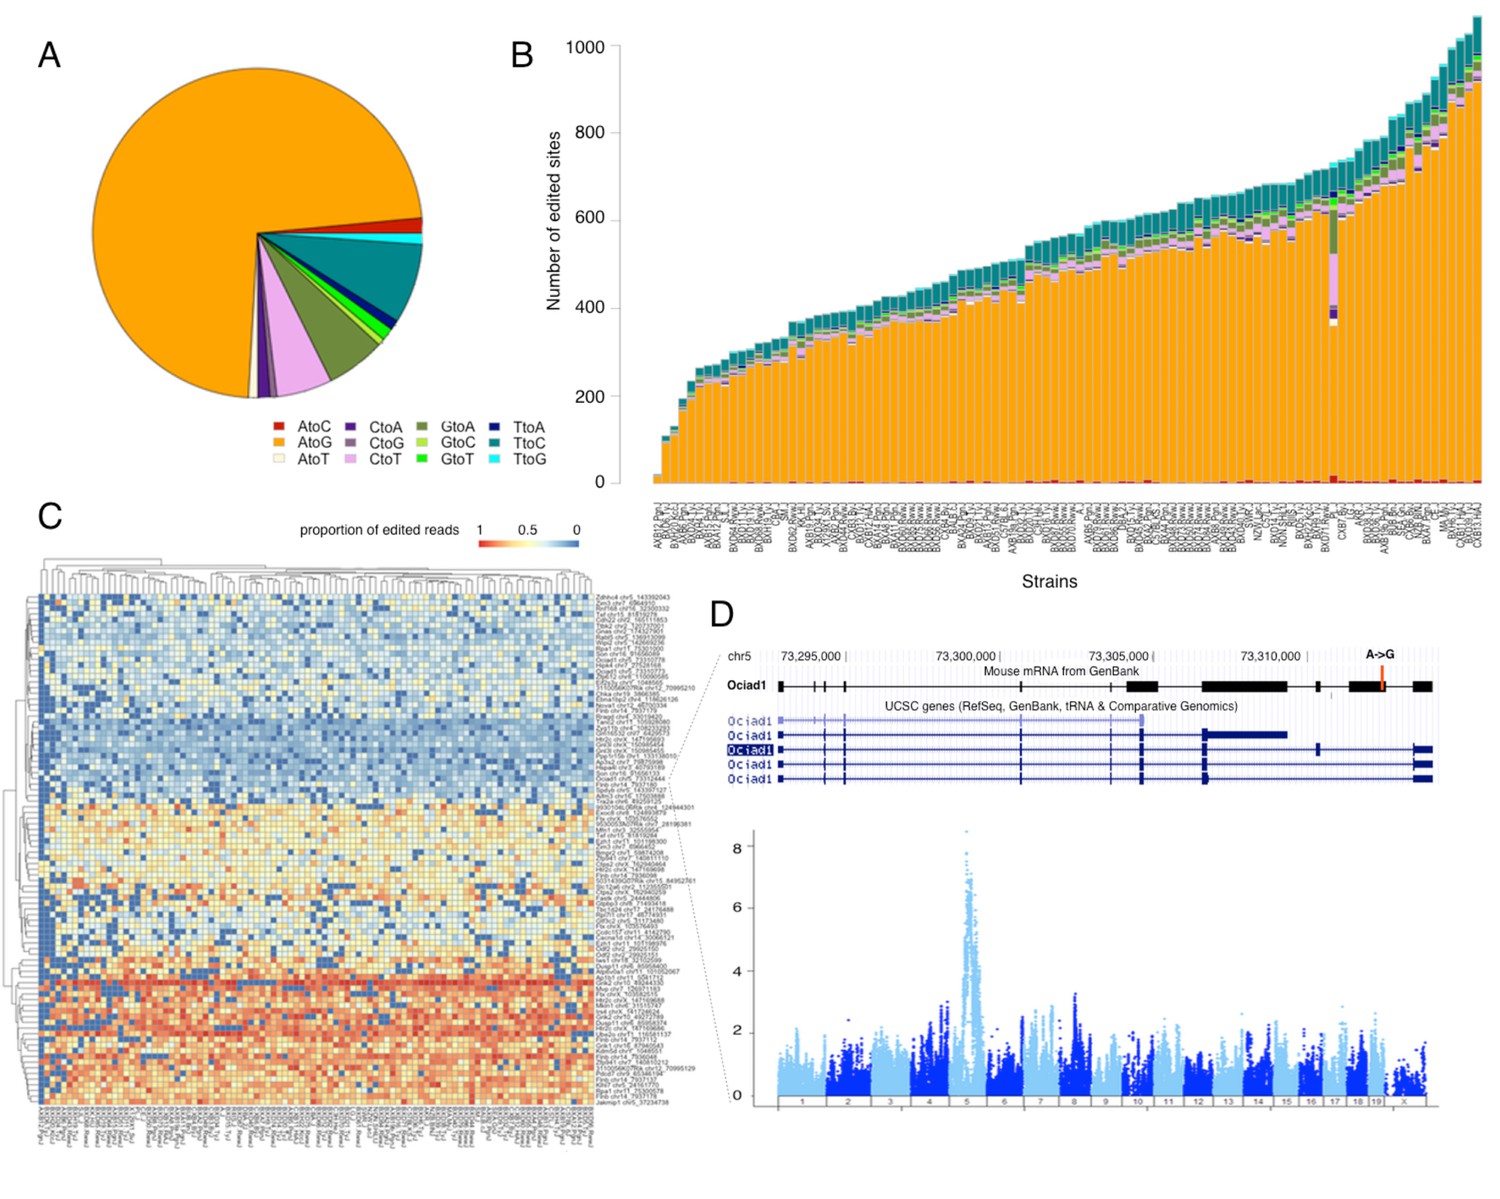
RNA editing is prevalent at the mouse hypothalamus at low levels.
(A) A total of 8462 editing sites were identified in the HMDP, with A to G accounting for >70% of the modifications. (B) Number of sites identified in each strain (color coding as in A). (C) Editing level at 90 sites, that were detected in at least 70% of the samples, were mapped. Heatmap shows variation in editing in these sites among the strains. (D) An example of an edited site in Ociad1 gene, and its genome wide mapping result.
Figure 7
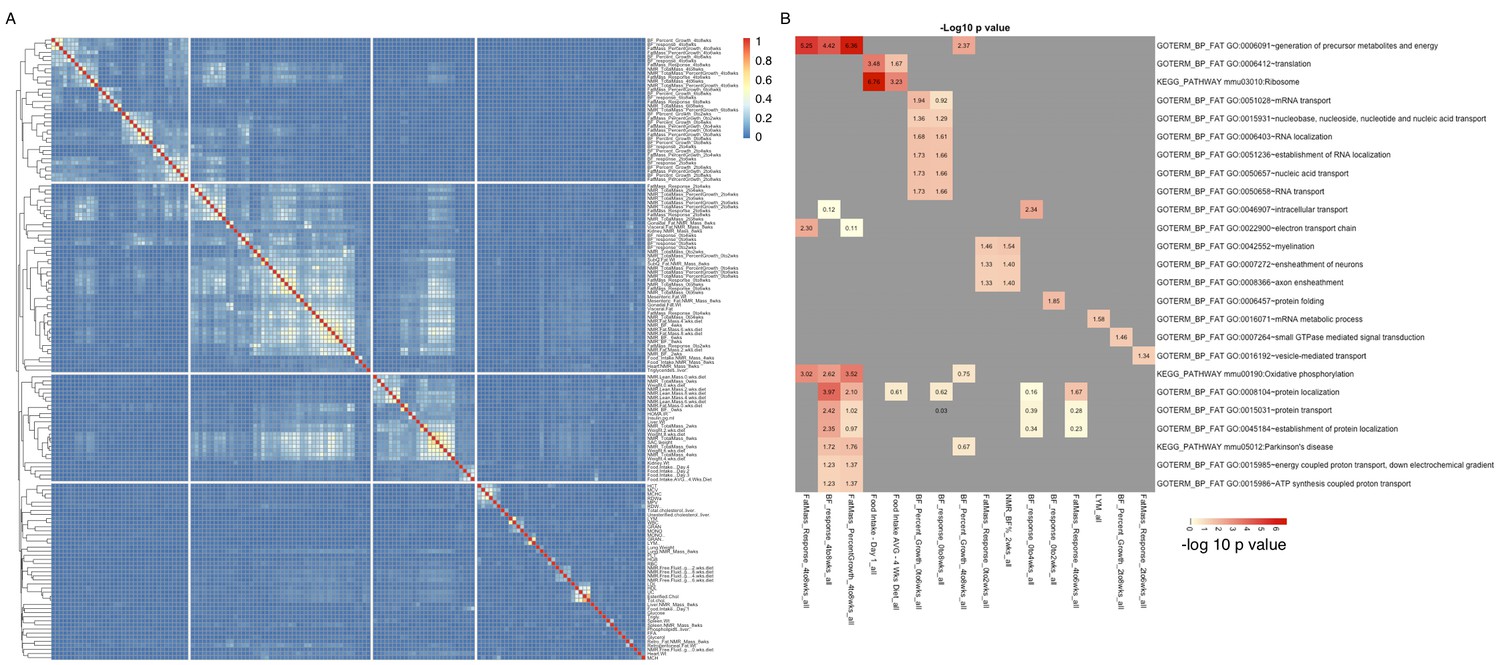
Groups of genes are associated with multiple related phenotypes in HMDP, although not necessarily enriched for GO ontology or specific pathways.
(A) Fraction of co-shared genes among the 500 genes most associated with a phenotype. (B) Enrichment analysis of the top 500 genes associated with each of the 150 phenotypes results in a small number of significant associations.
Figure 8
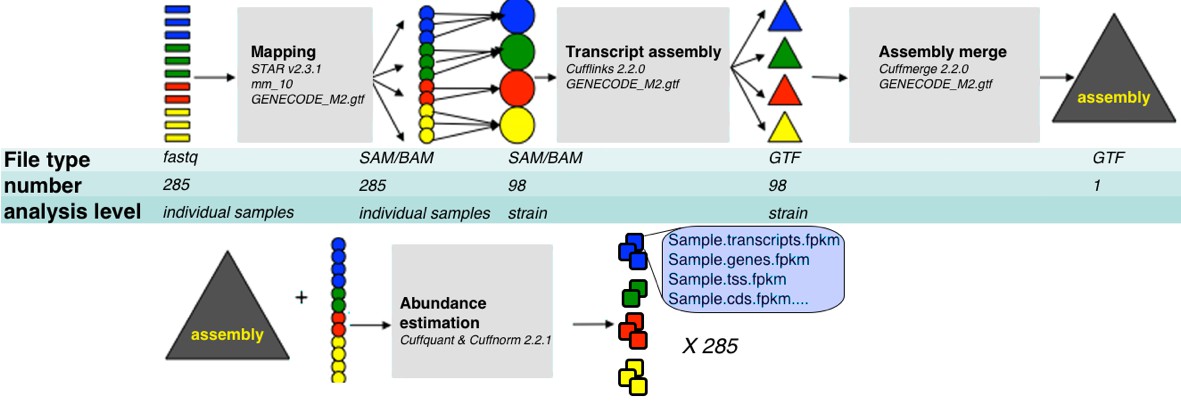
RNA-Seq analysis framework.
General workflow used for analysis of RNA-Seq data in this study. Initial demultiplexed samples (fastq files) were aligned to the mouse genome with STAR, merged in one file per strain, and transcripts assembeled with cufflings. The resulting assembly files (one from each strain) were merged with GENECODE M2 annotation into unified assembly. The abundance of each transcript in the unified assembly was estimated in sample specific alignment files.
Tables
Table 1
Transcriptome assembly and filtering.
| None | Filter #1* | Filter #2† | NR‡ | |
|---|---|---|---|---|
| Loci (genes) | 40472 | 37591 | 14079 | 14079 |
| Transcripts | 383420 | 357066 | 51024 | 50347 |
| known (=) coding | 99658 | 20721 | ||
| known (=) non coding | 8584 | |||
| novel isoform (j) | 259570 | 21234 | ||
| novel locus (u) | 11753 | 485 | ||
| other status | 12439 | |||
| TSS | 100073 | 94417 | 32537 | 20013 |
| CDS | 46242 | 46242 | 18687 | 7643 |
| Total features | 570207 | 535316 | 116327 | 92082 |
-
*Filter #1: Expression values of <1e–6 were rounded to zero, and novel transcripts with all zero values were removed both from expression table and from merged file. Also, all transcripts with class code not "=", "j" or "u" were removed.
-
†Filter #2: Implementation of detection and expression thresholds (detected in more than 100 samples and expressed (fpkm>1) in more than 50) on each feature separately.
-
‡Filter_NR: Non redundant features count (those that do not have 1_2_1 correlation to a gene).
Table 2
Summary of peptide support for transcripts.
| Peptide matching* | All | Uniquely mapped |
|---|---|---|
| Known transcripts | 9913 | 1016 |
| Protein_coding | 9839 | 1002 |
| ncRNAs | 74 | 14 |
| Novel isoforms | 401 | 94 |
| Novel genes | 29 | 24 |
| Total number | 10343 | 1134 |
-
*Peptides are counted towards supporting novel isoforms only if they do not match any known transcript, and towards supporting novel genes if they do not match either known or novel isoform transcripts. All peptides matching known transcripts were also assigned the most likely transcript. Non coding status was assigned only to peptides that do not match any coding transcripts (for full details please see Materials and methods).
Table 3
Alternative splicing events.
| All events | Cis QTL events | |
|---|---|---|
| Alternative 3' splice site (A3) | 316 (266) | 155 (134) |
| Alternative 5' splice site (A5) | 365 (304) | 220 (189) |
| Alternative first exon (AF) | 5288 (1874) | 2776 (1278) |
| Alternative last exon (AL) | 507 (320) | 283 (208) |
| Mutually exclusive exons (MX) | 44 (36) | 29 (27) |
| Retained Intron (RI) | 645 (476) | 356 (285) |
| Skipped exon (SE) | 399 (323) | 221 (189) |
| Total | 7564 (3599) | 4040 (2310) |
-
Table 2: Number in parenthesis indicates number of distinct genes affected by the events.
Table 4
Expression of hypothalamic markers.
| Gene | Marker for | Mean expression | local eQTL |
|---|---|---|---|
| AgRP | ARC neurons | 119.040 | ND |
| NPY | ARC neurons | 18.162 | ND |
| Foxo1 | ARC neurons | 4.736 | ND |
| POMC | ARC neurons | 271.954 | 2.618E-04 |
| Hcrt (orexin) | LHA neurons | 128.898 | 2.053E-05 |
| Sf1 | VMHvl neurons | 65.333 | ND |
| Nkx2-1 | VMHvl neurons | 6.067 | 1.100E-05 |
| Tac-1 | VMHvl neurons | 36.373 | 1.624E-09 |
| BDNF | VMHvl neurons | 4.464 | ND |
| Esr1 | Multiple | 2.658 | ND |
| LEPR | Multiple | 1.644 | 2.041E-04 |
| INSR | Multiple | 9.496 | ND |
| CX3CR1 | Microglia | 9.790 | 1.400E-05 |
| AIF-1 | Microglia | 98.598 | ND |
| CD68 | Microglia | 4.162 | ND |
| Itgam | Microglia | 3.599 | ND |
| MyD88 | Microglia | 2.369 | 1.942E-17 |
| Aqp4 | Astrocytes | 30.041 | ND |
| Slc1a3 | Astrocytes | 120.203 | ND |
| Aldh1l1 | Astrocytes | 16.787 | ND |
| Gfap | Astrocytes | 72.502 | 2.140E-06 |
| VEGF-A | Tanycytes | 39.559 | ND |
| CX3CL1 | Neurons | 99.411 | 9.836E-09 |
| Mog | Oligodendrocytes | 34.569 | 1.807E-04 |
| Mbp | Oligodendrocytes | 1266.574 | ND |
| Plp1 | Oligodendrocytes | 569.620 | ND |
| Car4 | Endothelial | 10.694 | ND |
| Esam | Endothelial | 11.623 | 3.184E-04 |
| Flt1 | Endothelial | 9.538 | ND |
| Cldn5 | Endothelial | 15.594 | ND |
Additional files
-
Supplementary file 1
Annotations of novel genes and samples.
(A) Annotation of novel genes and transcripts Basic annotation data of all transcripts classified as 'new locus' (class code = u).Data includes tracking ID of the transcript and gene, locus position, number of samples where transcript is detected (FPKM>1e-6) and number of samples where transcript is expressed (FPKM >1), mean expression across all samples and if gene arises from uniquely mapped reads. (B) Annotation of detected peptides Basic annotation data of all peptides detected by LC-MS proteomics. Data includes peptide sequence, tracking ids of matching transcripts (known, novel isoforms and novel genes, based on Cufflinks class code classification), number and list of strains in which the peptide was detected, and number of transcripts the peptide may be attributed to. (C) Sample description. Technical metadata pertaining to samples used in this study, including NCBI SRA accession numbers, RNA-Seq QC data (number of reads, mapped reads, detected junctions), and mouse id and strain.
- https://doi.org/10.7554/eLife.15614.016
-
Supplementary file 2
Trans eQTL hotspots.
Includes counts of associated genes in 100 kb windows, and for each of the hotspots: a list of associated genes, interaction p values, list of local eQTLs for the top SNP and DAVID enrichment annotation of the genes associated in trans.
- https://doi.org/10.7554/eLife.15614.017
-
Supplementary file 3
Trans eQTL hotspots - gene counts, functional enrichment and local QTLs.
(A) Gene-trait correlations Top known 500 genes associated with each phenotype in HMDP.Data is aggregated in table form crossing all genes with all traits, thus not all gene-trait pairs are significant. ‘Inf ‘indicates not significant interactions. Numeric values indicate p value of association, with 1E-3 correlating to 5% FDR threshold based on permutations. (B) Novel genes are associated with metabolic traits Data table with all detected associations between novel genes and the 150 phenotypes assessed in HMDP.
- https://doi.org/10.7554/eLife.15614.018
Download links
A two-part list of links to download the article, or parts of the article, in various formats.
Downloads (link to download the article as PDF)
Open citations (links to open the citations from this article in various online reference manager services)
Cite this article (links to download the citations from this article in formats compatible with various reference manager tools)
Hypothalamic transcriptomes of 99 mouse strains reveal trans eQTL hotspots, splicing QTLs and novel non-coding genes
eLife 5:e15614.
https://doi.org/10.7554/eLife.15614


