Perceptually relevant remapping of human somatotopy in 24 hours
- University of Oxford, United Kingdom
- University College, United Kingdom
- University College London, United Kingdom
Figures
Figure 1 with 3 supplements
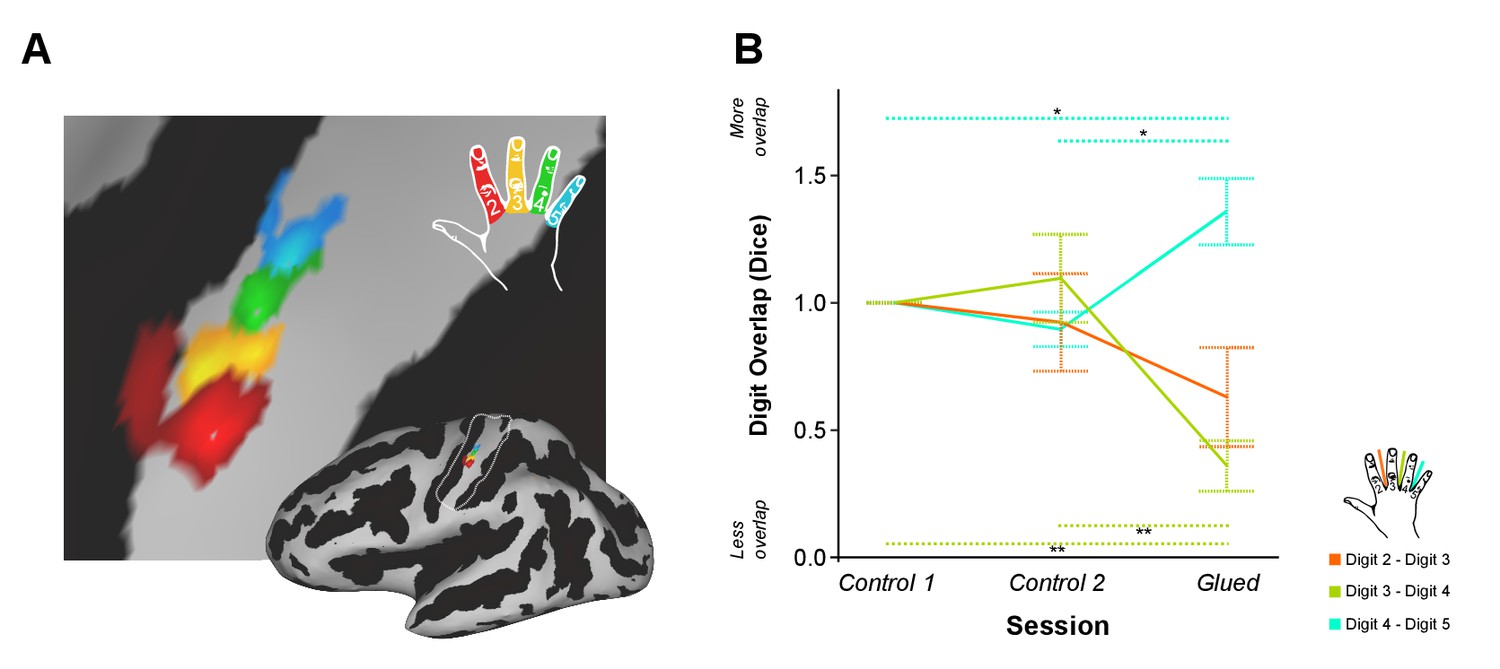
Patterns of rapid experience-dependent remapping in human SI.
(A) An example digit map from an individual participant and session, shown on an inflated brain surface (bottom right), and a zoomed panel (Threshold FDR α = 0.01); sulci and gyri are shown in dark and light grey, respectively. The region of interest used for cortical overlap analysis is indicated by a white line on the inflated brain. (B) Cortical overlap between pairs of digit representations showed a significant reduction between D3 and D4, and a significant increase between D4 and D5 after the gluing manipulation compared with the two control conditions. *p<0.05 **p<0.005 Sidak corrected. Data in (B) are presented normalised to control one session; all statistics were performed on raw un-normalised data. Dice: Dice coefficient; Error bars represent standard error of mean.
-
Figure 1—source data 1
Data presented in Figure 1B.
DICE coefficients representing digit overlap for three digit pairs (D2–D3, D3–D4 and D4–D5) across three conditions (Control 1, Control 2 and Glued).
- https://doi.org/10.7554/eLife.17280.004
Figure 1—figure supplement 1

Cortical surface area of individual digit representations used in calculation of DICE coefficient at each time point.
No significant change in cortical digit surface area was observed across the three time points under study (Control 1, Control 2 and Glue); two-way repeated measures ANOVA indicated no significant interaction between session and digit on the surface area (F(6,48) = 1.259, p=0.294, η2:. 136).
Figure 1—figure supplement 2
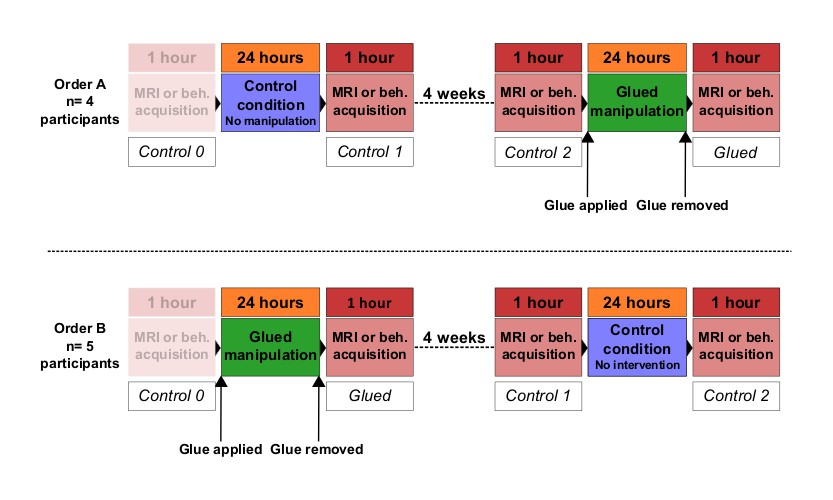
Overview of the fMRI experiment and the behavioural experiment study design.
The order of conditions was counterbalanced across participants, resulting in four participants experiencing the control period first (Order A; top row), and five participants experiencing the gluing manipulation first (Order B, bottom row). Control 0 was treated as an habituation session and was not included in the analysis. Beh: behavioural testing.
Figure 1—figure supplement 3
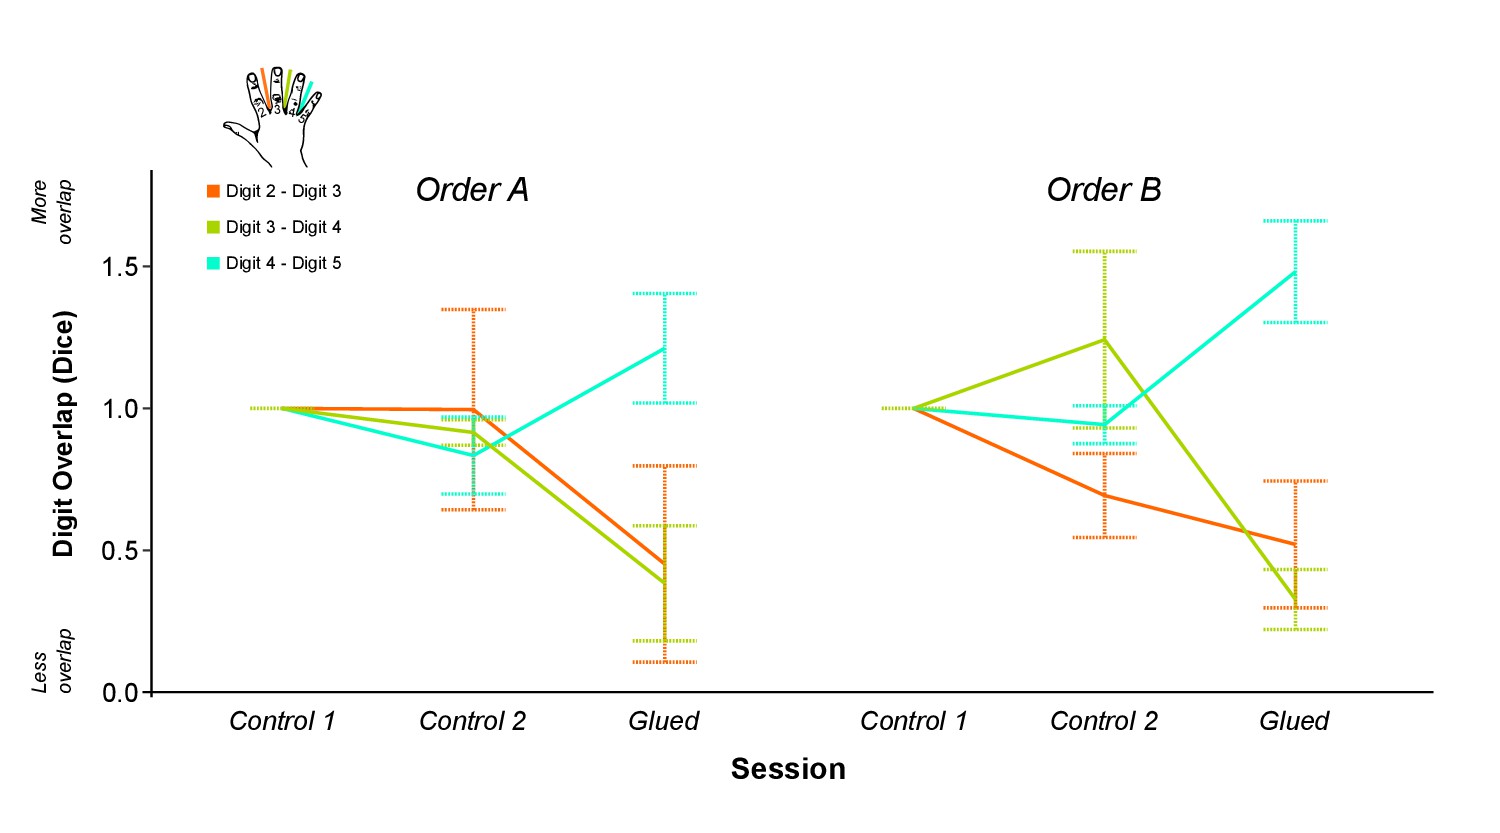
Data presented in Figure 1B split according to the order of sessions.
(A) Order A (Control 1 separated by 4 weeks from Control 2 and Glued): n = 4; Order B (Glued separated by 4 weeks from Control 1 and Control 2), n = 5.
Figure 2
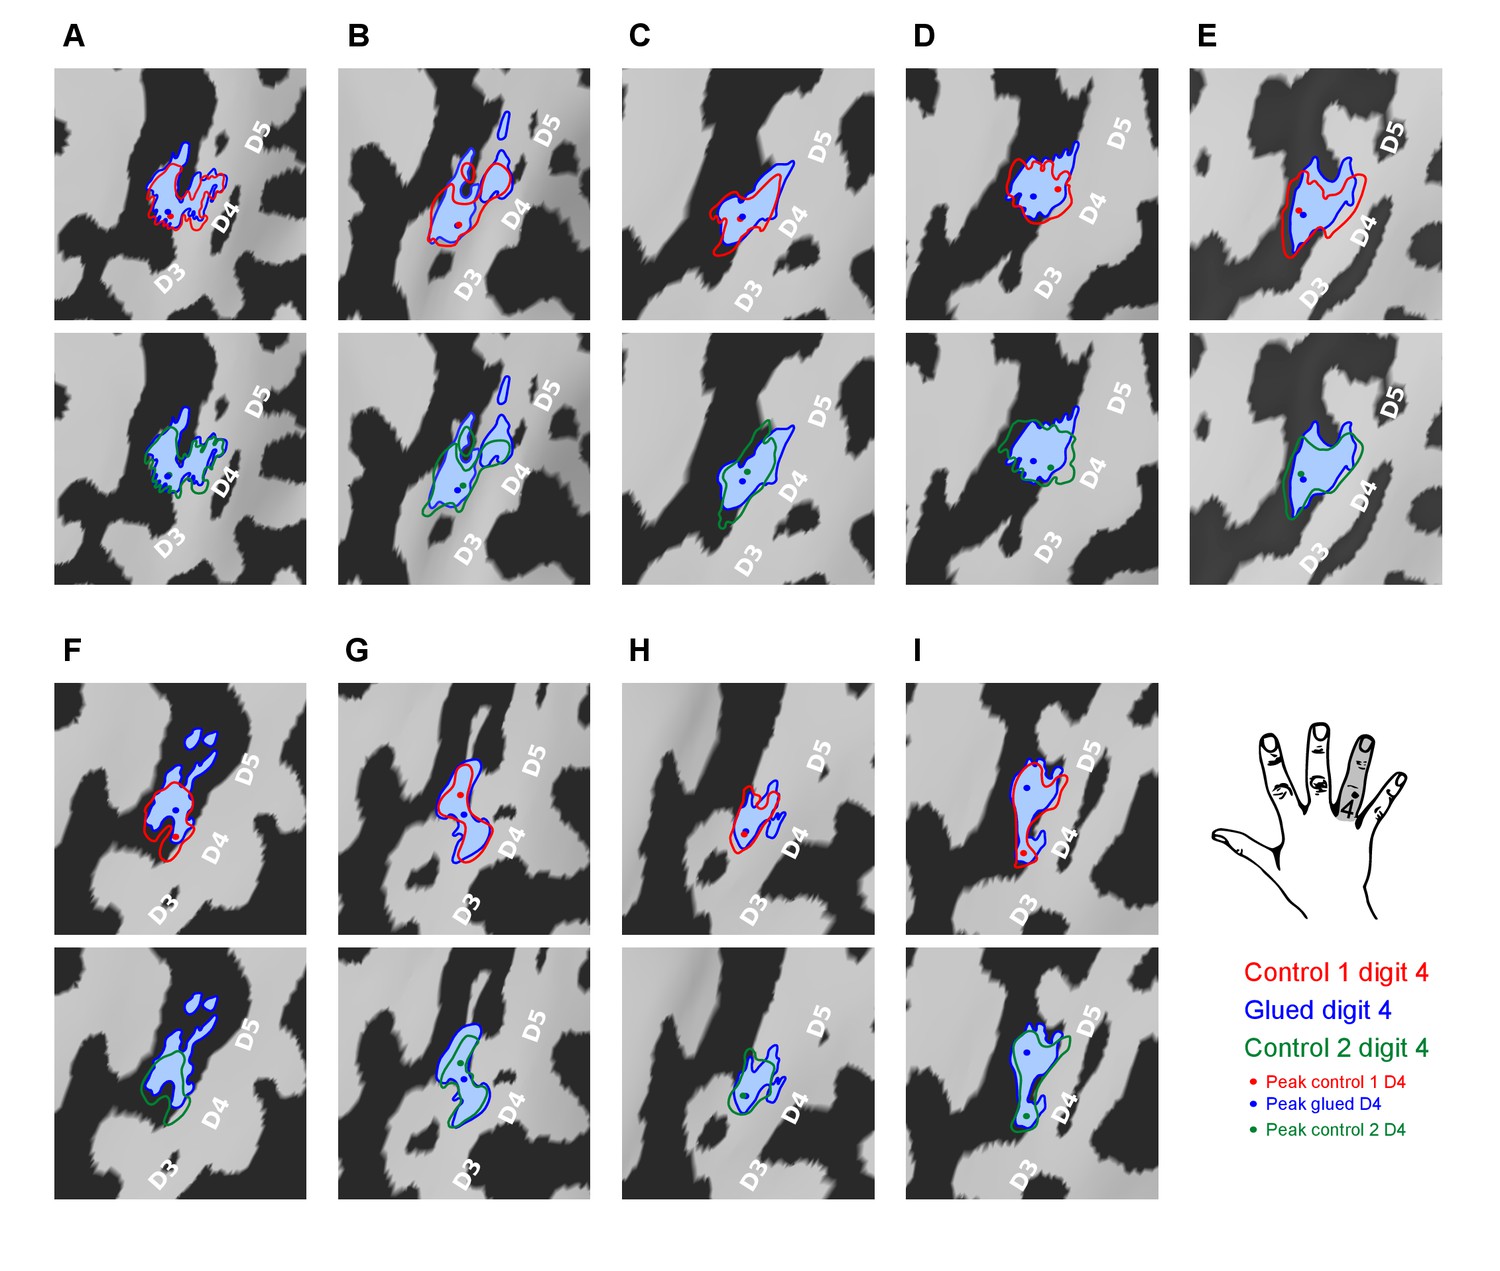
Pattern of shift in the cortical representation of digit 4 from inter-digit overlap analysis.
Data displayed for all nine participants (A–I) showing the outline of the digit 4 representation mapped during the three sessions (Control 1, Control 2, Glued) overlaid on the individual participants’ cortical surface reconstruction (sulci: dark grey, gyri: light grey; zoomed panel showing anatomical hand knob). The location of the peak vertex is shown with a coloured circle. These results demonstrated a consistent shift in the representation of digit 4 at the level of individual participants, such that while there is a minimal change in peak activation and area of the representation, the flank adjacent to the representation of digit 5 expands, and the flank adjacent to digit 3 contracts, consistent with the observed changes in cortical overlap (Figure 1B).
Figure 3
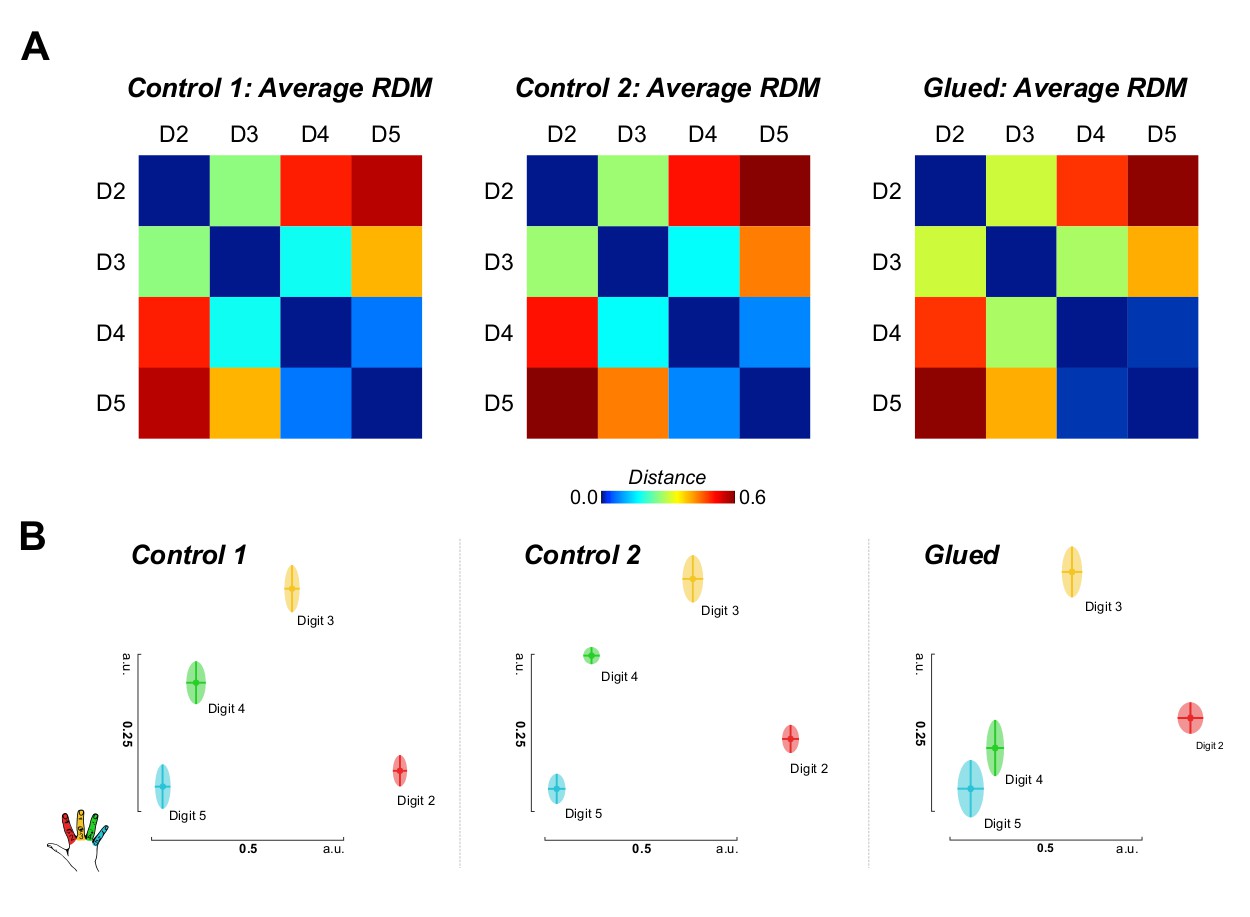
Representational similarity analysis of block design data yields complementary evidence of shift in the S1 representation of digit 4 away from digit 3 and towards digit 5.
(A) Noise normalised parameter estimates from a standard GLM for each digit were used to construct representational dissimilarity matrices (RDMs) using Euclidean distance within a hand knob ROI derived individually for each subject from phase-encoding data from all sessions. Average raw distance values are shown for each session (B) Multidimensional scaling and Procrustes analysis of individual participants’ distance matrices at each time point demonstrate schematically the observed shift in the representation of digit 4, away from digit 3, and towards digit 5, consistent with the observed pattern of cortical overlap and tactile discrimination changes. Two-way repeated measures ANOVA indicated a significant interaction between session and digit pair on the amount of cortical overlap (F(2.0,16.2) = 4.430, p=0.029, η2:0. 356), driven by a shift in the representation of digit 4 away from digit 3 (Simple Main Effect: F(2,16) = 16.076; pairwise comparisons glued vs. control 1 and control 2: p<0.01). Multidimensional scaling yields the spatial relationship of representations in arbitrary units (a.u.).
-
Figure 3—source data 1
Data presented Figure 3A.
Representational similarity analysis distance metrics for adjacent digit pairs (D2–D3, D3–D4 and D4–D5) across three conditions (Control 1, Control 2 and Glued).
- https://doi.org/10.7554/eLife.17280.010
Figure 4 with 1 supplement
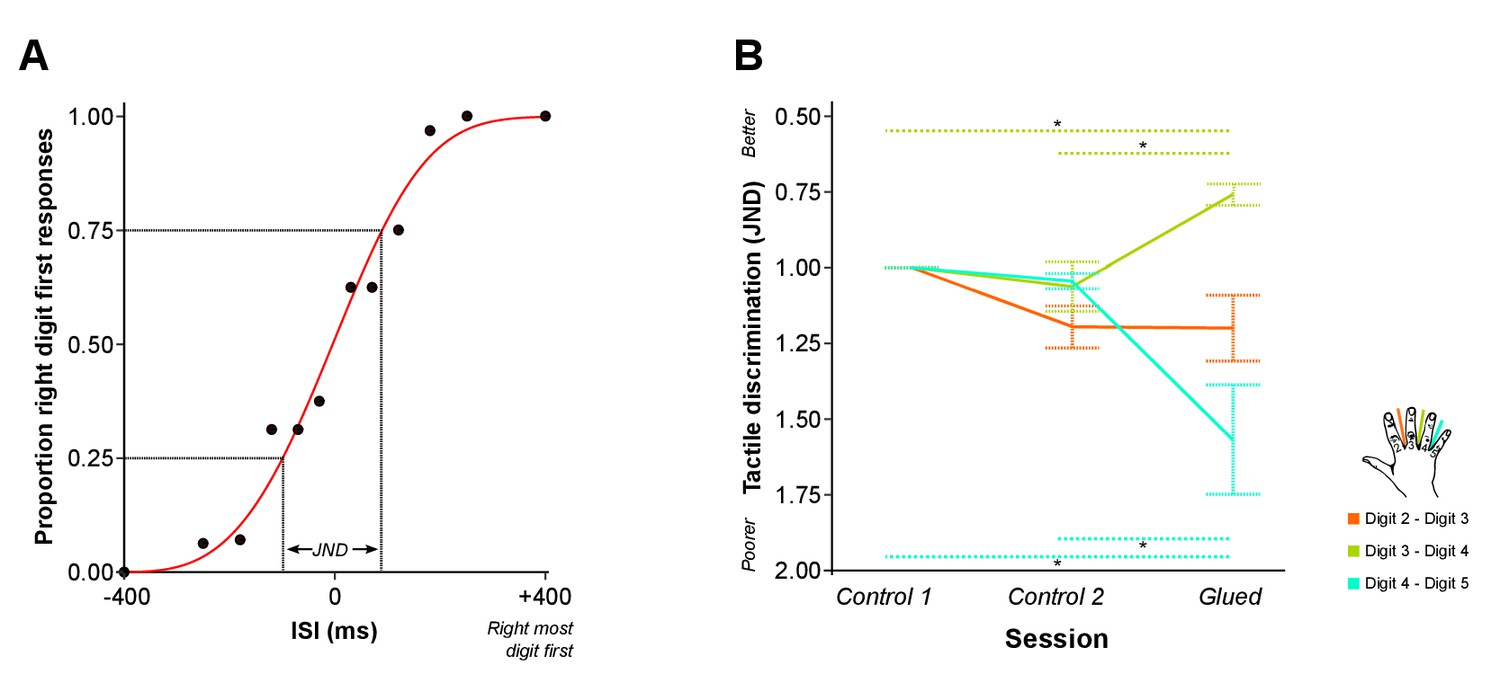
Patterns of rapid experience-dependent remapping in SI mirror peripheral changes in tactile discrimination performance.
(A) An example of accuracy data from the temporal order judgment task. Accuracy scores (black dots) are illustrated for an individual participant and a single run assessing performance across D2-D3. Data are fitted with a logistic function (red line) from which the just noticeable difference (JND) is calculated: a measure of temporal tactile acuity; greater JND means poorer tactile discrimination. (B) Tactile discrimination improved significantly between D3 and D4, and worsened significantly between D4 and D5 after the gluing manipulation compared with the two control conditions. In summary, fMRI evidence of rapid cortical remapping (Figure 3) concurs with behavioural changes in tactile function (B), such that the digit pair with reduction in cortical overlap (D3–D4) also shows increases in tactile discrimination, whereas the digit pair showing increase in cortical overlap (D4–D5) demonstrates worsening of tactile discrimination *p<0.05 **p<0.005 Sidak corrected. Data in (B) are presented normalised to time point control 1; all statistics were performed on raw un-normalised data. ISI: inter-stimulus interval; JND: Just Noticeable Difference. Error bars represent standard error of mean.
-
Figure 4—source data 1
Data presented Figure 4B.
Just Noticeable Difference (JND) values representing tactile discrimination ability for three digit pairs (D2–D3, D3–D4 and D4–D5) across three conditions (Control 1, Control 2 and Glued).
- https://doi.org/10.7554/eLife.17280.012
-
Figure 4—source data 2
Data presented Figure 4—figure supplement 1B.
Frequency of mis-localisations for motor confusion task across adjacent digit pairs (D2–D3, D3–D4 and D4–D5) across three conditions (Control 1, Control 2 and Glued).
- https://doi.org/10.7554/eLife.17280.013
Figure 4—figure supplement 1
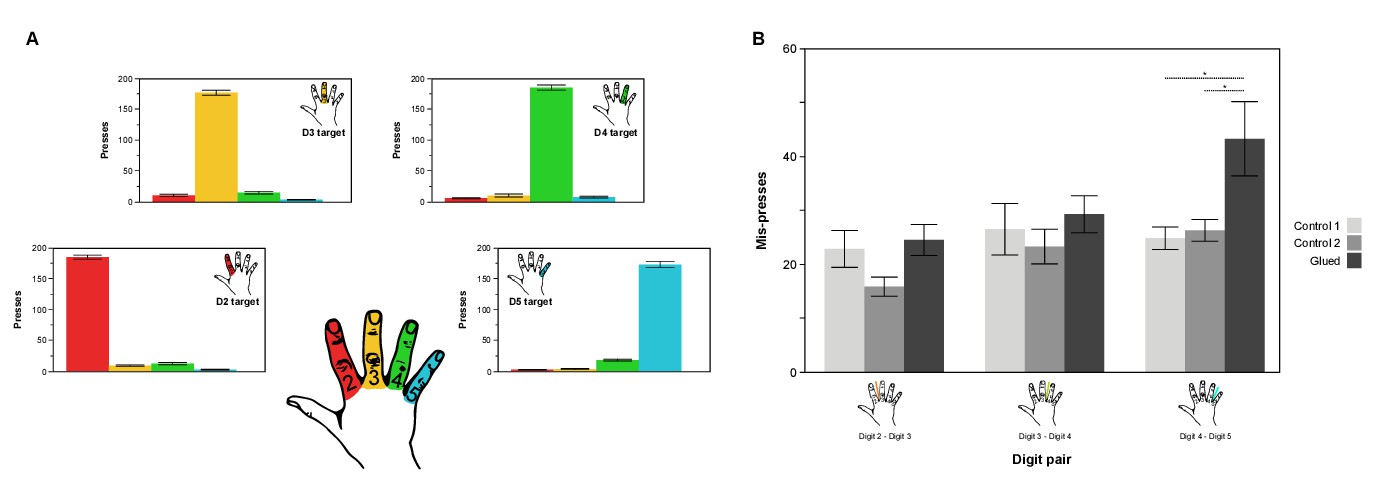
In a motor confusion task involving rapid button presses using the four digits under study (D2, D3, D4, D5) there is an increase in the number of mis-presses between digits 4 and 5, consistent with the observed pattern of increased cortical overlap and representational similarity observed between digit 4 and 5.
(A) Distribution of presses and mis-presses for each target and each digit, averaged across Control 1 and Control 2, demonstrating a pattern of mis-presses predominantly in digits adjacent to the target. (B) Plotting the average number of mis-presses across adjacent digit pairs during different sessions reveals an increased confusion in presses between digit 4 and digit 5 in the Glued condition compared with Control 1 and Control 2, not seen in other digit pairs. Two-way repeated measures ANOVA indicated a significant interaction between session and digit pair on number of mis-presses (F(4,32) = 3.828, p=0.012, η2: 0.324), driven by an increase in confusion between digit 4 and 5 in the glued condition compared with controls; *p<0.05 Sidak corrected.
Additional files
-
Supplementary file 1
Consistent patterns of peak-to-peak distance (mm) in cortical z-statistic digit representations.
The observed consistency was quantified with Cronbach’s α for each digit pair across the three time points. The resulting values support a high degree of consistency in the relative peak-to-peak distance across the observed digit maps over time.
- https://doi.org/10.7554/eLife.17280.015
-
Supplementary file 2
Summary of goodness of fit between phase-encoding model and fMRI data for each digit and timepoint.
These values support a high degree of consistency in the model fit within each participant and digit across the fMRI time points: 181 TRs of fMRI data.
- https://doi.org/10.7554/eLife.17280.016
-
Supplementary file 3
Demographic information for participants recruited to fMRI and behavioural cohorts.
F: female, M: Male, R: right handed.
- https://doi.org/10.7554/eLife.17280.017
-
Supplementary file 4
Full statistical outputs for repeated measures ANOVAs and simple main effects analyses.
- https://doi.org/10.7554/eLife.17280.018
Download links
A two-part list of links to download the article, or parts of the article, in various formats.
Downloads (link to download the article as PDF)
Open citations (links to open the citations from this article in various online reference manager services)
Cite this article (links to download the citations from this article in formats compatible with various reference manager tools)
Perceptually relevant remapping of human somatotopy in 24 hours
eLife 5:e17280.
https://doi.org/10.7554/eLife.17280


