Odd-paired controls frequency doubling in Drosophila segmentation by altering the pair-rule gene regulatory network
- University of Cambridge, United Kingdom
Figures
Figure 1

The evolution of pair-rule patterning predates the evolution of long germ segmentation.
(A) Single segment periodicity is ancestral in arthropod segmentation, being found in spiders, millipedes, crustaceans and some insects (Davis et al., 2005; Pueyo et al., 2008). 'Pair-rule' patterning, involving an initial double segment periodicity of pair-rule gene expression, appears to have evolved independently at least twice. It is found in insects and certain centipedes (Davis et al., 2001; Chipman et al., 2004). (B) Long germ segmentation is likely to have evolved independently multiple times within holometabolous insects, from an ancestral short germ state (Liu and Kaufman, 2005). Light blue boxes for the Lepidoptera and Hymenoptera indicate that short germ segmentation is relatively uncommon in these clades.
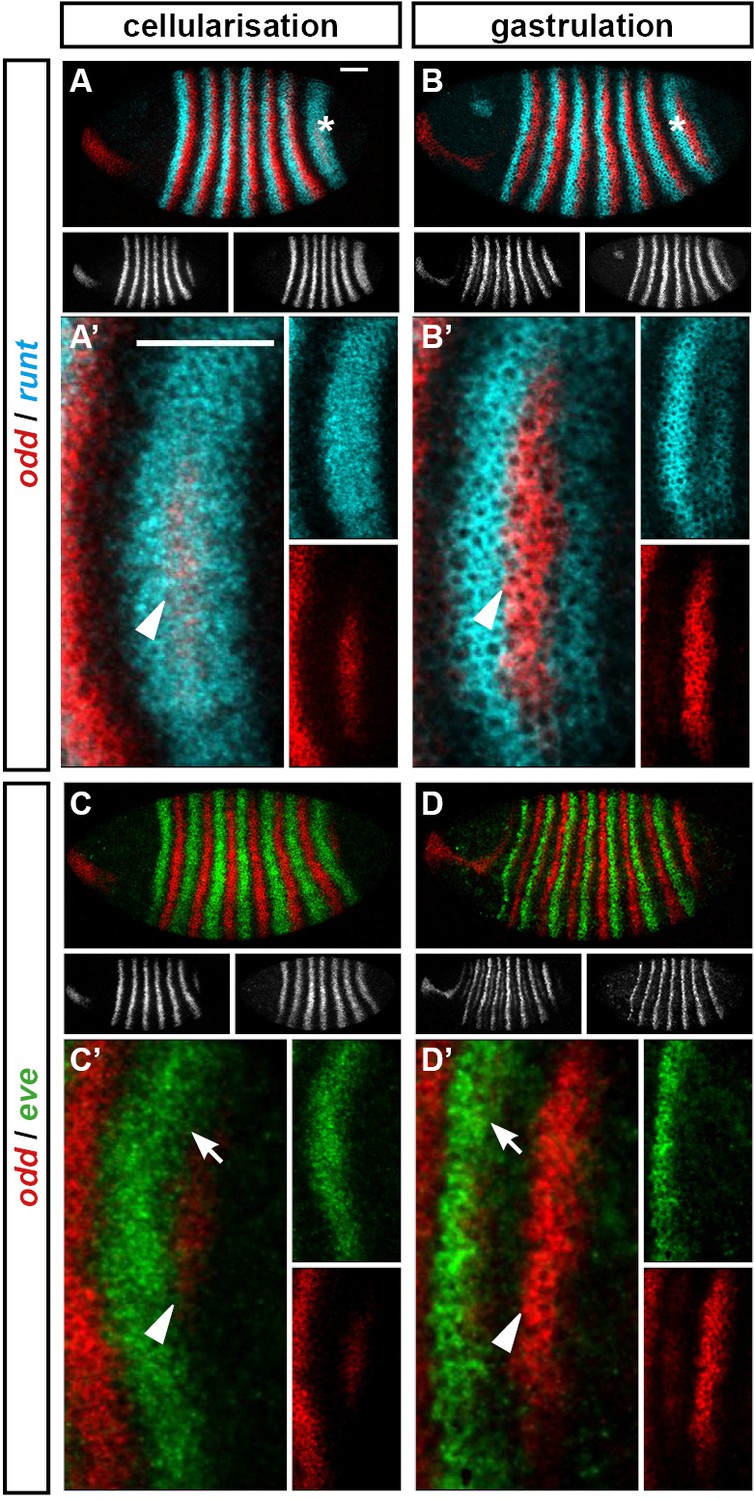
Figure 2
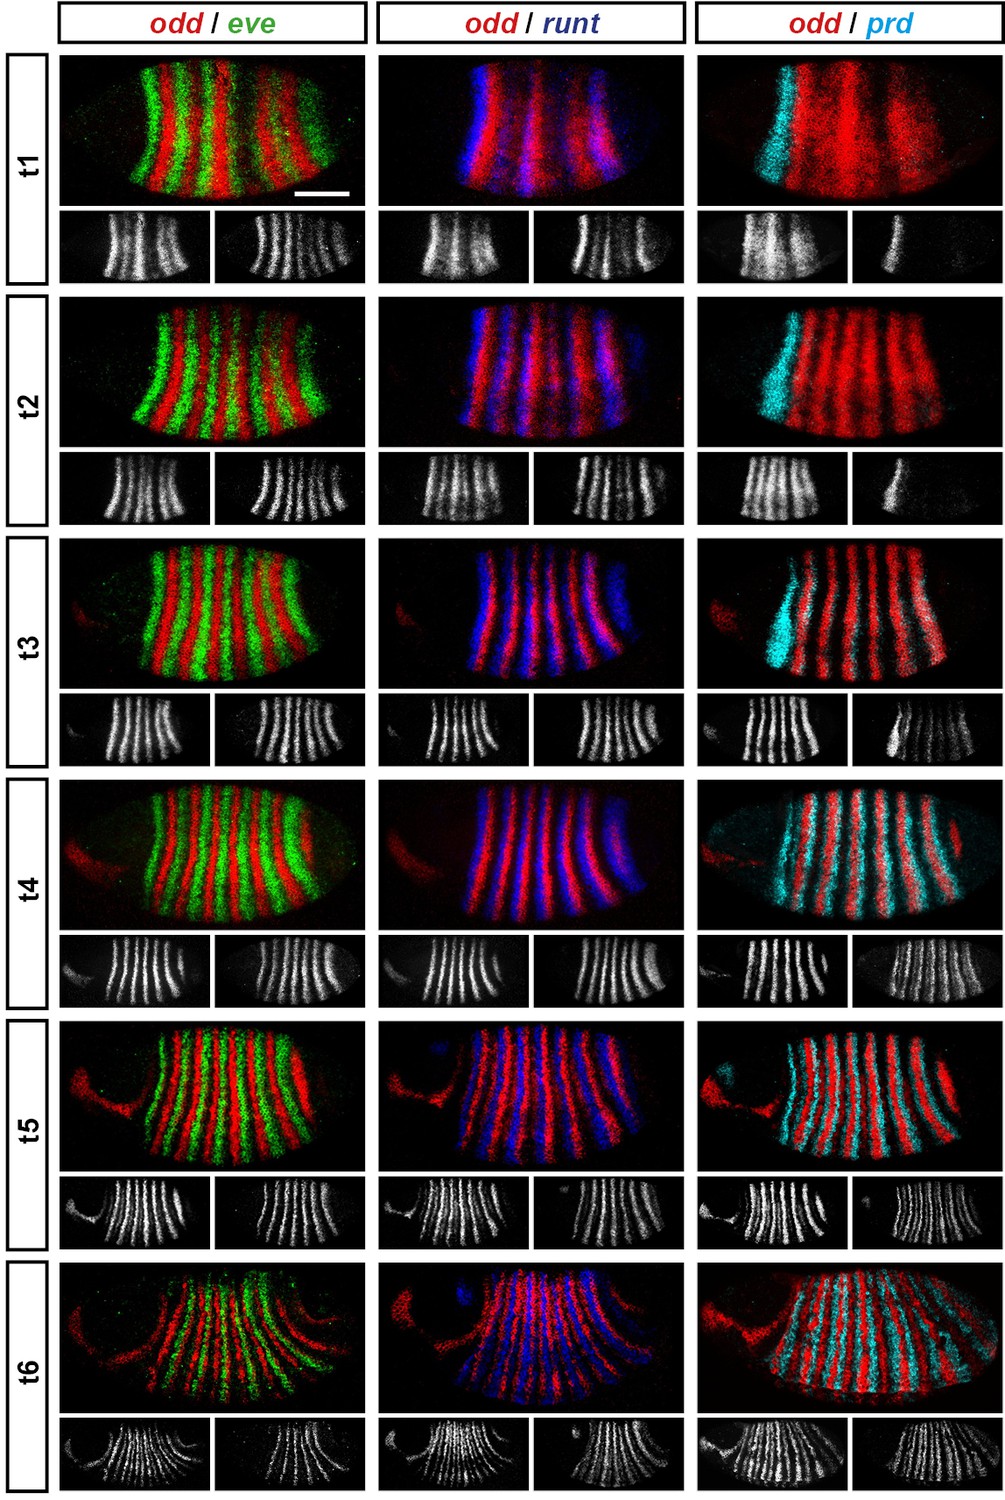
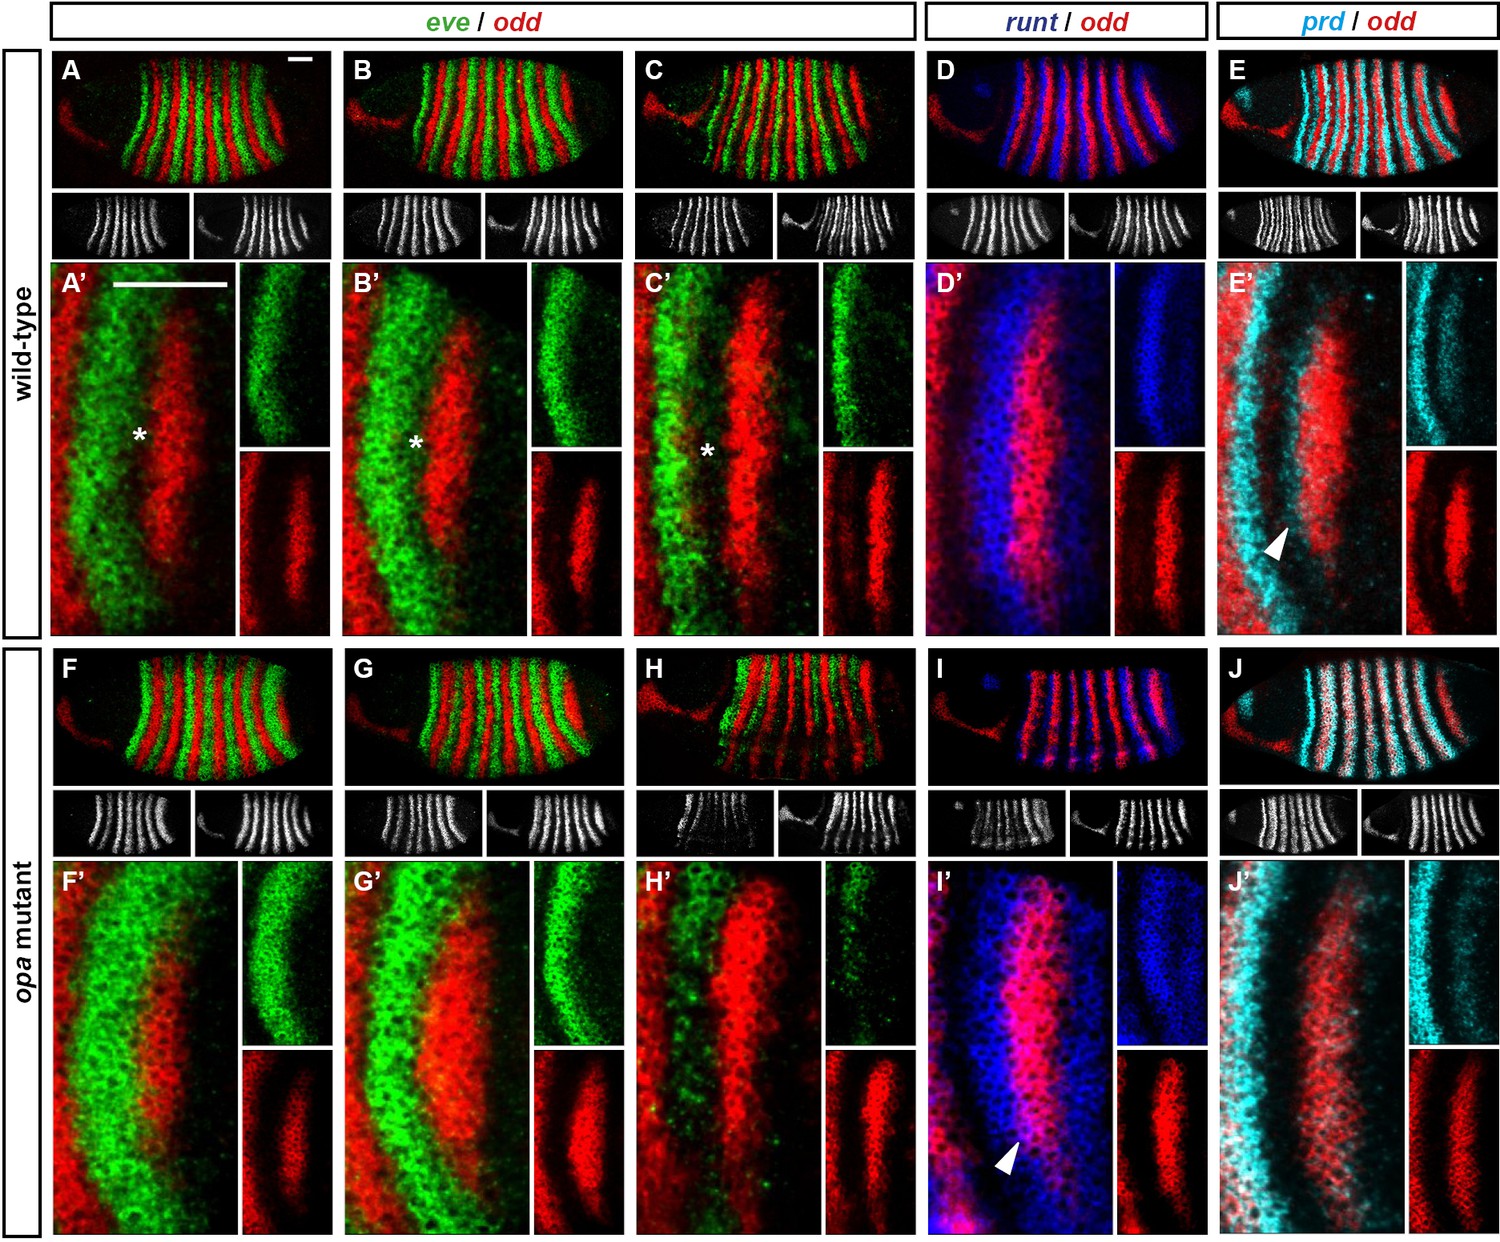
Representative double fluorescent in situ hybridisation data for three combinations of pair-rule genes.
This figure shows a small subset of our wild-type dataset. Each column represents a different pairwise combination of in situ probes, while each row shows similarly-staged embryos of increasing developmental age. All panels show a lateral view, anterior left, dorsal top. Individual channels are shown in grayscale below each double-channel image. For ease of comparison, the signal from each gene is shown in a different colour in the double-channel images. Time classes are arbitrary, meant only to illustrate the progressive stages of pattern maturation between early cellularisation (t1) and late gastrulation (t6). Note that the developing pattern of odd expression in the head provides a distinctive and reliable indicator of embryo age. Scale bar = 100 μm. The complete dataset is available from the Dryad Digital Repository (Clark and Akam, 2016).
Figure 3
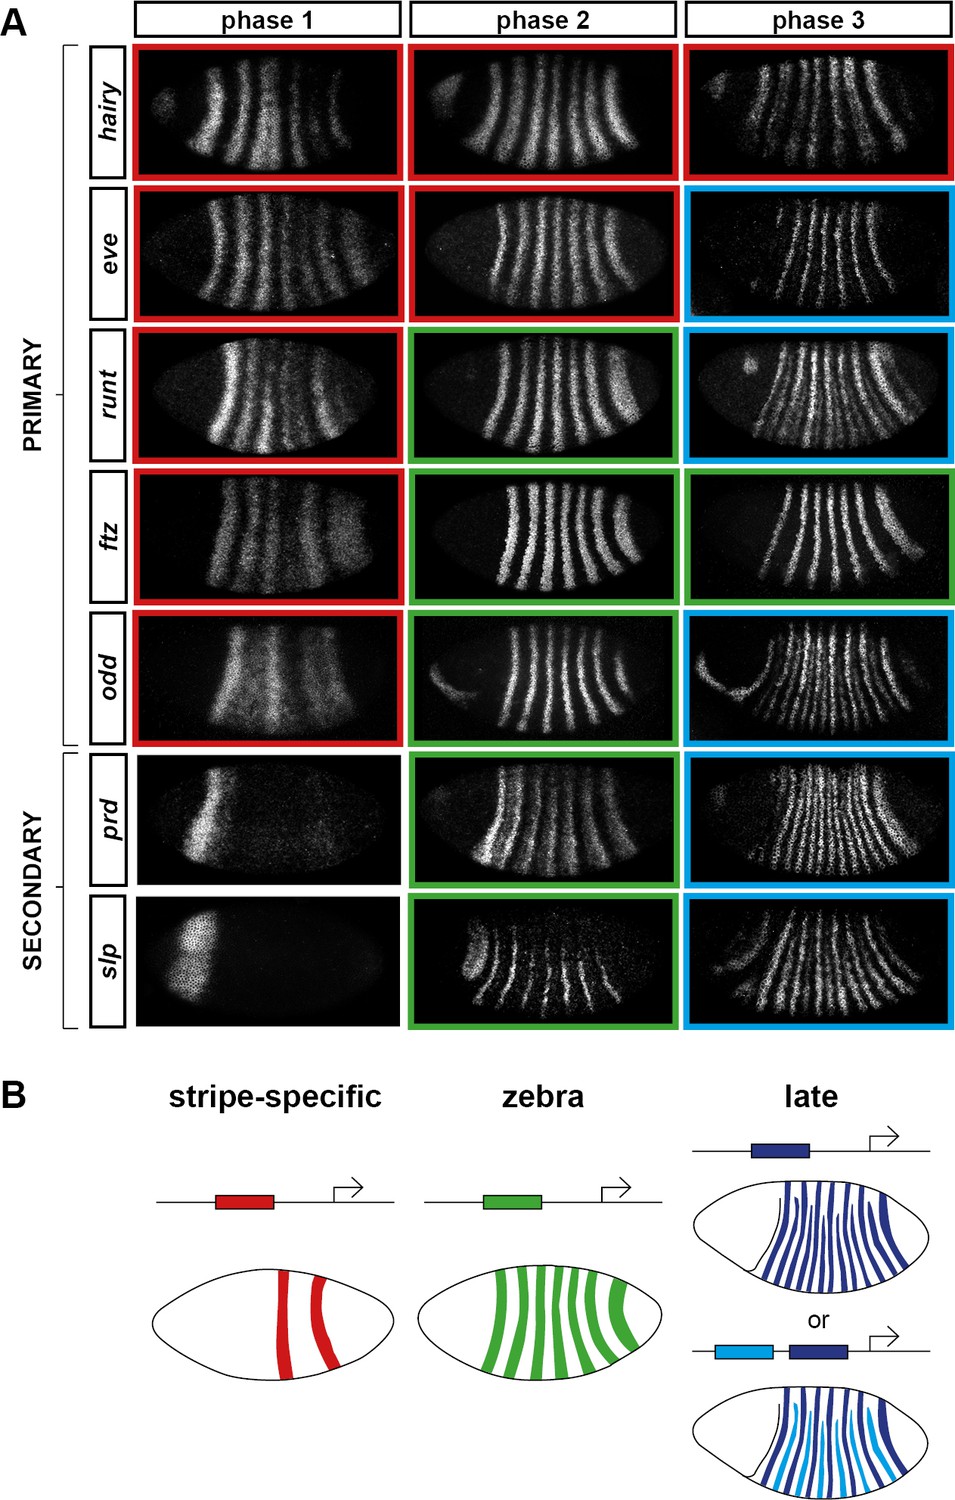
Three phases of pair-rule gene expression, usually mediated by different classes of regulatory element.
(A) Representative expression patterns of each of the seven pair-rule genes at phase 1 (early cellularisation), phase 2 (mid cellularisation) and phase 3 (gastrulation). Pair-rule genes are classified as 'primary' or 'secondary' based on their regulation and expression during phase 1 (see text). All panels show a lateral view, anterior left, dorsal top. Note that the cephalic furrow may obscure certain anterior stripes during phase 3. (B) Illustrative diagrams of the different kinds of regulatory elements mediating pair-rule gene expression. 'Stripe-specific' elements are regulated by gap genes and give rise to either one or two stripes each. 'Zebra' elements are regulated by pair-rule genes and give rise to seven stripes. 'Late' expression patterns may be generated by a single-element generating segmental stripes, or by a combination of two elements each generating a distinct pair-rule pattern. The coloured outlines around the panels in (A) correspond to the colours of the different classes of regulatory elements in (B), and indicate how each phase of expression of a given pair-rule gene is thought to be regulated. See text for details.
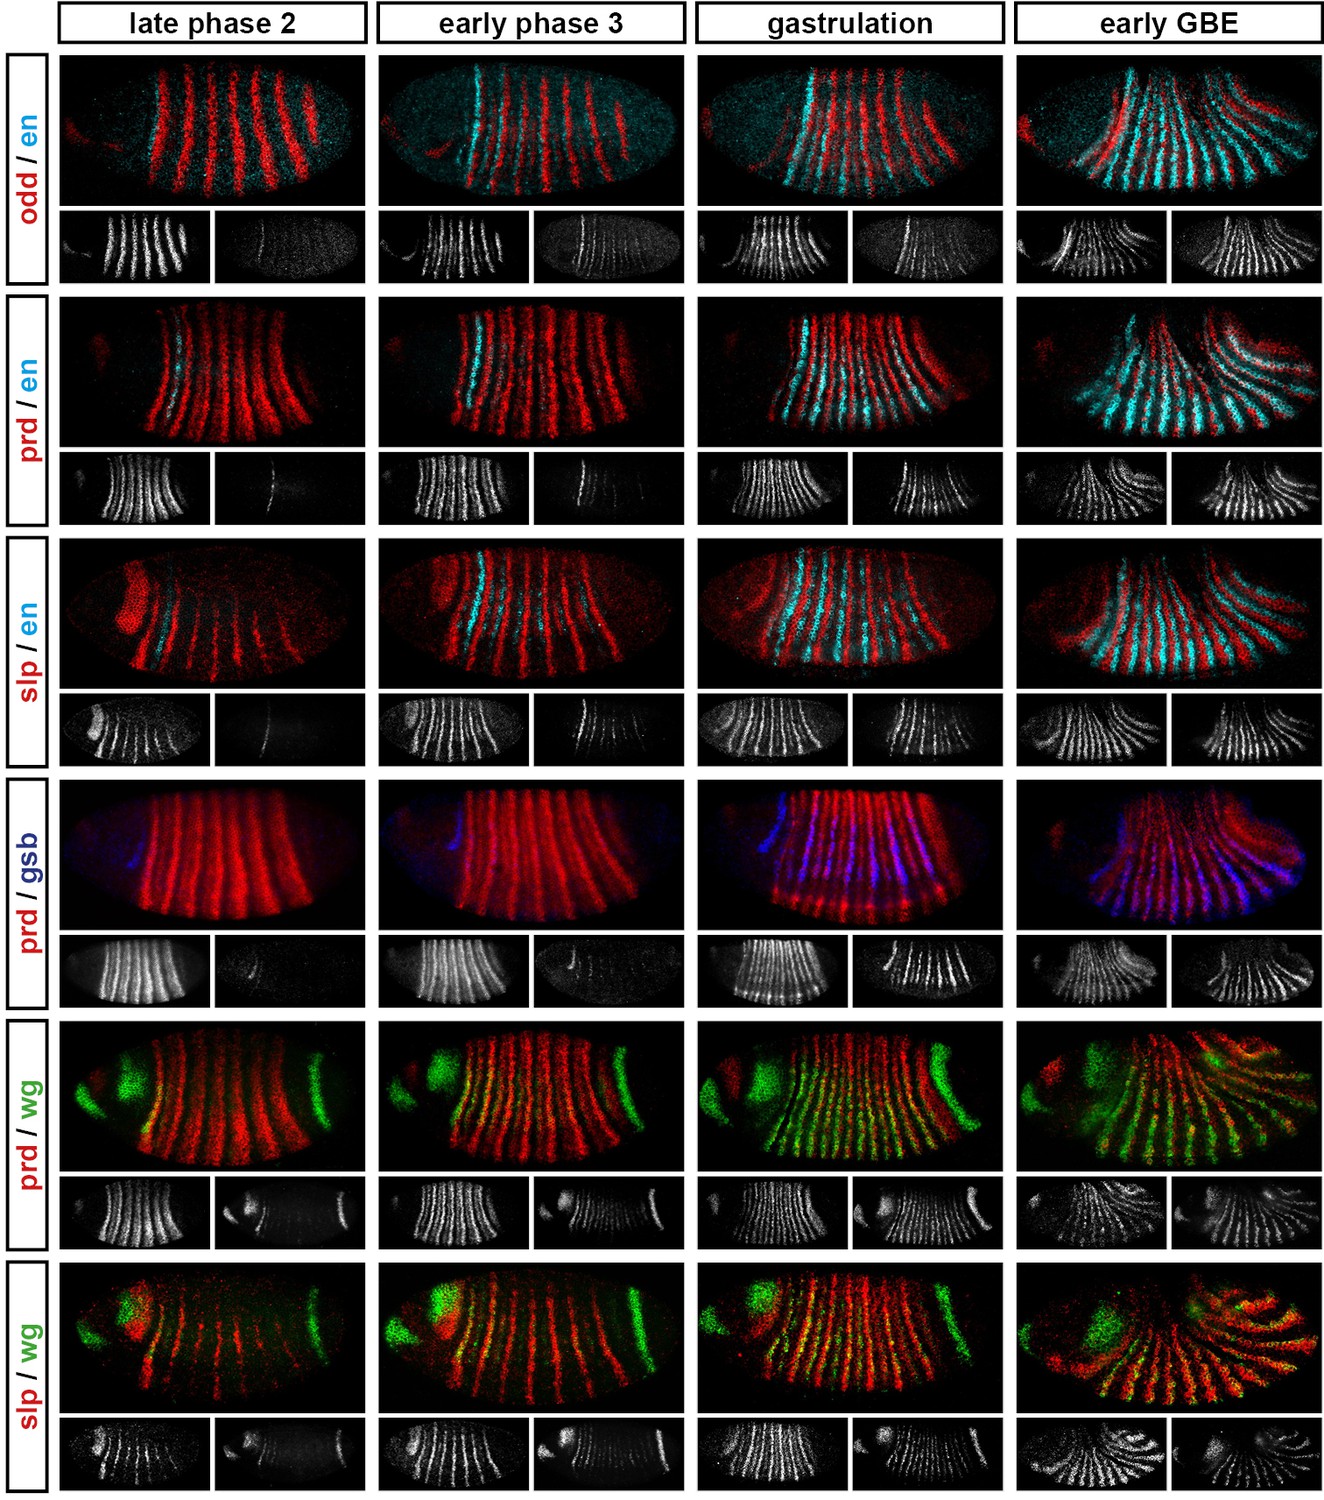
Figure 4 with 2 supplements
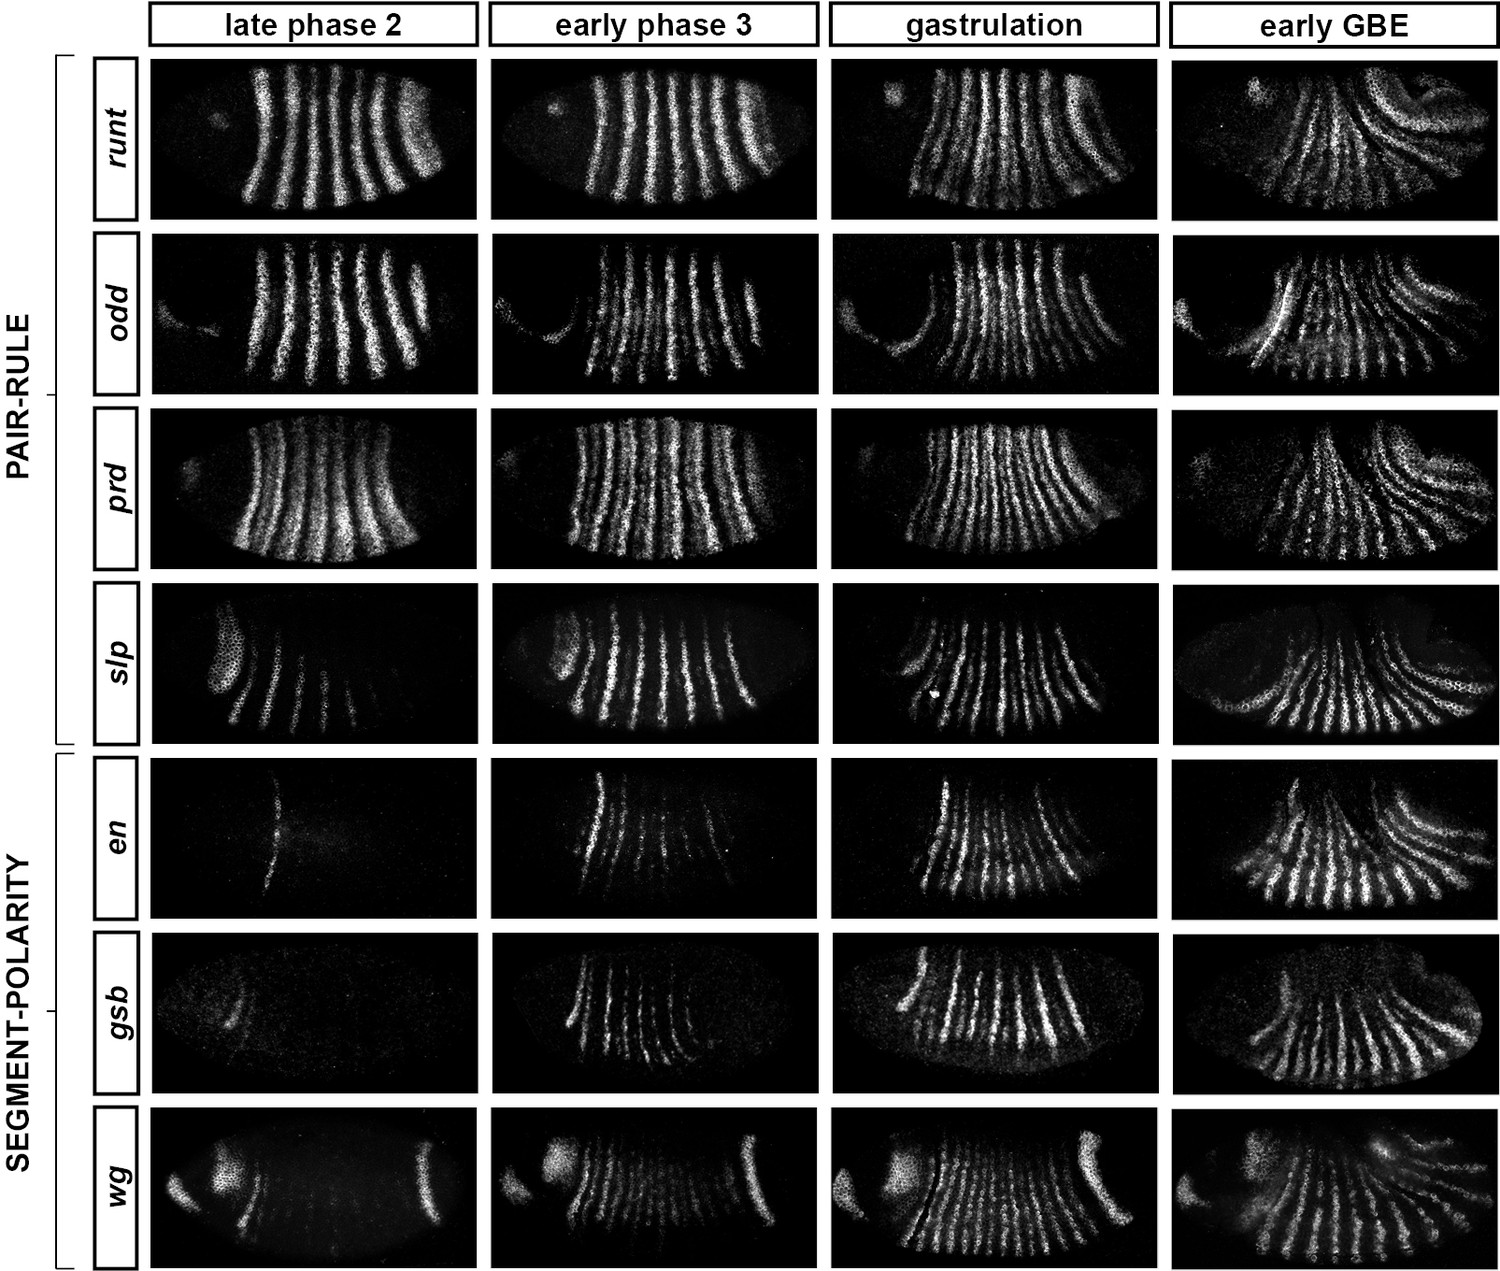
Frequency-doubling of pair-rule gene expression patterns is almost simultaneous and coincides with the first expression of the segment-polarity genes.
Each row shows the expression of a particular pair-rule gene or segment-polarity gene, while each column represents a particular developmental timepoint. Late phase 2 and early phase 3 both correspond to late Bownes stage 5; gastrulation is Bownes stage 6, and early germband extension is Bownes stage 7 (Bownes, 1975; Campos-Ortega and Hartenstein, 1985). All panels show a lateral view, anterior left, dorsal top. GBE = germband extension. The figure represents about 20 min of development at 25°C.
Figure 4—figure supplement 1
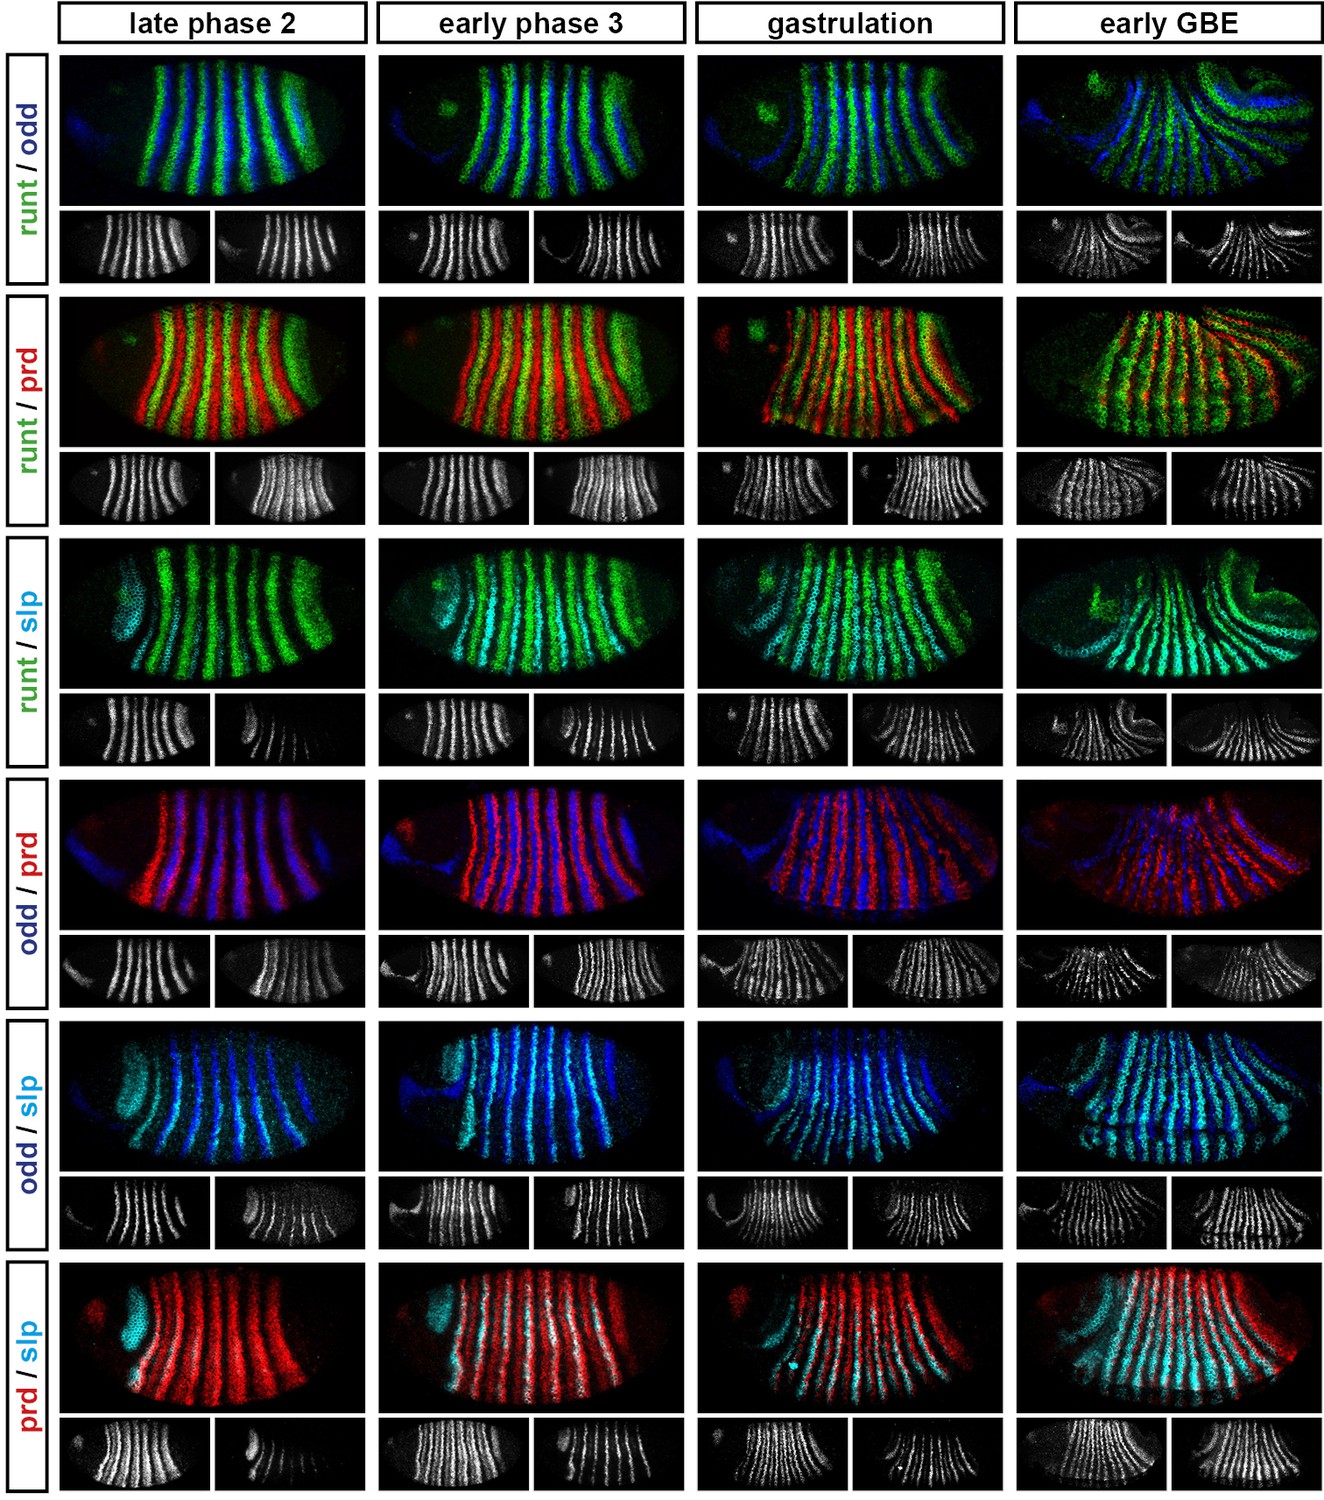
Relative expression of pair-rule genes during frequency-doubling.
Each row shows the relative expression of two pair-rule genes, while each column represents a particular developmental timepoint. Late phase 2 and early phase 3 both correspond to late Bownes stage 5; gastrulation is Bownes stage 6, and early germband extension is Bownes stage 7 (Bownes, 1975; Campos-Ortega and Hartenstein, 1985). All panels show lateral or ventrolateral views, anterior left, dorsal top. Single-channel images are shown in greyscale below each double-channel image (the channel listed first in the row label is always on the left). Each gene is shown as a different colour in the double-channel images. GBE = germband extension.
Figure 4—figure supplement 2
Relative expression of segment-polarity genes and pair-rule genes during frequency-doubling.
Each row shows the relative expression of a particular pair-rule gene and segment-polarity gene combination, while each column represents a particular developmental timepoint. Late phase 2 and early phase 3 both correspond to late Bownes stage 5; gastrulation is Bownes stage 6, and early germband extension is Bownes stage 7 (Bownes, 1975; Campos-Ortega and Hartenstein, 1985). All panels show a lateral view, anterior left, dorsal top. Single-channel images are shown in greyscale below each double-channel image (the channel listed first in the row label is always on the left). Each segment-polarity gene is shown in a different colour, while pair-rule gene expression is shown in red. GBE = germband extension.
Figure 5
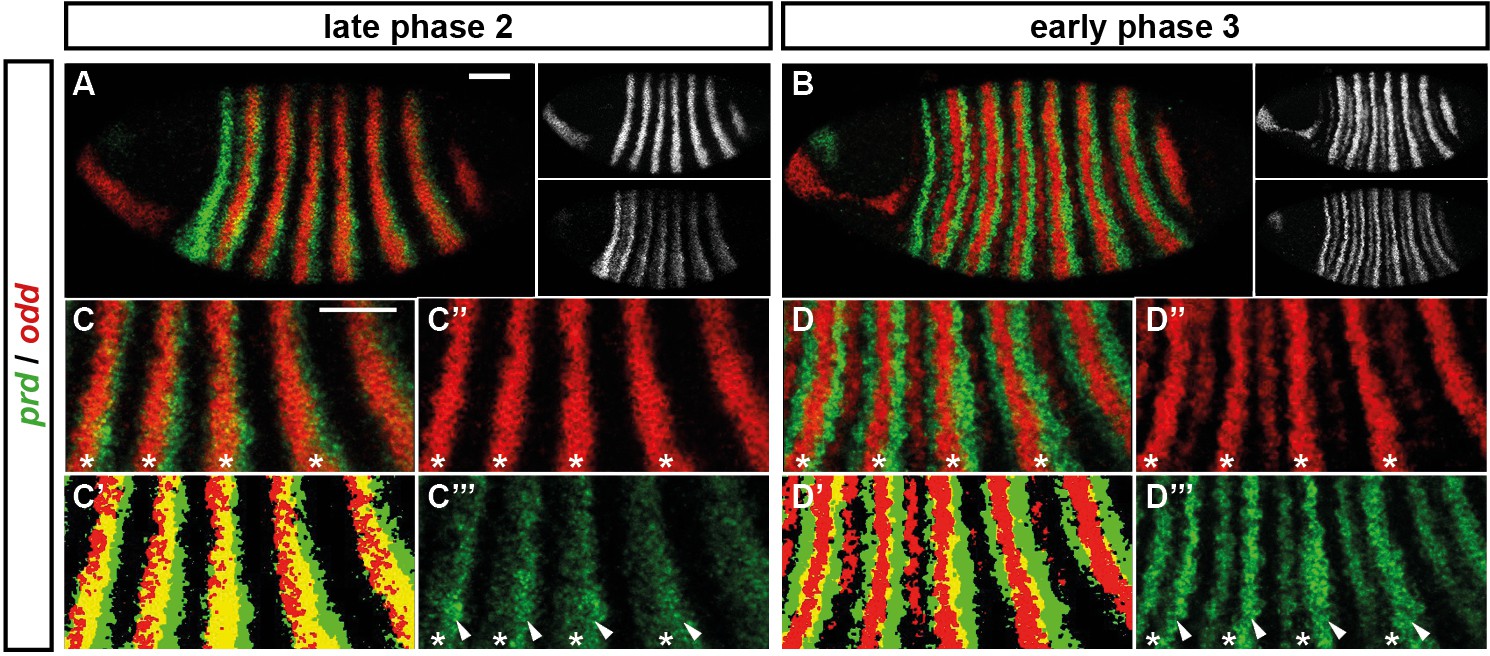
Odd does not repress prd transcription until phase 3.
Relative expression of prd and odd is shown in a late phase 2 embryo (just prior to frequency doubling) and an early phase 3 embryo (showing the first signs of frequency doubling). (A, B) Whole embryos, lateral view, anterior left, dorsal top. Individual channels are shown to the right of each double-channel image, in the same vertical order as the panel label. (C, D) Blow-ups of expression in stripes 2–6; asterisks mark the location of odd primary stripes. Thresholded images (C’, D’) highlight regions of overlapping expression (yellow pixels). Considerable overlap between prd and odd expression is observed at phase 2 but not at phase 3. Note that the prd expression pattern is the combined result of initially broad stripes of medium intensity, and intense two-cell wide 'P' stripes overlapping the posterior of each of the broad stripes (arrowheads in C’’’, D’’’). The two sets of stripes are mediated by separate stretches of DNA (Gutjahr et al., 1994), and must be regulated differently, since the 'P' stripes remain insensitive to ectopic Odd even during phase 3 (Saulier-Le Dréan et al., 1998; Goldstein et al., 2005). Scale bars = 50 μm.
Figure 6
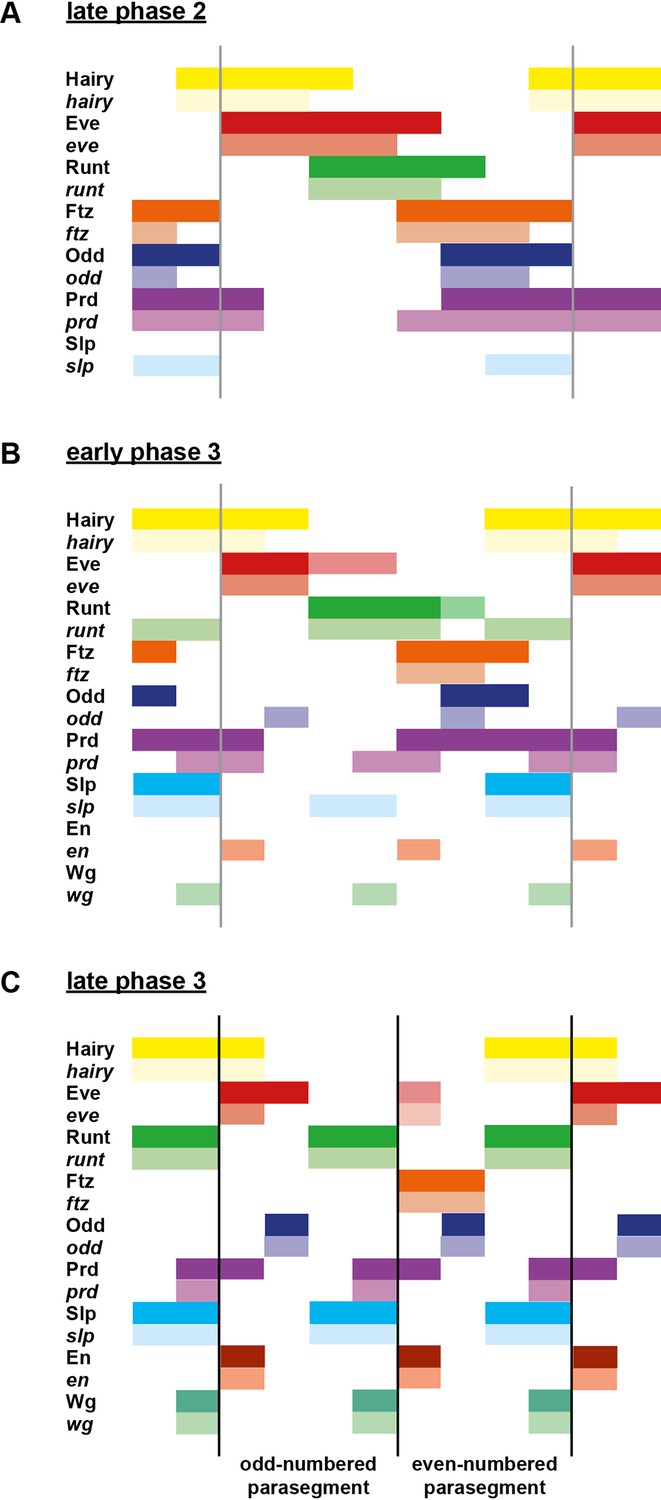
Schematic diagram of the transition to single-segment periodicity.
Schematic diagram showing segmentation gene expression at late phase 2 (A), early phase 3 (B) and late phase 3 (C). The horizontal axis represents an idealised portion of the AP axis (~12 nuclei across). The grey vertical lines in (A,B) demarcate a double parasegment repeat (~8 nuclei across), while black lines in (C) indicate future parasegment boundaries. The patterns of protein expression (intense colours) and transcript expression (paler colours) of the pair-rule genes are shown at each timepoint. Those of the segment-polarity genes en and wg are additionally shown at the later timepoints. Transcript distributions were inferred from our double in situ data, while pair-rule protein distributions were inferred mainly from triple antibody stains in the FlyEx database (Pisarev et al., 2009). Additional protein expression information for late phase 3 (equivalent to the onset of germband extension) was gathered from published descriptions (Frasch et al., 1987; DiNardo et al., 1985; van den Heuvel et al., 1989; Gutjahr et al., 1993; Lawrence and Johnston, 1989; Carroll et al., 1988). Fading expression of Eve and Runt is represented by lighter red and green sections in (B). The transient 'minor' stripes of Eve are represented by faint red in (C). Note that this diagram does not capture the graded nature of pair-rule protein distributions during cellularisation.
Figure 7 with 1 supplement
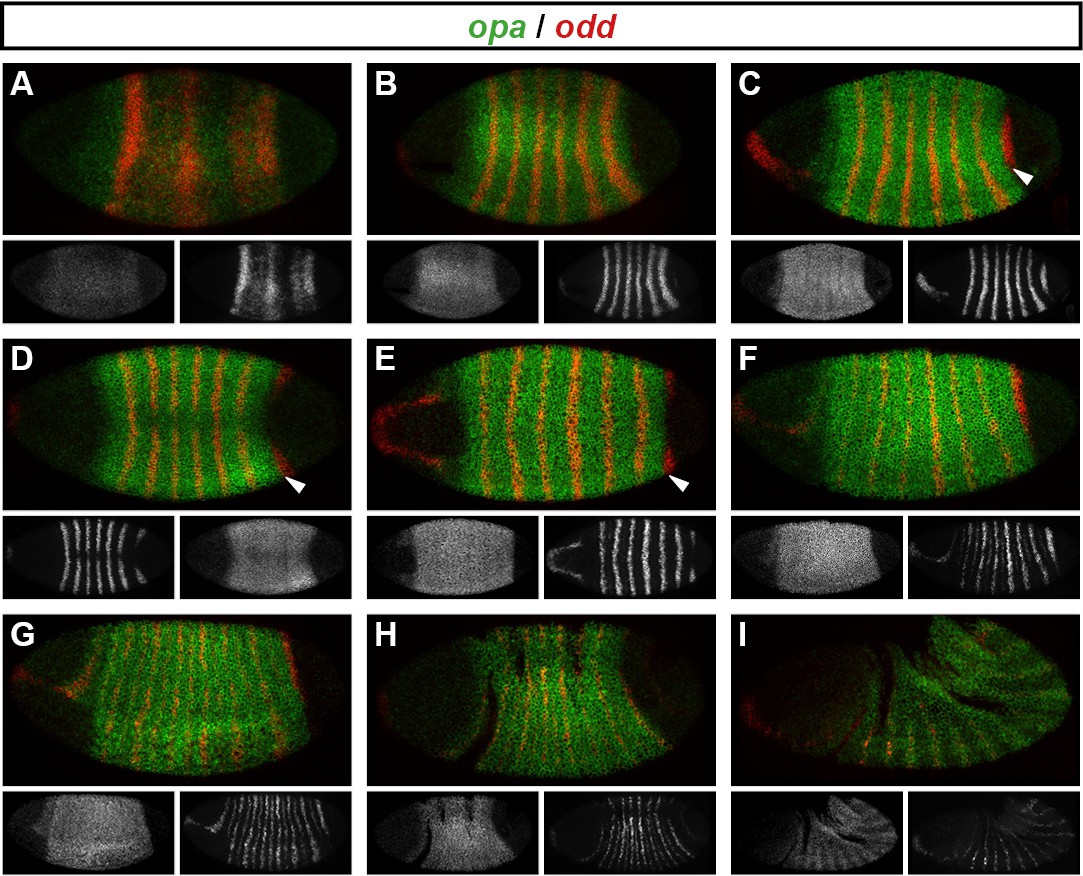
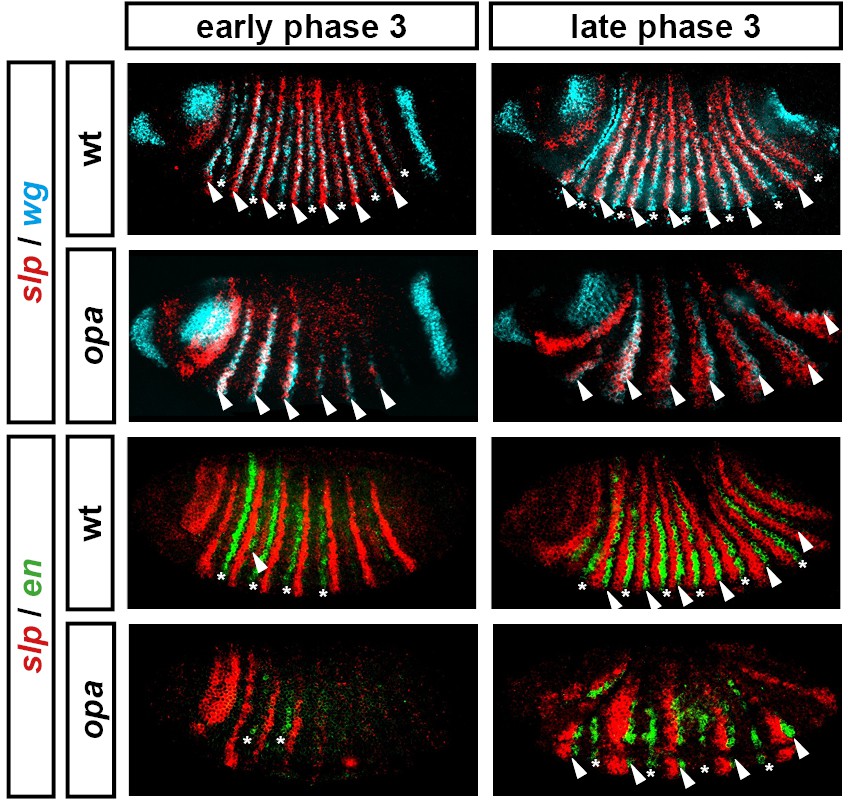
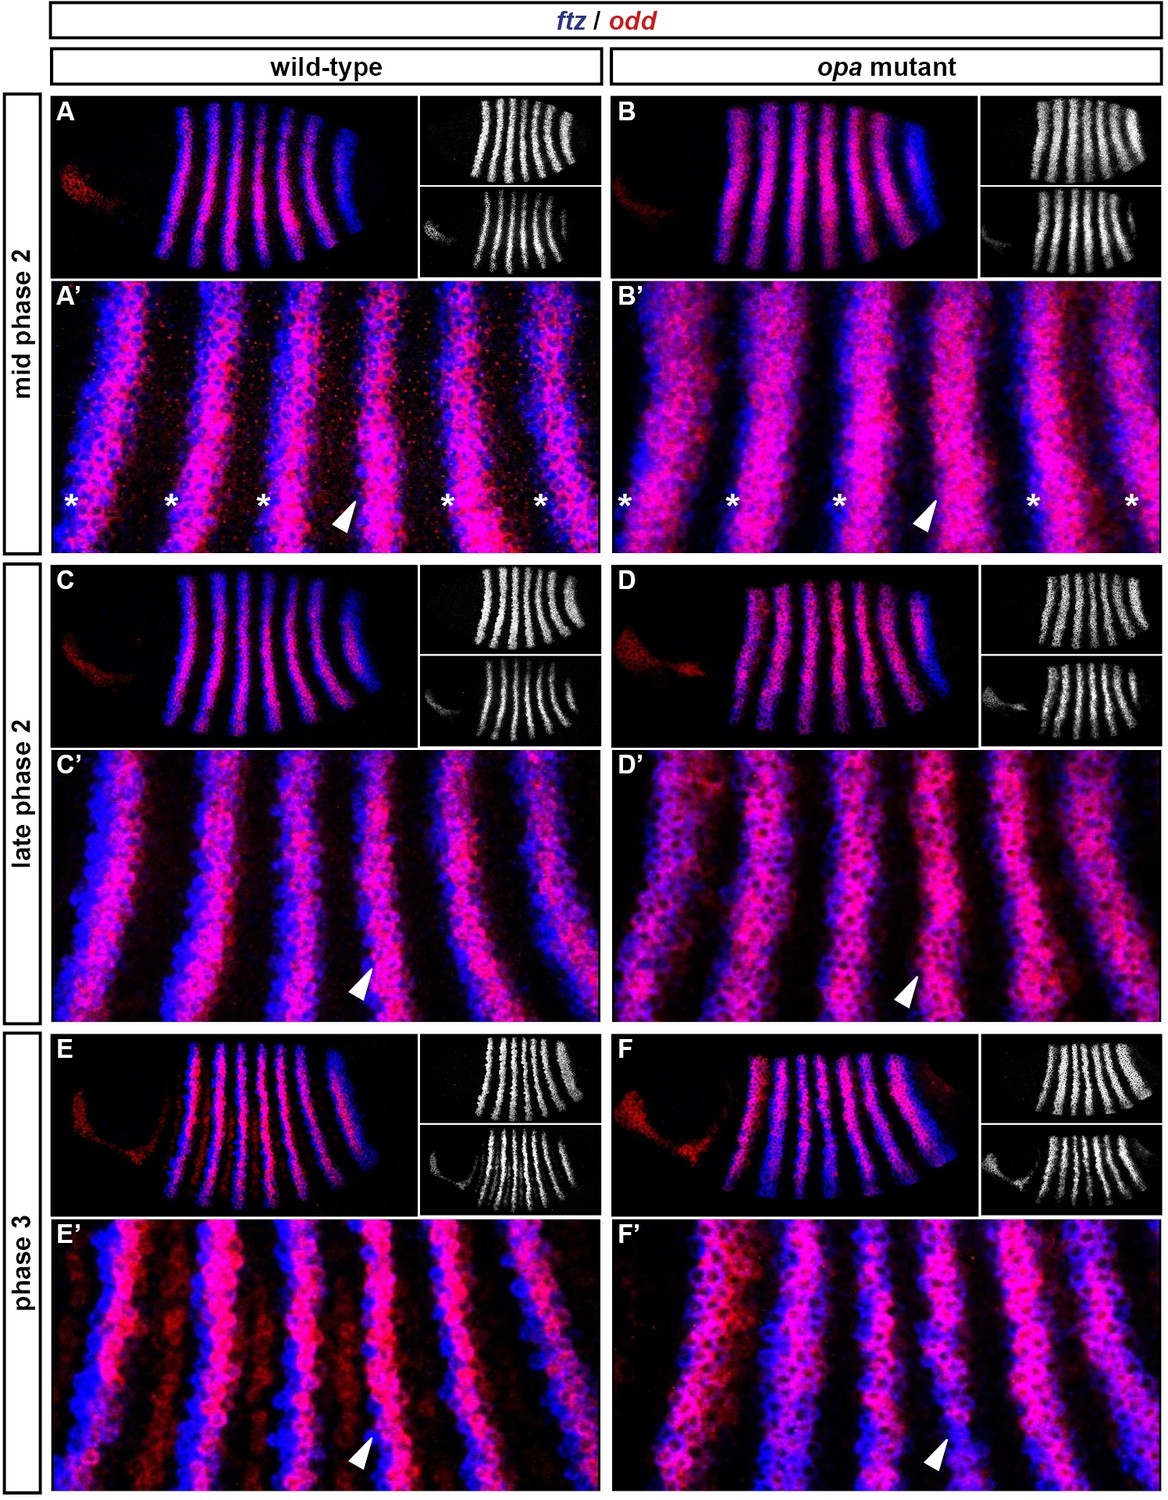
Spatiotemporal expression of opa relative to odd.
Expression of opa relative to odd from early cellularisation until mid germband extension. (A) phase 1, lateral view; (B) early phase 2; (C–E) late phase 2; (F) early phase 3; (G, H) gastrulation; (I) early germband extension. Anterior left; (A, B, C, F, I) lateral views; (D) dorsal view; (E) ventral view; (G) ventrolateral view; (H) dorsolateral view. Single-channel images are shown in greyscale below each double-channel image (opa on the left, odd on the right). Arrowheads in (C–E) point to the new appearance of odd stripe 7, which abuts the posterior boundary of the opa domain. Note that odd stripe 7 is incomplete both dorsally (D) and ventrally (E). By gastrulation, opa expression has posteriorly expanded to cover odd stripe 7 (G, H). opa expression becomes segmentally modulated during germband extension (I).
Figure 7—figure supplement 1

The cellular localisation of opa transcripts changes over the course of segmentation.
Relative expression of opa and ftz is shown in embryos at phase 1, phase 2 and phase 3. (A–C) Whole embryos, lateral view, anterior left, dorsal top. Single-channel images are shown in greyscale below each double-channel image (opa on the left, ftz on the right). (D–F) Blown-up regions from each of the embryos in (A–C). Panels with superscripts show individual channels from the double-channel images in (D–-F). opa transcript is largely nuclear during phase 1, and largely cytoplasmic during phase 3.
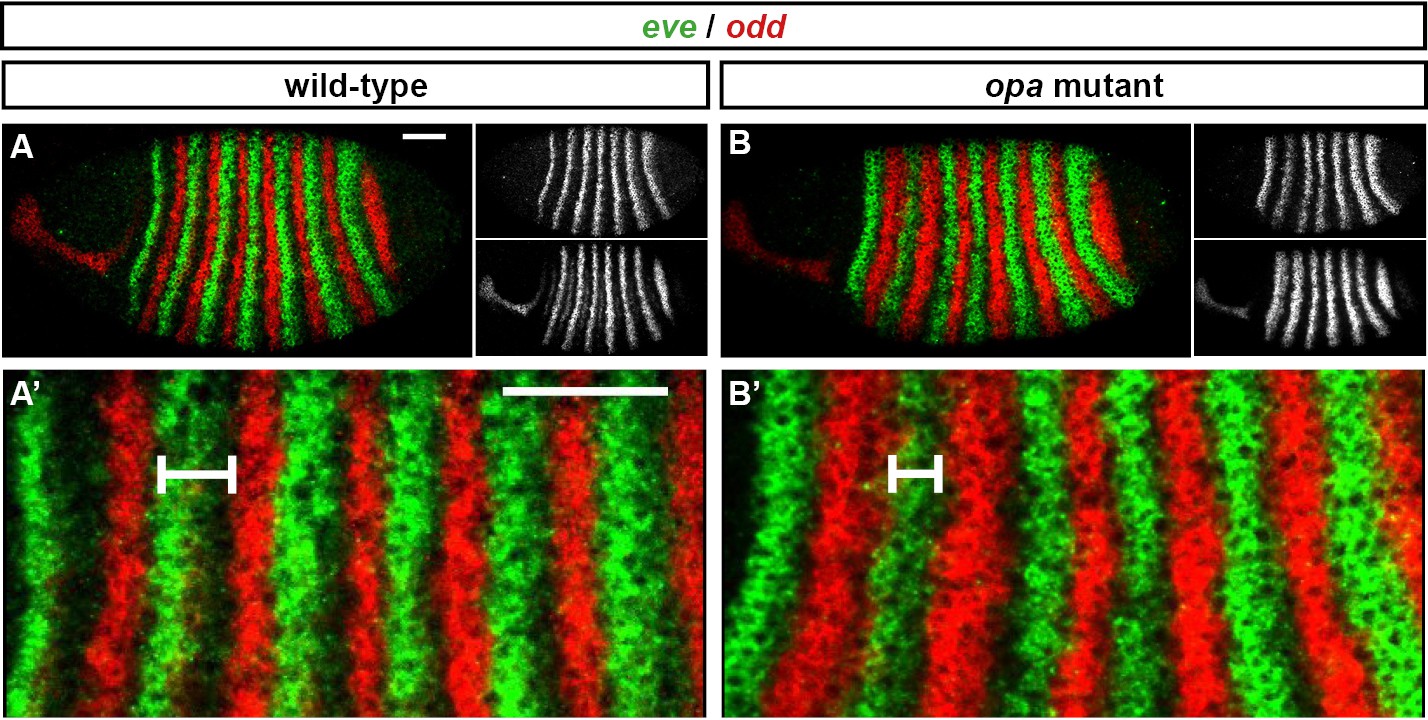
Figure 8 with 6 supplements
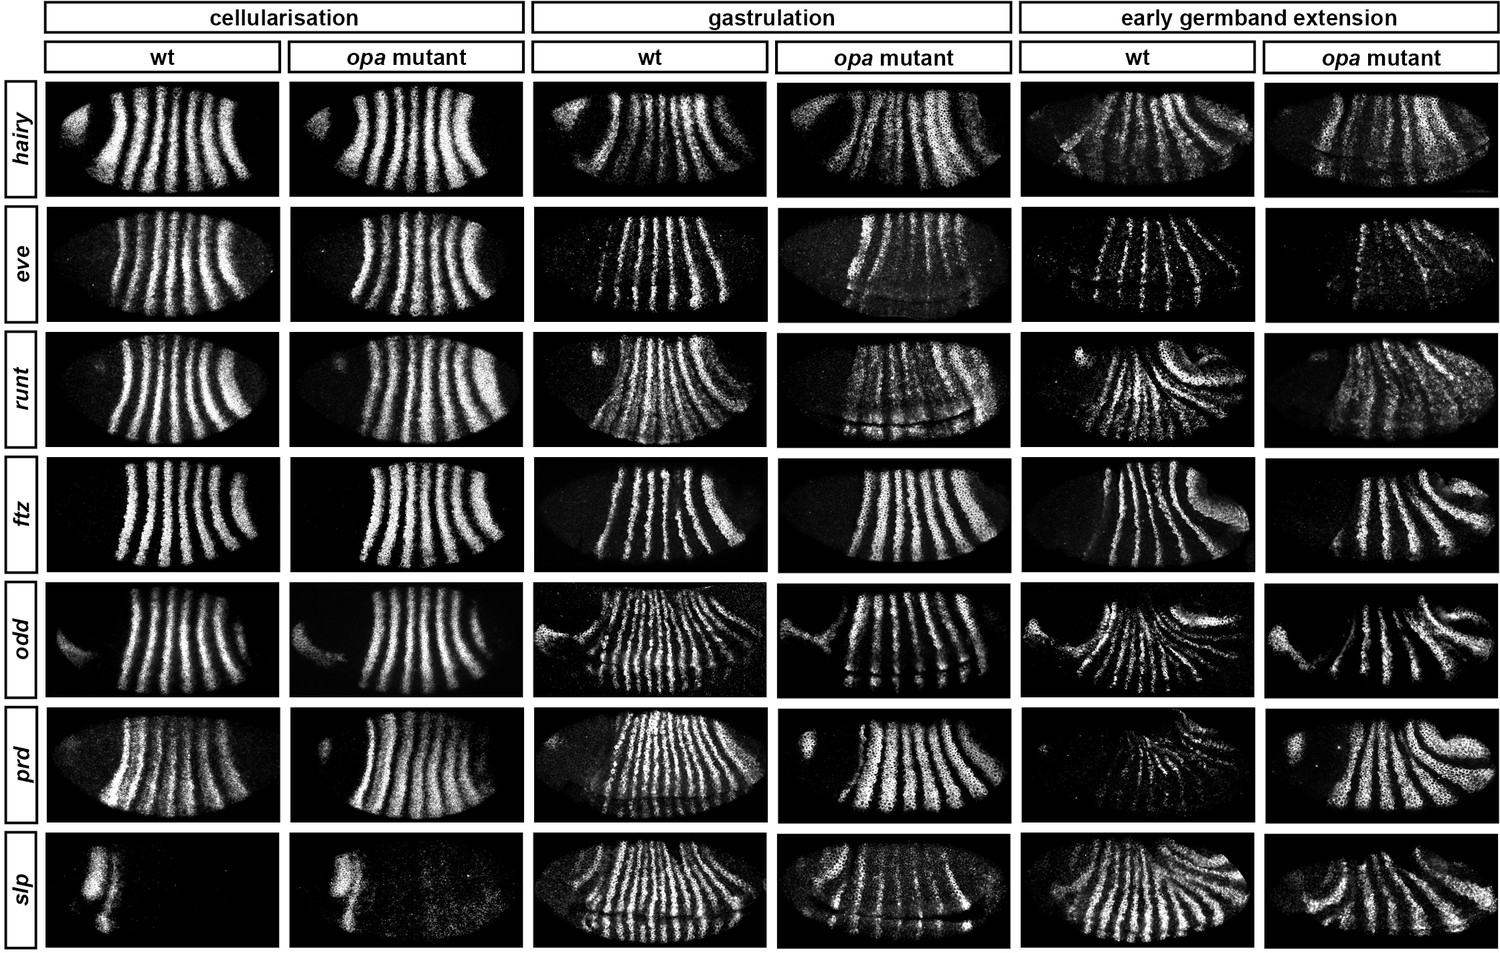
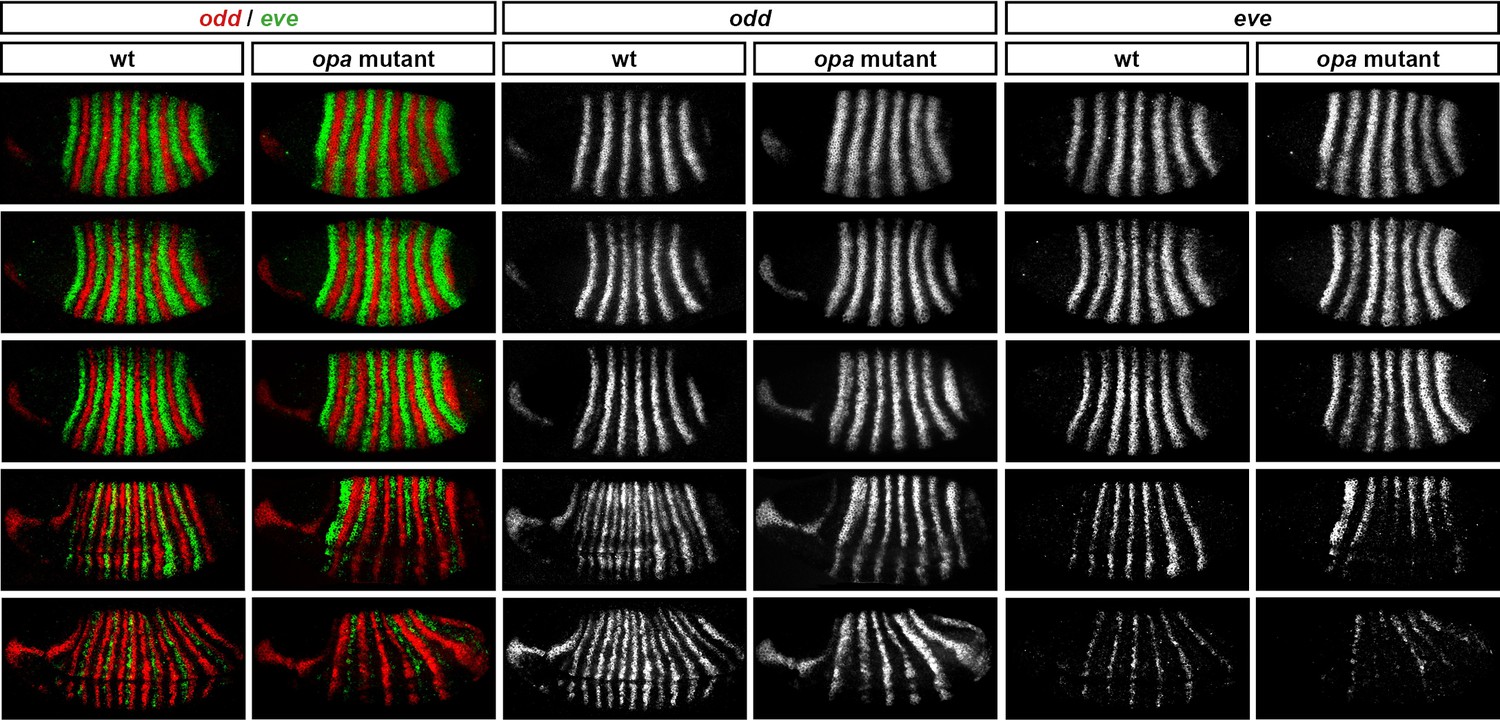
Pair-rule gene expression is perturbed from gastrulation onwards in opa mutant embryos.
Pair-rule gene expression in wild-type and opa mutant embryos at late cellularisation, late gastrulation, and early germband extension. During cellularisation, pair-rule gene expression in opa mutant embryos is very similar to wild-type. Expression from gastrulation onwards is severely abnormal; in particular, note that single-segment patterns do not emerge. All panels show a lateral view, anterior left, dorsal top.
Figure 8—figure supplement 1
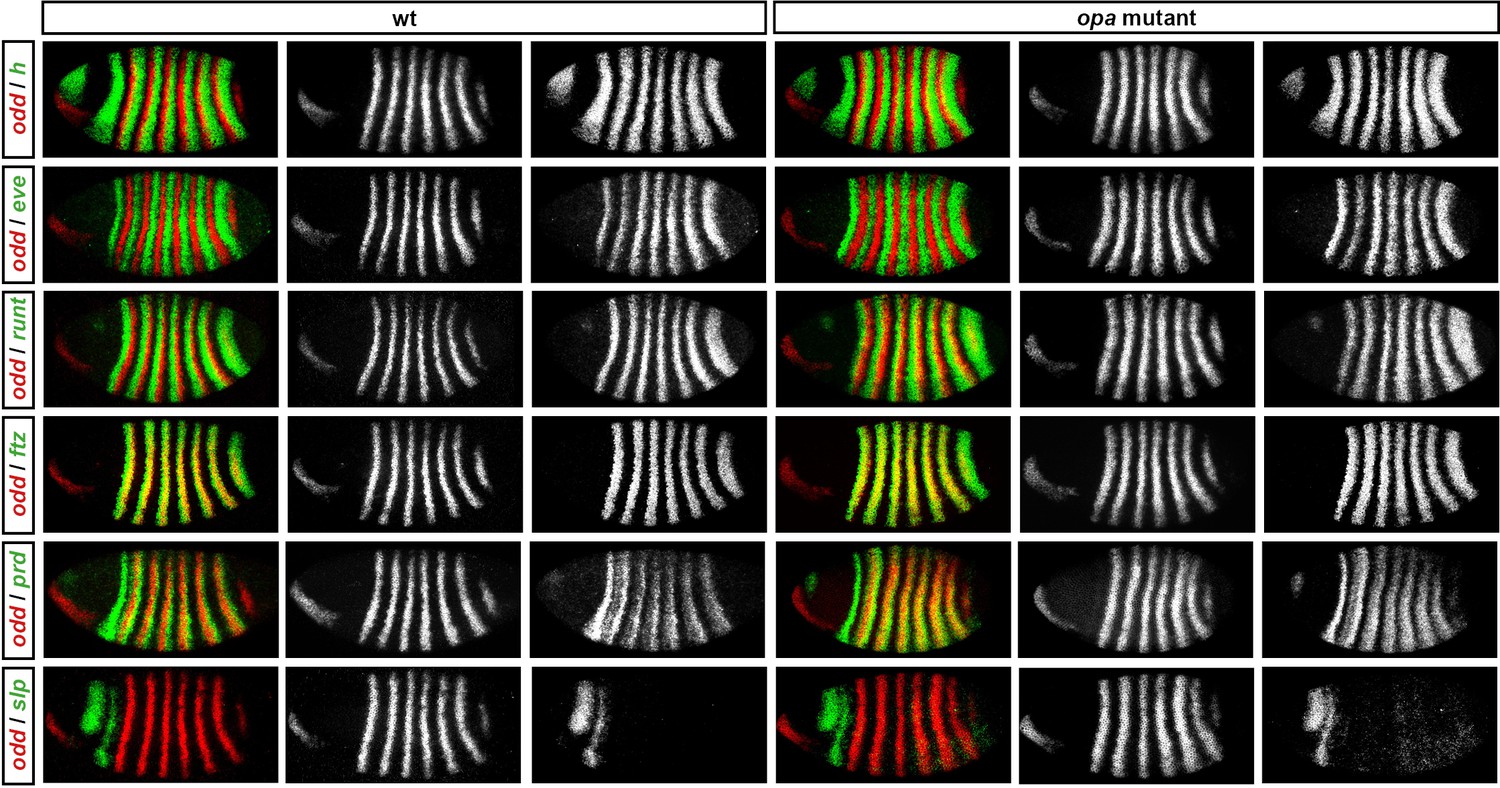
Pair-rule gene expression in opa mutant embryos at cellularisation.
Relative expression patterns of pair-rule genes in wild-type and opa mutant embryos at late cellularisation. All images are double in situs for odd and one other pair-rule gene. Individual channels are shown to the right of each double-channel image (odd on the left, other pair-rule genes on the right). All panels show a lateral view, anterior left, dorsal top.
Figure 8—figure supplement 2
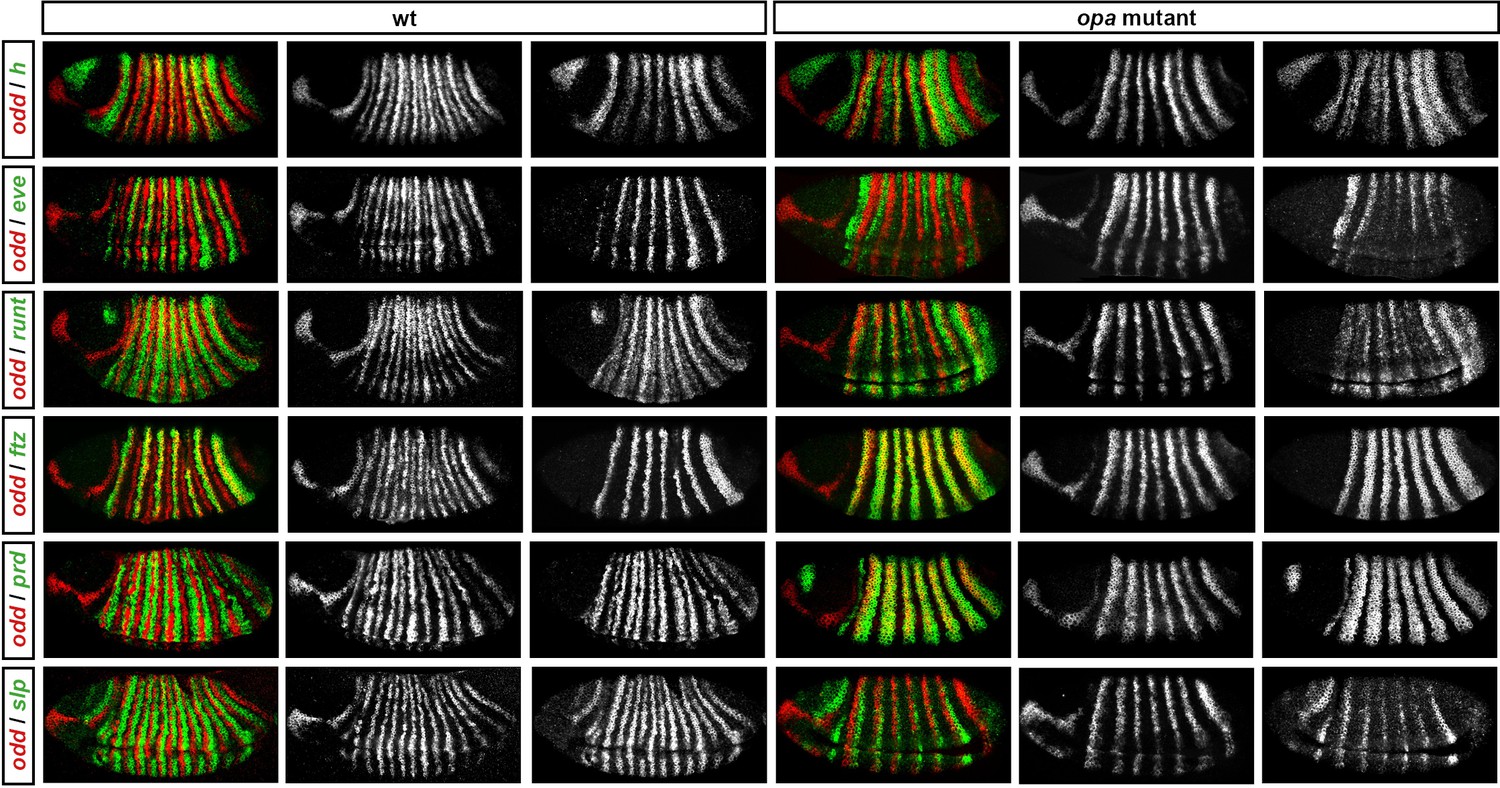
Pair-rule gene expression in opa mutant embryos at gastrulation.
Relative expression patterns of pair-rule genes in wild-type and opa mutant embryos at gastrulation. All images are double in situs for odd and one other pair-rule gene. Individual channels are shown to the right of each double-channel image (odd on the left, other pair-rule genes on the right). All panels show a lateral view, anterior left, dorsal top.
Figure 8—figure supplement 3
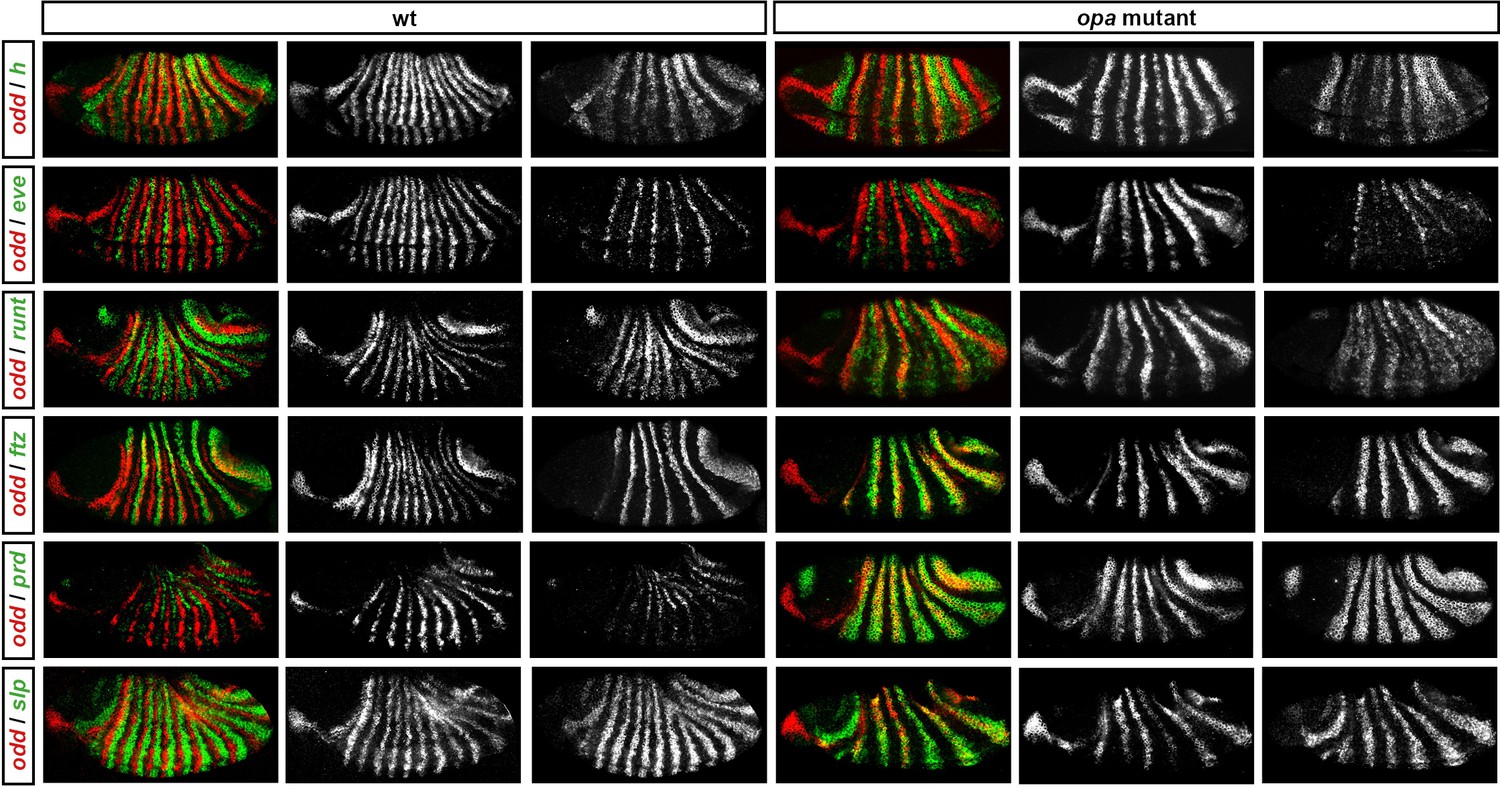
Pair-rule gene expression in opa mutant embryos at early germband extension.
Relative expression patterns of pair-rule genes in wild-type and opa mutant embryos at early germband extension. All images are double in situs for odd and one other pair-rule gene. Individual channels are shown to the right of each double-channel image (odd on the left, other pair-rule genes on the right). All panels show a lateral view, anterior left, dorsal top.
Figure 8—figure supplement 4
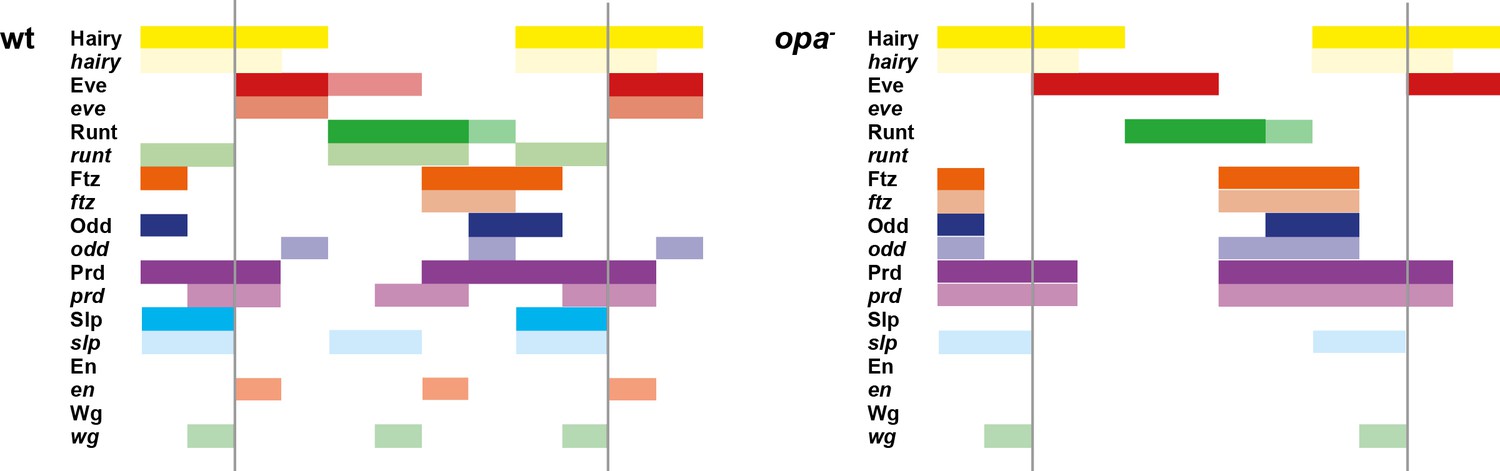
The transition to single-segment periodicity does not occur in opa mutant embryos.
Comparison of early phase 3 segmentation gene expression in wild-type and opa mutant embryos. The horizontal axis represents an idealised portion of the AP axis (~12 nuclei across). The grey vertical lines demarcate a double parasegment repeat (~8 nuclei across), of an odd- followed by an even-numbered parasegment (see Figure 6). The pattern of protein (intense colour) and transcript expression (paler colour) of the pair-rule genes, and the segment-polarity genes en and wg, are shown for each genotype. Wild-type patterns are the same as in Figure 6B. Transcript distributions for opa mutant embryos were inferred from our double in situ data, while protein distributions were extrapolated from transcript data. Fading expression of Eve and Runt is represented by lighter sections at the posterior of the stripes. In opa mutant embryos, expression of eve and runt fades prematurely, while the expression of odd, prd and slp remains double segmental. Only the even-numbered stripes of wg emerge, with en expression delayed until mid-germband extension (Benedyk et al., 1994; Figure 10). Stronger expression in the posterior of the Eve stripes in opa mutants is inferred from the observation that the eve stripes remain broad at a time when they would have already narrowed in wild-type (compare panels A and F in Appendix 2—figure 2, or see Figure 8—figure supplement 5). For simplicity, the low-level or residual expression of eve and runt observed in opa mutant embryos is not included in the schematic. See text for further details.
Figure 8—figure supplement 5
Opa activates the eve “'late' element.
eve and odd expression in wild-type and opa mutant embryos at various timepoints spanning mid-phase 2 (mid-cellularisation, top row) to late phase 3 (onset of germband extension, bottom row). In opa mutant embryos, eve stripes are initially expressed normally (row 1), but fail to narrow and refine at the end of cellularisation (row 3), and largely fade away at gastrulation (row 4). Residual eve expression persists in some stripes into germband extension (bottom row) in opa mutant embryos, particularly in ventral regions. Individual channels are shown to the right of the double-channel images. All panels show a lateral view, anterior left, dorsal top. Embryo morphology and the pattern of odd expression in the head were used for staging.
Figure 8—figure supplement 6
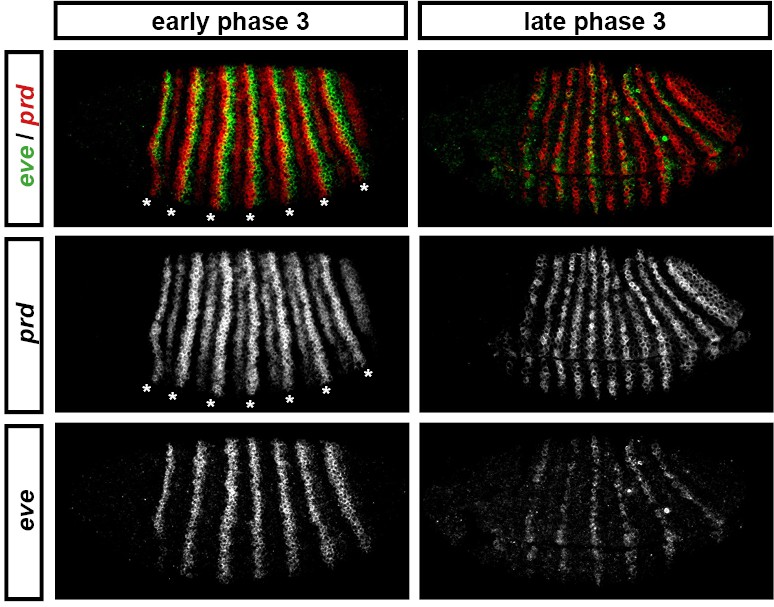
'Late' eve expression is observed in cells that do not express prd.
eve and prd expression in wild-type embryos during phase 3. During early phase 3 (left), eve is strongly expressed in stripes ~2 cells wide. These stripes only partially overlap with the 'P' stripes of prd expression (asterisks), meaning that the eve 'late' element is active in many cells that have never expressed prd. eve expression is largely lost from non-prd expressing cells by the end of gastrulation (late phase 3, right), indicating that Prd protein may nevertheless be required for the maintenance of eve late element expression. Individual channels are shown below each double-channel image. All panels show a lateral view, anterior left, dorsal top.
Figure 9
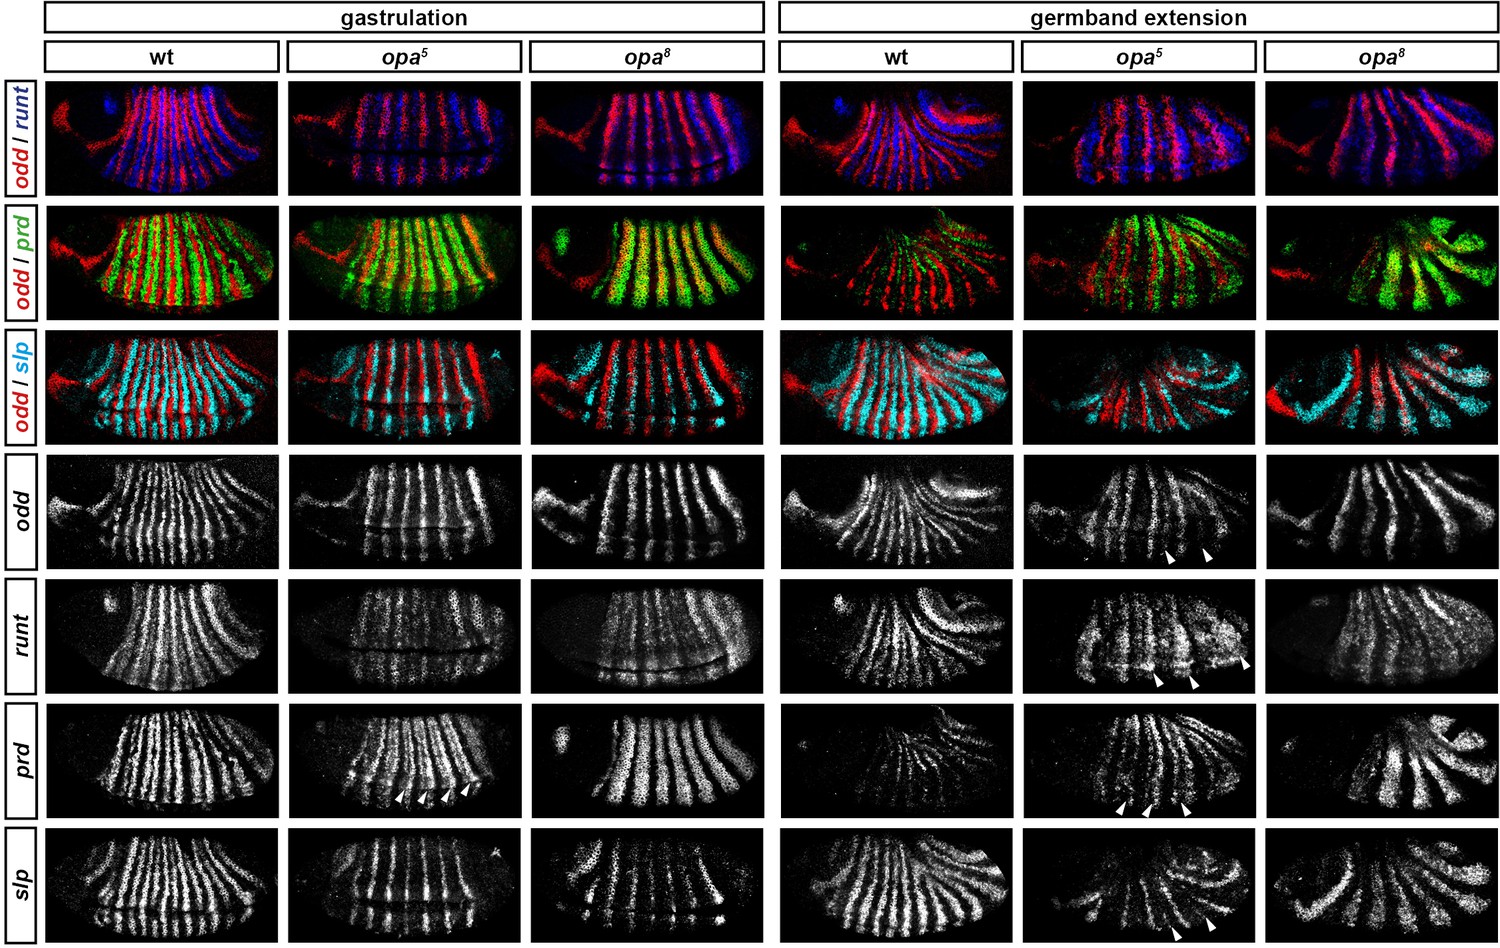
Opa-dependent expression pattern changes are delayed in opa hypomorphic embryos.
Expression of selected pair-rule genes compared between embryos wild-type, hypomorphic (opa5), or null mutant (opa8) for opa. Arrowheads mark evidence of Opa-dependent regulatory interactions in opa5 embryos (see text for details). All panels show a lateral view, anterior left, dorsal top.
Figure 10 with 1 supplement
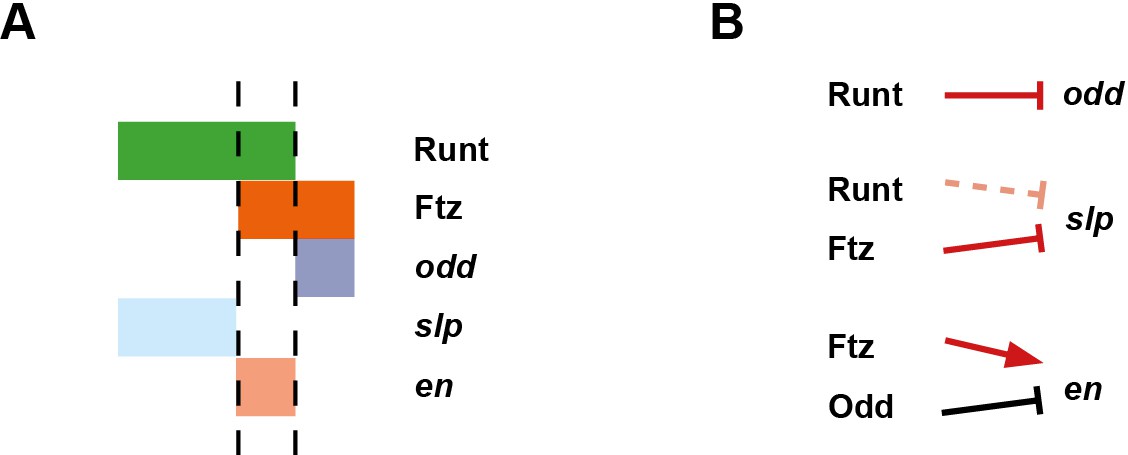
Model for the Opa-dependent patterning of the even-numbered parasegment boundaries.
(A) Schematic showing the phasing of odd, slp and en relative to Runt and Ftz protein at phase 3. The horizontal axis represents part of a typical double-segment pattern repeat along the AP axis of the embryo (~4 nuclei across, centred on an even-numbered parasegment boundary). (B) Inferred regulatory interactions governing the expression of odd, slp and en at phase 3. Regular arrows represent activatory interactions; hammerhead arrows represent repressive interactions. Solid arrows represent interactions that are currently in operation; pale dashed arrows represent those that are not. Red arrows represent interactions that depend on the presence of Opa protein. Overlapping domains of Runt and Ftz expression (A) subdivide this region of the AP axis into three sections (black dashed lines). Opa-dependent repression restricts odd expression to the posterior section, resulting in offset anterior boundaries of Ftz and Odd activity (Appendix 2—figure 1; Appendix 2—figure 1—figure supplement 2). slp expression is restricted to the anterior section by the combination of Opa-dependent repression from Ftz and Opa-dependent de-repression from Runt (Appendix 1—figure 2—figure supplement 1). en is restricted to the central section by the combination of activation from Ftz (likely partially dependent on Opa), and repression by Odd. Later, mutual repression between odd, slp and en will maintain these distinct cell states. The even-numbered parasegment boundaries will form between the en and slp domains. Note that, in this model, Eve has no direct role in patterning these boundaries.
Figure 10—figure supplement 1
Segment-polarity gene expression in opa mutant embryos.
Development of segment-polarity gene expression in wild-type and opa mutant embryos. Arrowheads marks segment-polarity stripes that normally contribute to odd-numbered parasegment boundaries (even-numbered wg stripes, and odd-numbered en stripes, respectively). Asterisks mark segment-polarity stripes that normally contribute to even-numbered parasegment boundaries (odd-numbered wg stripes and even-numbered en stripes, respectively). (Note that wg stripes are traditionally numbered from 0). In opa mutant embryos, odd-numbered wg stripes never emerge, while even-numbered en stripes do emerge, but are not maintained. In contrast, even-numbered wg stripes emerge fairly normally, while odd-numbered en stripes are delayed initially, but later recover. All panels show a lateral view, anterior left, dorsal top. See text for details.
Appendix 1—figure 1 with 1 supplement
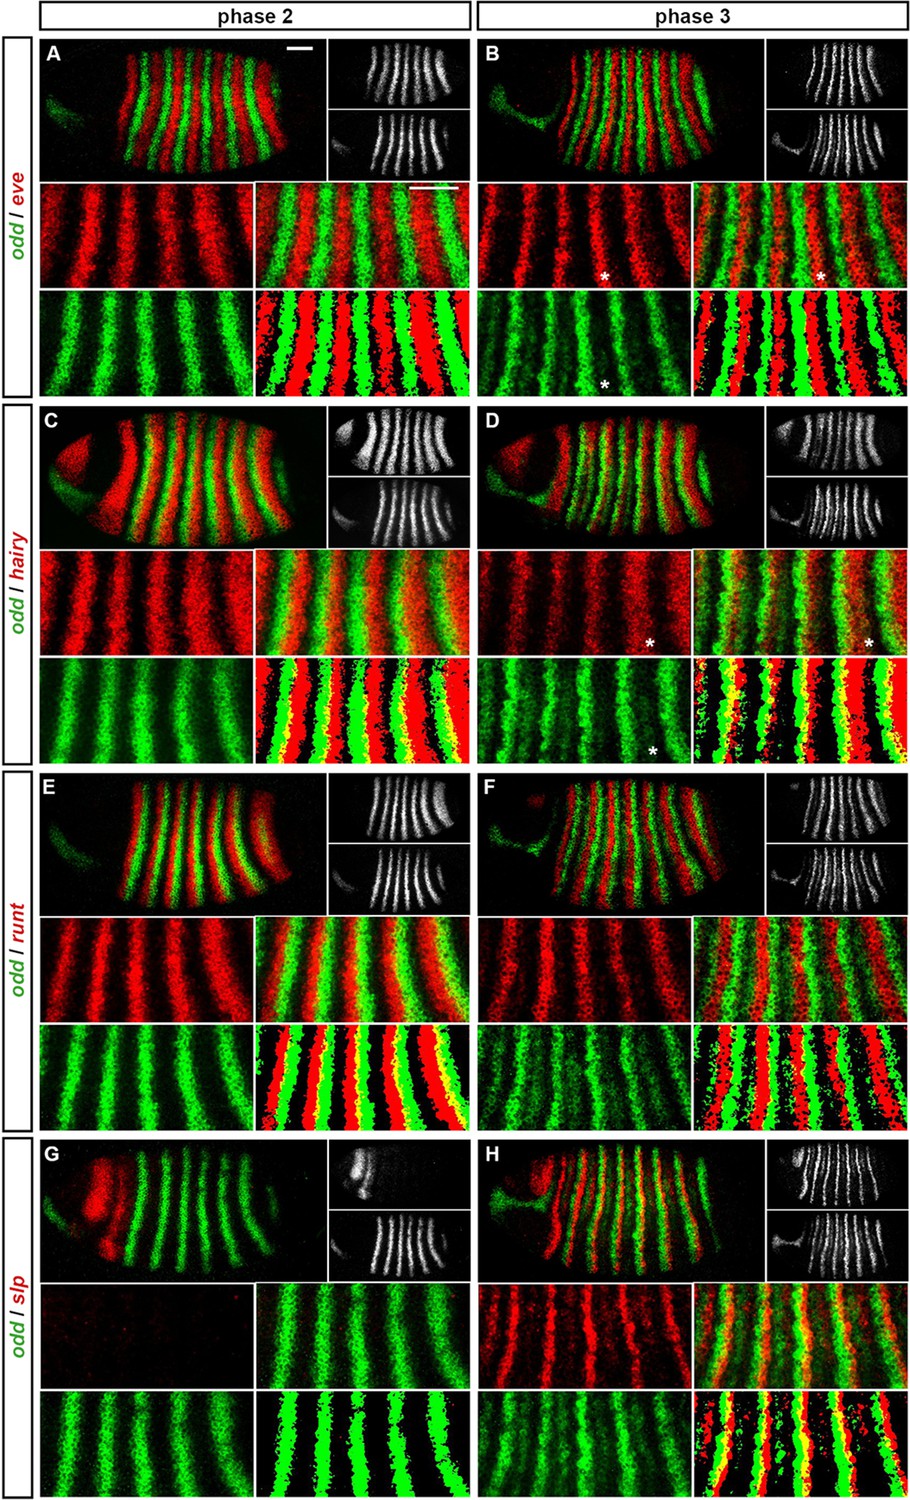
Expression of odd at phase 2 versus phase 3.
Relative expression of odd and other pair-rule genes (A, B – eve; C, D – hairy; E, F – runt; G, H - slp) is shown in late phase 2 embryos (A, C, E, G) and in early phase 3 embryos (B, D, F, H). Individual channels are shown to the right of each whole embryo double channel image (odd bottom, other gene top). Other panels show blow-ups of expression in stripes 2–6 (individual channels, double channel image, and thresholded double channel image). odd expression is always shown in green. odd expression overlaps with eve and hairy at phase 3 (e.g. asterisks marking nascent secondary stripe expression in B, D) but not at phase 2 (A, C). odd expression overlaps with runt at phase 2 (E) but not phase 3 (F). slp expression is absent for most of phase 2 (G) and is responsible for posterior narrowing of odd primary stripes at phase 3 (H). Scale bars = 50 μm. See text for details.
Appendix 1—figure 1—figure supplement 1
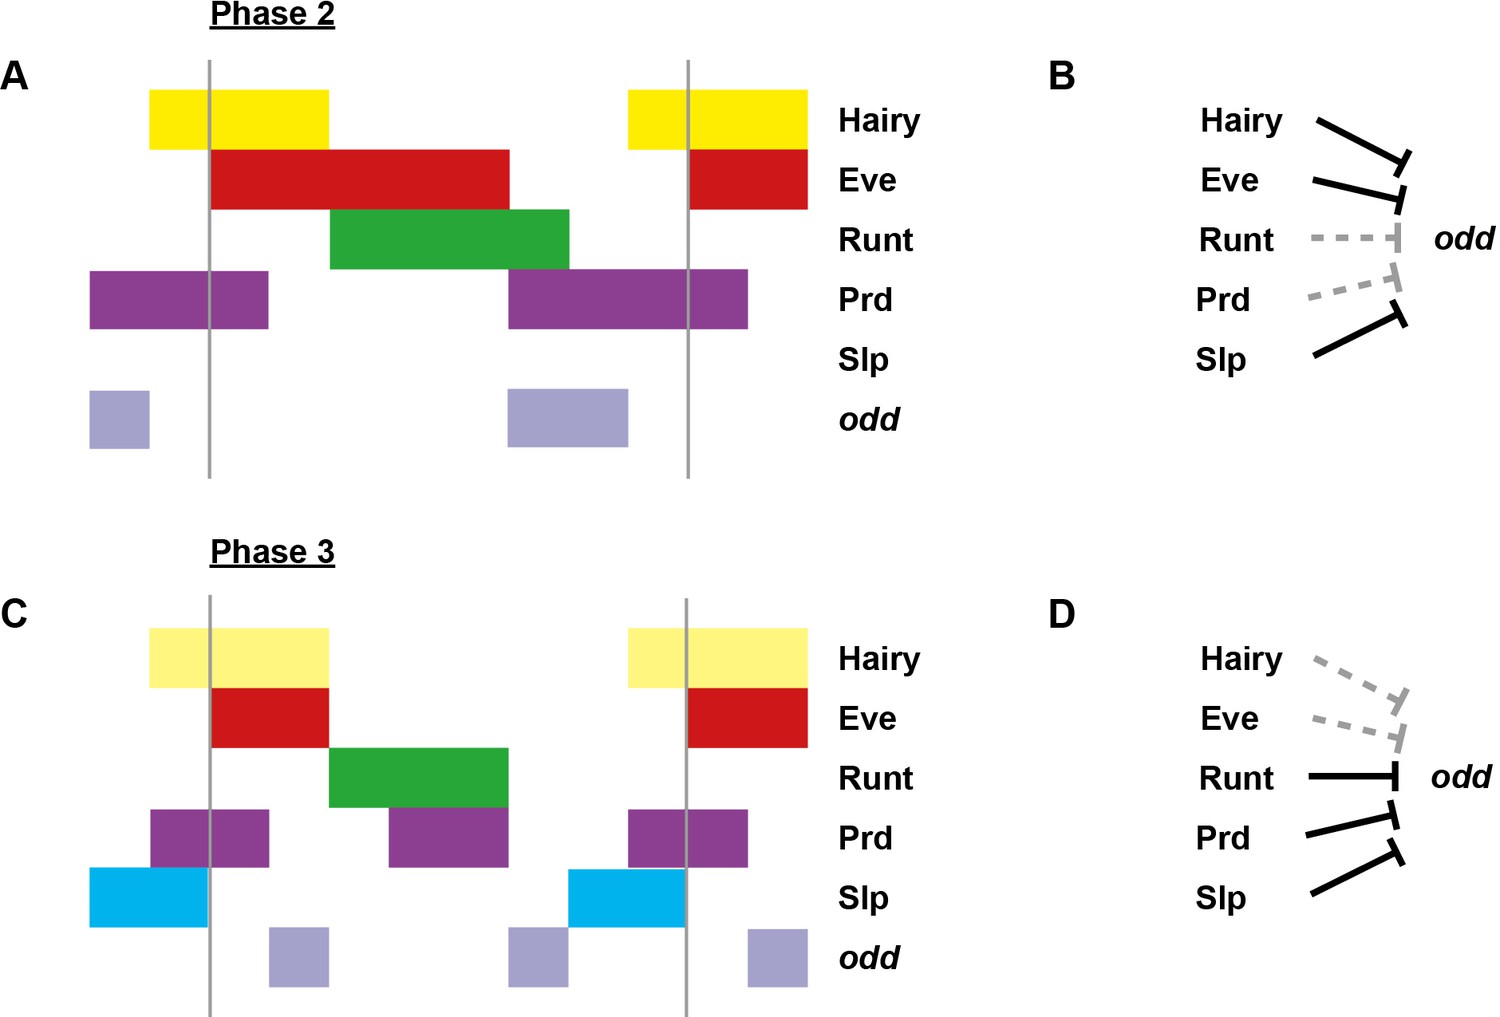
Model for the regulation of odd transcription at phase 2 versus phase 3.
Model for the differential regulation of odd expression by pair-rule proteins at late phase 2 (A, B) versus mid phase 3 (C, D). (A, C) Schematic diagrams showing the expression of odd relative to potential regulators. The horizontal axis represents an idealised portion of the AP axis (~12 nuclei across). The grey vertical lines demarcate a double parasegment repeat (~8 nuclei across). Lighter yellow in (C) represents fading Hairy expression. (B, D) Inferred regulatory interactions. Hammerhead arrows represent repressive interactions. Solid black arrows represent interactions that are currently in operation; dashed grey arrows represent those that are not. At each stage, odd is expressed only where its current repressors are absent. See Figure 5 and Appendix 1—figure 1 for staged relative expression data. Note that the expression patterns of potential regulators diagrammed in this figure represent protein distributions, which often differ slightly from transcript distributions due to time delays inherent in protein synthesis and decay (see Figure 6).
Appendix 1—figure 2 with 2 supplements

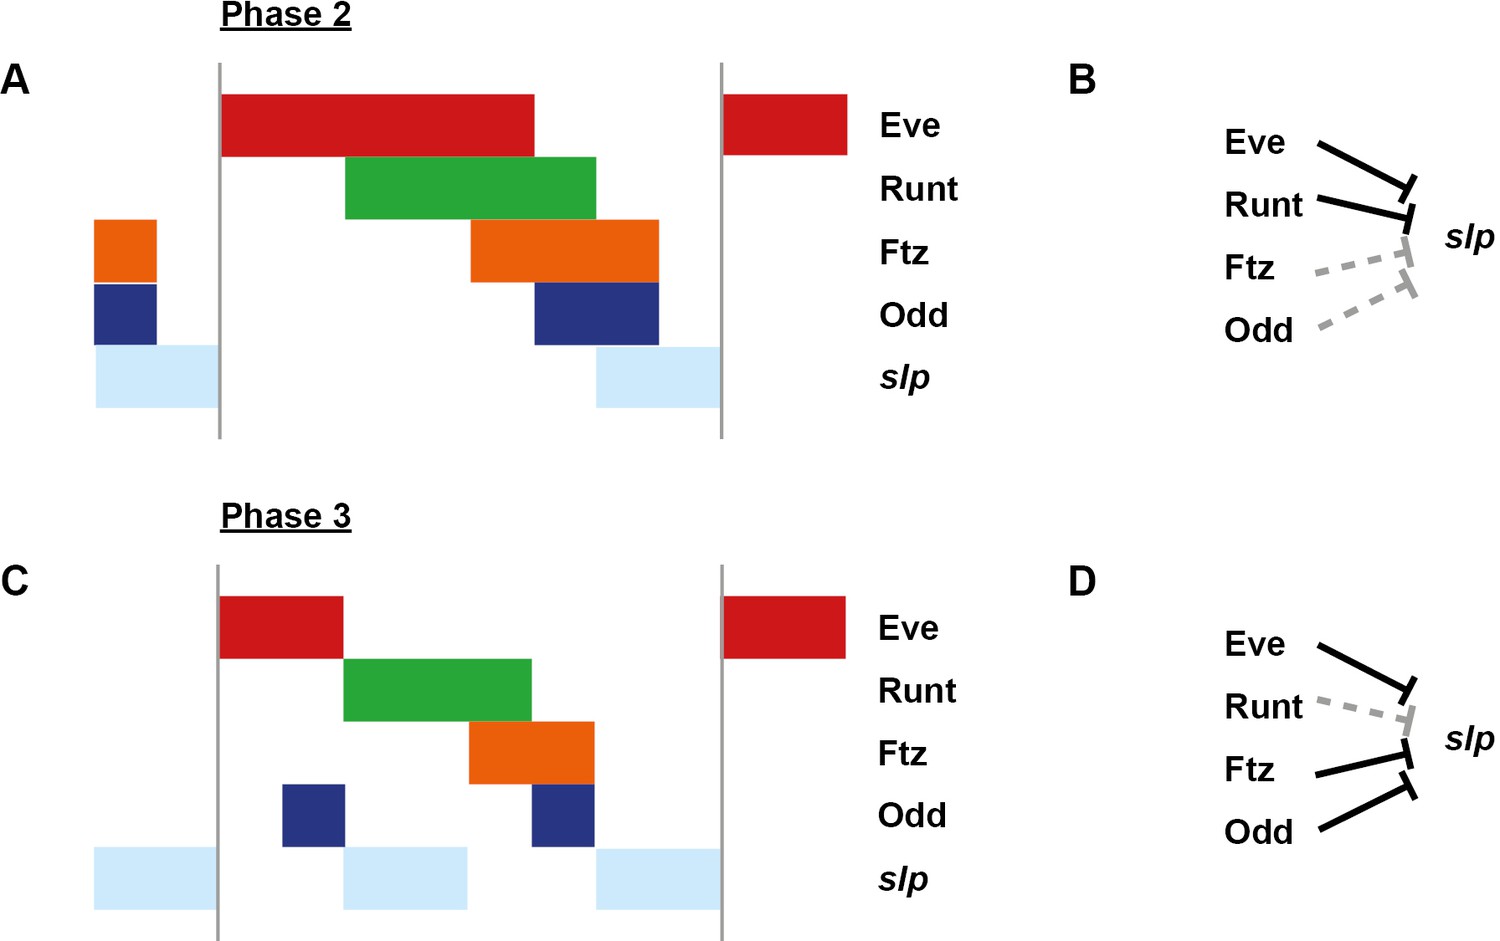
Expression of slp at phase 2 versus phase 3.
Relative expression of slp and other pair-rule genes (A, B – eve; C, D – runt; E, F – ftz; G, H - odd) is shown in late phase 2 embryos (A, C, E, G) and in early phase 3 embryos (B, D, F, H). Individual channels are shown to the right of each whole embryo double channel image (slp bottom, other gene top). Other panels show blow-ups of expression in stripes 2–6 (individual channels, double channel image, and thresholded double channel image). slp expression is always shown in green. slp expression overlaps with runt at phase 3 (D) but not at phase 2 (C). slp expression overlaps with ftz and odd at phase 2 (E, G) but not phase 3 (F, H). slp expression never overlaps with eve (A, B). Arrowheads in (D) indicate cells where slp secondary stripe expression does not coincide with runt expression. Scale bars = 50 μm. See text for details.
Appendix 1—figure 2—figure supplement 1
Model for the regulation of slp transcription at phase 2 versus phase 3.
Model for the differential regulation of slp expression by pair-rule proteins at late phase 2 (A, B) versus mid phase 3 (C, D). (A, C) Schematic diagrams showing the expression of slp relative to potential regulators. The horizontal axis represents an idealised portion of the AP axis (~12 nuclei across). The grey vertical lines demarcate a double parasegment repeat (~8 nuclei across). (B, D) Inferred regulatory interactions. Hammerhead arrows represent repressive interactions. Solid black arrows represent interactions that are currently in operation; dashed grey arrows represent those that are not. At each stage, slp is expressed only where its current repressors are absent. See Appendix 1—figure 2 for staged relative expression data. Note that the expression patterns of potential regulators diagrammed in this figure represent protein distributions, which often differ slightly from transcript distributions due to time delays inherent in protein synthesis and decay (see Figure 6).
Appendix 1—figure 2—figure supplement 2
Runt represses slp during phase 2 in both wild-type and ftz mutant embryos.
Relative expression of runt and slp in wild-type and ftz mutant embryos. In both cases, co-expression of runt and slp is not seen until phase 3. Individual channels are shown to the right of each double-channel image. All panels show a lateral view, anterior left, dorsal top.
Appendix 1—figure 3 with 1 supplement

Expression of runt at phase 2 versus phase 3.
Relative expression of runt and other pair-rule genes (A, B – hairy; C, D – odd; E, F – eve; G, H - ftz) is shown in late phase 2 embryos (A, C, E, G) and in early phase 3 embryos (B, D, F, H). Individual channels are shown to the right of each whole embryo double channel image (runt bottom, other gene top). Other panels show blow-ups of expression in stripes 2–6 (individual channels, double channel image, and thresholded double channel image). runt expression is always shown in green. runt primary stripes are out of phase with hairy (A) but runt secondary stripes (asterisks in B) emerge within domains of hairy expression. runt expression overlaps with odd and eve at phase 2 (C, E) but not phase 3 (D, F). runt expression overlaps with ftz at both phase 2 and phase 3 (G, H). Arrowheads in (A) point to clear gaps between the posterior boundaries of the runt stripes and the anterior boundaries of the hairy stripes. Scale bars = 50 μm. See text for details.
Appendix 1—figure 3—figure supplement 1
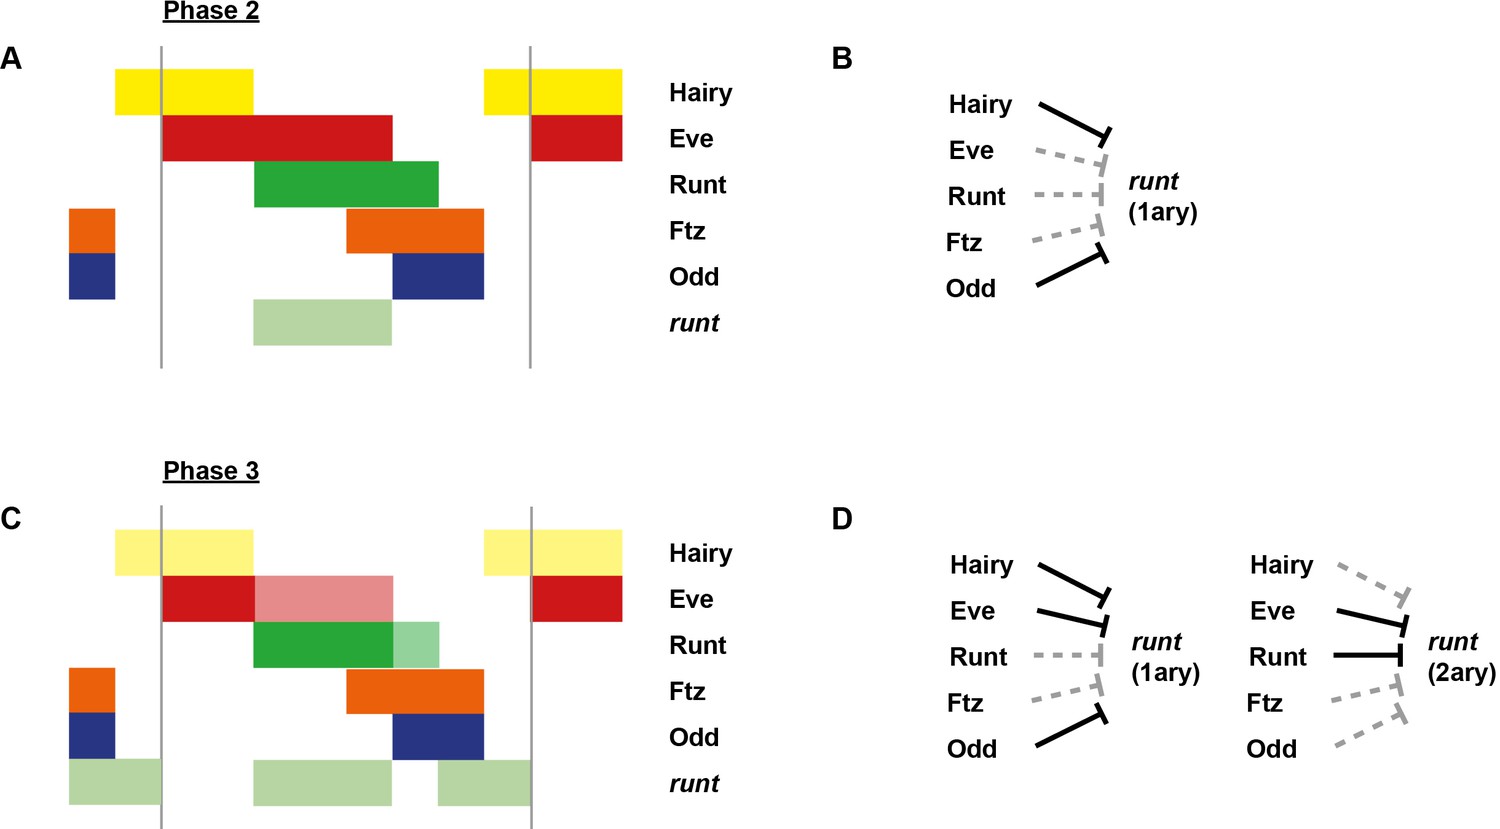
Model for the regulation of runt transcription at phase 2 versus phase 3.
Model for the differential regulation of runt expression by pair-rule proteins at late phase 2 (A, B) versus early phase 3 (C, D). (A, C) Schematic diagrams showing the expression of runt relative to potential regulators. The horizontal axis represents an idealised portion of the AP axis (~12 nuclei across). The grey vertical lines demarcate a double parasegment repeat (~8 nuclei across). Lighter red and green sections in (C) represent fading Eve and Runt protein. (B, D) Inferred regulatory interactions. Separate regulatory logic is shown for the expression of the primary (1ary) stripes and the secondary (2ary) stripes, because they are driven by separate enhancers (see text for details). Hammerhead arrows represent repressive interactions. Solid black arrows represent interactions that are currently in operation; dashed grey arrows represent those that are not. At each stage, runt is expressed only where its current repressors are absent. See Appendix 1—figure 3 for staged relative expression data. Note that the expression patterns of potential regulators diagrammed in this figure represent protein distributions, which often differ slightly from transcript distributions due to time delays inherent in protein synthesis and decay (see Figure 6).
Appendix 2—figure 1 with 2 supplements
The ftz/odd anterior boundary offsets are lost in opa mutant embryos at gastrulation.
Relative expression of ftz and odd in wild-type and opa mutant embryos. (A–D) Whole embryos, anterior left; (A–C) show lateral views, (D) shows a ventral view. Single channels are shown to the right of each double channel image (ftz top, odd bottom). (A’–D’) Blow-ups of stripes 1–6. Arrowheads point to stripe 4, for which neither ftz nor odd possesses a stripe-specific element. Asterisks in (A’, B’) indicate early ftz/odd offsets in stripes where ftz expression is partially driven by stripe-specific elements. Scale bars = 50 μm.
Appendix 2—figure 1—figure supplement 1
The odd primary stripes expand anteriorly in opa mutant embryos.
Relative expression of eve and odd at early phase 3 in wild-type and opa mutant embryos. (A, B) Whole embryos, lateral view, anterior left, dorsal top. Individual channels are shown to the right of the double channel image (eve top, odd bottom). (A’, B’) Blow ups of stripe 1–6. The distance between the anterior border of eve stripe 2 and the anterior border of odd stripe 2 is indicated for both embryos. Scale bars = 50 μm.
Appendix 2—figure 1—figure supplement 2
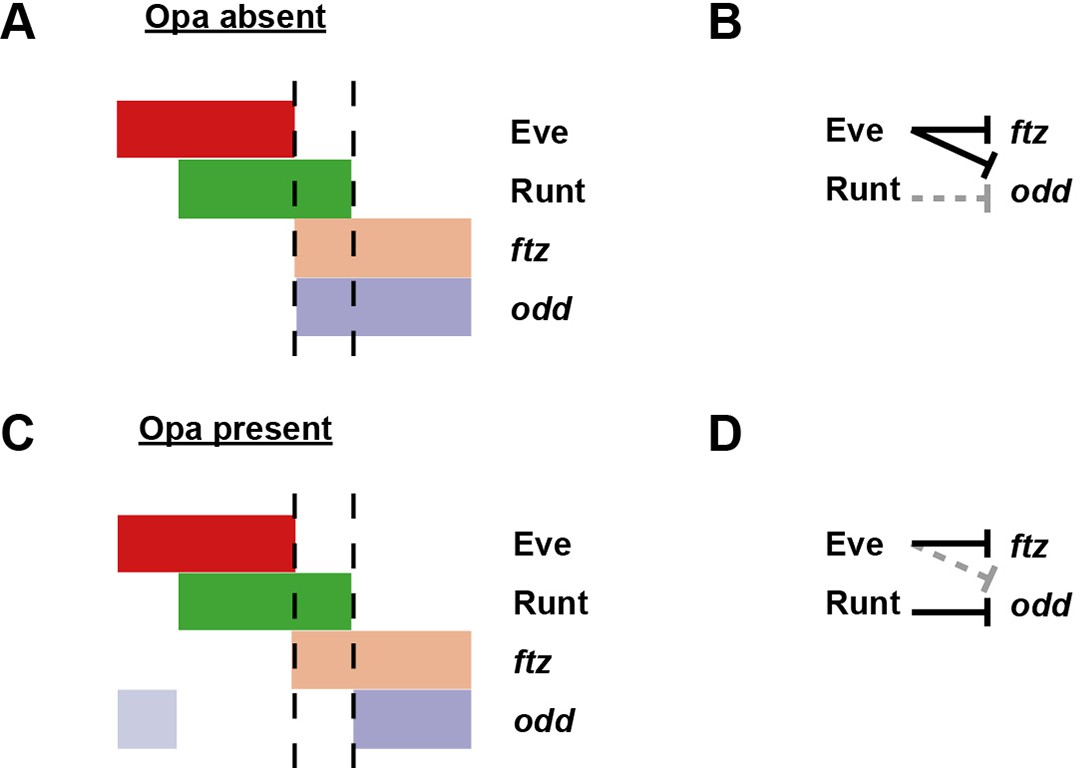
Model for the patterning of the anterior boundaries of ftz and odd.
Model for the regulation of ftz and odd expression by Eve and Runt, in both the absence (A, B) and the presence (C, D) of Opa protein. (A, C) Schematic diagrams showing the expression of ftz and odd relative to Eve and Runt protein. The horizontal axis represents part of a typical double-segment pattern repeat along the AP axis of the embryo. In both scenarios, the posterior boundary of Runt expression is shifted posteriorly relative to that of Eve (dashed lines). (B, D) Inferred regulatory interactions. Hammerhead arrows represent repressive interactions. Solid black arrows represent interactions that are currently in operation; dashed grey arrows represent those that are not. (A, B) Eve represses both ftz and odd, while Runt represses neither. The anterior boundary of both ftz and odd is therefore positioned by the posterior boundary of Eve. (C, D) Eve represses ftz, while Runt represses odd. The anterior boundary of ftz expression is therefore set by the posterior boundary of Eve, while the anterior boundary of odd is positioned by the posterior boundary of Runt. A secondary stripe of odd (pale blue) appears within the Eve domain.
Appendix 2—figure 2 with 3 supplements
odd stripe 7 expands anteriorly and ventrally in opa mutants.
Expression of odd relative to that of eve, runt and prd, in wild-type and opa mutant embryos. (A–J) Whole embryos, individual channels shown below each double channel image (odd right). (A, F) Late phase 2; (B–E, G–J) early phase 3. (A’–J’) Blow-ups of stripe 7 region (images rotated so that stripes appear vertical). (A’–C’, F’–H’) The anterior boundary of odd stripe 7 remains correlated with the posterior boundary of eve stripe 7 during phase 3 in opa mutant embryos, but not in wild-type. Asterisks in (A–C) indicate regions free of both eve and odd expression. Note that in opa mutant embryos, the eve stripes gradually fade away, while in wild-type they narrow from the posterior but remain strongly expressed. (D’, I’) odd stripe 7 expands anteriorly relative to runt stripe 7 in opa mutant embryos. In wild-type embryos, odd expression does not overlap with runt expression after the posterior half of runt stripe 7 becomes repressed (D’). In opa mutant embryos, the anterior border of odd stripe 7 overlaps with runt expression (purple regions in I’). Arrowhead points to a conspicuous region of odd/runt co-expression. (E’, J’) odd stripe 7 expands anteriorly relative to prd expression in opa mutant embryos. Arrowhead in (E’) points to prd expression anterior to odd stripe 7. Scale bars = 50 μm.
Appendix 2—figure 2—figure supplement 1
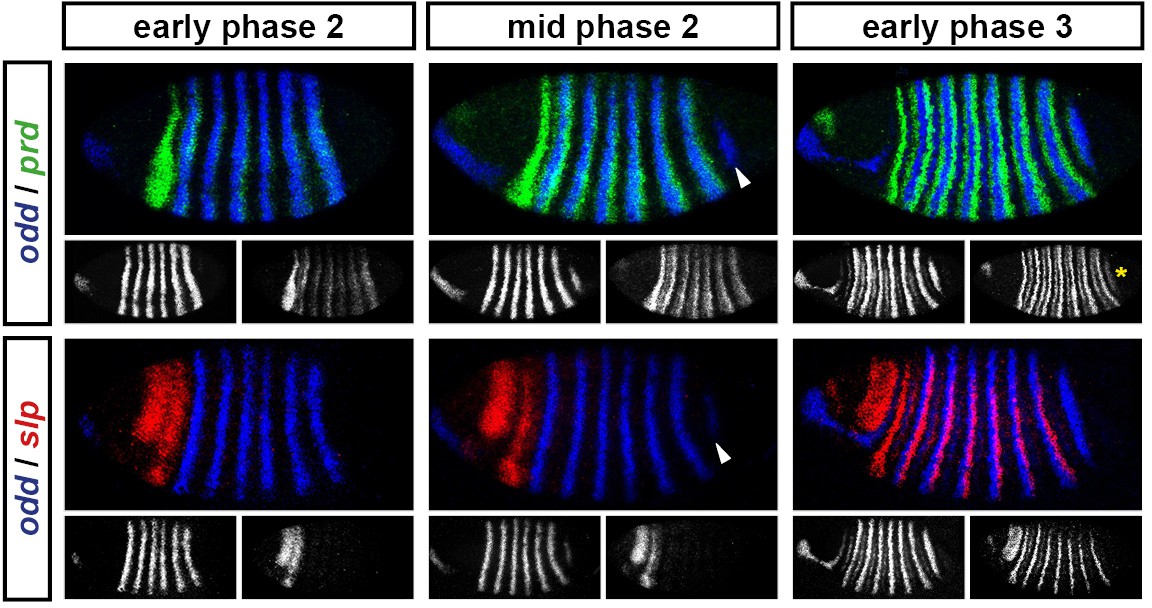
odd stripe 7 appears after the primary stripes of prd, but before the primary stripes of slp.
Expression of odd relative to that of prd and slp over the course of cellularisation. At early phase 2, prd expression in the trunk has appeared, and there are only 6 odd stripes. At mid phase 2, odd stripe 7 (arrowheads) is appearing, and there is no sign of the trunk stripes of slp. At early phase 3, prd stripe 8 (asterisk), which overlaps with odd stripe 7, has appeared, and the slp primary stripes are well-established. Individual channels are shown below each double channel image (odd left, prd/slp right).
Appendix 2—figure 2—figure supplement 2
The posterior border of eve stripe 7 shifts anteriorly relative to the anterior border of odd stripe 7.
Expression of odd relative to that of runt and eve, in wild-type embryos at cellularisation (mid phase 2) and gastrulation (phase 3). (A–D) Whole embryos, lateral view, anterior left, dorsal top. Individual channels are shown below each double channel image (odd left, runt/eve right). Asterisks mark the stripe 7 region. (A’–D’) Blow-ups of the stripe 7 region (images rotated so that the stripes appear vertical). Individual channels are shown to the right of each double channel image. Arrowheads in (A’–D’) mark the anterior border of odd stripe 7; arrows in (C’, D’) mark the posterior border of eve stripe 7. Scale bars = 50 μm.
Appendix 2—figure 2—figure supplement 3
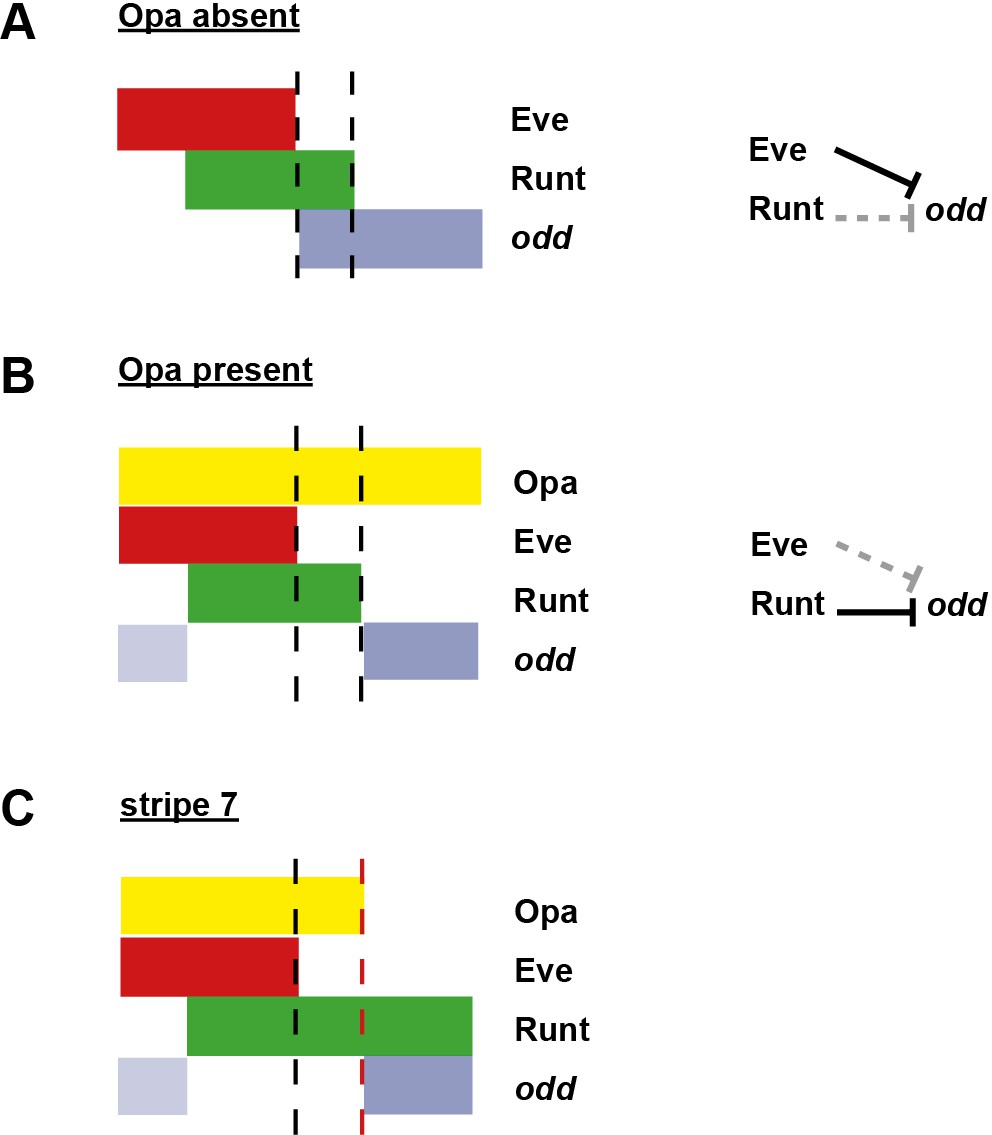
Model for the patterning of the anterior boundaries of the odd primary stripes.
Schematic showing the phasing of odd expression relative to Eve, Runt and Opa protein. The horizontal axis represents part of a double-segment pattern repeat along the AP axis of the embryo. Black dashed lines indicate the posterior boundaries of Eve and Runt expression. (A) In the absence of Opa protein, Eve represses odd, and Runt does not. The anterior boundary of odd is therefore positioned by the posterior boundary of Eve. This scenario applies to phase 2 in wild-type embryos, as well as phase 3 in opa mutant embryos. (B) In the presence of Opa protein, Runt represses odd, but Eve does not. The anterior boundary of odd primary stripe expression is therefore positioned by the posterior boundary of Runt, while a secondary stripe (pale blue) appears within the Eve domain. This scenario applies to phase 3 of wild-type embryos. (C) The atypical patterning observed for stripe 7. The anterior boundary of odd stripe 7 is positioned by the posterior boundary of Opa expression (red dashed line). Anterior to this line, the regulatory network is the same as for (B), while posterior to this line the regulatory network is the same as for (A). Hammerhead arrows represent repressive interactions. Solid black arrows represent interactions that are currently in operation; dashed grey arrows represent those that are not.
Download links
A two-part list of links to download the article, or parts of the article, in various formats.
Downloads (link to download the article as PDF)
Open citations (links to open the citations from this article in various online reference manager services)
Cite this article (links to download the citations from this article in formats compatible with various reference manager tools)
Odd-paired controls frequency doubling in Drosophila segmentation by altering the pair-rule gene regulatory network
eLife 5:e18215.
https://doi.org/10.7554/eLife.18215


