Postictal behavioural impairments are due to a severe prolonged hypoperfusion/hypoxia event that is COX-2 dependent
- University of Calgary, Canada
- Catholic University of Health and Allied Sciences, Tanzania
Figures
Figure 1 with 1 supplement
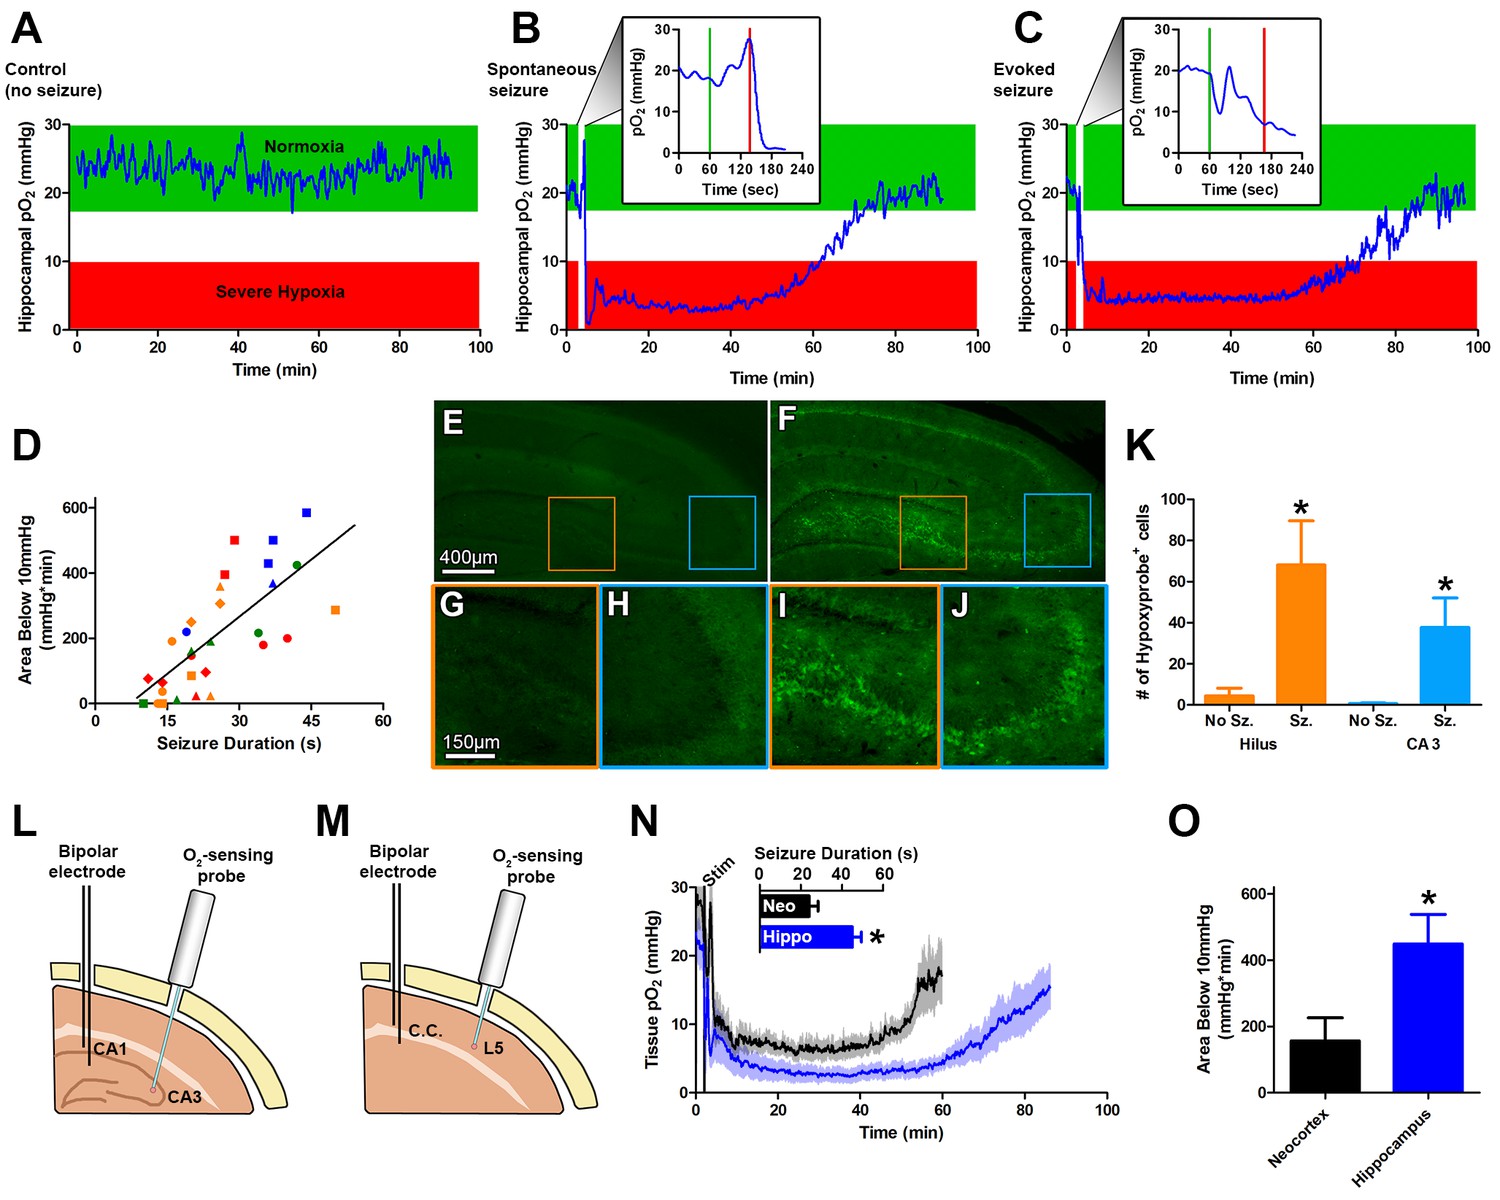
Seizures induce severe postictal hypoxia.
(A) Local tissue oxygenation in the hippocampus of an awake, freely-moving rat (blue). Green denotes normoxia while red denotes severe hypoxia. (B) Representative oxygen profile before, during, and after a spontaneous seizure. The inset expands the time-scale during the seizure with the green and red lines denoting the beginning and end of an 80 s seizure. This inset corresponds to the white vertical block near the beginning of the full oxygen recording. (C) Representative oxygen profile before, during, and after a 106 s electrically kindled seizure. (D) Scatterplot of the relationship between the duration of kindled seizures in the dorsal hippocampus (primary afterdischarge) and the degree of severe hypoxia expressed as the total area below the severe hypoxic threshold (10.0 mmHg) by time (min). Symbols with both the same colour and shape are from the same animal (n = 14). The line of best fit (y = 11.85x+7.57) is indicated. R square = 0.55, p<0.0001. (E–J) Hypoxyprobe immunohistochemistry. (E) Representative image from control rat with close-ups of CA3 (H) and hilus (G). (F) Representative image following a seizure with close-ups of CA3 (J) and hilus (I). Scale bar for (E,F) = 400 µm. Scale bar for (G–I) = 150 µm. (K) Densely stained neurons in the hilus and CA3 were quantified. There are significantly more stained cells in the hilus and CA3 following seizures. Data are mean ± SEM. *p<0.05 (t-test). (L–N) Comparing hippocampus and neocortex. (L) Location of chronic hippocampal implants. (M) Location of chronic neocortical implants. Bipolar electrodes were used for stimulating and recording seizure and O2 sensors for continuous oxygen recordings. C.C. is corpus callosum, L5 is layer 5. (N) Inset displays mean seizure duration ±SEM (n = 5). Hippocampus had significantly longer seizures. *p<0.05. The mean pO2 (opaque) ±SEM (transparent) over time recorded in motor neocortex dorsal hippocampus. (O) Quantification of (N). Hypoxia was more severe in the hippocampus relative to neocortex as assessed by the area below 10mmHg. *p<0.05 (t-test).
Figure 1—figure supplement 1
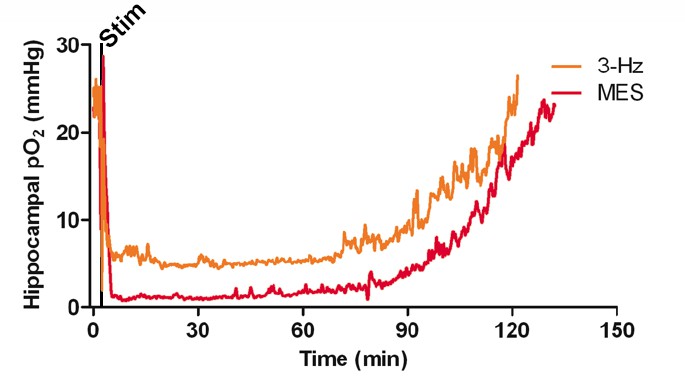
Postictal severe hypoxia generalizes to other seizure models.
Both stimulations resulted in severe hypoxia. A 40 s seizure was elicited with MES stimulation and resulted in 104.1 min of severe hypoxia (red). Following 2 min of 3 Hz stimulation, hippocampal pO2 dropped below 10 mmHg for 90.4 min (orange).
Figure 2 with 1 supplement

Seizures cause postictal vessel constriction in an in vitro preparation and reduced blood flow (hypoperfusion) in vivo.
(A) Location of implants for simultaneous blood flow and pO2 recordings. These two probes were placed at opposing angles to leave room for cable attachment. (B) The simultaneous measurement of mean blood flow and mean pO2 in the hippocampus following brief seizures (n = 5). (C) Nifedipine pre-treatment (15 mg/kg) caused an elevation of baseline pO2, inhibited severe hypoxia, and increased the rate of recovery (n = 5). Inset reveals no difference in seizure duration. (D) Quantification of (C). Nifedipine pre-treatment reduced the amount of severe hypoxia (area below 10mmHg). *p<0.05 (within-subject ANOVA). (E) Validation of 3 Hz stimulation in young rats (P28–P35). Mean oxygen profiles following standard kindling and 3 Hz stimulation (n = 6). (F) Quantification of (E). No significant differences were found in the amount of severe of hypoxia (area below 10 mmHg). (G) Acute hippocampal in vitro slice preparation for measuring postictal vessel constriction. 3 Hz stimulation was applied to the Schaeffer collaterals and imaging was captured in stratum radiatum of CA1. (H,I) Representative images of CA1 arteriole pre-stimulation (H) and post-stimulation (I). Scale bar for (H) and (I) is 15 µm. (J) Lumen diameter over time in stimulated and sham controls. Mean lumen diameter is reduced following 3 Hz stimulation (n = 11) relative to sham (n = 8) between 60 and 90 min post-stim. Data displayed as mean ± SEM. **p=0.001 (t-test). (K) 30 min following nifedipine (50 µM; n = 7) or vehicle (n = 5) application slices were stimulated. Mean lumen diameter was significantly different between 60 and 90 min post-stim. **p<0.01.
Figure 2—figure supplement 1
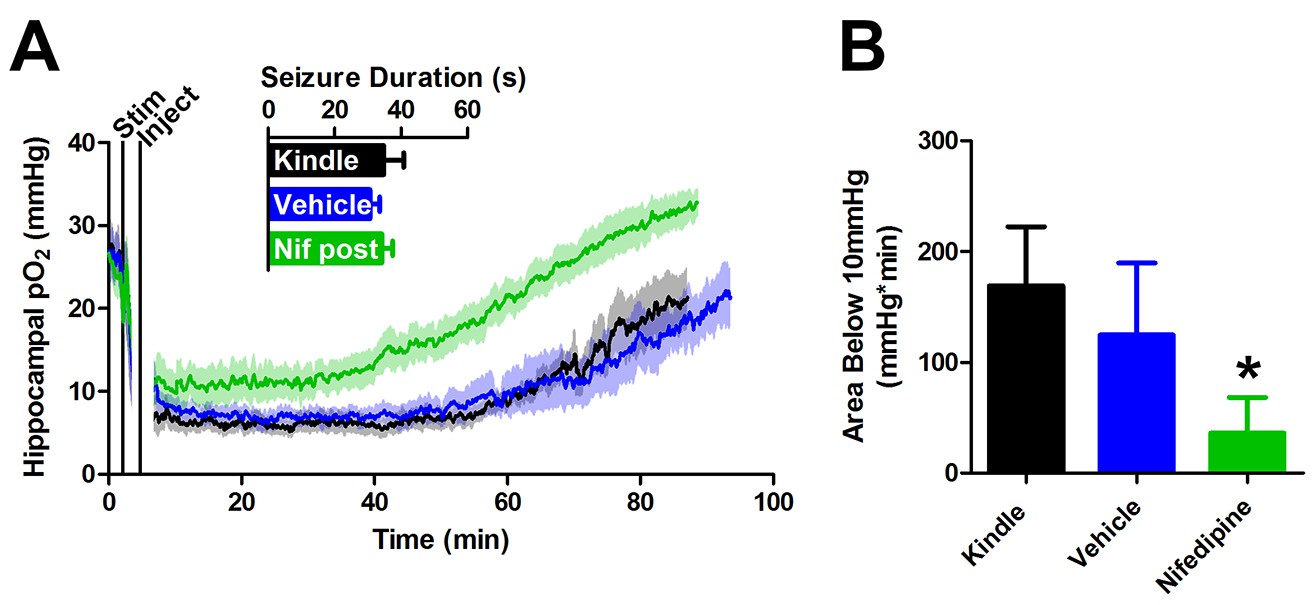
Post-seizure administration of nifedipine prevents severe postictal hypoxia.
(A) Nifedipine (15 mg/kg) was administered immediately after a seizure. No differences were observed in seizure duration, however nifedipine initiated a quicker return to baseline pO2(n = 5). (B) Quantification of (A). Nifedipine (post-seizure administration) caused a significant reduction in severe hypoxia. *p<0.05.
Figure 3 with 1 supplement
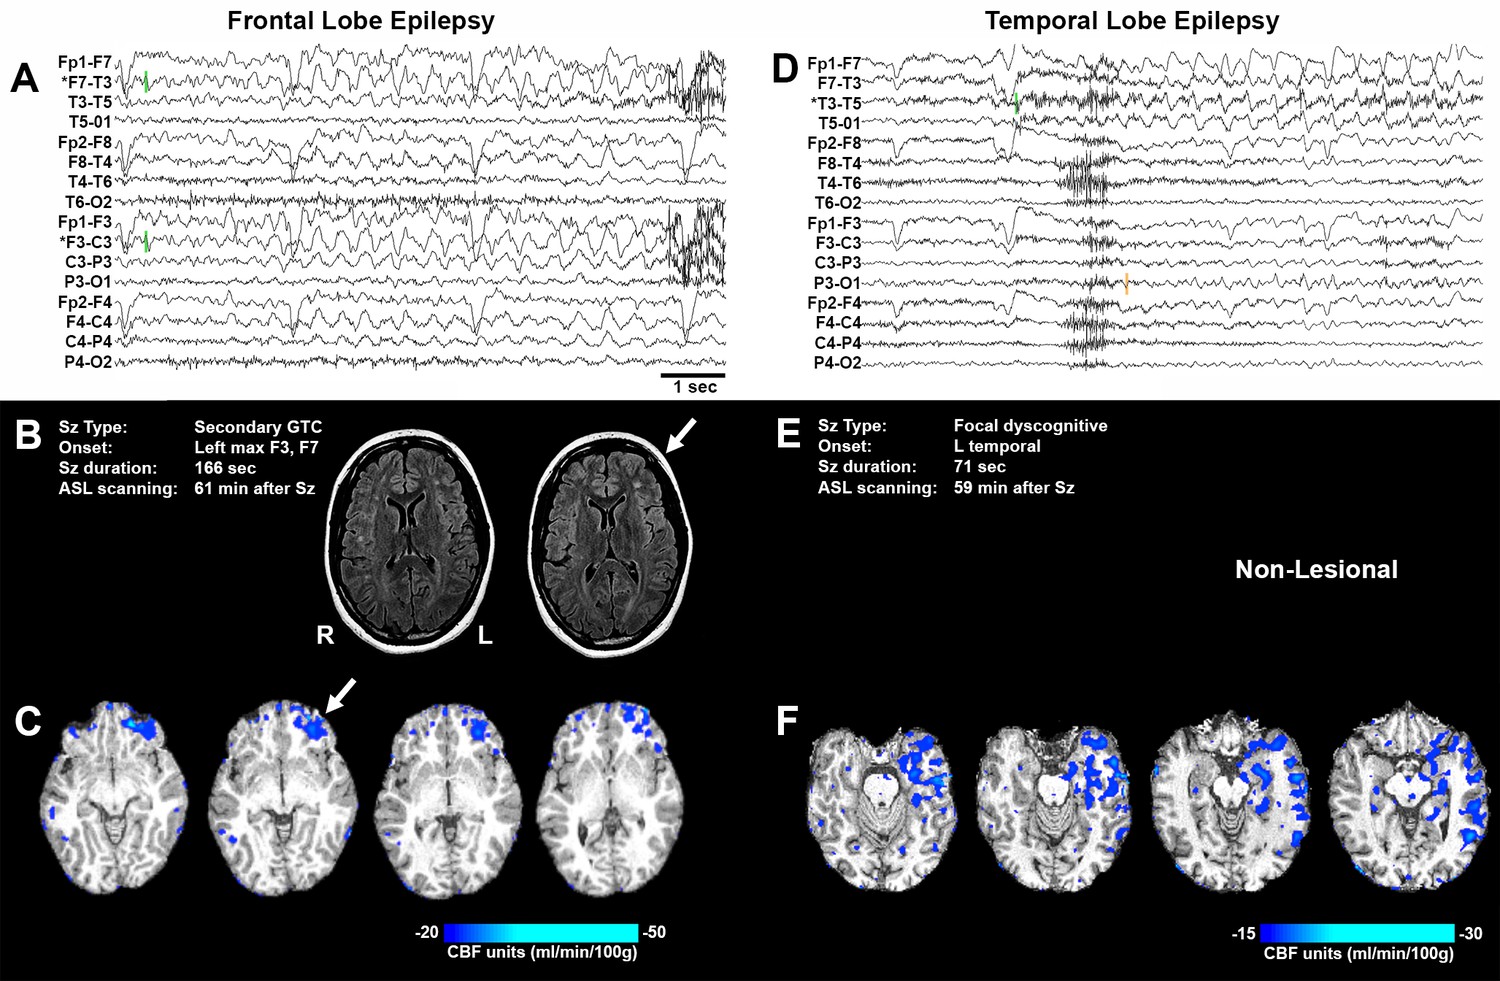
Representative seizure-specific local postictal hypoperfusion in clinical epilepsy.
(A) ASL-010, 26 year old female with drug resistant focal epilepsy. Ictal EEG recording on a longitudinal bipolar montage with left frontal seizure onset and spread to the right frontal region. Green bars indicate seizure onset. * indicates the electrodes to localize seizure onset. Scale bar = 1 s. and also applies to (D). (B) Seizure description and MR. Fluid-attenuated Inversion recovery (FLAIR) MR images demonstrating area of poor gray-white matter differentiation with subcortical white matter hyperintensity over the left frontal region (arrows). R and L indicate right and left sides and also apply to (C) and (F). (C) Subtraction CBF map (inter-ictal – post-ictal) superimposed onto the patient’s T1-weighted anatomical image indicating areas of left frontal hypoperfusion > 20 mL/100 g/min (> 30% reduction compared normal gray matter CBF). (D) ASL-001, 38 year old right handed male with intractable non-lesional epilepsy. Ictal EEG recording on a longitudinal bipolar montage with left temporal seizure onset (green bar) and spread to the left parasagittal region (orange bar). (E) Seizure description. Patient was non-lesional. (F) Subtraction CBF map shows profound hypoperfusion (>15 mL/100 g/min) in left temporal lobe.
Figure 3—figure supplement 1
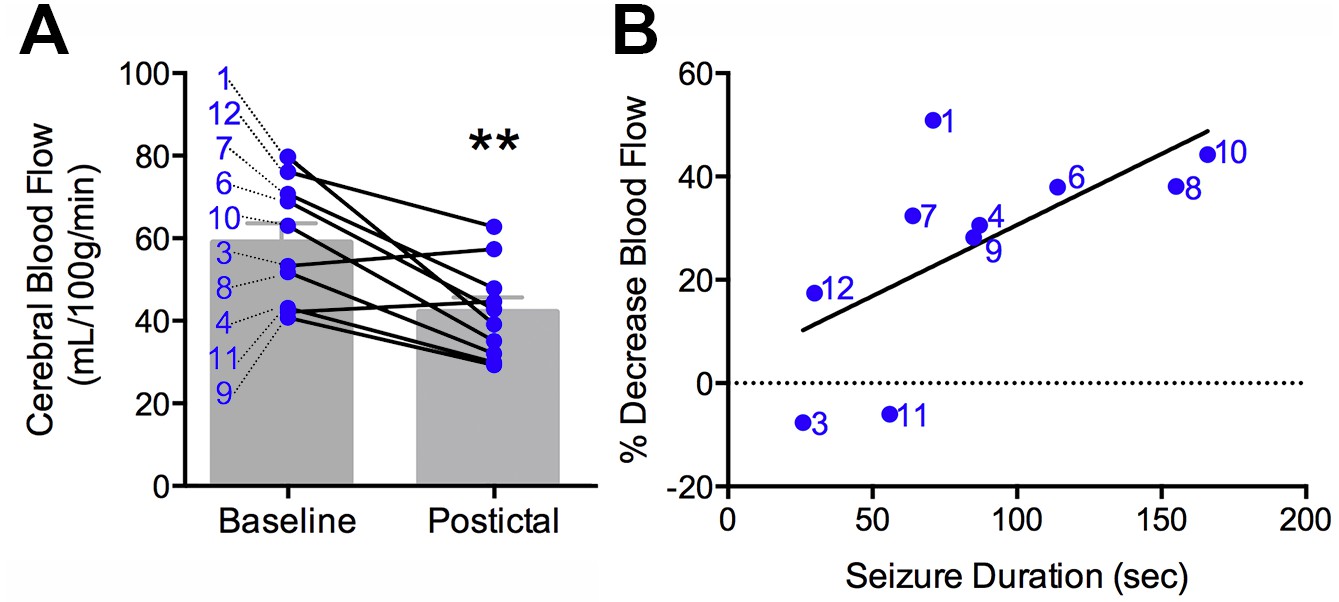
Clinical postictal hypoperfusion is more severe with longer seizures.
(A) Cerebral blood flow from baseline and postictal ASL scans. Each point represents in individual. Group mean ± SEM are expressed in grey. Patient number is displayed on the left of the corresponding data point (e.g. one is patient ASL-001). A significant decrease in blood flow was measured in the postictal scan **p<0.01 (within-subject t-test). (B) Percent decrease in postictal blood flow as a function of seizure duration. A linear regression revealed a significant (p<0.05) positive correlation defined by the line y = 0.28x+3.12 (R square = 0.43).
Figure 4 with 1 supplement
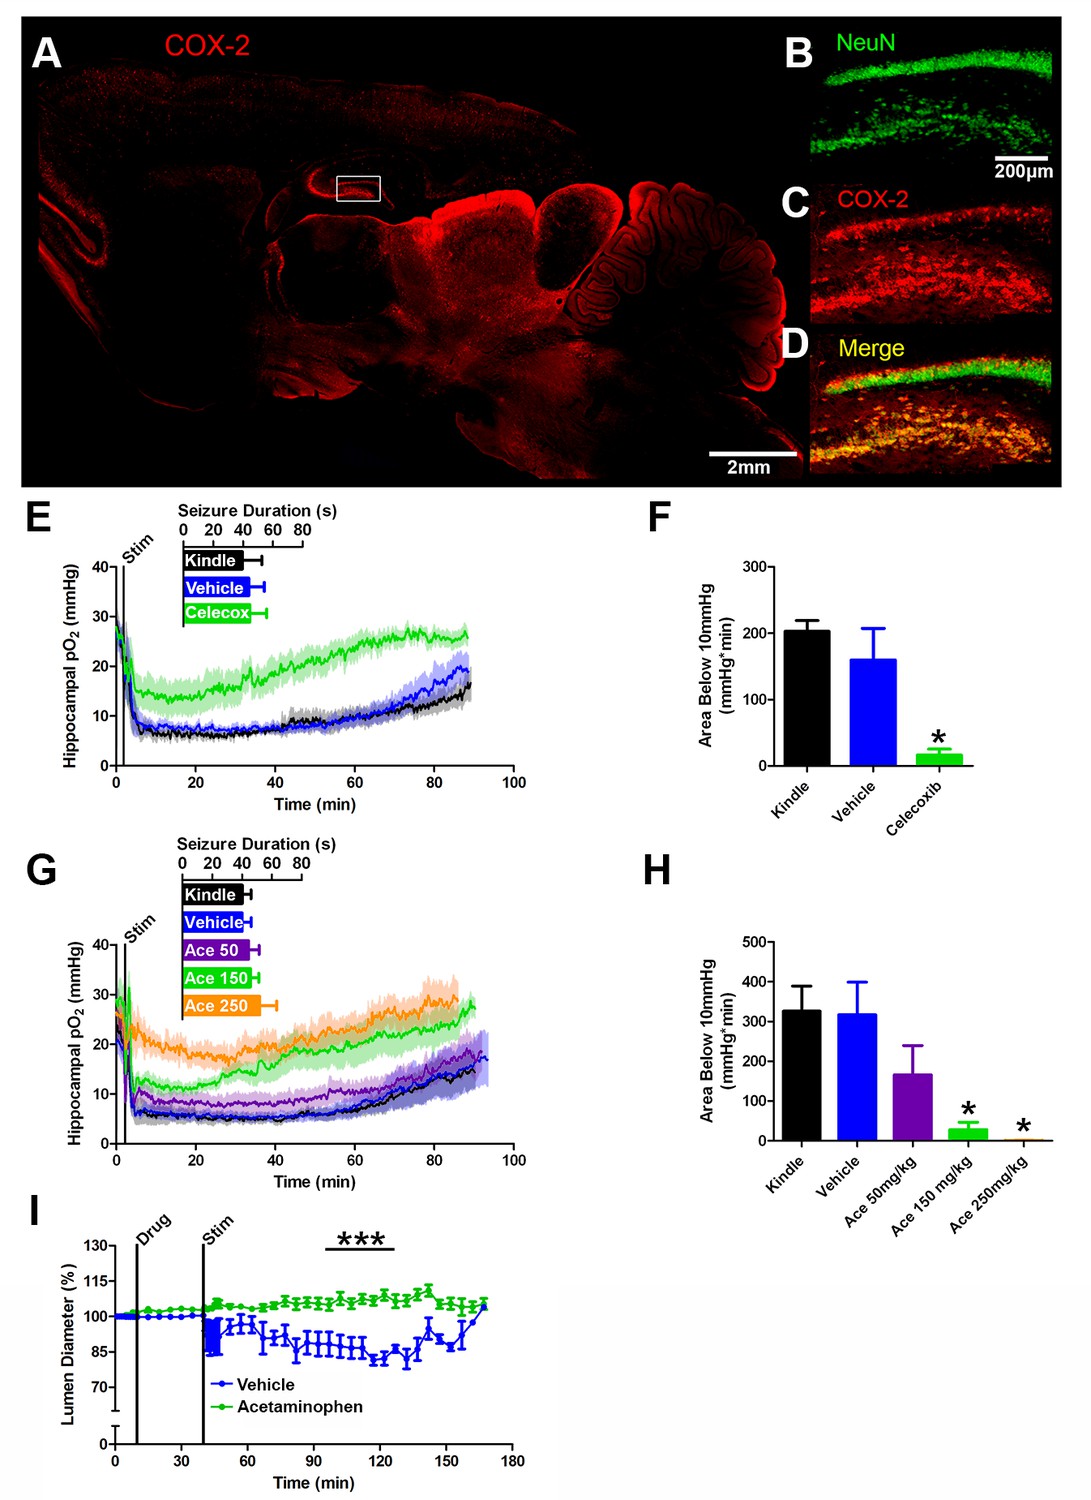
COX-2 activity during a seizure is required for postictal severe hypoxia.
(A) COX-2 expression in sagittal section. Hippocampal inset is displayed (see B–D). Scale bar = 2 mm. (B–D) Contents of inset from (A). Many NeuN-expressing neurons (B) in DG and hilus express COX-2 (C). (D) displays colocalization of NeuN and COX-2. Scale bar = 200 µm. (E) Celecoxib pre-treatment (20 mg/kg) inhibited severe hypoxia during the postictal period (n = 5). Inset reveals no difference in seizure duration. (F) Celecoxib caused a significant reduction in the area below 10mmHg. *p<0.05 (within subject ANOVA). (G) Acetaminophen (Ace) dose-dependently inhibited postictal severe hypoxia (n = 5). Doses are listed on inset (50–250 mg/kg). Inset reveals no difference in seizure duration. (H) 150 mg/kg and 250 mg/kg of acetaminophen significantly decreased the area below 10mmHg. *p<0.05 (within subject ANOVA). (I) Lumen diameter over time following application of acetaminophen (100 µM; n = 7 or vehicle (n = 5). Acetaminophen treatment prevented post-stimulation constriction (analyzed between 60–90 min post-stim). ***p<0.001.
Figure 4—figure supplement 1
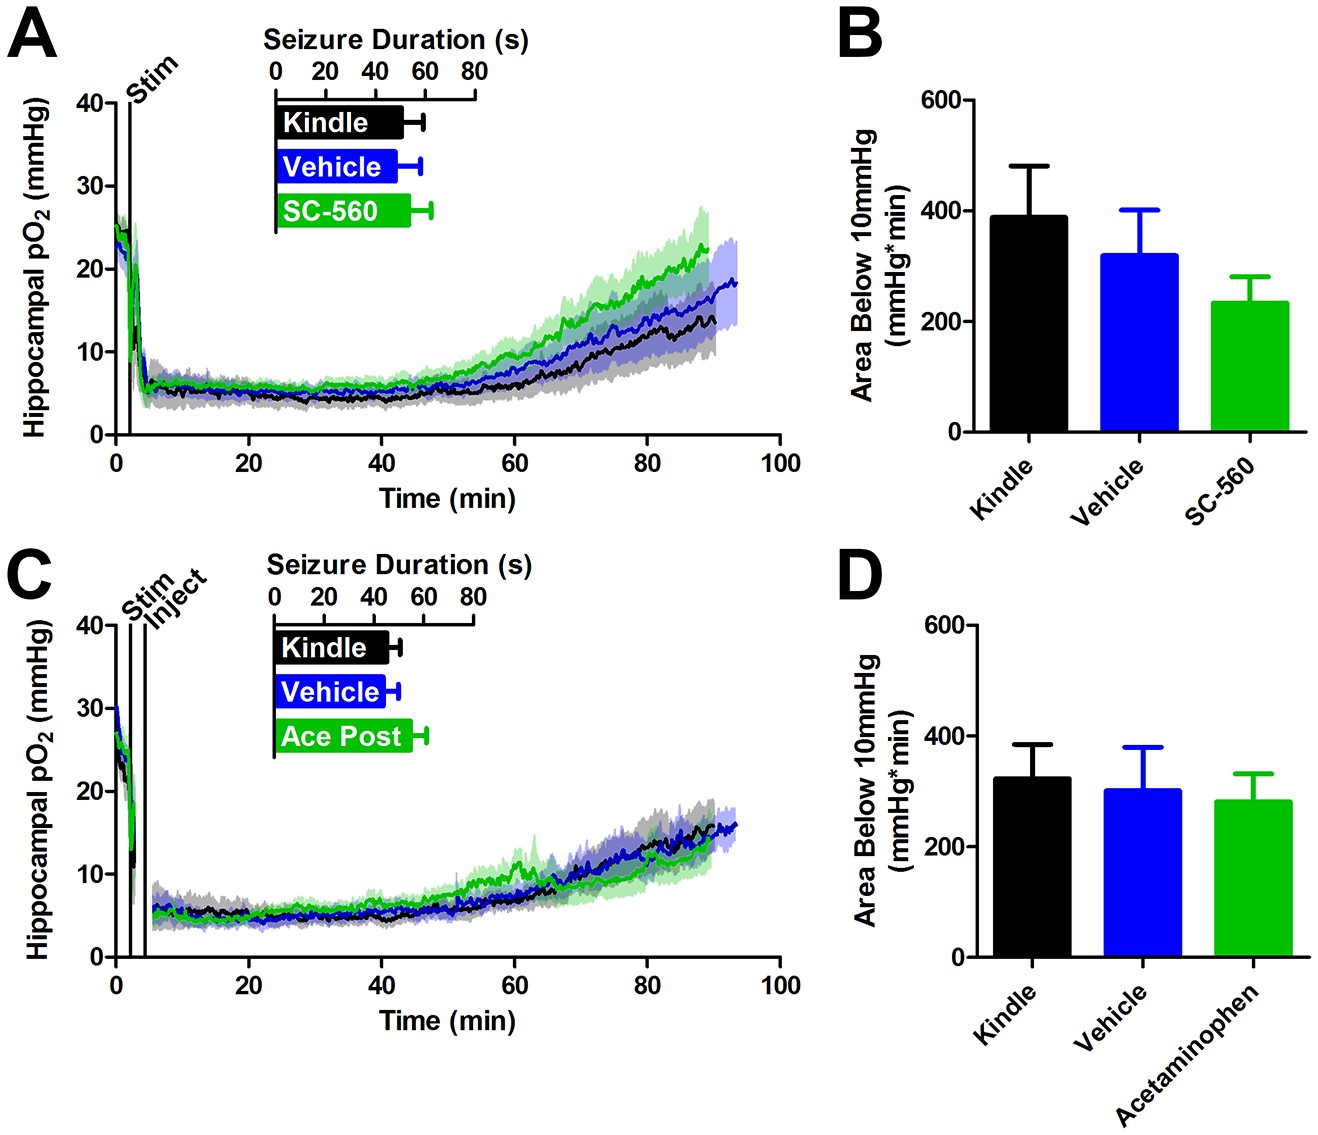
COX-1 or postictal COX-1/2 inhibition do not inhibit severe hypoxia.
(A) SC-560 (20 mg/kg) pre-administration did not significantly alter seizure duration or the resulting oxygen profile (n = 5). (B) Quantification of (A). No differences in the severe hypoxia were observed with SC-560 pre-treatment. (C) Acetaminophen (250 mg/kg) was administered immediately after a seizure. No significant differences were observed in seizure duration or the resulting oxygen profiles (n = 5). (D) Quantification of (C). No significant differences were observed in the severe hypoxia with acetaminophen post-treatment.
Figure 5
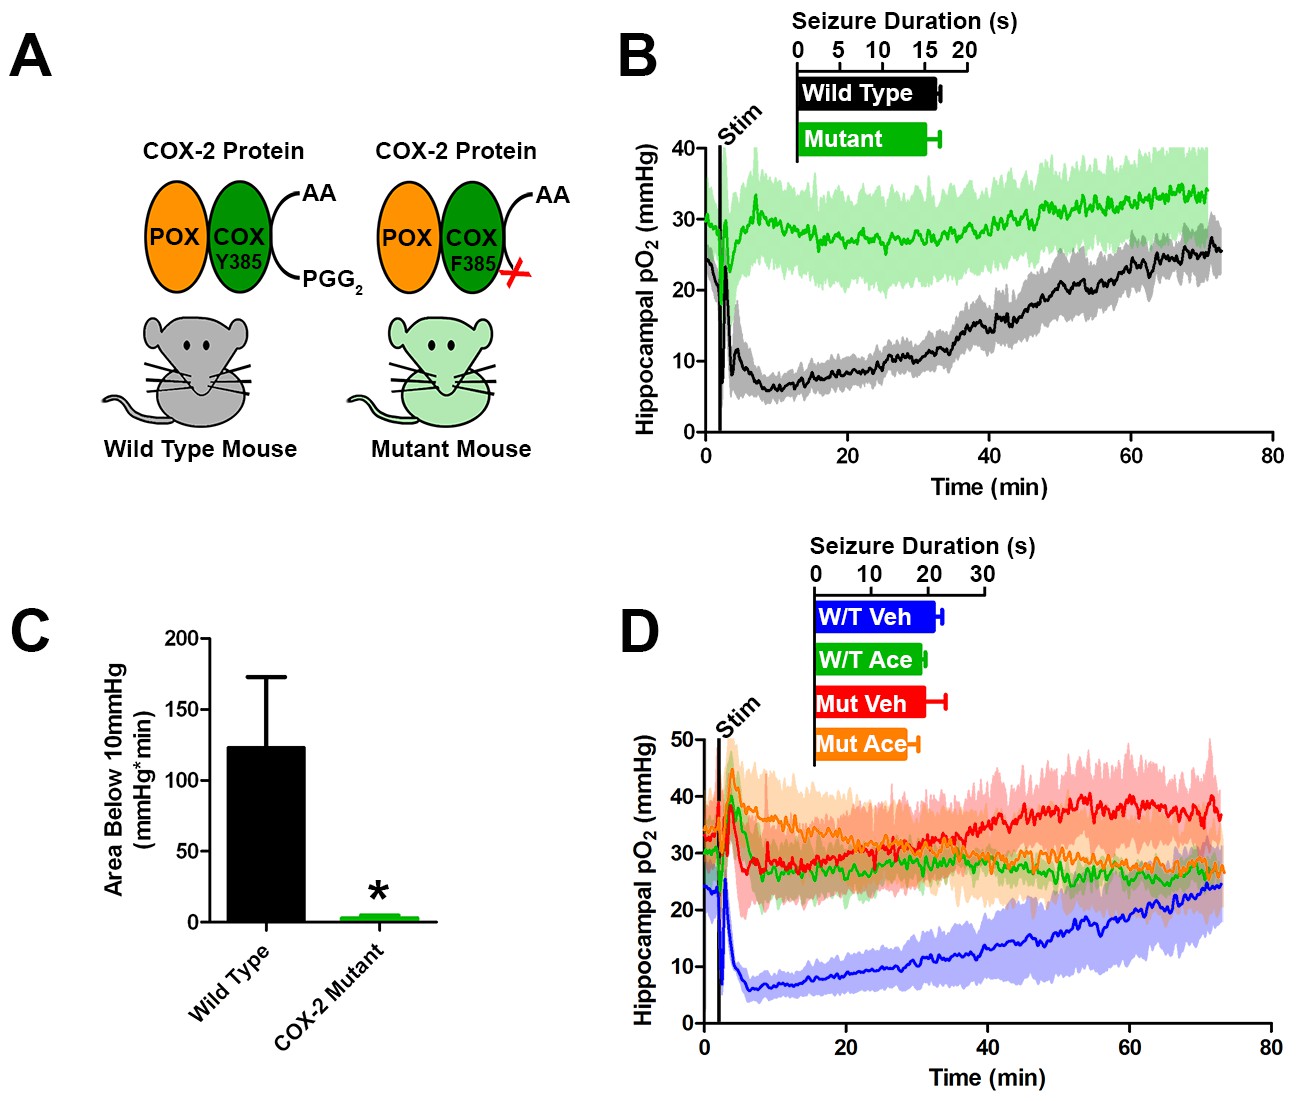
Genetic knockdown of COX-2 function prevents postictal severe hypoxia.
(A) COX-2 proteins from wild-type and mutant mice (PTGS2Y385F) displayed as a schematic. Both mice have functional peroxidase (POX). Mutants have a point mutation in the cyclooxygenase (COX) active site, which prevents the conversion of arachadonic acid (AA) to prostaglandin G2 (PGG2). (B) No differences were observed in seizure duration between wild-type and mutant mice (n = 4). Wild-type mice displayed severe postictal hypoxia, while mutant mice remained normoxic in the postictal period. (C) Quantification of (D). COX-2 mutant mice displayed a significant reduction in severe hypoxia (area below 10 mmHg). *p<0.05 (t-test). (E) Wild-type and mutant mice were treated with acetaminophen (250 mg/kg) (n = 3). Acetaminophen prevented hypoxia in wild-type mice and had no effect in mutant mice.
Figure 6

Preventing postictal severe hypoxia prevents behavioral impairments.
(A) Experimental timeline for neocortex experiments. Rats were injected with vehicle or nifedipine 30 min prior to a baseline hang time measurement. Neocortical seizures (or sham) were then elicited and rats were retested at 20, 40, and 80 min post-seizure. (B) Nifedipine pre-treatment (15 mg/kg) inhibited severe hypoxia during the postictal period (n = 4). Inset reveals no difference in seizure duration. Note that during task performance motor cortex pO2 levels temporarily increased while the rat hung from the bar, likely mediated by increased blood pressure, but returned to pre-test levels following release from the bar. (C) Performance on the hanging bar task was steady across the experiment, except in the vehicle+seizure group (hypoxic) (n = 4 for seizures, n = 3 for no seizures). A significant decrease was observed at 40 min post-seizure, which recovered by 80 min. Data are mean ± SEM. **p<0.01 (2 way ANOVA). (D) Experimental timeline for hippocampus experiments. Rats were injected with vehicle or acetaminophen (250 mg/kg) 30 min prior to hippocampal seizure induction (or sham). 45 min post-seizure, rats were place in testing environment to encode the memory of 2 identical objects. 24 hr later, memory was tested by measuring the percentage of time spent investigating the novel object. (E) No differences were observed in seizure duration (n = 4). Acetaminophen prevented postictal hypoxia. (F) Rats that had seizures and vehicle treatment (hypoxic) performed no different from chance and significantly worse than all other groups (n = 4). Data are mean ± SEM. **p<0.01 (ANOVA).
Author response image 1
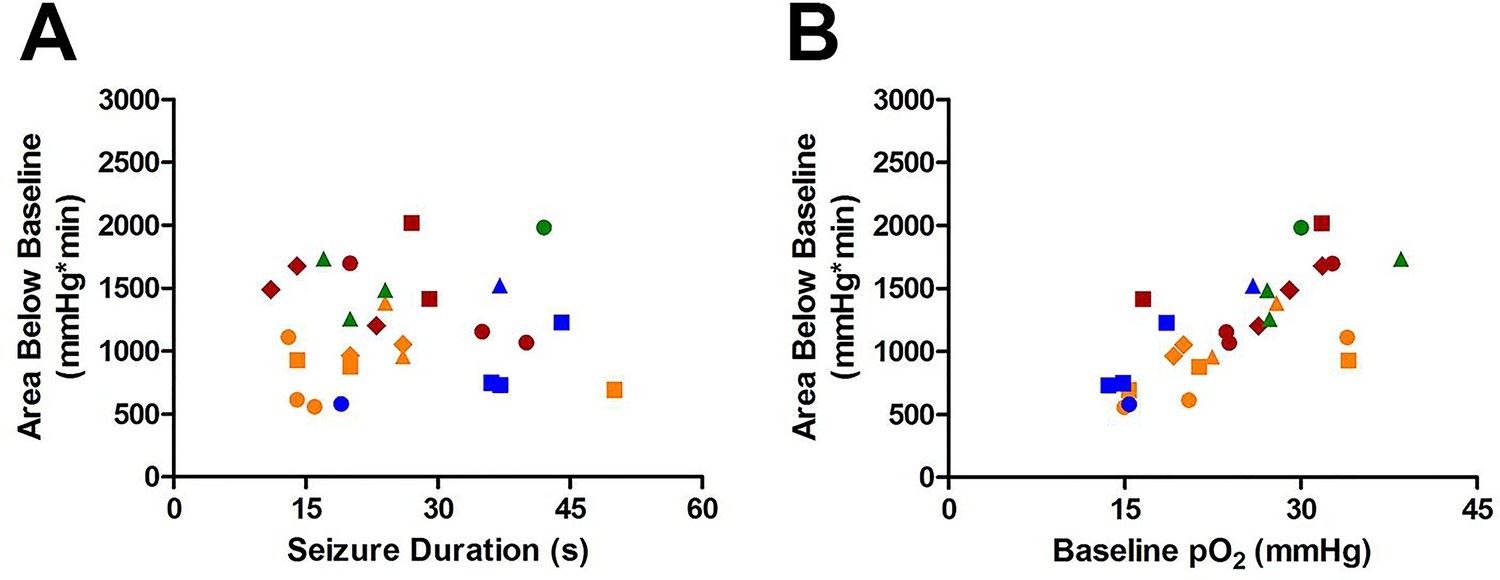
Susceptibility of Area Below Baseline analysis to changes in baseline pO2.
(A) Seizure duration is not correlated with total area under curve (R square=0.000013, p=0.99). (B) Instead, the baseline pO2 is strongly correlated with the area below baseline (R square=0.52, ***p<0.0001).
Author response image 2

Comparing area below baseline analyses with pre- and post-administration of nifedipine.
(A) Pre-administration of nifedipine had no effect on area below baseline. (B) Post-administration of nifedipine significantly reduced the area below baseline (p<0.01).
Tables
Table 1
Characteristics of patients recruited to ASL study.
Patient | Age | Age at Seizure Onset | Structural MRI findings |
|---|---|---|---|
ASL-001 | 38 | 34 | Normal |
ASL-003 | 41 | 13 | Lesion in the right superior temporal gyrus, resolving? |
ASL-004 | 25 | 5 | Normal |
ASL-006 | 33 | 7 | Normal |
ASL-007 | 33 | 29 | Bilateral subependymal heterotopias along lateral ventricle right > left |
ASL-008 | 42 | 22 | Right amygdala enlargement, Right occipital cavernoma |
ASL-009 | 40 | 9 | Normal |
ASL-010 | 26 | 1 | Left frontal malformation of cortical development |
ASL-011 | 22 | 14 | Normal |
ASL-012 | 20 | 0.5 | Postsurgical changes in the right frontal lobe, right anterior temporal lobectomy |
Table 2
Concordance of postictal ASL hypoperfusion with brain areas involved in the seizure. EEG localization of ictal activity was determined by an Epileptologist based on scalp EEG. GTC denotes when a generalized tonic-clonic seizure occurred. Areas of maximal hypoperfusion were identified by a blinded reviewer and Regions of Interest were drawn around those areas and adjacent confluent voxels for quantification (Figure 2—figure supplement 1A,B). Concordance was noted if ictal activity overlapped with the area of maximal hypoperfusion.
Patient | EEG localization of seizure [duration (S)] | Area of maximal hypoperfusion for ASL quantification | ROI volume (cm3) | Concordant |
|---|---|---|---|---|
ASL-001 | Left temporal [71] | Left temporal | 2.52 | yes |
ASL-003 | Unclear [26] | No Change | 1.45 | n/a |
ASL-004 | Left frontocentral [87] | Left superior posterior temporal | 0.31 | yes |
ASL-006 | Left fronotemporal [114] | Left insula, left anterior temporal | 1.46 | yes |
ASL-007 | GTC, Left hemisphere. Maximal posterior temporo-parietal [64] | Multifocal bihemispheric | 1.35 | yes |
ASL-008 | GTC, Right temporo-occipital [155] | Multifocal bihemispheric | 1.63 | yes |
ASL-009 | Left fronto-central [85] | Multifocal bihemispheric | 0.76 | yes |
ASL-010 | GTC, Bifrontal, maximum left [166] | Left frontal | 3.82 | yes |
ASL-011 | Left fronto-temporal [56] | No Change | 1.10 | n/a |
ASL-012 | Bitemporal right>left [30] | Multiple areas over right temporal posterior and superior to resection cavity | 2.19 | yes |
Table 3
Investigation of mechanisms involved in postictal severe hypoxia.
Drug | Principle known mechanism of action | Δ severity of hypoxia |
|---|---|---|
Nifedipine (15 mg/kg) | L-type Ca2+ Channel Blocker | +78.82 ± 7.632% *** |
Nifedipine (15 mg/kg postictal) | +87.33 ± 10.49% ** | |
Acetaminophen (250 mg/kg) | COX-1/2 Inhibitor | +99.88 ± 0.12% *** |
Acetaminophen (150 mg/kg) | +88.88 ± 7.355% *** | |
Acetaminophen (50 mg/kg) | +48.85 ± 26.61% | |
Acetaminophen (250 mg/kg postictal) | −3.33 ± 17.29% | |
Ibuprofen (20 mg/kg) | +99.23 ± 0.396% *** | |
Celecoxib (20 mg/kg) | COX-2 Inhibitor | +67.26 ± 27.42% * |
SC-560 (20 mg/kg) | COX-1 Inhibitor | +19.42 ± 15.37% |
Celecoxib (20 mg/kg) + SC-560 (20 mg/kg) | COX-2 and COX-1 Inhibitors | +95.80 ± 4.21% *** |
Acetaminophen (250 mg/kg) + Nifedipine (15 mg/kg) | COX-1/2 Inhibitor + L-type Ca2+ Channel Blocker | +100 ± 0.00% *** |
CAY-10526 (2 mg/kg) | Prostaglandin E2 Synthesis Inhibitor | +41.72 ± 9.94% ** |
Seratrodast (10 mg/kg) | Thromboxane A2 Receptor Antagonist | −12.91 ± 44.08% |
Ozagrel (10 mg/kg) | Thromboxane A2 Synthesis Inhibitor | +21.24 ± 16.42% |
2-APB (3 mg/kg) | IP3r Antagonist + TRP Channel Blocker | +45.27 ± 18.44% * |
Chelerythrine Chloride (15 mg/kg) | PKC Inhibitor | +25.54 ± 29.90% |
Milrinone (3 mg/kg) | Phosphodiesterase-3 Inhibitor | −10.74 ± 34.31% |
Sildenafil (15 mg/kg) | Phosphodiesterase-5 Inhibitor | −19.34 ± 14.03% |
SKA-31 (10 mg/kg) | IKCa Channel Activator | −1.50 ± 12.68% |
Paxilline (2.5 mg/kg) | BKCa Channel Blocker | +19.55 ± 14.98% |
L-Arginine (500 mg/kg) | Nitric Oxide Precursor | −5.05 ± 14.08% |
Fasudil (10 mg/kg) | Rho Kinase Inhibitor | −53.07 ± 17.27% * |
-
All drugs were delivered by intraperitoneal injection pre-seizure (unless otherwise stated).
-
Statistics reported as different from chance (one sample T-test).
-
*p < 0.05, **p<0.01, ***p<0.001.
-
+ number indicates inhibition of hypoxia.
-
− number indicates potentiation of hypoxia.
Table 4
Effect of Anti-Seizure drugs on postictal severe hypoxia.
Drug | Principal known mechanism of action | Δ severe hypoxia |
|---|---|---|
Ethosuximide (300 mg/kg) | T-type Ca2+ Channel Blocker | +30.53 ± 19.31% * |
Topiramate (50 mg/kg) | Na+ Channel Blocker, GABA Enhancement, AMPA Inhibition | +4.34 ± 14.07% |
Bumetanide (2.5 mg/kg) | NKCC1 Transporter Inhibitor | −0.92 ± 14.72% |
Phenobarbital (30 mg/kg) | GABA Receptor Agonist | −1.22 ± 13.90% |
Levetiracetam (250 mg/kg) | Glutamate Release Inhibition | −14.85 ± 19.71% |
Phenytoin (75 mg/kg) | Na+ Channel Blocker | −15.76 ± 17.00% |
Lamotrigine (15 mg/kg) | Na+ Channel Blocker | −20.95 ± 17.13% |
Valproate (150 mg/kg) | Na+ Channel Blocker, GABA Enhancement | −24.89 ± 22.65% |
-
All drugs were delivered by intraperitoneal injection pre-seizure.
-
Statistics reported as different from chance (one sample T-test).
-
*p<0.05.
-
+ number indicates inhibition of hypoxia.
-
-number indicates potentiation of hypoxia.
Table 5
Stereotaxic coordinates for surgical implantation.
Experiment | Anterior(+)/ Posterior(−) | Lateral Right(+)/Left(−) | Ventral (from brain surface) |
|---|---|---|---|
Rat Dorsal Hippocampus | Electrode: −3.0 mm Optode: −3.5 mm | Electrode: 0.5 mm Optode: 3.5 mm | Electrode: 3.5 mm Optode: 3.5 mm |
Rat Dorsal Hippocampus with LDF | Electrode: −3.0 mm Optode: −5.0 mm LDF probe: −3.0 mm | Electrode: 0.5 mm Optode: 2.2 mm LDF probe: 3.5 mm | Electrode: 3.5 mm Optode: 3.5 mm LDF probe: 3.5 mm |
Rat Ventral Hippocampus | Electrode: −4.5 mm Optode: −3.0 mm | Electrode: 4.5 mm Optode: 3.5 mm | Electrode: 6.5 mm Optode: 3.5 mm |
Rat Ventral Hippocampus w/ Cannula | Electrode: −4.5 mm Optode: −3.0 mm Cannula: - 5.8 mm | Electrode: 4.5 mm Optode: 3.5 mm Cannula: −4.5 mm | Electrode: 6.5 mm Optode: 3.5 mm Cannula: 4.3 mm |
Rat Neocortex | Electrode:+1.0 mm Optode: 0 mm | Electrode: 0.5 mm Optode: 3.0 mm | Electrode: 3.6 mm Optode: 1.5 mm |
Mouse Ventral Hippocampus | Electrode: −2.9 mm Optode: −1.6 mm | Electrode: 3.0 mm Optode: 2.0 mm | Electrode: 3.0 mm Optode: 1.8 mm |
Download links
A two-part list of links to download the article, or parts of the article, in various formats.
Downloads (link to download the article as PDF)
Open citations (links to open the citations from this article in various online reference manager services)
Cite this article (links to download the citations from this article in formats compatible with various reference manager tools)
Postictal behavioural impairments are due to a severe prolonged hypoperfusion/hypoxia event that is COX-2 dependent
eLife 5:e19352.
https://doi.org/10.7554/eLife.19352


