APP modulates KCC2 expression and function in hippocampal GABAergic inhibition
- South China Normal University, China
- University of Texas Health Sciences Center, United States
- Baylor College of Medicine, United States
Figures
Figure 1 with 1 supplement
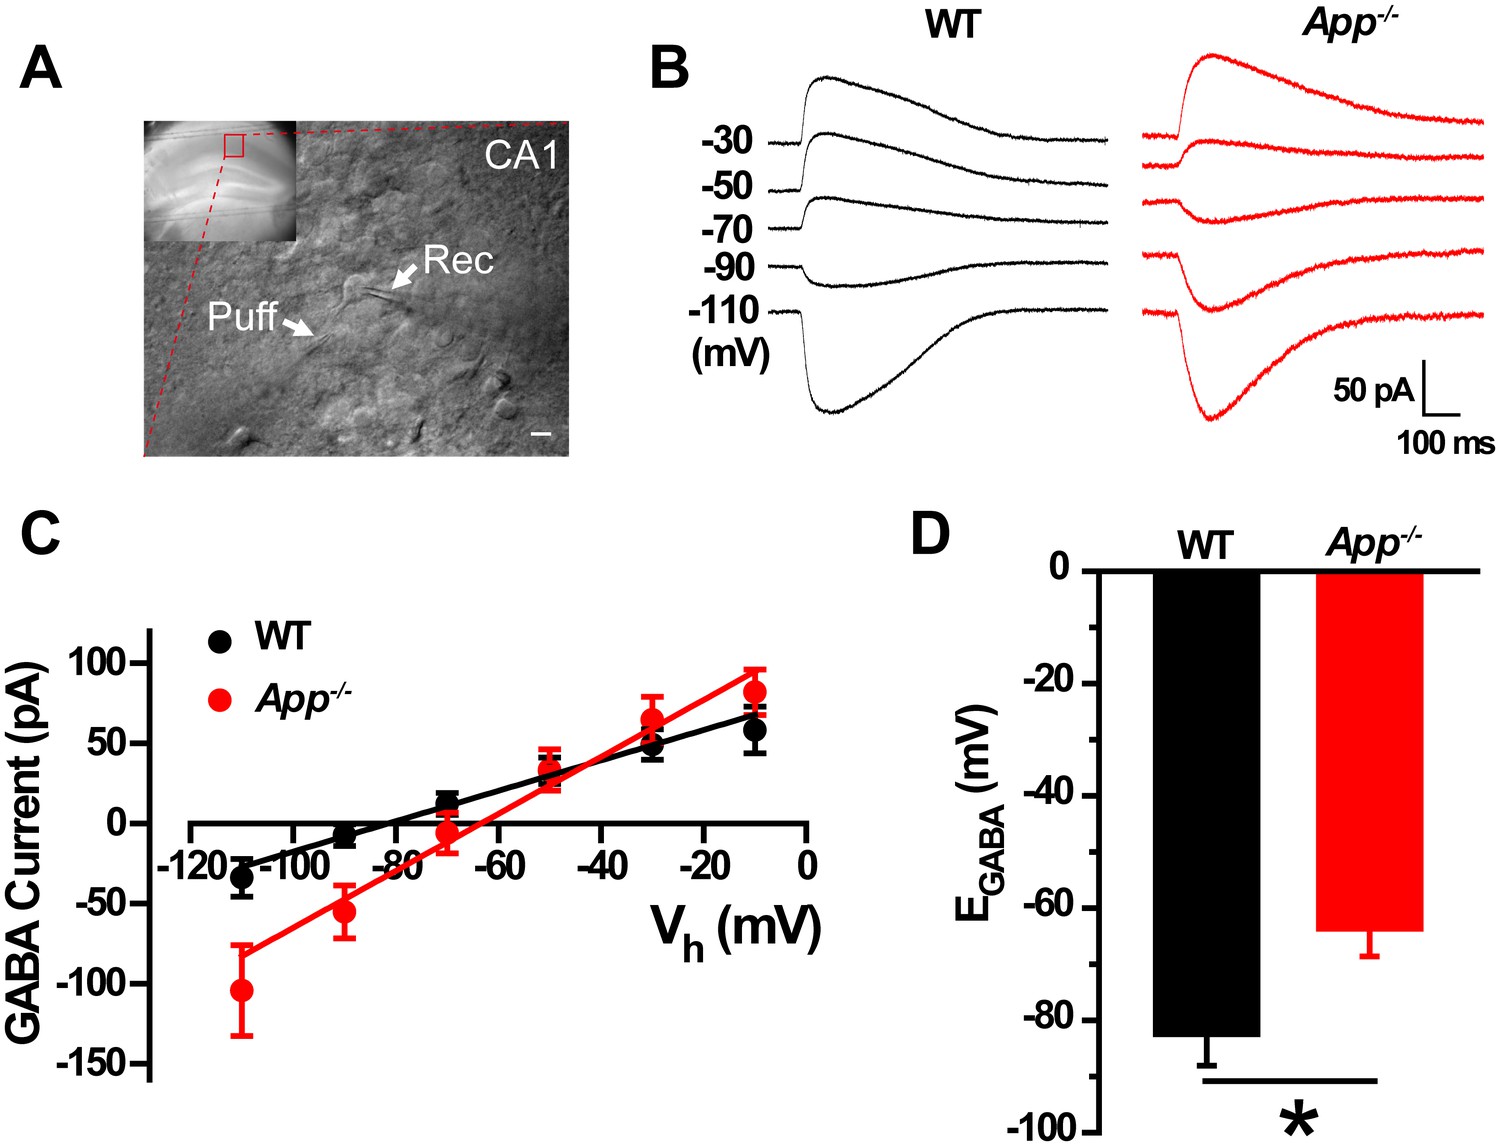
GABA reversal potential shifts toward depolarization in hippocampus of App-/- mice.
(A) Slice preparations were made from the hippocampus and neurons were recorded in CA1 (inset). Pipettes were positioned to clamp neurons (Rec) while puffing molecules onto the cell (Puff). Scale bar: 10 µm. (B) Sample traces showing perforated patch recording of EGABA in WT and App-/- hippocampal slices. Currents were recorded at the indicated holding potentials shown to the left of each trace. (C) Graph shows I–V plots for the traces shown in B. (D) Quantification of EGABA shows a significant depolarizing shift in App-/- mice compared to WT controls (WT, n = 16 cells from five mice; App-/-, n = 20 cells from five mice). *p<0.05; Student’s t-test.
Figure 1—figure supplement 1
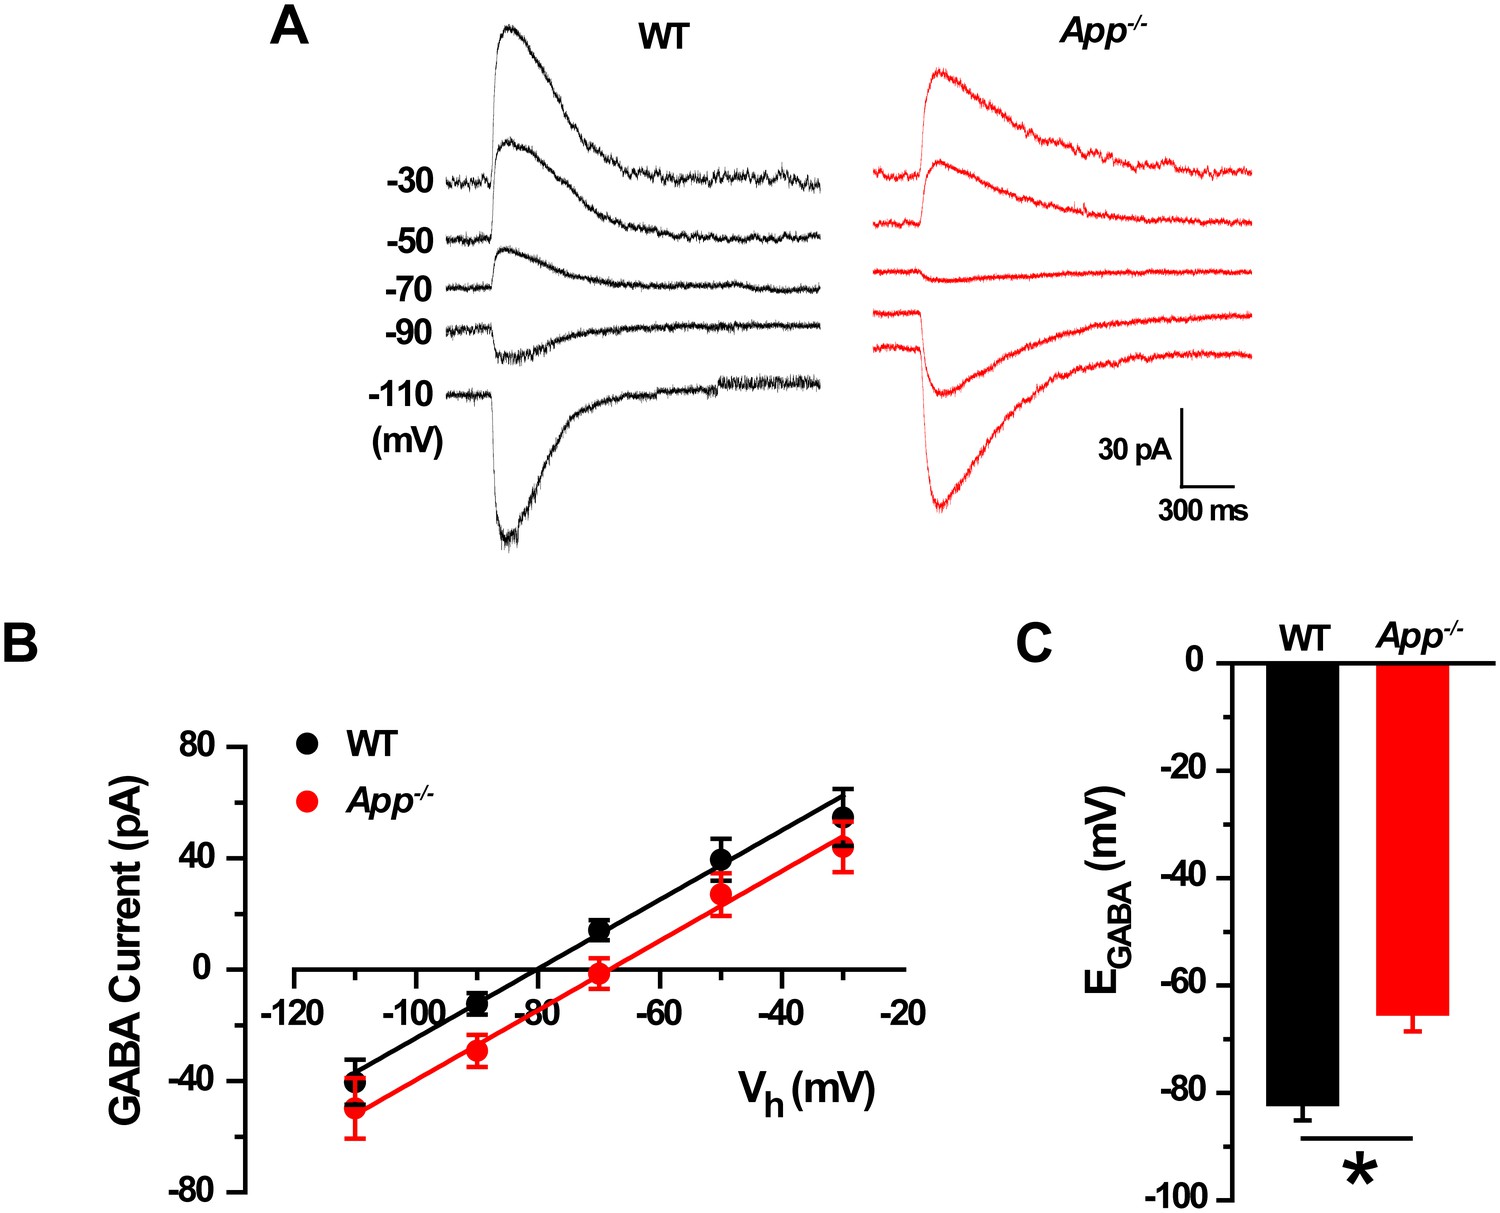
GABA reversal potential shifts toward depolarization in App-/- hippocampal cultures.
(A) Sample traces showing perforated patch recordings of EGABA in WT and App-/- mice hippocampal cultures. Currents were recorded at the indicated holding potentials shown to the left of each trace. (B) Graph shows I–V plots for the traces shown in A. (C) Quantification of EGABA shows a significant depolarizing shift in App-/- mice compared to WT (WT, n = 14 cells from three independent cultures, 2–3 mice/per culture; App-/-, n = 12 cells from three independent cultures, 2–3 mice/per culture). *p<0.05; Student’s t-test.
Figure 2 with 2 supplements
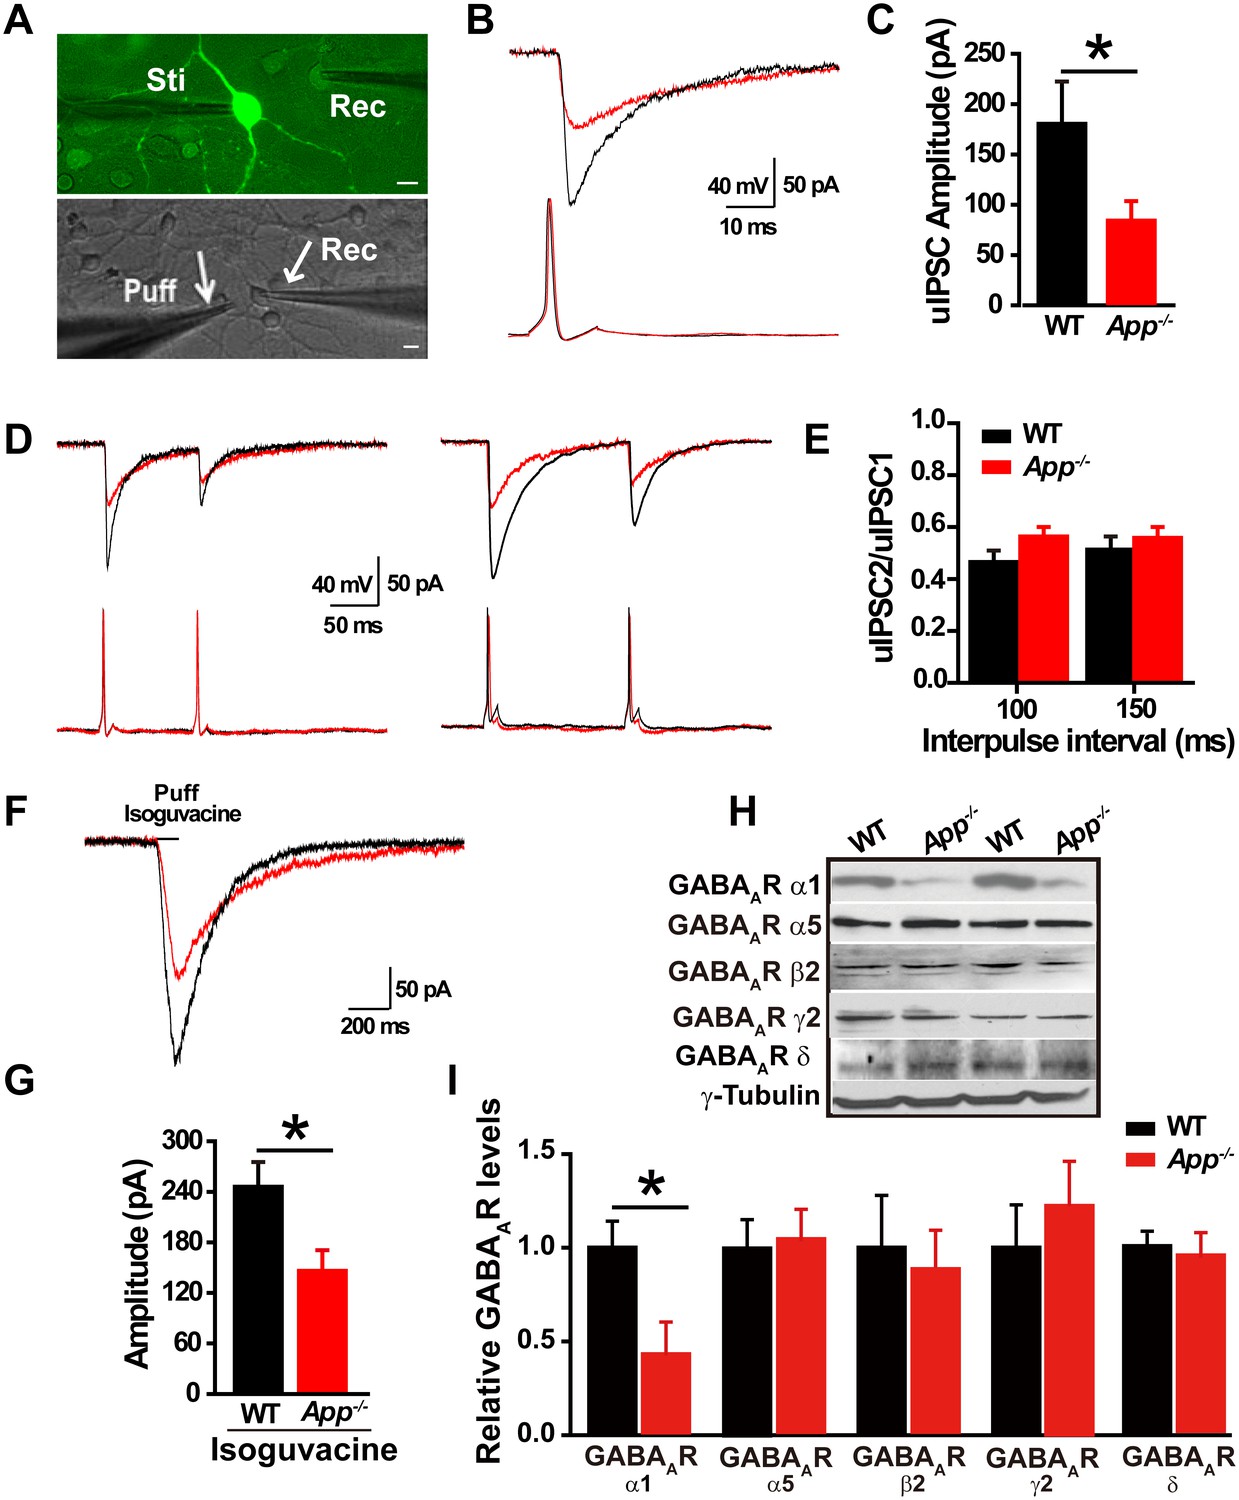
Decreased inhibitory IPSC amplitude and GABAAR α1 protein levels in App-/- mice.
(A) Images of 12–14 DIV hippocampal cultures of Gad67+/GFP mice. In the upper panel, under fluorescent illumination, GABAergic neurons appear green, and were stimulated (Sti) while recording from nearby glutamatergic cells (Rec) and puffing solutions (puff, lower panel DIC). Scale bar: 10 µm. (B) Sample traces showing postsynaptic uIPSC responding to presynaptic action potentials induced by short depolarizing voltage pulse injection (2 ms) to GABAergic neurons. (WT, black line; App-/-, red line). (C) Quantification of uIPSC amplitude shows a significant decrease in App-/- mice. (WT, n = 18 cells from five mice; App-/-, n = 17 cells from five mice). (D) Sample traces showing uIPSC recordings responding to injection of paired pulses to presynaptic GABAergic neurons (100 ms interpulse interval, left trace and 150 ms interpulse interval, right trace). (E) Quantification of paired pulse ratio (PPR) of uIPSCs with 100 ms and 150 ms interpulse intervals shows no significant difference between genotypes. (F) Sample traces showing evoked inhibitory currents responses to puffing 100 µM isoguvacine. (G) Quantification of isoguvacine-evoked inhibitory current amplitudes shows a significant decrease in App-/- mice. (WT, n = 14 cells from three mice; App-/-, n = 14 cells from three mice). (H) Representative immunoblots of hippocampal extracts from WT and App-/- littermates. (I) Quantification of the immunoblots reveals a significant decrease of GABAAR α1, but not other GABAAR subunits, levels in App-/- mice. Representative immunoblots of western blotting were from single experiment using three pairs hippocampal lysates, two repeats. *p<0.05; Student’s t-test.
-
Figure 2—source data 1
Contains source data for Figure 2 and all accompanying Figure 2—figure supplements 1,2.
- https://doi.org/10.7554/eLife.20142.006
Figure 2—figure supplement 1
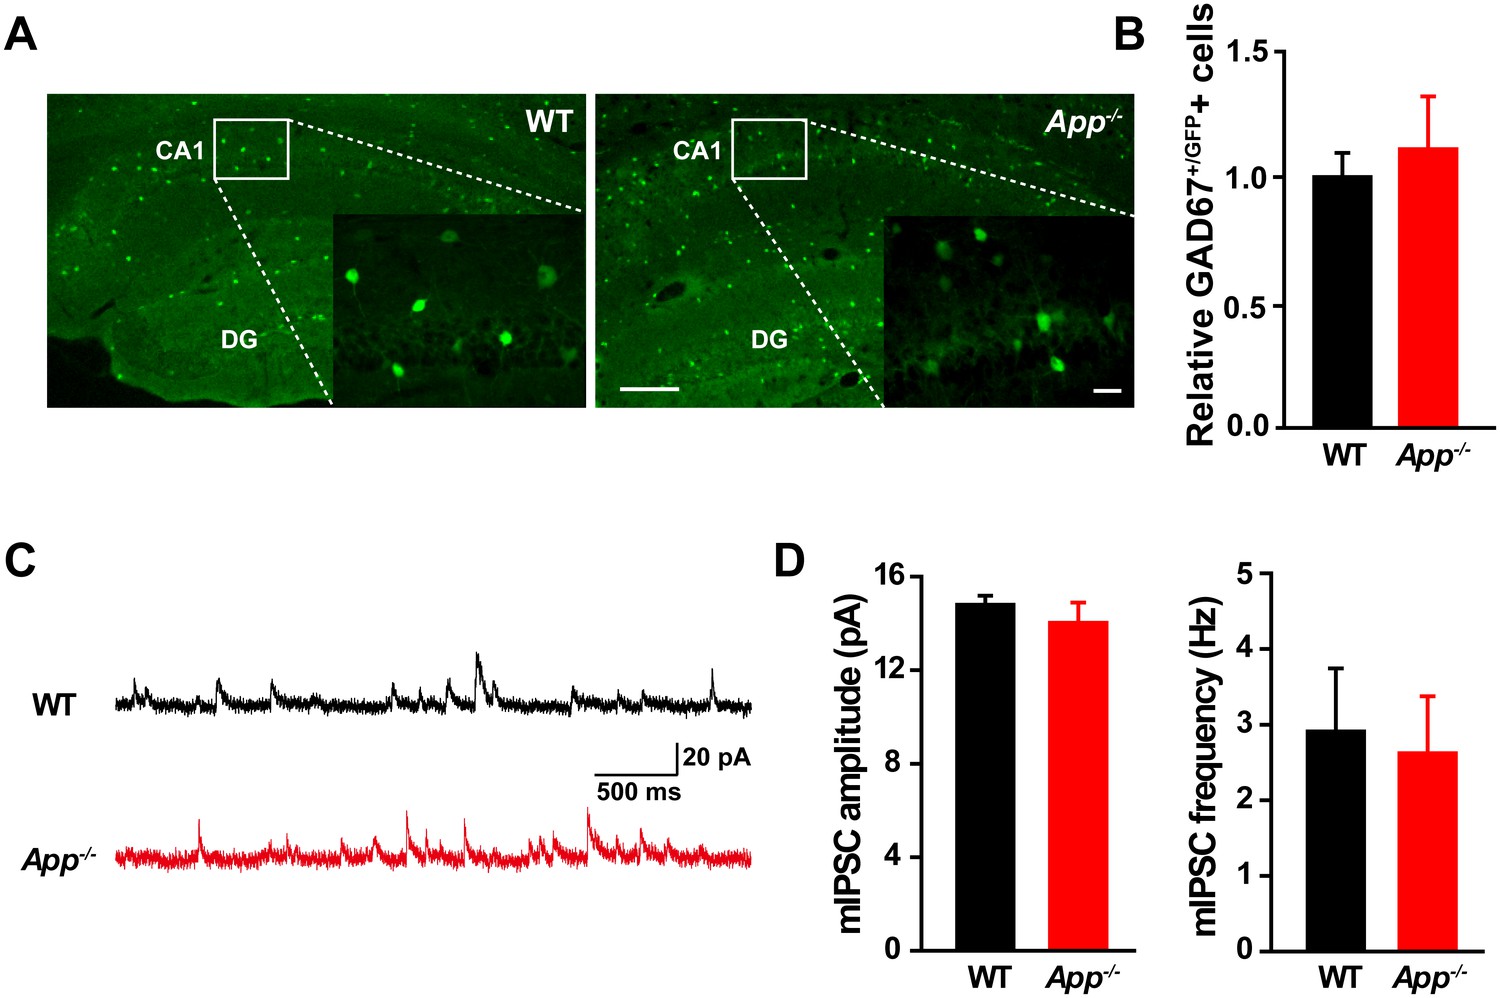
Similar numbers of GABAergic interneurons and mIPSC in WT and App-/- hippocampus.
(A) Images of hippocampal sections from App-/--Gad67+/GFP and WT-Gad67+/GFP littermates. Scale bar: 400 µm; Enlarge: 20 µm. (B) Quantification shows no difference in the number of GABAergic interneuron between WT and App-/- hippocampus. Each value represents the mean±SEM of at least three sections per genotype, two mice/genotype. (C) Sample traces showing mIPSCs from App-/- and WT littermates. (D) Quantification of the amplitude and frequency of mIPSCs shows no significant difference between WT and App-/- mice (WT, n = 16 cells from three mice; App-/-, n = 15 cells from three mice). Student’s t-test.
Figure 2—figure supplement 2
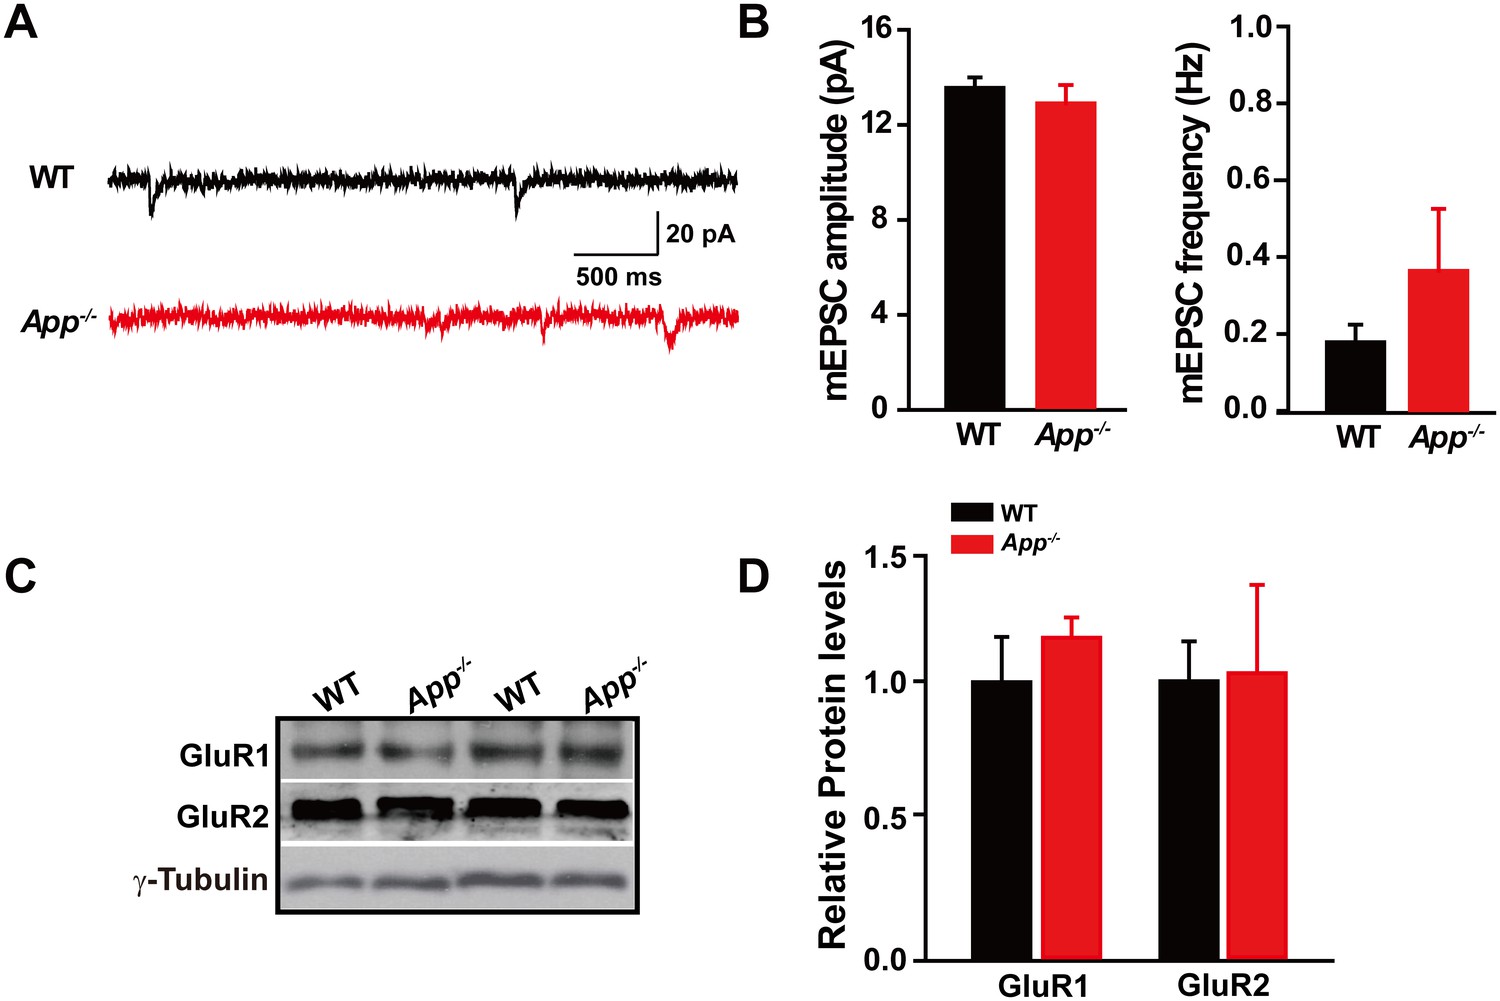
Identical mEPSC and GluRs levels in between WT and App-/- hippocampus.
(A) Sample traces showing mEPSCs from App-/- and WT littermates. (B) Quantification of the amplitude and frequency of mEPSCs shows no significant difference between WT and App-/- mice (WT, n = 7 cells from three mice; App-/-, n = 9 cells from three mice). (C) Representative immunoblots of hippocampal extracts from WT and App-/- littermates. (D) Quantification of the immunoblots reveals identical GluR1 and GluR2 levels in between WT and App-/- hippocampus. Representative immunoblots were obtained using three pairs of hippocampal lysates of two independent experiments. Student’s t-test.
Figure 3
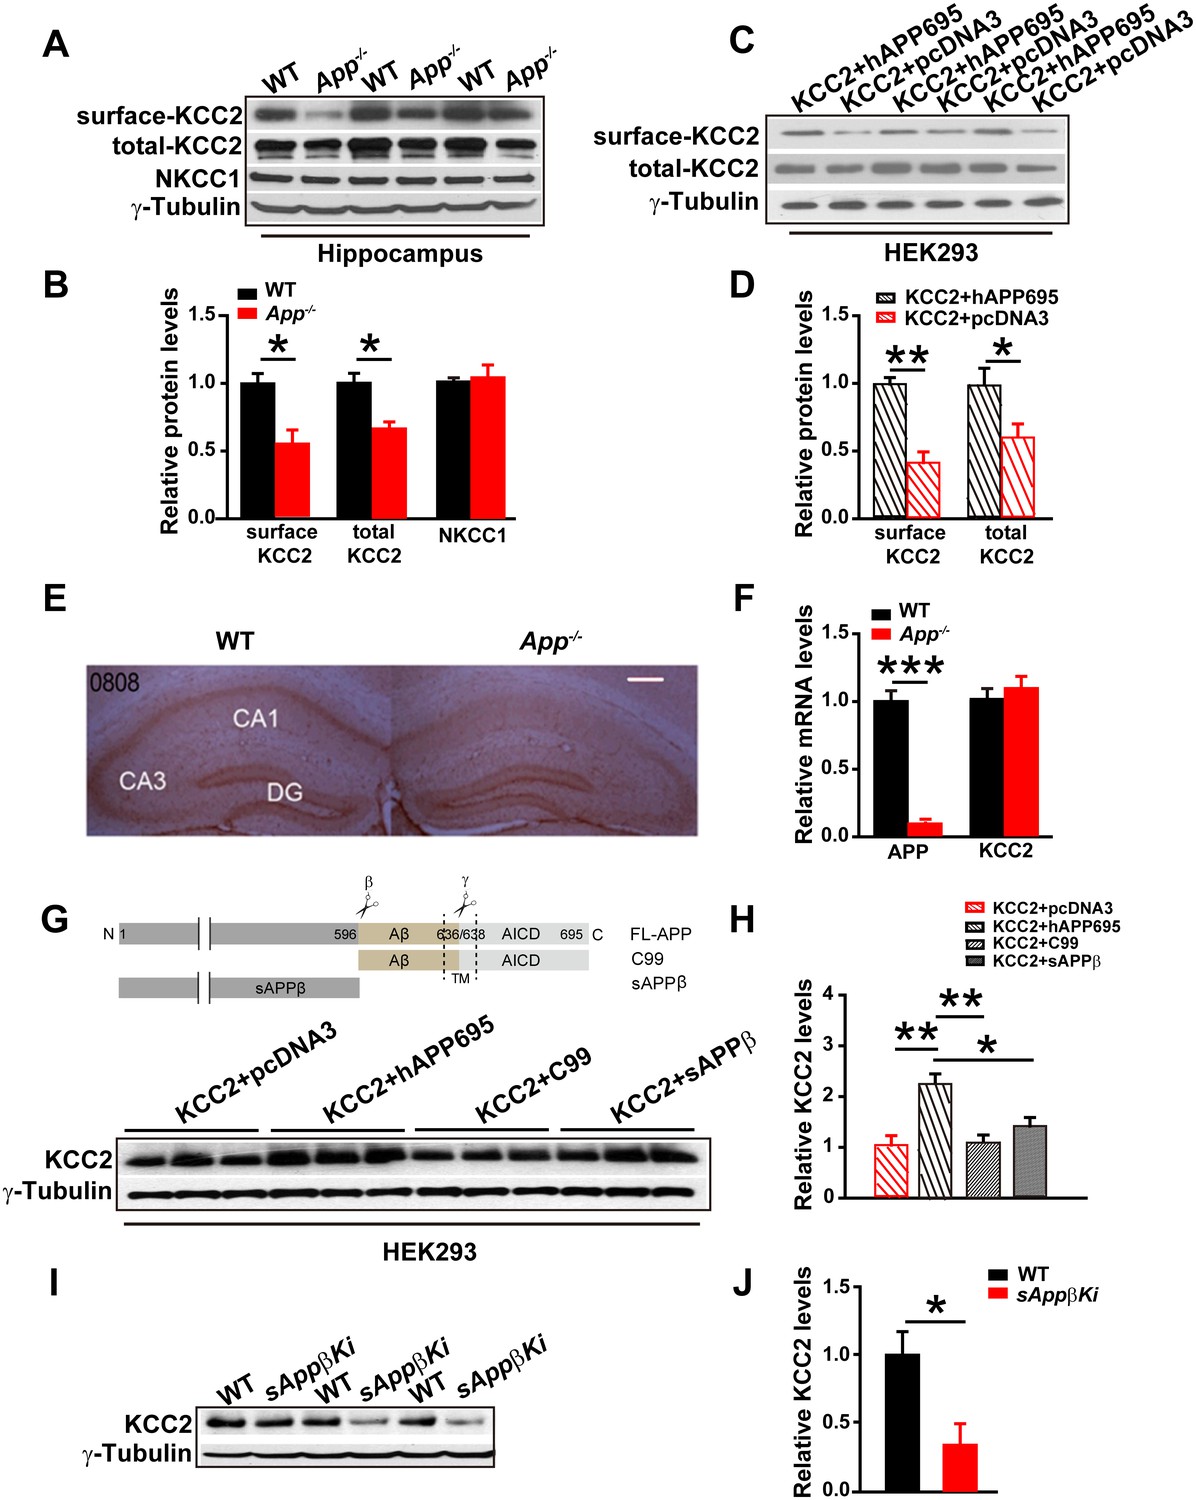
Full length APP is required for maintaining normal total and surface KCC2 protein levels.
(A) Representative immunoblots of hippocampal extracts from WT and App-/- littermates. (B) Quantification of the immunoblots reveals a significant decrease in surface and total KCC2 protein levels in App-/- mice, while NKCC1 expression levels remain unchanged. Representative immunoblots of western blotting were from single experiment using three pairs of hippocampal lysates, three independent experiments (C) Representative immunoblots of HEK293 cells transfected with KCC2 and hAPP695. (D) Quantification shows surface and total KCC2 protein levels are elevated when HEK293 cells are transfected with both constructs. (E) DAB staining for KCC2 in hippocampal sections from App-/- and WT littermates shows decreased KCC2 levels in CA1 of hippocampus in App-/- mice. Scale bar: 400 µm. (F) qRT-PCR displays similar KCC2 mRNA levels in WT and App-/- hippocampus. APP mRNA serves as a positive control. Each value represents the mean±SEM of at least three samples per genotype. (G) Representative immunoblots of transfected HEK293 cells. (H) Quantification of the immunoblots reveals an increase in KCC2 levels when we co-transfect hAPP695, but not when co-transfect with C99 or with sAPPβ. (I) Representative immunoblots of hippocampal extracts from sAppβKi and WT littermates. (J) Quantification of the immunoblots reveals a significant decrease of KCC2 protein levels in sAppβKi mice. Representative immunoblots were from single experiment using three pairs of HEK293 cells/ or hippocampal lysates, two repeats. *p<0.05; **p<0.01; **p<0.001; Student’s t-test.
-
Figure 3—source data 1
Contains source data for Figure 3.
- https://doi.org/10.7554/eLife.20142.010
Figure 4 with 1 supplement
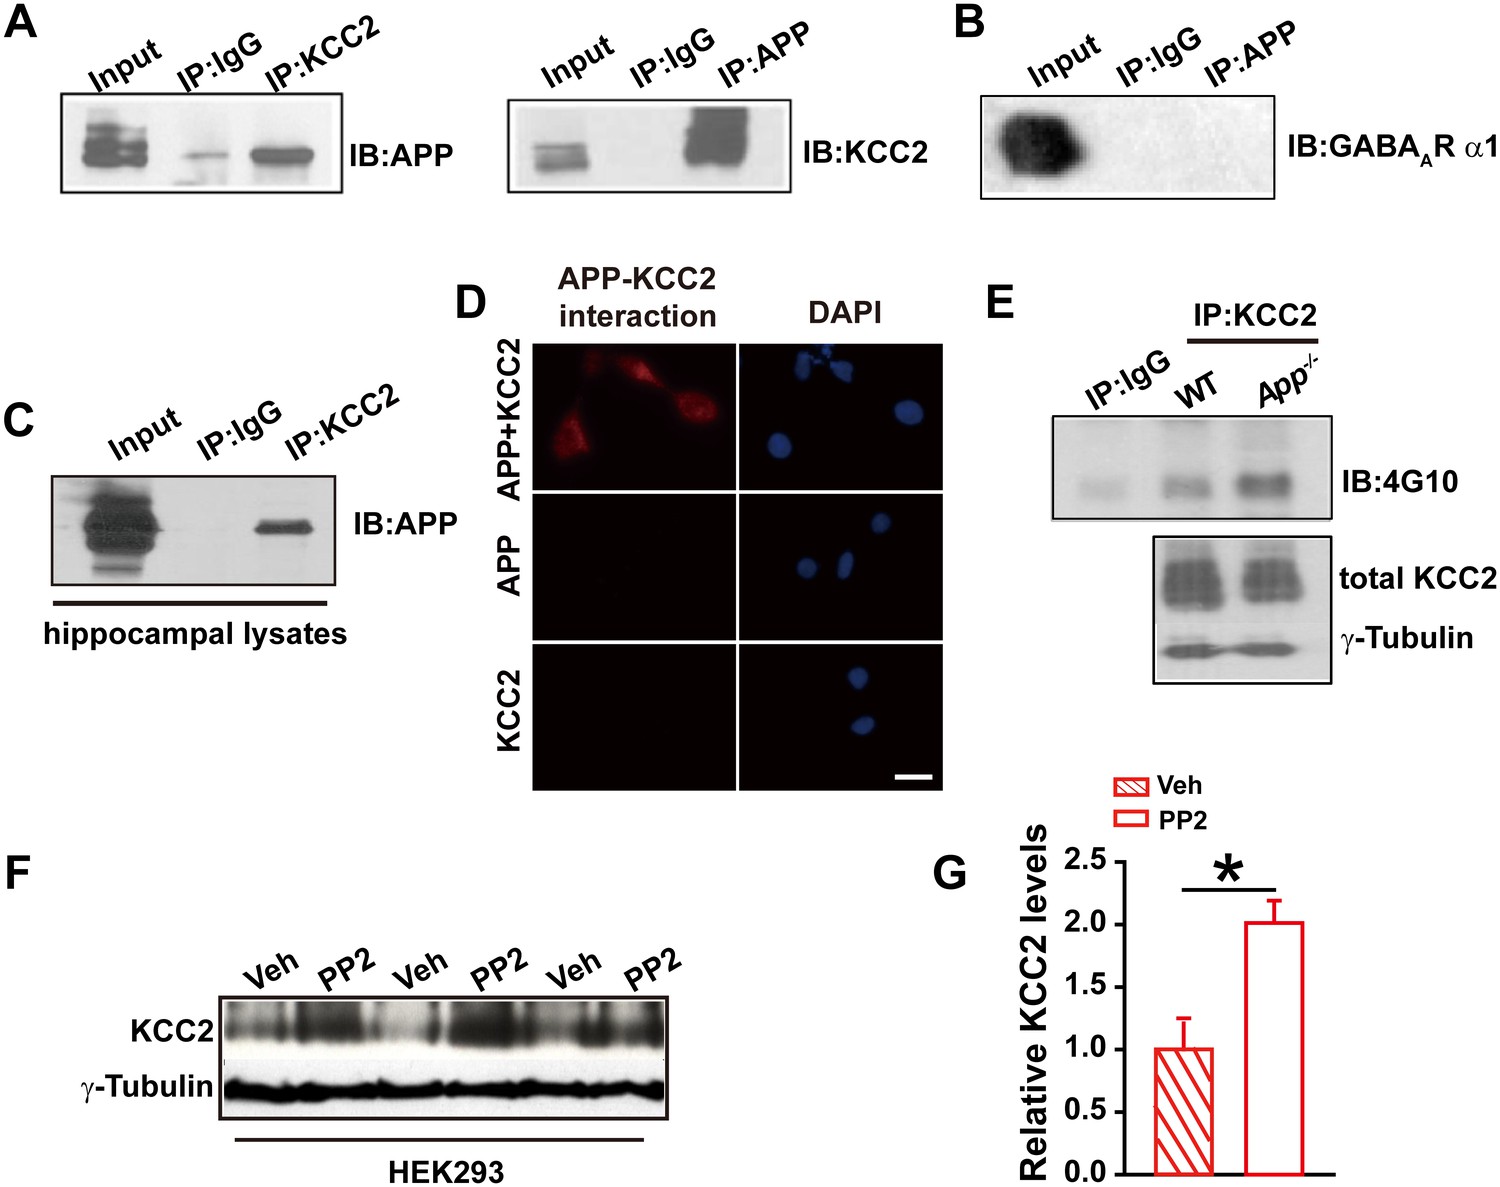
APP interacts with KCC2 to limit KCC2 tyrosine phosphorylation and degradation.
(A) KCC2 interacts with APP in HEK293 cells by co-IP with both KCC2 and APP antibodies. Rabbit IgG (IP: IgG) was used as a negative control. (B) GABAAR α1 subunit does not coimmunoprecipitate with APP. (C) KCC2 interacts with APP by co-IP in hippocampal lysates. (D) KCC2 interacts with APP by proximity ligation assay (PLA). HEK293 cell was transfected with APP and KCC2, APP alone or KCC2 alone. Red: PLA signal indicates an existence of APP-KCC2 interaction; Blue: DAPI. Scale bar: 20 µm. (E) Hippocampal extracts from WT and App-/- littermates were immunoprecipitated with an anti-KCC2 antibody (IP: KCC2) and probed with 4G10 antibody (anti-Phospho-tyrosine). Tyrosine phosphorylation of KCC2 is increased in App-/- mice. Total KCC2 levels are also decreased in App-/- mice. (Extracts were from three mice per genotype). (F) Representative immunoblots of KCC2 transfected HEK293 cells incubated with PP2 or vehicle. (G) Quantification of the immunoblots reveals a significant increase in KCC2 protein levels in PP2 treated HEK293 cells. Representative immunoblots of western blotting were from single experiment using three pairs of HEK293 lysates, two repeats. *p<0.05; Student’s t-test.
-
Figure 4—source data 1
Contains source data for Figure 4.
- https://doi.org/10.7554/eLife.20142.012
Figure 4—figure supplement 1
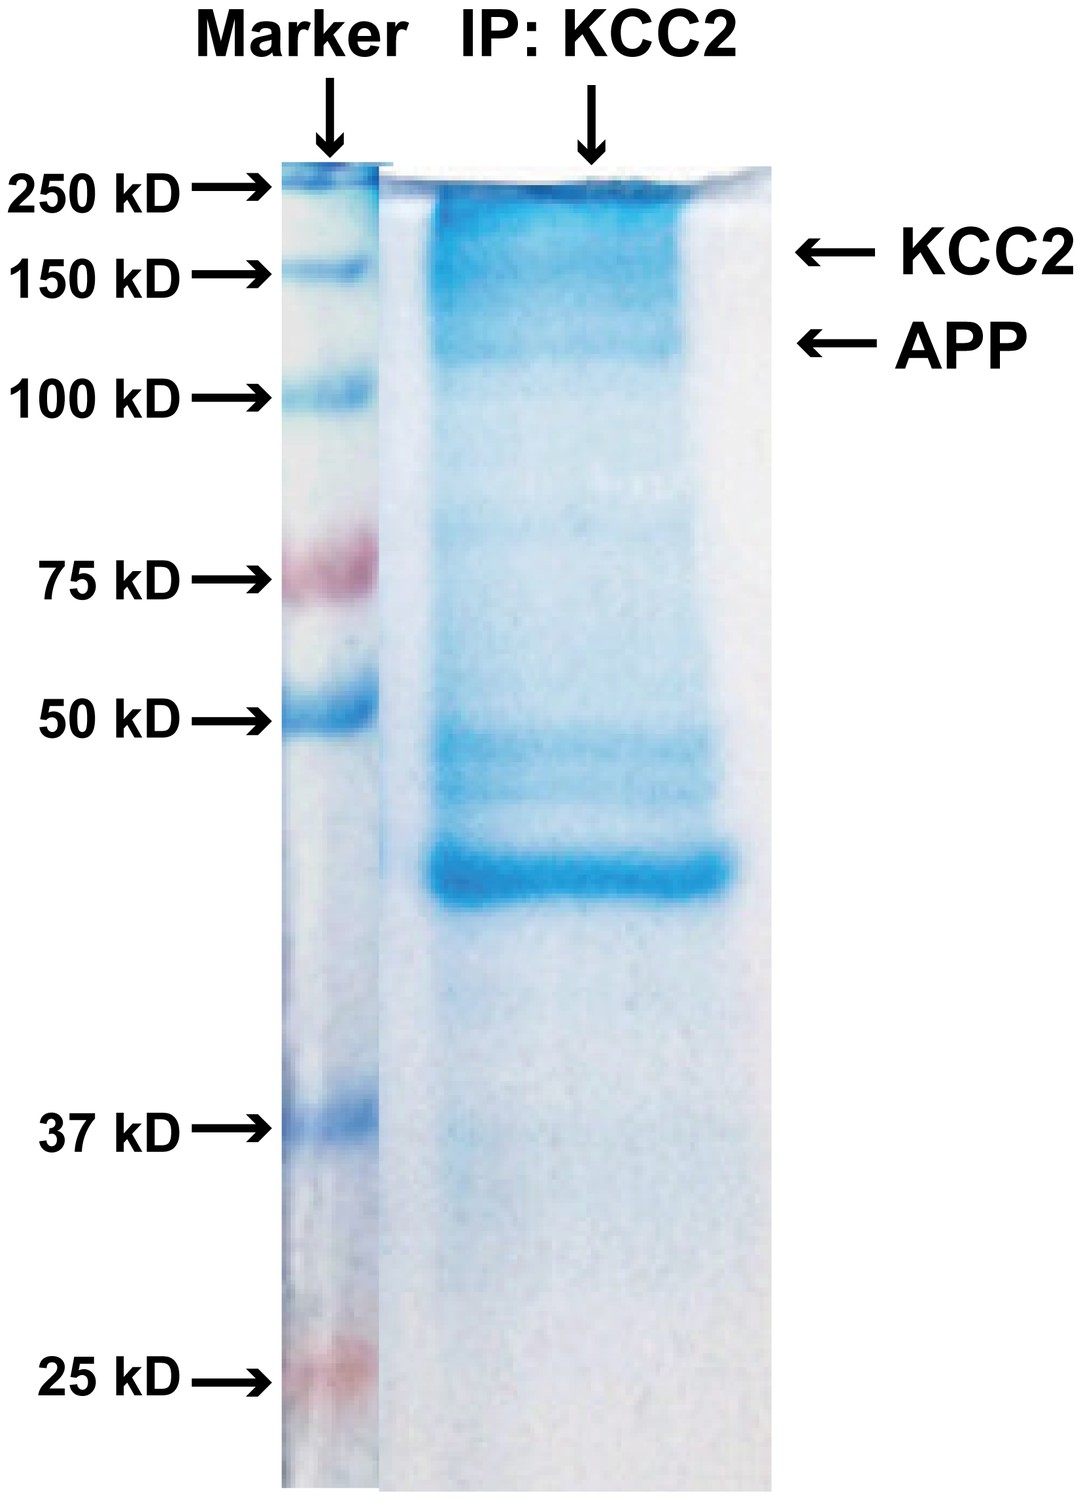
Coomassie-stained SDS-PAGE gel showing KCC2 binding proteins after immunoprecipitated with an anti-KCC2 antibody (IP: KCC2).
https://doi.org/10.7554/eLife.20142.013
Figure 5
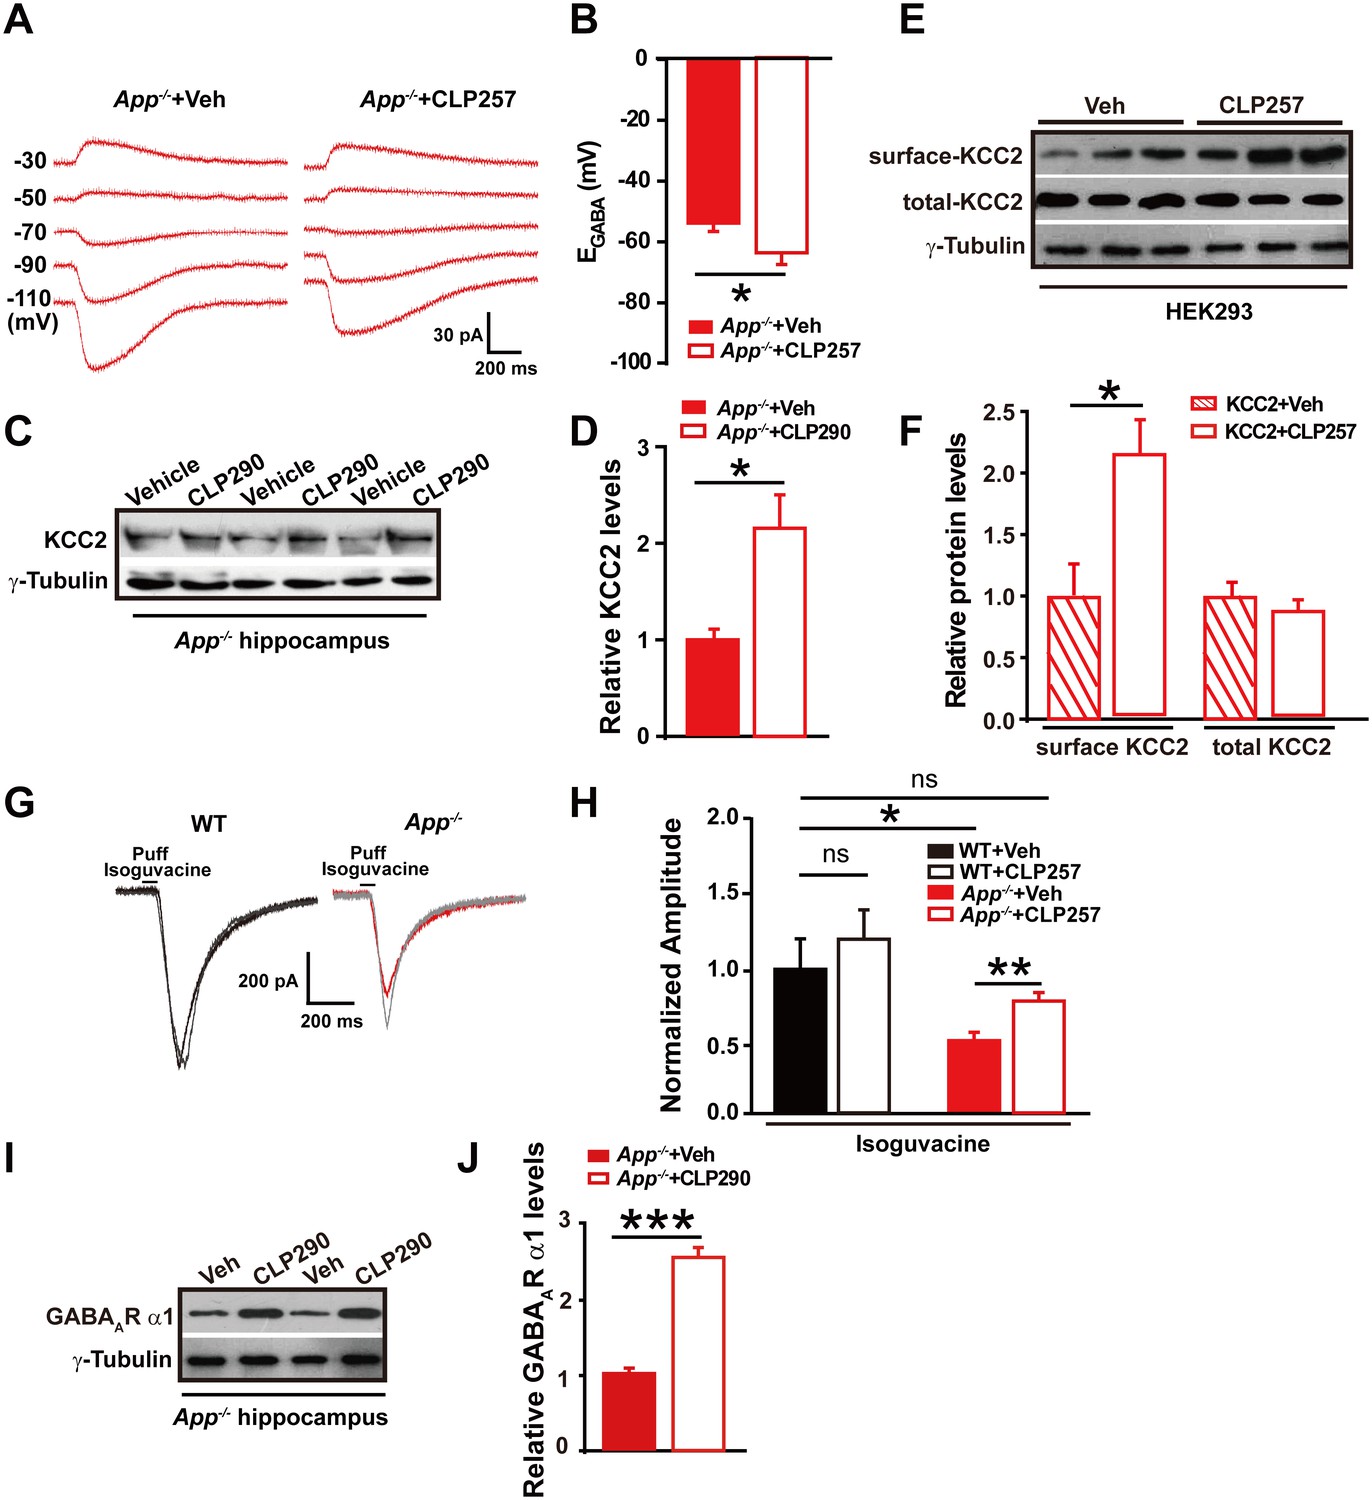
Restoring KCC2 expression and function in App-/- mice rescues hippocampal EGABA, GABAAR expression and IPSC amplitude.
(A) Sample traces showing perforated patch recording of EGABA in CLP257 or vehicle treated App-/- hippocampal slices. Currents were recorded at the indicated holding potentials shown to the left of each trace. (B) Quantification of EGABA shows a significant hyperpolarizing shift in App-/- in CLP257 treated slices compared to vehicle controls (CLP257, n = 5 cells from three mice; Control, n = 5 cells from three mice). (C) Representative immunoblots of hippocampal extracts from App-/- treated with CLP290 or vehicle. (D) Quantification of the immunoblots reveals increased KCC2 protein levels in CLP290 treated App-/- mice. (E) Representative immunoblots of HEK293 cells transfected with KCC2 incubated with CLP257 or vehicle. (F) Quantification of the immunoblots reveals a significant increase in surface KCC2 protein levels when treated with CLP257, while total KCC2 levels remain unchanged, suggesting CLP257 might regulate KCC2 activity through blocking the latter’s turnover. (G) Sample traces of evoked inhibitory currents in response to puffs of 100 µM isoguvacine. (H) Quantification of isoguvacine-evoked inhibitory current amplitudes shows a significant increase in CLP257 treated App-/- hippocampus compared to vehicle controls (CLP257, n = 15 cells from three mice; Control, n = 15 cells from three mice), but no difference between CLP257 treated WT hippocampus and vehicle treated controls (CLP257, n = 9 cells from three mice; Control, n = 11 cells from three mice), suggesting that restoring KCC2 function rescues GABAAR mediated responses. (I) Representative immunoblots of hippocampal extracts from App-/- treated with CLP290 or vehicle. (J) Quantification of the immunoblots reveals increased GABAAR α1 protein levels in CLP290 treated App-/- mice. Representative immunoblots of western blotting were from single experiment using three pairs of HEK293 cells/ or hippocampal lysates of two independent experiments. *p<0.05; **p<0.01; ***p<0.001; Student’s t-test; quantified data of H, two-way ANOVA with post hoc tests.
-
Figure 5—source data 1
Contains source data for Figure 5.
- https://doi.org/10.7554/eLife.20142.015
Figure 6 with 1 supplement
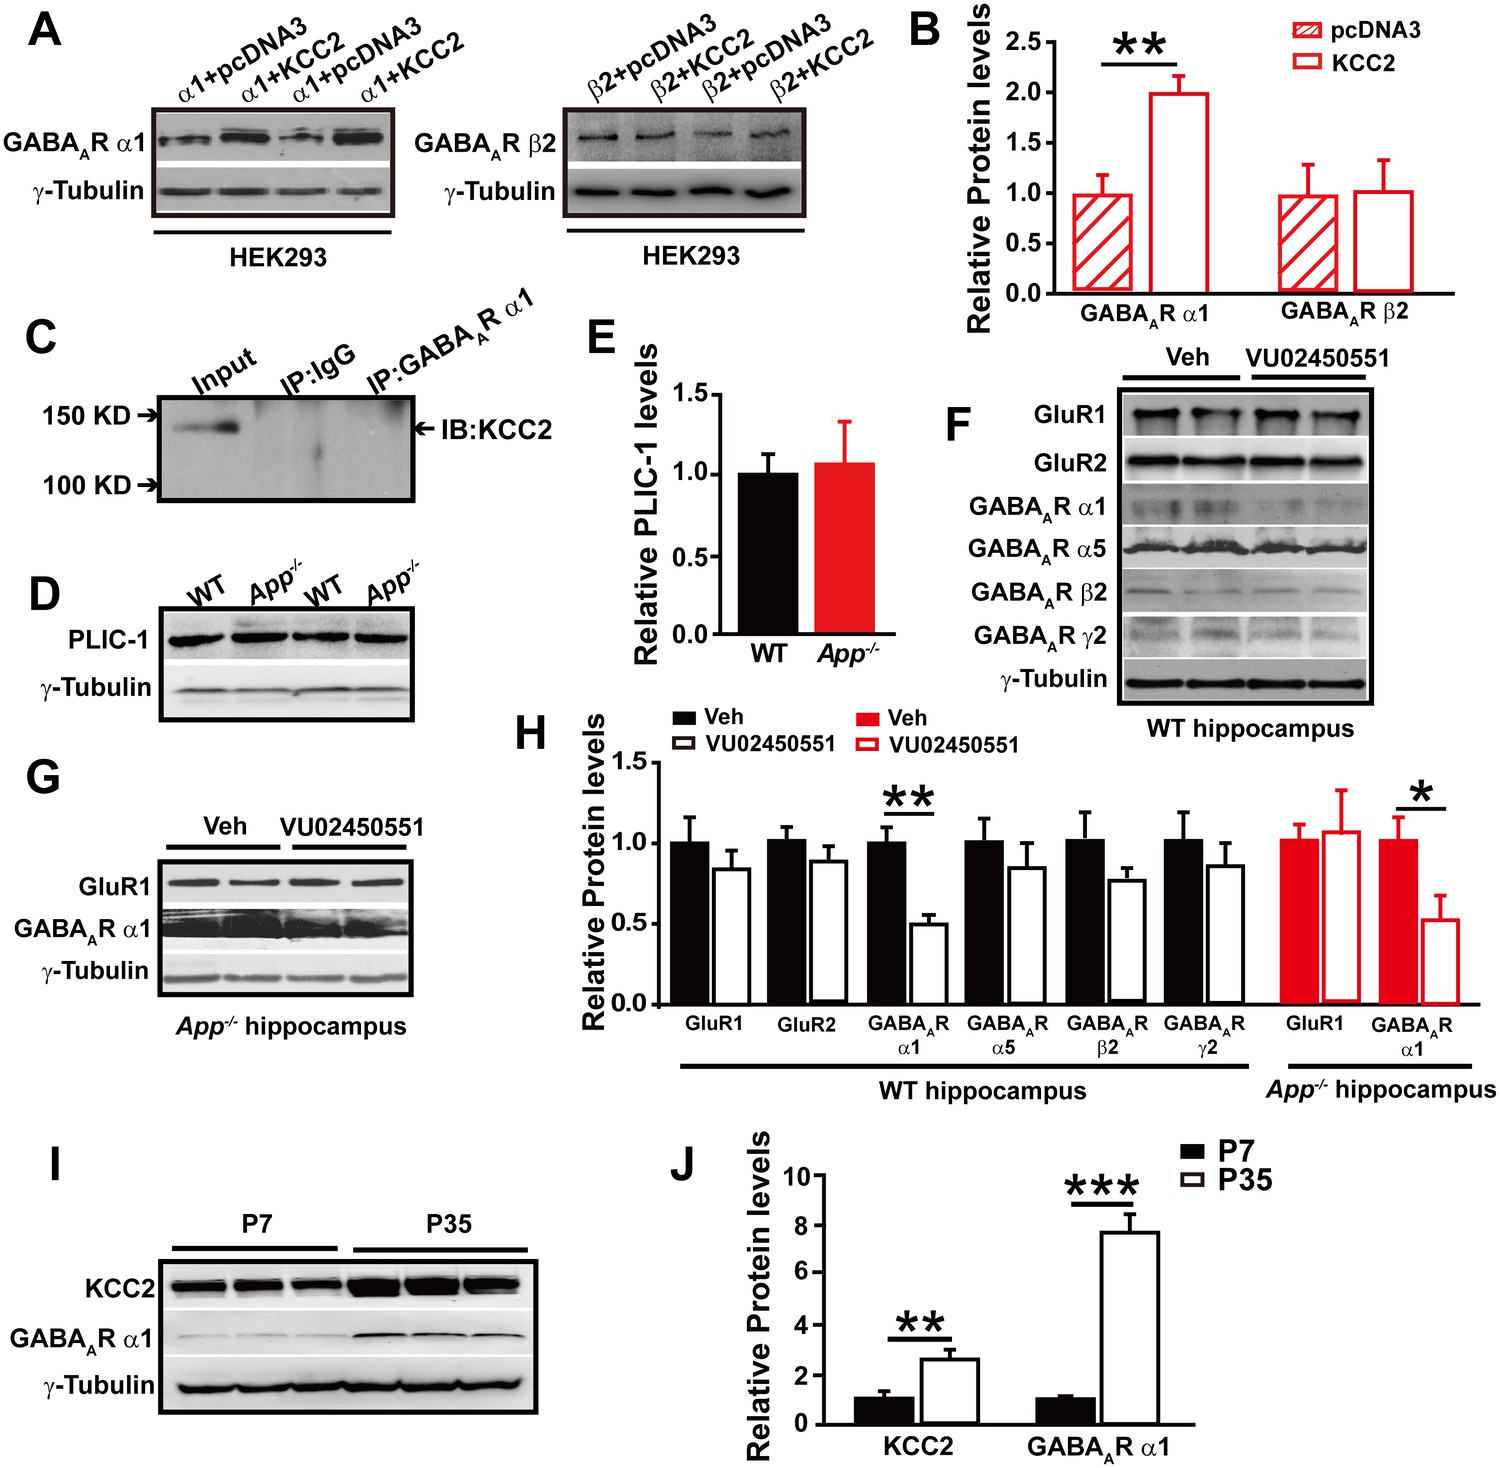
GABAAR α1 subunit is regulated by KCC2 expression through affecting intracellular Cl-.
(A) Representative immunoblots of GABAAR α1+KCC2, GABAAR α1+pcDNA3, GABAAR β2+KCC2, GABAAR β2+pcDNA3, transfected HEK293 cells blotted with anti-GABAAR antibodies. (B) Quantification of the immunoblots reveals a significant increase in GABAAR α1 levels in HEK293 cells co-transfected with GABAAR α1 and KCC2, indicating KCC2 positively regulates expression of GABAAR α1. (C) GABAAR-α1 does not co-immunoprecipitate with KCC2, suggesting that there was no protein-protein interaction between KCC2 and GABAAR α1. (D) Representative immunoblots of hippocampal extracts from WT and App-/- littermates. (E) Quantification of the immunoblots reveals identical PLIC-1 levels in between WT and App-/- hippocampus. (F) Representative immunoblots of WT hippocampal slices incubated with a KCC2 inhibitor, VU02450551, or vehicle. (G) Representative immunoblots of App-/- hippocampal slices incubated with a KCC2 inhibitor, VU02450551, or vehicle. (H) Quantification of the immunoblots reveals a significant decrease only in GABAAR α1 levels of hippocampal tissue treated with VU02450551. (I) Representative immunoblots of hippocampal extracts from P7 and P35 WT mice. (J) Quantification of the immunoblots reveals significantly increased KCC2 and GABAAR α1 levels in P35 compared to P7 WT mice. Representative immunoblots of western blotting were from single experiment using three pairs of HEK293 cells/ or hippocampal lysates, two repeats. *p<0.05; **p<0.01; ***p<0.001; Student’s t-test.
-
Figure 6—source data 1
Contains source data for Figure 6.
- https://doi.org/10.7554/eLife.20142.017
Figure 6—figure supplement 1
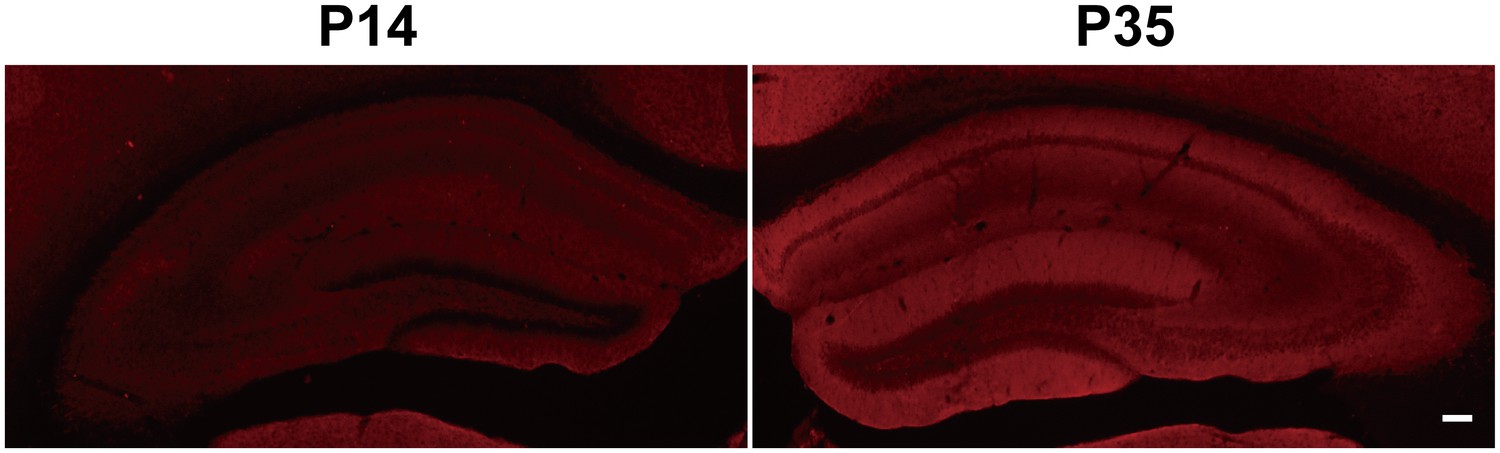
Immunofluorescent staining of hippocampal KCC2 in P14 and P35 WT mice shows increased KCC2 levels in P35 WT mice.
Scale bar: 100 µm.
Figure 7
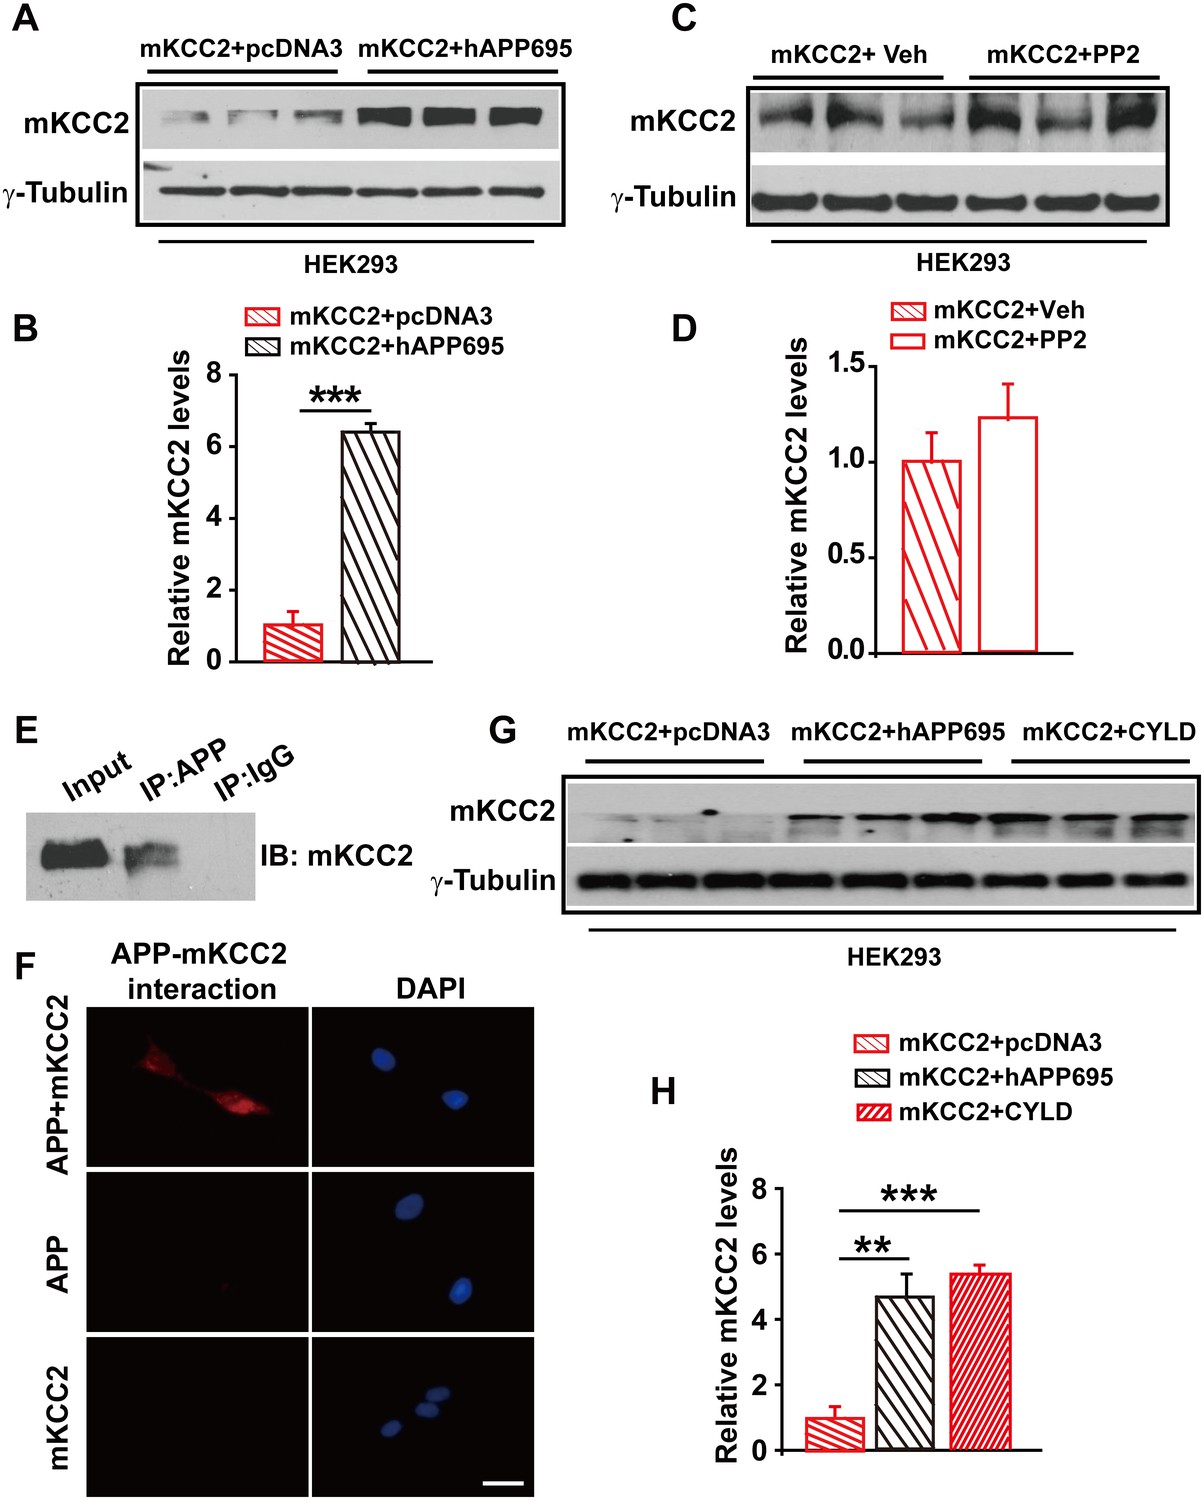
APP interacts with mKCC2 to limit mKCC2 ubiquitination and degradation.
(A) Representative immunoblots of HEK293 cells transfected with mKCC2 and hAPP695. (B) KCC2 protein levels are elevated when HEK293 cells are transfected with both constructs. (C) Representative immunoblots of mKCC2 transfected HEK293 cells incubated with PP2 or vehicle. (D) Quantification of the immunoblots reveals identical KCC2 protein levels in between PP2 treated HEK293 cells and vehicle control. (E) mKCC2 interacts with APP. Rabbit IgG (IP: IgG) was used as a negative control. (F) PLA shows that mKCC2 interacts with as well. HEK293 cell were transfected with both APP and mKCC2, APP alone, or mKCC2 alone. Red: PLA signal indicates an existence of APP-mKCC2 interaction; Blue: DAPI. Scale bar: 20 µm. (G) Representative immunoblots of transfected HEK293 cells. (H) Quantification of the immunoblots reveals a significantly increased KCC2 protein levels in HEK293 cell transfected with hAPP695 and CYLD, respectively. Representative immunoblots of western blotting were from single experiment using three pairs of lysates, two repeats. **p<0.01; ***p<0.001; Student’s t-test.
-
Figure 7—source data 1
Contains source data for Figure 7.
- https://doi.org/10.7554/eLife.20142.020
Figure 8

APP deficiency causes an increase in KCC2 ubiquitination leading to a reduction of KCC2 levels.
(A) Representative immunoblots of HEK293 cells transfected with mKCC2 alone, mKCC2 and hAPP695, incubated with MG132 or vehicle. (B) Quantification of the immunoblots reveals a significantly increased mKCC2 levels in HEK293 cell transfected with mKCC2 alone and incubated with MG132. (C) Representative immunoblots of HEK293 cells transfected with KCC2 alone (incubated with MG132); KCC2 and hAPP695. (D) Quantification of the immunoblots reveals a significantly increased KCC2 protein levels in KCC2 alone with MG132 incubation, which is similar to co-transfection of hAPP695 and KCC2, compared to KCC2 alone incubated with vehicle. (E) Representative immunoblots of supernatant before and after IP pull down of KCC2 in WT and App-/- mice. (F) Hippocampal extracts from WT and App-/- littermates immunoprecipitated with an anti-KCC2 antibody (IP: KCC2) and probed with ubiquitin antibody. Ubiquitinated KCC2 is obviously increased in App-/- compared to WT mice (Each extract was from three mice per genotype, repeated twice). (G) Representative immunoblots of App-/- hippocampus incubated with MG132 or vehicle. (H) Quantification of the immunoblots reveals a significantly increased KCC2 protein levels in MG132 treated App-/- hippocampus implicating KCC2 underwent ubiquitination in the absence of APP. (I) Representative immunoblots of surface KCC2 levels of HEK293 cells and App-/- hippocampus incubated with MG132 or vehicle. (J) Quantification of the immunoblots reveals a significantly increased surface KCC2 levels in MG132 treated compared to vehicle control. Representative immunoblots of western blotting were from single experiment using three pairs of HEK293 cells/ or hippocampal lysates, two repeats. *p<0.05; ***p<0.001; Student’s t-test.
-
Figure 8—source data 1
Contains source data for Figure 8.
- https://doi.org/10.7554/eLife.20142.022
Figure 9

Reduced tonic GABA current in CA1 of App-/- hippocampus.
(A) Sample traces of tonic GABA current in WT, App-/- and App-/- incubated with 100 μM CLP257. (B) Quantification of tonic GABA current amplitude shows a significant decrease in App-/- mice and CLP does not rescue tonic GABA current in App-/- hippocampus (WT, n = 10 cells from five mice; App-/-, n = 10 cells from five mice; App-/-+CLP257, n = 9 cells from five mice). *p<0.05; **p<0.01; one-way ANOVA.
-
Figure 9—source data 1
Contains source data for Figure 9.
- https://doi.org/10.7554/eLife.20142.024
Figure 10
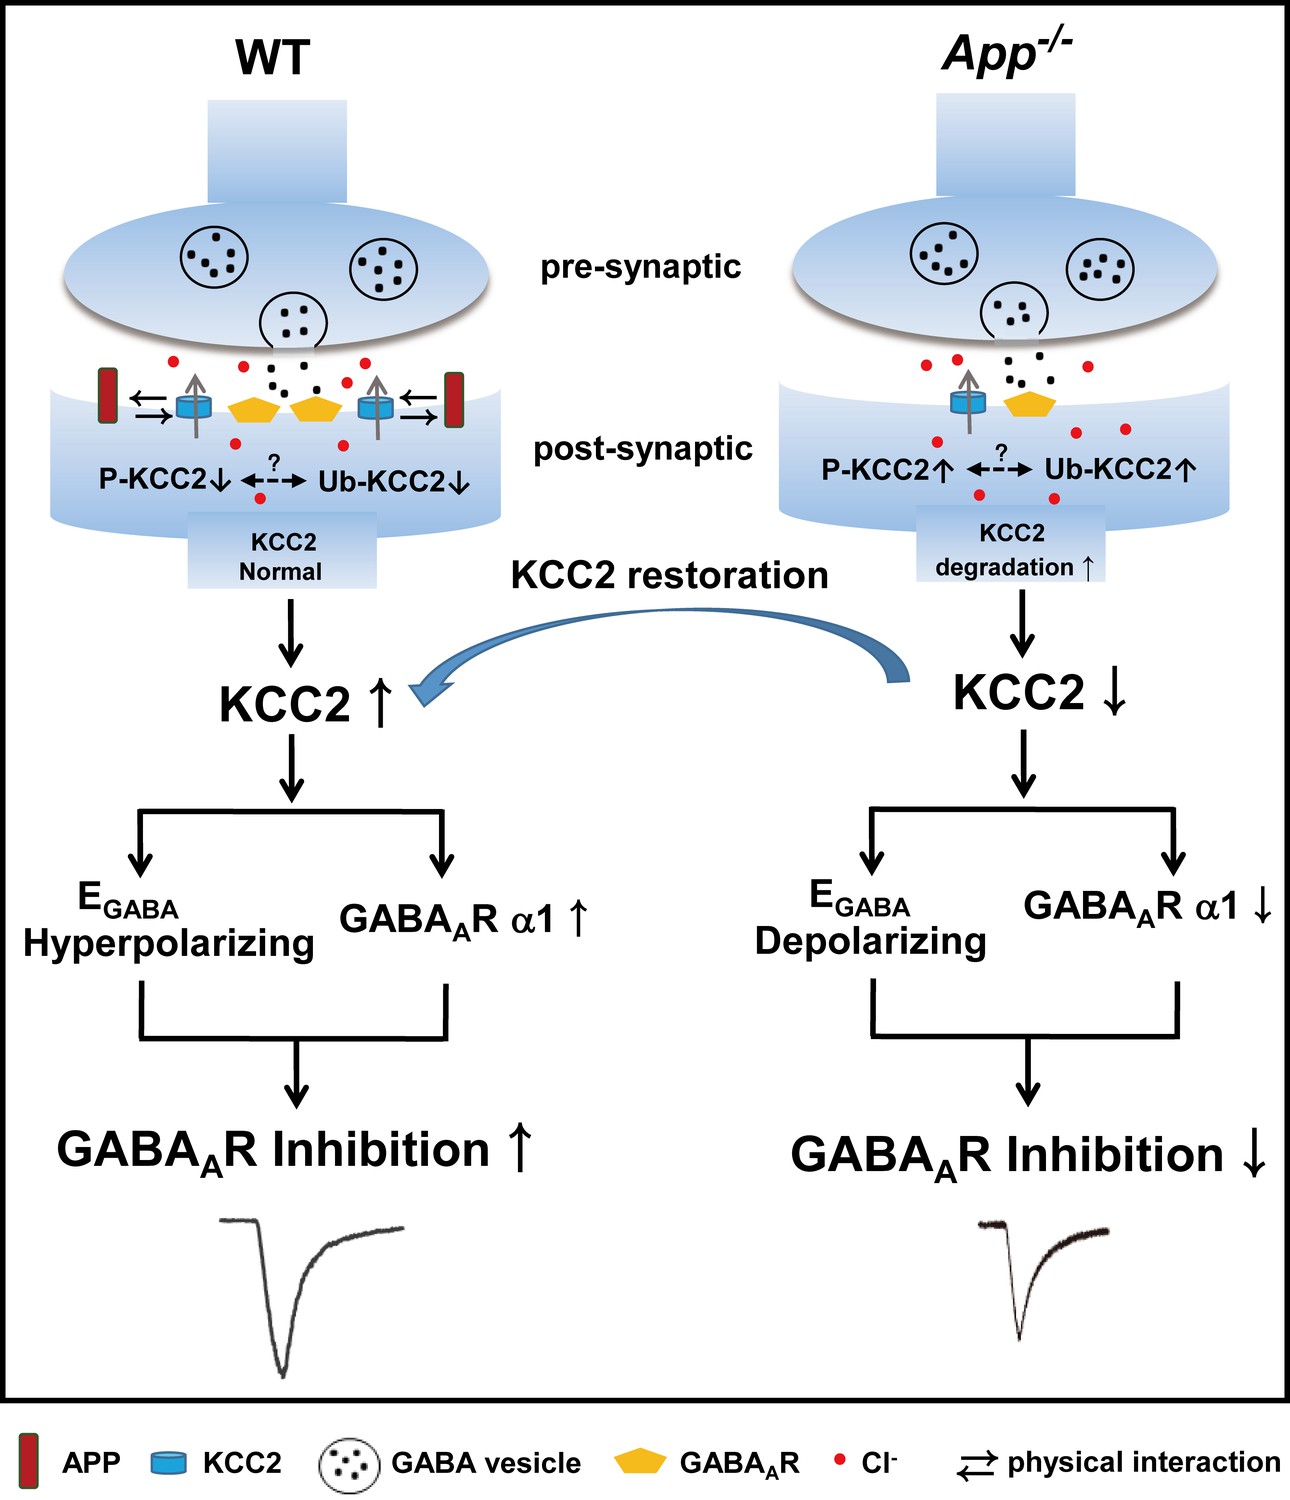
A working model shows the mechanism underlying APP regulation of GABAAR mediated inhibition.
KCC2 transports Cl- outside the neuron maintaining low [Cl-]i in mature neurons and therefore insures an Cl- influx upon GABA binding to the GABAARs. APP and KCC2 physically interacts to limit tyrosine phosphorylation, ubiquitination and sequential degradation of KCC2 to maintain abundant membrane KCC2 levels and hyperpolarizing EGABA in WT hippocampal neuron. APP deficiency leads to a loss of limit on tyrosine phosphorylation and ubiquitination of KCC2 and thus reduces KCC2 protein levels, resulting in depolarizing shift of EGABA, reduction of GABAAR α1 and GABA mediated inhibition, which can be rescued by restoration of KCC2 expression and function.
Download links
A two-part list of links to download the article, or parts of the article, in various formats.
Downloads (link to download the article as PDF)
Open citations (links to open the citations from this article in various online reference manager services)
Cite this article (links to download the citations from this article in formats compatible with various reference manager tools)
APP modulates KCC2 expression and function in hippocampal GABAergic inhibition
eLife 6:e20142.
https://doi.org/10.7554/eLife.20142


