Drosophila non-muscle myosin II motor activity determines the rate of tissue folding
- Massachusetts Institute of Technology, United States
- National Heart, Lung, and Blood Institute, National Institutes of Health, United States
Figures
Figure 1 with 2 supplements

Biochemical characterization of RLC-TS and RLC mutants.
(A) Domain organization of the myosin heavy chain and myosin fragments used to study the biochemical properties of myosin. The top panel shows the myosin hexamer composed of two myosin heavy chains (green), two ELCs (light blue) and two RLCs (gray). The myosin motor domain, the light chain binding neck and the tail domain of the heavy chain are indicated. The bottom panel shows the double headed HMM fragment. The rational for the different myosin fragments lies in the different biochemical properties: Full-length myosin forms filaments, sediments at high speed and can be used in the in vitro motility assay. The HMM fragment is soluble under physiological salt concentrations and suitable to study kinetic properties, the interaction with actin, and regulatory properties including RLC phosphorylation. (B) Multiple sequence alignment of RLCs from different model organisms and RLC mutants. (Top) Sequence alignment showing the high degree of conservation between RLCs from different model organisms. Identical amino acids are colored brown. The primary phosphorylation site of MLCK corresponds to Serine-21 (orange), the secondary phosphorylation site to Threonine-20 (yellow) of the Drosophila RLC. (Bottom) Alignment showing the mutant RLCs used in this study and the respective amino acid substitutions at the sites corresponding to Threonine-20 and Serine-21 of the Drosophila RLC. Alanine replacements are shown in blue, Glutamate replacements in red. Alanine replacement in RLC-AA is expected to mimic the unphosphorylated RLC state, Glutamate replacement in RLC-EE the di-phosphorylated RLC state. RLC-AE is expected to mimic the mono-phosphorylated RLC state that is independent from upstream regulation, whereas RLC-AS and RLC-TA are phosphorylatable and coupled to upstream signaling in vitro and in vivo. Abbreviations used: Mm: Mus musculus, Myl9 (NP_742116.1): Rn: Rattus norvegicus, Myl9 (XP_006235463.1); Hs: Homo sapiens, Myl9 (CAG33124.1); Xl: Xenopus laevis, Myl9 (NP_001087016.1); Dr: Danio rerio, Myl9b (NP_998377.1); Dm: Drosophila melanogaster, Sqh (NP_511057.1). (C) Actin-activated ATP hydrolysis rate of RLC-TS and RLC mutants. Gray bars indicate the ATP hydrolysis rate at an actin concentration of 100 µM in the absence of RLC phosphorylation. Orange bars indicate the ATP hydrolysis rate at an actin concentration of 100 µM after RLC phosphorylation with MLCK, also indicated by a lowercase p. Note that the myosin activity in these assays are even lower than shown since direct actin-mediated hydrolysis of ATP likely accounts for a substantial portion of the ATPase of the unphosphorylated and mutant samples. (D) In vitro motility assay using RLC-TS and RLC mutants. No significant movement was observed for RLC-TS in the absence of MLCK phosphorylation and RLC-AA. n = 47–227 tracked filaments per RLC mutant. The data were corrected for the stage drift. (E) Actin cosedimentation assays of RLC-TS and RLC-AE, supernatants (S) and pellets (P) from mixtures of myosin, actin, and ATP as indicated. In the absence of actin, RLC-TS and RLC-AE remain in the supernatant. Binding of RLC-TS and RLC-AE to actin in the absence of ATP results in pelleting of the actomyosin complex. The presence of ATP disassembles the actomyosin complex and myosin mostly remains in the supernatant. The sedimentation of actin is independent of ATP. Soluble HMM fragments were used in this assay since myosin filaments sediment under the assay conditions. Red numbers indicate lanes.
Figure 1—figure supplement 1
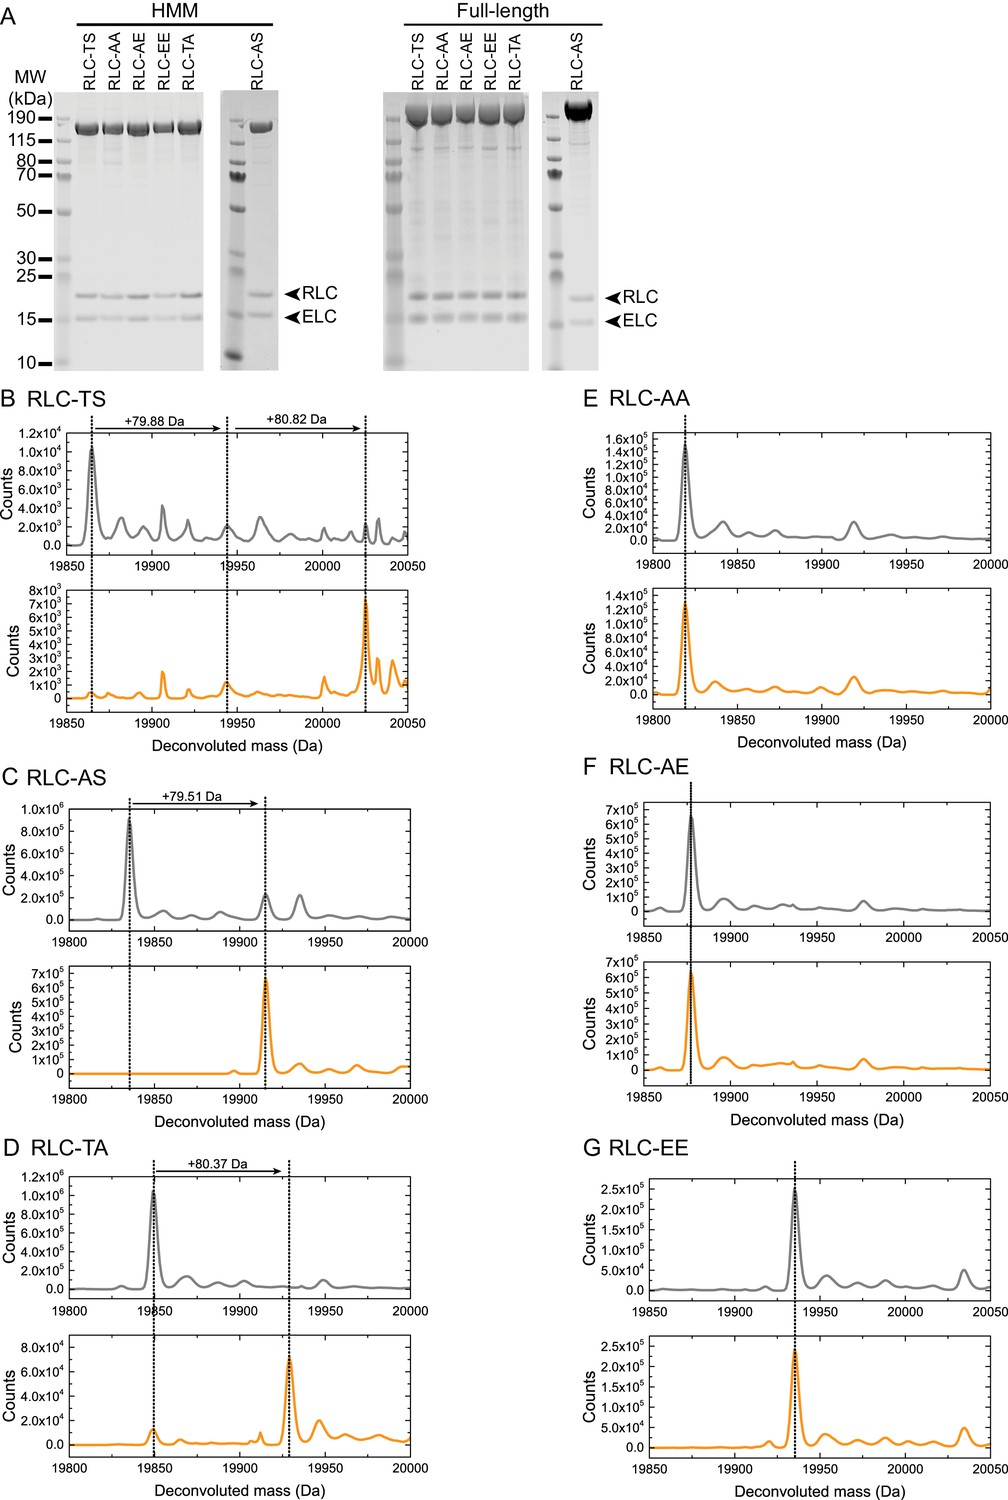
Purification and characterization of wild-type and mutant Drosophila myosin (A) PageBlue-stained 4–12% Bis-Tris gel showing recombinant HMM (160 kDa) and full-length (228 kDa) RLC-TS or RLC mutants.
RLC and mutant RLC (19 kDa) and the ELC (16 kDa) bind in a 1:1 stoichiometry to the myosin heavy chain, indicating that mutant RLCs bind with a similar affinity as RLC-TS. Data shown for RLC-AS HMM and full-length proteins are from different gels. (B–F) HPLC-mass spectrometry to detect phosphorylation events on the intact RLC. Each panel shows the deconvoluted mass spectrum of control RLC mutant (no MLCK, gray spectrum) at the top and RLC mutant after addition of MLCK (bottom, orange spectrum). A mass increase of 80 Da (HPO3 = 80 Da) corresponds to a single phosphorylation event. RLC-TS (B) can be phosphorylated by MLCK at two sites corresponding to Threonine-20 and Serine-21, RLC-AS (C) can be phosphorylated at one site corresponding to Serine-21, and RLC-TA (D) at one site corresponding to Threonine-20. No phosphorylation events are detectable for RLC-AA (E), RLC-AE (F), and RLC-EE (G) in agreement with the absence of phosphorylation sites.
Figure 1—figure supplement 2
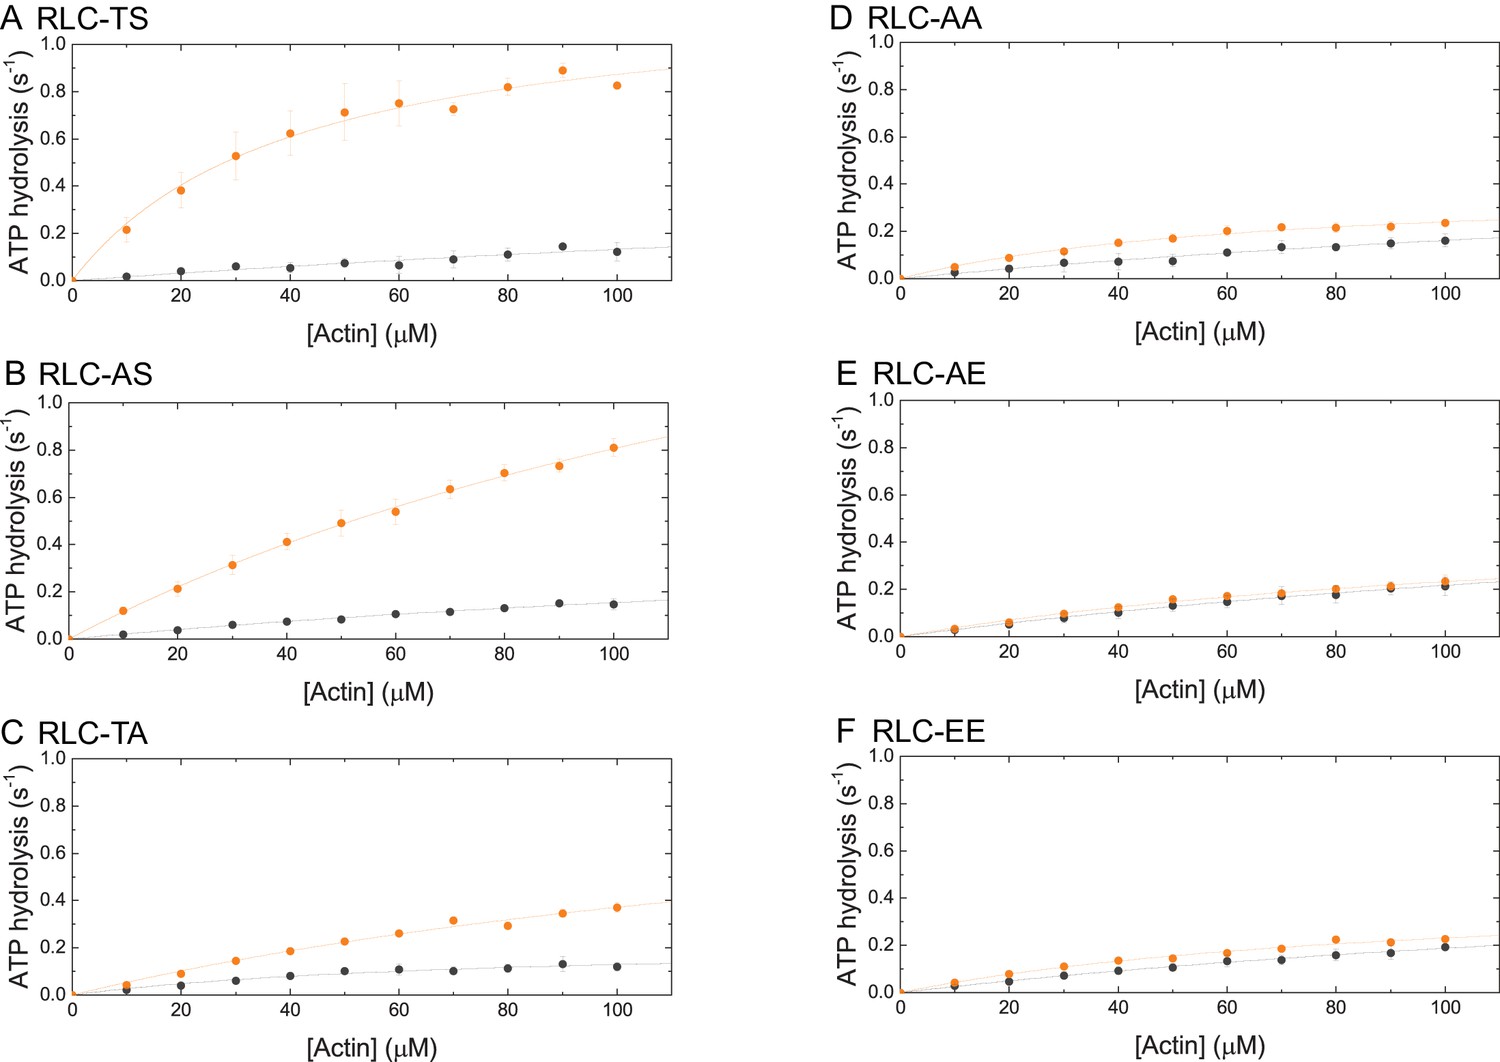
Steady-state ATP-hydrolysis of RLC-TS (A) and RLC mutants (B–F).
The dependence of steady-state ATP hydrolysis rate is plotted as a function of actin in the concentration range up to 100 µM. Data sets corresponding to the ATP hydrolysis rates in the absence of MLCK are shown in gray. Data sets corresponding to the ATP hydrolysis rates after RLC phosphorylation by MLCK are shown in orange.
Figure 2
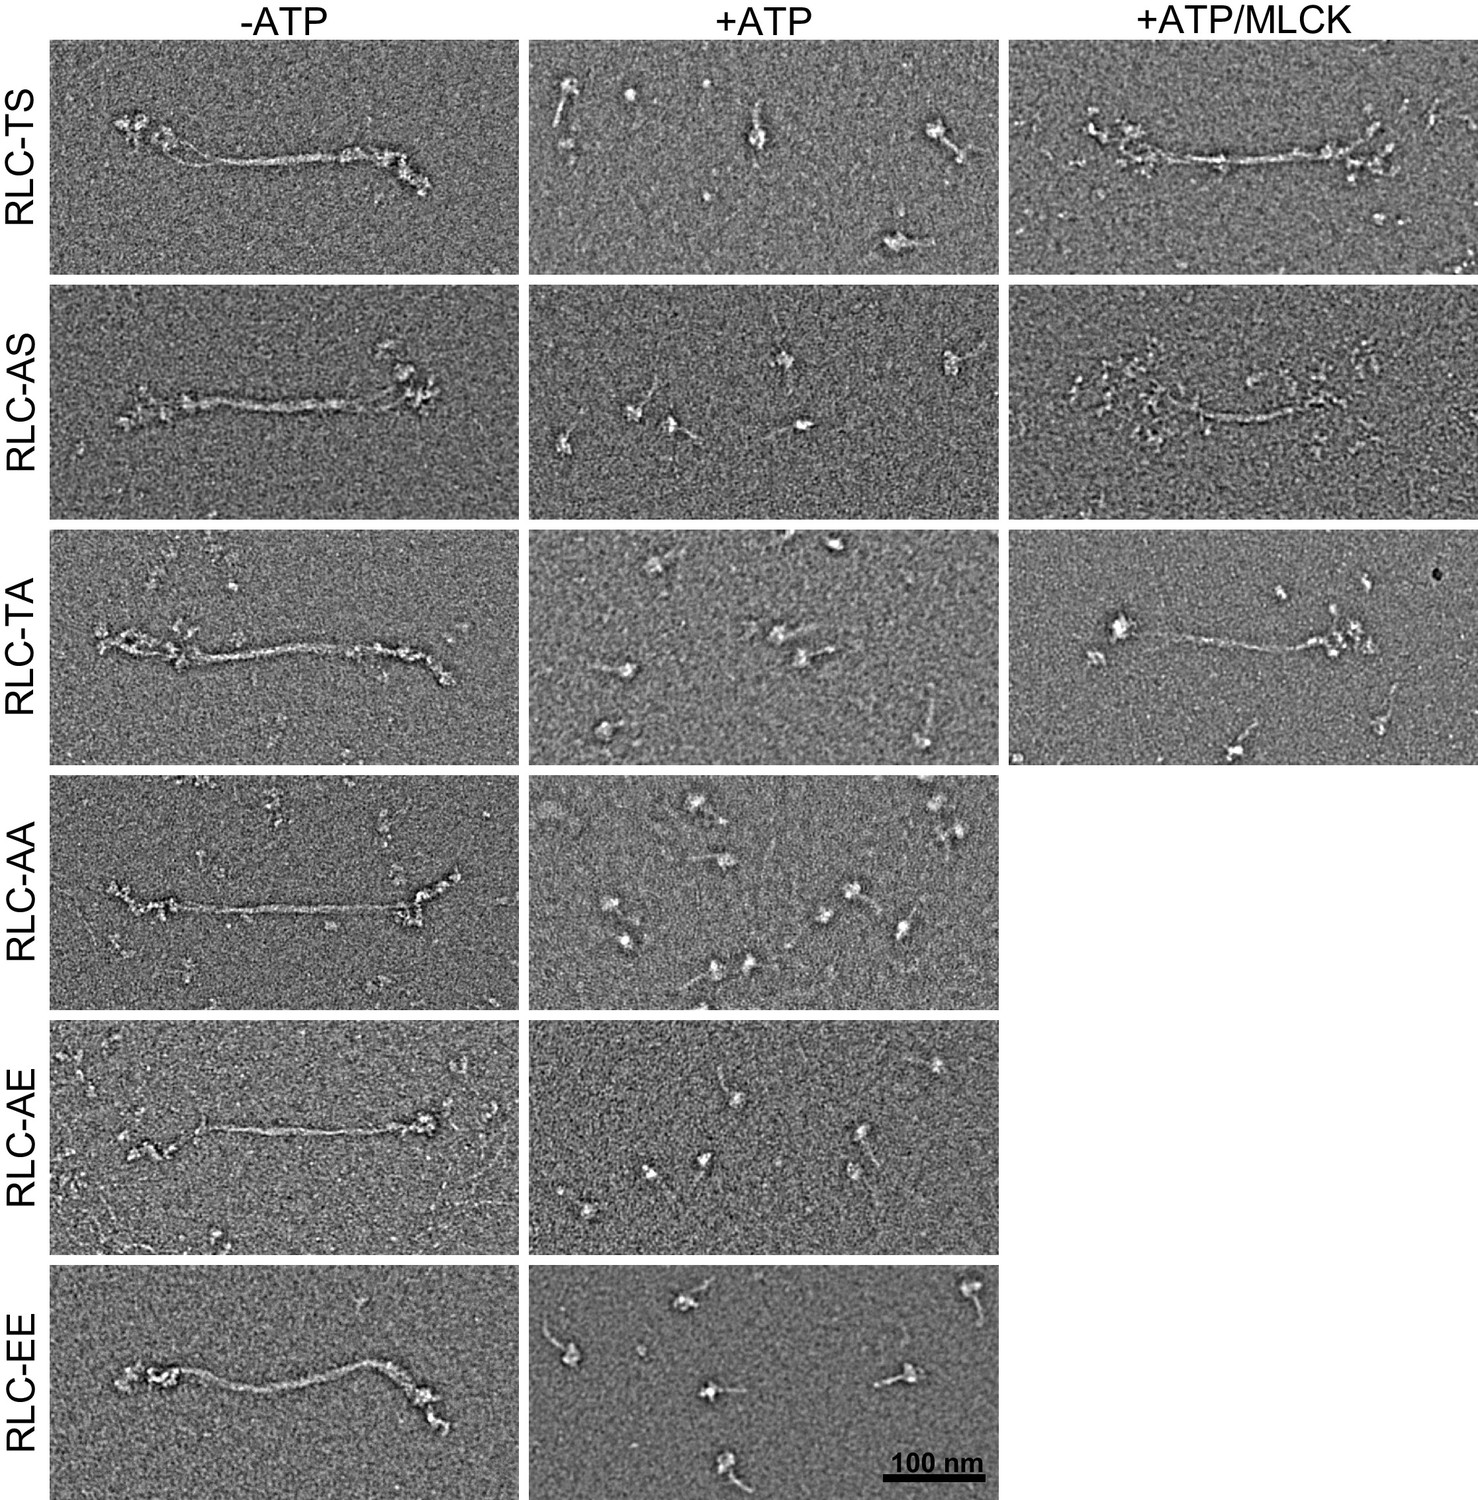
Appearance and assembly of RLC-TS and RLC mutants into filaments.
RLC-TS and RLC mutants form predominantly filaments in the absence of ATP (−ATP) and disassemble into the 10S conformation in the presence of ATP (+ATP). Phosphorylation of Threonine-20 or Serine-21, indicated +ATP/MLCK, stabilize the filaments in the presence of ATP. Scale bar = 100 nm.
Figure 3 with 1 supplement

Myosin mutants with reduced motor activity exhibit reduced tissue recoil following laser ablation.
(A–B) Myosin intensity in pair of embryos expressing RLC-TS and RLC-TA (A) or RLC-TS and RLC-AE (B) are comparable. The images represent embryos mounted side-by-side and imaged at the same time to compare myosin intensity under identical imaging conditions. Plots (right) show the peak mean intensity profile of myosin signal along a horizontal line spanning each embryo. Scale bars = 10 µm. (C) Initial wound recoil is less pronounced in tissues expressing RLC mutants than in RLC-TS tissue. Time-lapse images of embryos expressing indicated RLC mutant. Between time 0 s and 1.3 s an 8.5 μm incision in the tissue was made, indicated by the vertical yellow line. Scale bars = 5 µm. (D) Mean displacement of wound edge following tissue ablation (n = 15 RLC-TS embryos, n = 11 RLC-TA embryos, n = 10 RLC-AE embryos). Shaded area is +/− one standard deviation. (E) Initial recoil velocity is higher in RLC-TS tissue. The initial recoil velocity was calculated by fitting the displacement to a Kelvin-Voigt model and taking the derivative of the fit at time zero. Central line in box plot is the median, the box edges are the 25th and 75th percentiles, and the whiskers represent the distribution minima and maxima (n = 14 RLC-TS embryos, n = 10 RLC-TA embryos, n = 9 RLC-AE embryos).
Figure 3—figure supplement 1
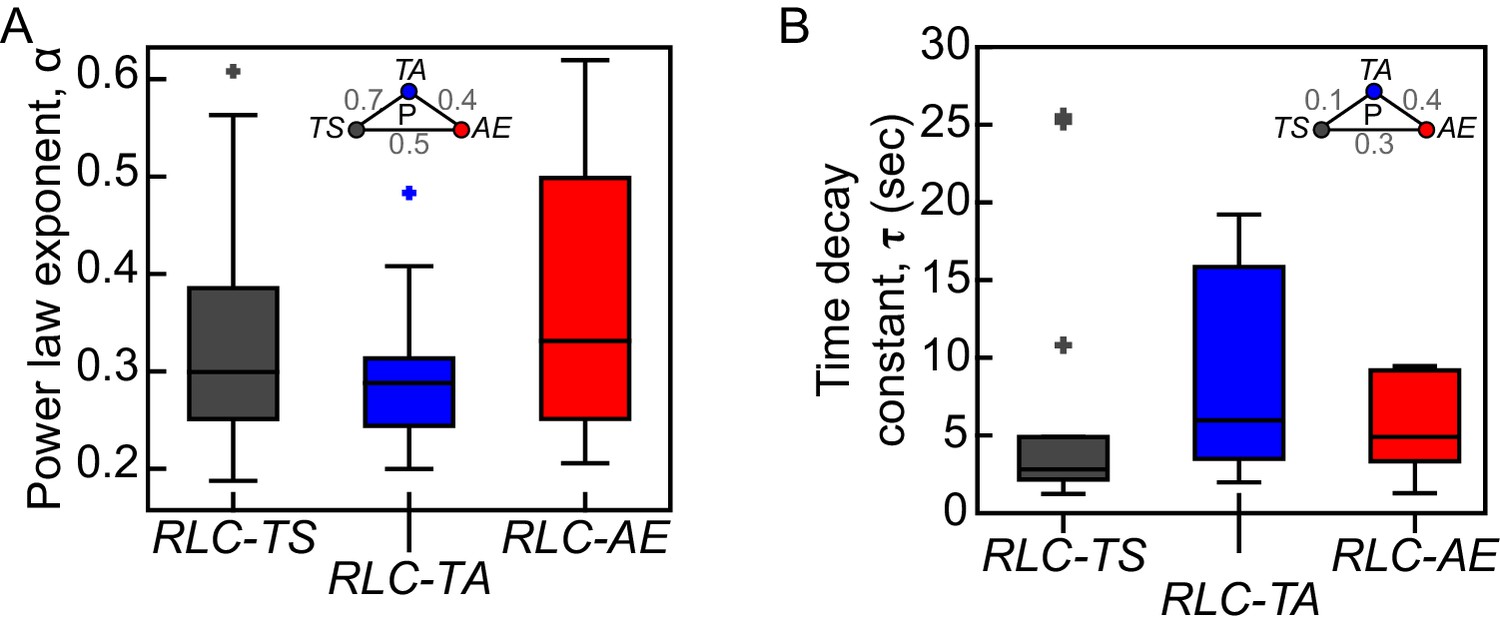
RLC-TS and RLC mutant do not exhibit clear differences in viscoelastic properties.
Exponents (α) of power laws fit (A) and time decay constants (τ) of Kelvin-Voigt fits (B) to displacements of wound edges after tissue ablation are not significantly different between RLC-TS, RLC-TA and RLC-AE tissues. Box-and-whisker plots display the median (central line), 25th and 75th percentiles (box edges), and the most extreme data points not considered outliers (whiskers) (n = 14 RLC-TS embryos, n = 10 RLC-TA embryos, n = 9 RLC-AE embryos).
Figure 4 with 1 supplement
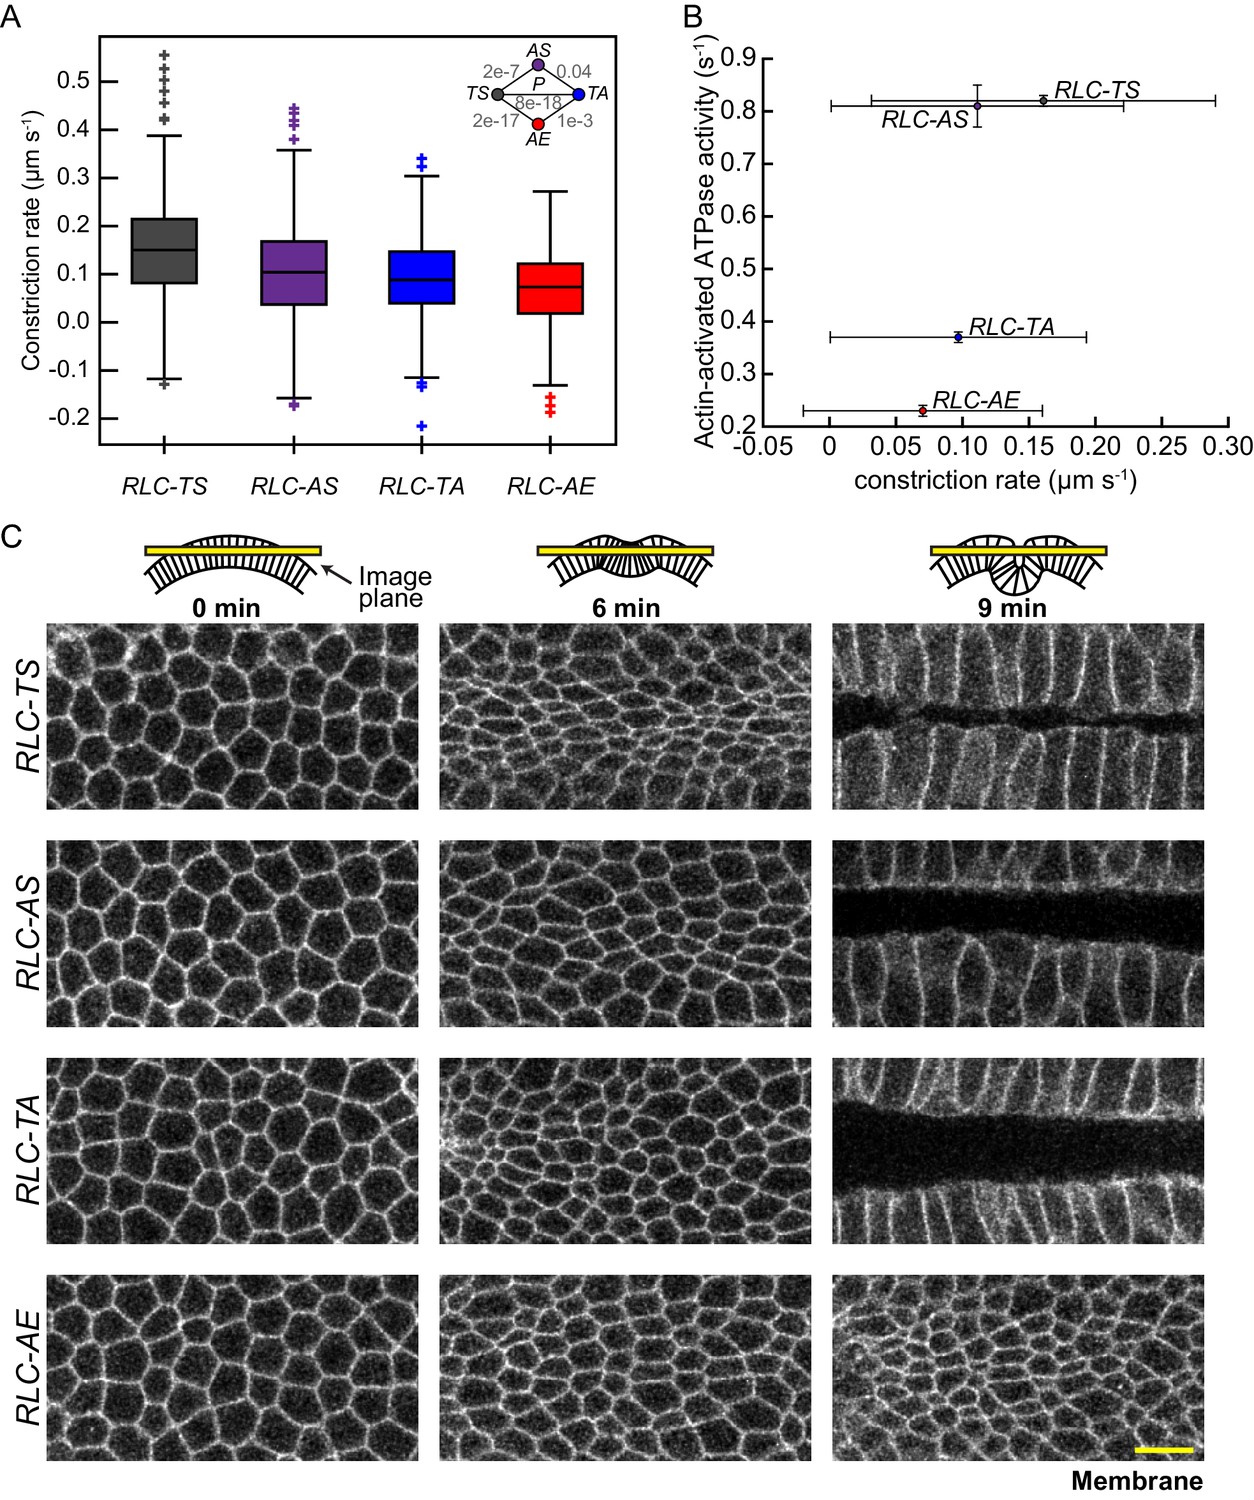
Apical constriction rate scales with measured in vitro myosin motor activity.
(A) RLC-AS, RLC-TA, and RLC-AE cells generate weaker constrictions than RLC-TS cells. Central line in box plot is the median, the box edges are the 25th and 75th percentiles, and the whiskers represent the distribution minima and maxima, not considered outliers; outliers are plotted individually (n = 338 constriction instances identified from 138 cells from two embryos for RLC-TS; n = 311 constriction instances identified 152 cells from three embryos for RLC-AS; n = 630 constriction instances identified from 268 cells from three embryos for RLC-TA; n = 265 constriction instances identified from 187 cells from three embryos for RLC-AE). (B) Constriction rate corresponds with actin-activated ATPase activity. Bars represent the standard deviation of the measurements. (C) Tissue invagination and apical constriction is slower in the RLC-TA mutant and slowest in the RLC-AE mutant. Time-lapse images are representative tissues from embryos expressing the indicated RLC mutant and Membrane::Cherry (membrane). Schematics illustrate plane images were acquired in. Scale bars = 10 μm.
Figure 4—figure supplement 1
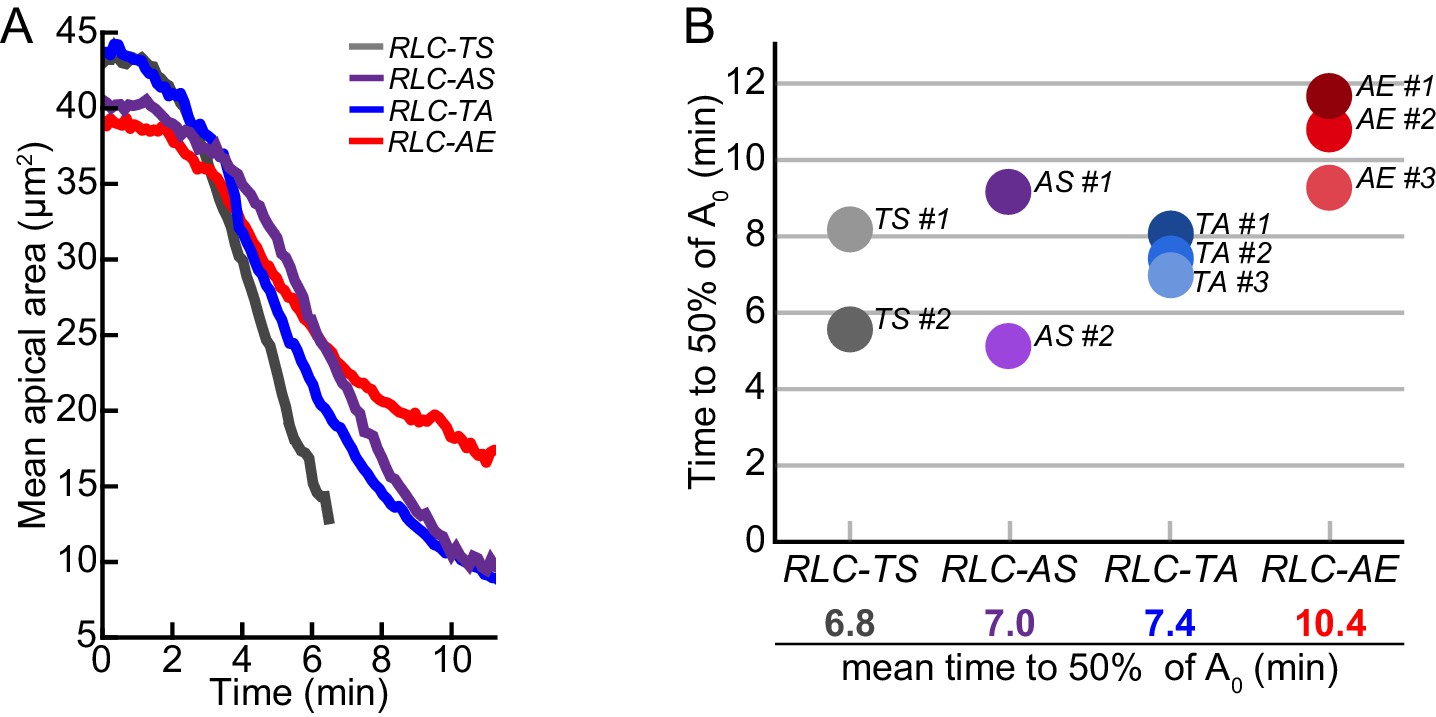
Timing of tissue contraction scales with in vitro myosin motor activity.
(A) Aligned mean apical area over time for representative embryos. (B) Time it takes for tissue contraction to 50% the starting mean apical area (A0). RLC-AE tissue constricts slowest compared to wild-type RLC-TS. Additionally, on average, RLC-TA constricts slower than RLC-AS.
Tables
Table 1
Comparison of the steady-state kinetic parameters between phosphorylated Drosophila and mammalian myosins.
Parameter | Dm myosin II* | Hs myosin IIA‡ | Hs myosin IIB ‡† | Mm myosin IIC ‡† |
|---|---|---|---|---|
kbasal (s−1) | 0.01 ± 0.001 | 0.021 ± 0.003 | <0.004 | <0.004 |
kcat (s−1) | 1.23 ± 0.07 | 0.45 ± 0.03 | 0.17 ± 0.04 | 0.18 ± 0.04 |
Kapp (µM) | 38.9 ± 7.32 | 9 ± 2 | 3.4 ± 1.8 | 4.2 ± 1.1 |
kcat/Kapp (µM−1·s−1) | ~0.03 | ~0.05 | ~0.05 | ~0.04 |
-
Abbreviations used: Dm: Drosophila melanogaster; Hs: Homo sapiens; Mm: Mus musculus.
-
*From this study.
-
†From Kim et al. (2005).
-
‡From Kovács et al. (2004a).
Table 2
Steady-state ATP hydrolysis rates of RLC-TS and RLC mutants.
RLC | kbasal (s−1) | s.d. | k100 (s−1) | s.d. |
|---|---|---|---|---|
RLC-TS | 0.013 | 0.007 | 0.12 | 0.03 |
RLC-TS | 0.010 | 0.001 | 0.82 | 0.01 |
RLC-AS | 0.024 | 0.005 | 0.15 | 0.02 |
RLC-AS | 0.024 | 0.008 | 0.81 | 0.04 |
RLC-TA | 0.009 | 0.002 | 0.12 | 0.01 |
RLC-TA | 0.008 | 0.002 | 0.37 | 0.01 |
RLC-AA | 0.014 | 0.006 | 0.16 | 0.03 |
RLC-AA | 0.012 | 0.002 | 0.23 | 0.02 |
RLC-AE | 0.010 | 0.002 | 0.21 | 0.03 |
RLC-AE | 0.009 | 0.002 | 0.23 | 0.01 |
RLC-EE | 0.011 | 0.007 | 0.19 | 0.01 |
RLC-EE | 0.010 | 0.002 | 0.22 | 0.01 |
-
The actin-activated ATPase activity was measured at 25°C, as described under ‘Materials and methods’. Treatment of RLC with MLCK is indicated by bold print. For comparison, kbasal the steady-state ATPase activity in the absence of actin filaments, and k100, the steady-state ATPase activity at 100 µM actin filaments, are listed.
Table 3
Comparison of Drosophila and mammalian myosin filament dimensions.
Parameter | Dm myosin-II*,† | Hs myosin IIA‡ | Hs myosin IIB‡ | Hs myosin IIC‡ |
|---|---|---|---|---|
Mean number of myosins per filament | 12.8 ± 4.5* 14.9 ± 3† | 29 | 30 | 14 |
Mean bare zone length (nm) | 194 ± 21* 204 ± 19† | 167 ± 19 | 166 ± 16 | 219 ± 13 |
Filament length (nm) | 312 ± 25* | 301 ± 24 | 323 ± 24 | 293 ± 33 |
Sliding velocity (nm·s−1) | 247 ± 37 | 82§ | n.d. | n.d. |
-
*From this study.
-
†From Kiehart and Feghali (1986).
-
‡From Billington et al. (2013).
-
§From Cuda et al. (1997).
Table 4
Fly stocks.
Genotype | Source | RRID for associated stocks or alleles* | |
|---|---|---|---|
Oregon-R-C (wild type) | 2 | RRID: FBst0000005 | |
ovoD1FRT101/Y; hsFLP-38/hsFLP-38 | 2 | ovoD1 | RRID: FBst0001813 |
sqh1FRT101/FM7; P{w+sqh-TS::GFP}attP1/CyO | 1 | sqh1 sqh-TS | RRID: FBal0016066 RRID: FBal0298052 |
sqh1FRT101/FM7; P{w+sqh-AS::GFP}attP1/CyO | 1 | sqh1 sqh-AS | RRID: FBal0016066 RRID: FBal0298055 |
sqh1FRT101/FM7; P{w+sqh-TA::GFP}attP1/CyO | 1 | sqh1 sqh-TA | RRID: FBal0016066 RRID: FBal0298054 |
sqh1FRT101/FM7; P{w+sqh-AE::GFP}attP1/CyO | 1 | sqh1 sqh-AE | RRID: FBal0016066 RRID: FBal0298057 |
sqh1FRT101/FM7; P{w+sqh-TS::GFP}attP1 P{w+Gap43::mCherry}attP40/CyO | 1 | sqh1 sqh-TS Gap43 | RRID: FBal0016066 RRID: FBal0298052 RRID: FBtp0087760 |
sqh1FRT101/FM7; P{w+sqh-AS::GFP}attP1 P{w+Gap43::mCherry}attP40/CyO | 3 | sqh1 sqh-AS Gap43 | RRID: FBal0016066 RRID: FBal0298055 RRID: FBtp0087760 |
sqh1FRT101/FM7; P{w+sqh-TA::GFP}attP1 P{w+Gap43::mCherry}attP40/CyO | 1 | sqh1 sqh-TA Gap43 | RRID: FBal0016066 RRID: FBal0298054 RRID: FBtp0087760 |
sqh1FRT101/FM7; P{w+sqh-AE::GFP}attP1 P{w+Gap43::mCherry}attP40/CyO | 1 | sqh1 sqh-AE Gap43 | RRID: FBal0016066 RRID: FBal0298057 RRID: FBtp0087760 |
-
sqh-XX = sqh promoter and ORF with site-directed mutagenesis at Threonine-20 and Serine-21 as noted in Figure 1B (spaghetti squash, sqh is the Drosophila RLC gene name).
-
Gap43 = sqh promoter with N-terminal 20 amino acids of rat Gap43 gene which contains a myristoylation sequence (Martin et al., 2010).
-
*FlyBase IDs (RRID: SCR_006549)
-
Sources: (1) From Vasquez et al. (2014); (2) Bloomington Drosophila Stock Center; (3) This study;
Download links
A two-part list of links to download the article, or parts of the article, in various formats.
Downloads (link to download the article as PDF)
Open citations (links to open the citations from this article in various online reference manager services)
Cite this article (links to download the citations from this article in formats compatible with various reference manager tools)
Drosophila non-muscle myosin II motor activity determines the rate of tissue folding
eLife 5:e20828.
https://doi.org/10.7554/eLife.20828


