Comparative genetic screens in human cells reveal new regulatory mechanisms in WNT signaling
- Stanford University School of Medicine, United States
- Vanderbilt University Medical Center, United States
- Geisel School of Medicine at Dartmouth College, United States
- University of Colorado, Boulder, United States
Figures
Figure 1 with 1 supplement
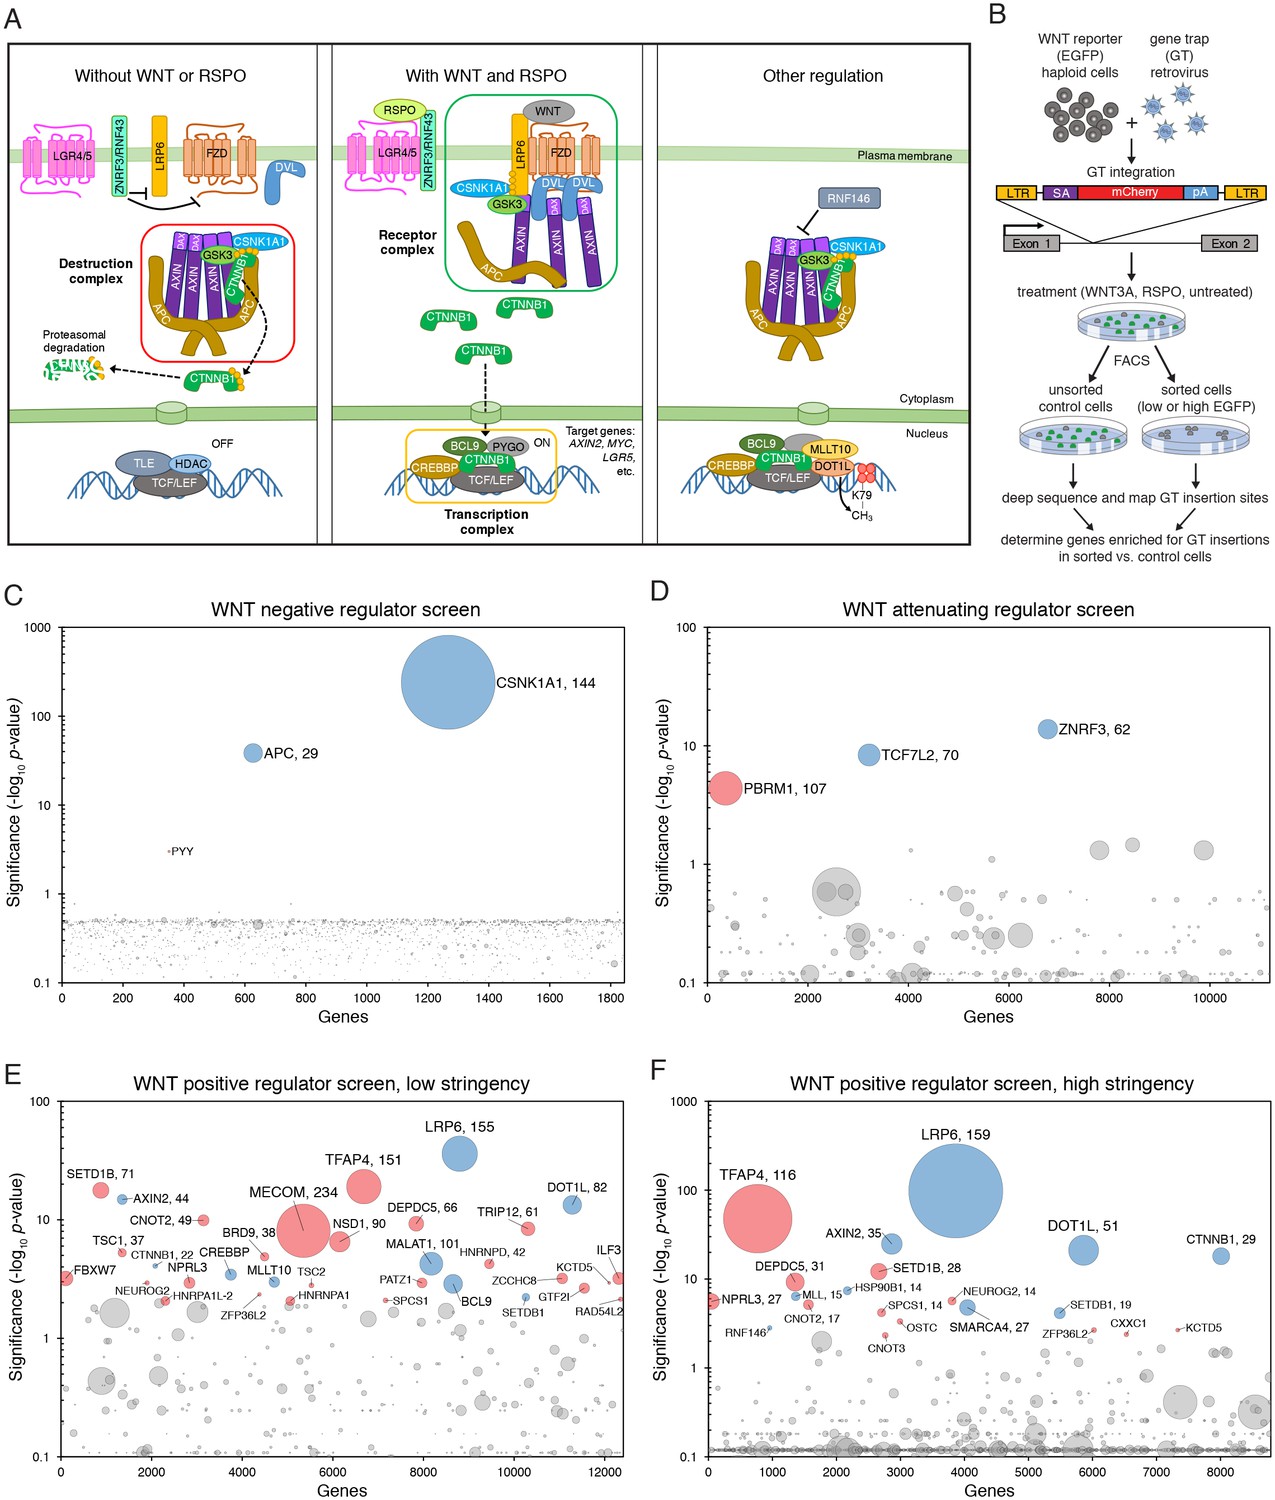
Reporter-based, forward genetic screens in haploid human cells identify negative, attenuating and positive regulators of WNT signaling.
(A) Schematic model of canonical WNT signaling, highlighting the main pathway components and regulatory events in the absence (left panel) and presence (center panel) of ligands, and other known regulators relevant to this work (right panel). When the pathway is off, the transcriptional co-activator β-catenin (CTNNB1) is constitutively targeted for proteasomal degradation by the destruction complex, composed of the scaffold proteins adenomatous polyposis coli (APC) and AXIN, and the kinases glycogen synthase kinase 3 (GSK3) and casein kinase 1α (CSNK1A1). The T-cell-specific transcription factor (TCF)/lymphoid enhancer-binding factor (LEF) family of transcription factors, together with transducin like enhancer of split (TLE) and histone deacetylases (HDAC), repress WNT target genes. Binding of WNT to its co-receptors frizzled (FZD) and low-density lipoprotein receptor-related protein 6 (LRP6) leads to the assembly of a receptor complex that inactivates the destruction complex through a mechanism involving recruitment of AXIN by LRP6 and the adapter protein dishevelled (DVL). Consequently, CTNNB1 accumulates in the cytoplasm, translocates to the nucleus and promotes WNT target gene transcription in cooperation with TCF/LEF and other co-activators such as CREB-binding protein (CREBBP) and B-cell CLL/lymphoma 9 protein (BCL9). R-spondins (RSPOs) are secreted proteins that potentiate the response of stem cells to WNT ligands by blocking the degradation of FZD and LRP6 receptors. RSPO binds to leucine-rich repeat-containing G-protein-coupled receptors (LGRs) and neutralizes two transmembrane E3 ubiquitin ligases, ZNRF3 and RNF43, that clear WNT receptors from the cell surface. Other regulatory mechanisms include modulation of AXIN levels by the poly ADP-ribosylation-dependent E3 ubiquitin ligase RNF146, and recruitment of DOT1L and MLLT10, two proteins involved in histone H3 K79 methylation, to WNT target genes. (B) Schematic of WNT reporter-based forward genetic screens in haploid human cells using a GT-bearing retrovirus for mutagenesis, followed by phenotypic enrichment by FACS. LTR, long terminal repeats; SA, splice acceptor; pA, polyadenylation signal. (C–F) Circle plots depicting genes enriched for GT insertions in screens for negative (C), attenuating (D) and positive (E and F) regulators of WNT signaling. Two independent screens for positive regulators were performed at low (E) and high (F) selection stringencies by sorting for cells with the lowest 10% and 2% WNT reporter fluorescence, respectively. The y-axis indicates the significance of GT insertion enrichment in the sorted vs. the control cells (expressed in units of -log10FDR-corrected p-value) and the x-axis indicates genes (in random order) for which GT insertions were mapped in the sorted cells. Genes with FDR-corrected p-value<0.01 are labeled and colored in light blue if they encode a known pathway component, or in pink if their product has not been previously implicated as a regulator of canonical WNT signaling. The diameter of each circle is proportional to the number of unique inactivating GT insertions mapped in the sorted cells, which is also indicated next to the gene name for the most significant hits with FDR-corrected p-values<10−4.
Figure 1—figure supplement 1

Characterization of HAP1-7TGP, a haploid human cell line harboring a WNT-responsive fluorescent reporter (A–D), and depiction of FACS gates and phenotypic enrichment during various reporter-based forward genetic screens (E–H).
(A) Histogram depicting WNT reporter activity (EGFP fluorescence of ~4500 cells in arbitrary units (a.u.), plotted on a logarithmic x-axis) for the parental haploid human cell line HAP1 and the WNT reporter cell line HAP1-7TGP. Where indicated, cells were treated with 50% WNT3A conditioned medium (CM). Basal EGFP fluorescence in HAP1-7TGP cells was minimal and increased by approximately two orders of magnitude in response to WNT3A. (B) Dose response curve depicting fold-induction in WNT reporter (average EGFP fluorescence from ~3500 cells) following treatment with WNT3A, as a function of WNT3A CM concentration (expressed as percentage of total medium). The WNT3A CM concentrations used in the screens for attenuating and positive regulators of WNT signaling (Figure 1D–1F) are indicated. EGFP fluorescence in HAP1-7TGP cells increased by up to 155-fold in response to saturating WNT3A. (C) Histogram depicting WNT reporter activity for ~10,000 HAP1-7TGP cells. Where indicated, cells were treated with 50% control CM from L-cells, 50% WNT3A CM or 150 ng/ml recombinant WNT3A. HAP1-7TGP cells responded to WNT3A CM and recombinant WNT3A, but not control CM. (D) Histogram depicting WNT reporter activity for ~5000 HAP1-7TGP cells. Where indicated, cells were treated with 50% WNT3A CM alone or together with 10 μM of the tankyrase inhibitor XAV-939, which elevates the levels of AXIN, or with 10 μM of the GSK3 antagonist CHIR-99021. WNT3A-induced reporter expression in HAP1-7TGP cells has the pharmacological hallmarks of being mediated by canonical WNT signaling. (E) Dot plot depicting WNT reporter activity (EGFP fluorescence vs. pacific blue auto-fluorescence from ~17,500 cells, plotted on biexponential axes) for HAP1-7TGP cells mutagenized with GT retrovirus and enriched during the WNT negative regulator screen (Figure 1C). Unsorted cells and cells amplified following sort 1 using the indicated EGFP+ gate are depicted, and the percentage of cells within this gate for each population is indicated in parenthesis. Cells were analyzed for GT insertions following a second round of FACS sorting (not shown) using an equivalent gate. (F) Histogram depicting WNT reporter activity for ~7000 mutagenized HAP1-7TGP cells enriched during the WNT attenuating regulator screen (Figure 1D). Where indicated, cells were treated with 12.5% WNT3A CM. Unsorted cells and cells amplified following sort 1 using the indicated highest 2% EGFP fluorescence gate are depicted. The percentage of cells within this gate for each population is indicated in parenthesis. Cells were analyzed for GT insertions following a second round of FACS sorting (not shown) using an equivalent gate. (G) Histogram depicting WNT reporter activity for ~12,500 mutagenized HAP1-7TGP cells enriched during the WNT positive regulator screen done at low stringency (Figure 1E). Cells were treated with 50% WNT3A CM where indicated. Unsorted cells and cells amplified following sort 1 or sort 2 using the indicated lowest 10% EGFP fluorescence gate are depicted, and the percentage of cells within this gate for each population is indicated in parenthesis. (H) Histogram depicting WNT reporter activity for ~12,500 mutagenized HAP1-7TGP cells enriched during the WNT positive regulator screen done at high stringency (Figure 1F). Cells were treated with 50% WNT3A CM where indicated. Unsorted cells and cells amplified following sort 2 using the indicated lowest 2% EGFP fuorescence gate are depicted, and the percentage of cells within this gate for each population is indicated in parenthesis.
Figure 2
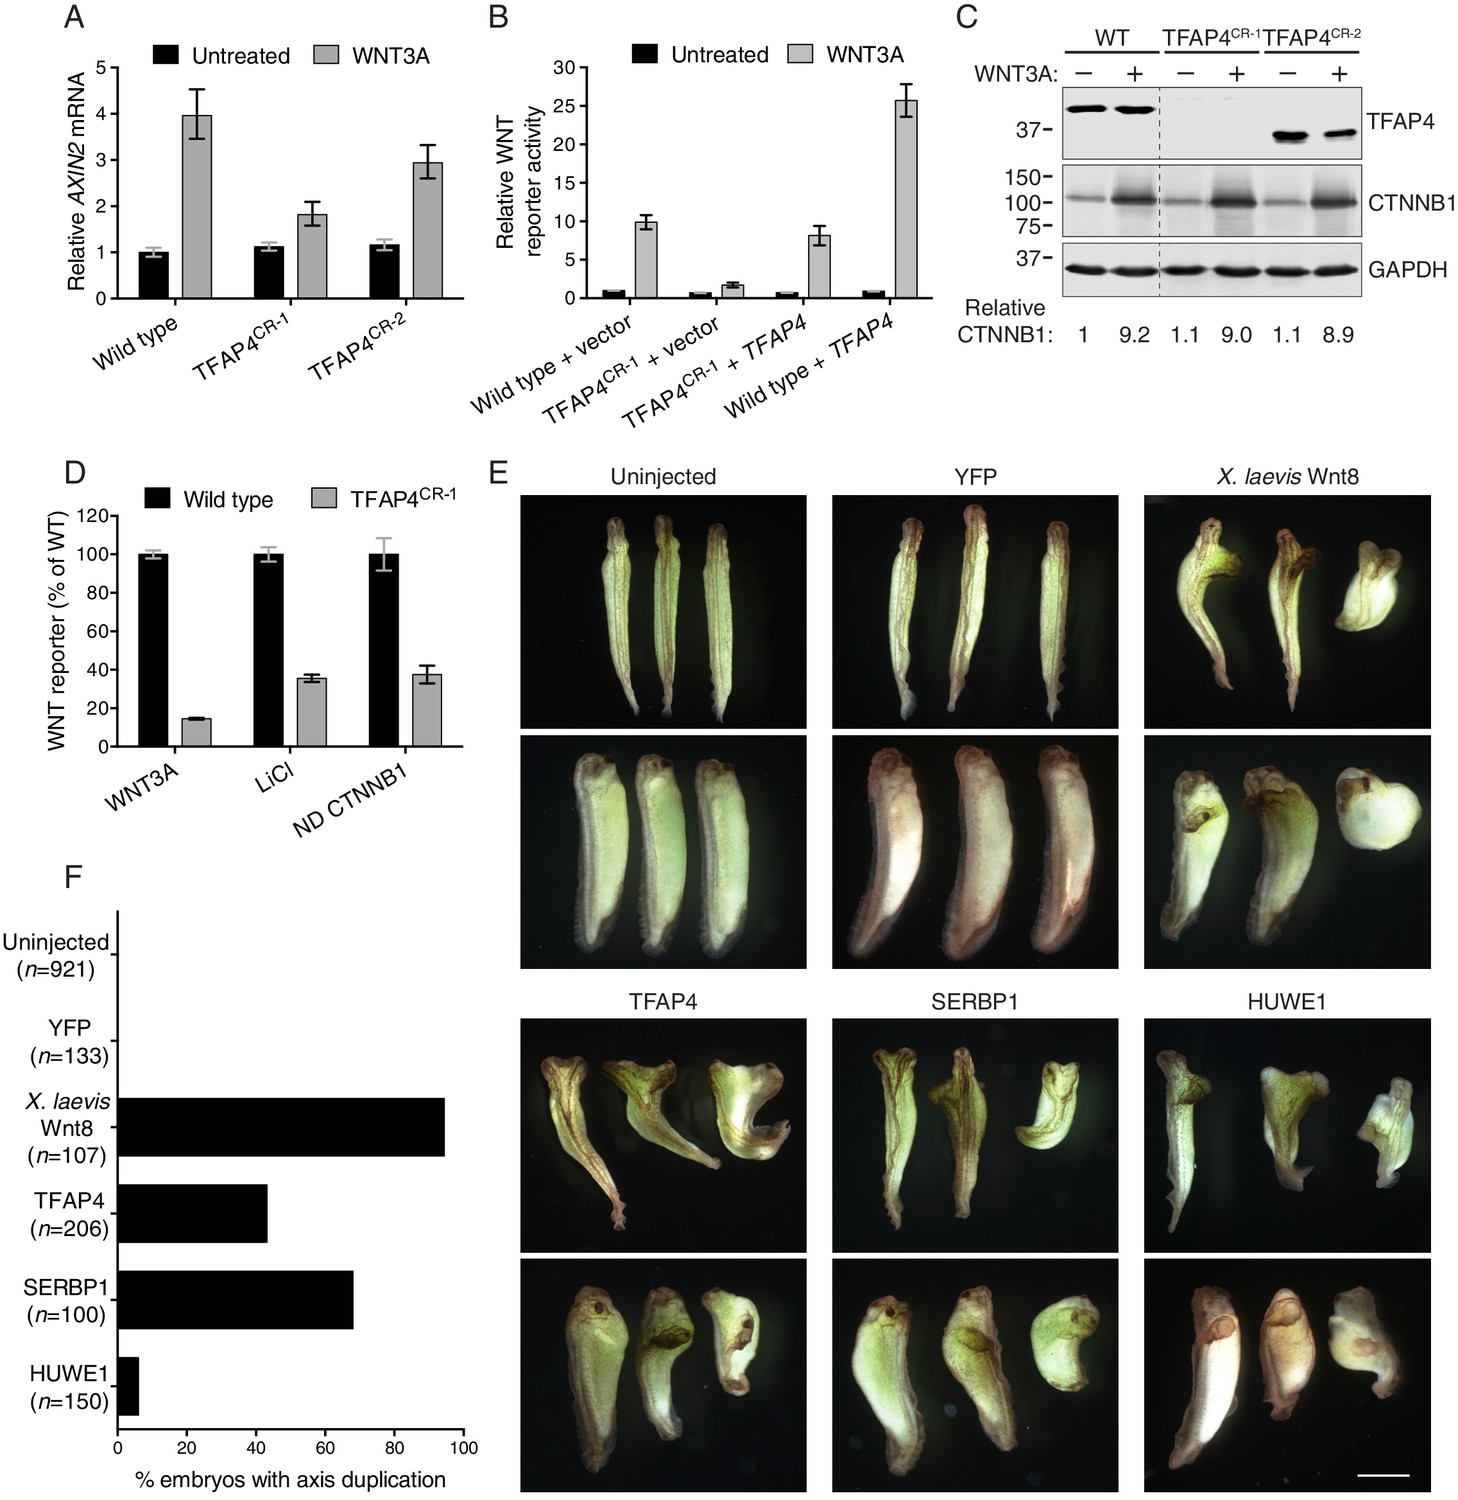
The transcription factor TFAP4 regulates WNT signaling downstream of the CTNNB1 destruction complex (A–D), and ectopic expression of TFAP4, SERBP1 and HUWE1 in X. laevis embryos induces secondary body axis formation (E–F).
(A) AXIN2 mRNA (average ± standard deviation (SD) AXIN2 mRNA normalized to HPRT1 mRNA, each measured in triplicate reactions), relative to untreated WT cells, for single WT HAP1-7TGP and TFAP4CR clonal cell lines (see Materials and methods and Supplementary file 2 for descriptions of all CRISPR/Cas9-engineered and GT-containing clonal cell lines). Cells were treated with 50% WNT3A CM where indicated. (B) WNT reporter activity (median ± standard error of the median (SEM) EGFP fluorescence from 1000 transfected cells), relative to untreated WT cells transfected with empty vector, for WT and TFAP4CR-1 cells transfected with pCS2+ empty vector or pCSDest-TFAP4 (together with pmCherry as a co-transfection marker). Cells were treated with 50% WNT3A CM where indicated. (C) Immunoblot analysis of WT and TFAP4CR clonal cell lines treated with 50% WNT3A CM where indicated. CTNNB1 protein levels (CTNNB1 intensity normalized to GAPDH intensity), relative to untreated WT cells, are shown below the blots. Molecular weight standards (in kilodaltons (kDa)) are indicated on the left and the identity of the protein measured in each blot is indicated on the right. (D) WNT reporter activity (median ± SEM EGFP fluorescence from 10,000 WNT3A- or LiCl-treated cells, or from 2800 cells transfected with non-degradable (ND, S33Y mutant) CTNNB1) for WT and TFAP4CR-1 cells, depicted as percentage of WT. Cells were treated with 50% WNT3A CM or with 40 mM of the GSK3 inhibitor LiCl, or they were transfected with ND CTNNB1 and pmCherry as a co-transfection marker. (E) Four-cell stage X. laevis embryos were injected ventrally with 5 ng of mRNA encoding yellow fluorescent protein (YFP), X. laevis Wnt8, TFAP4, SERBP1 or HUWE1 and grown to stage 34. Dorsal (top panel of each pair) and lateral (bottom panel of each pair) views for groups of three embryos are shown. Scale bar = 1 mm. (F) Percentage of embryos with a secondary body axis. The total number of injected embryos is indicated below the group name.
Figure 3 with 3 supplements
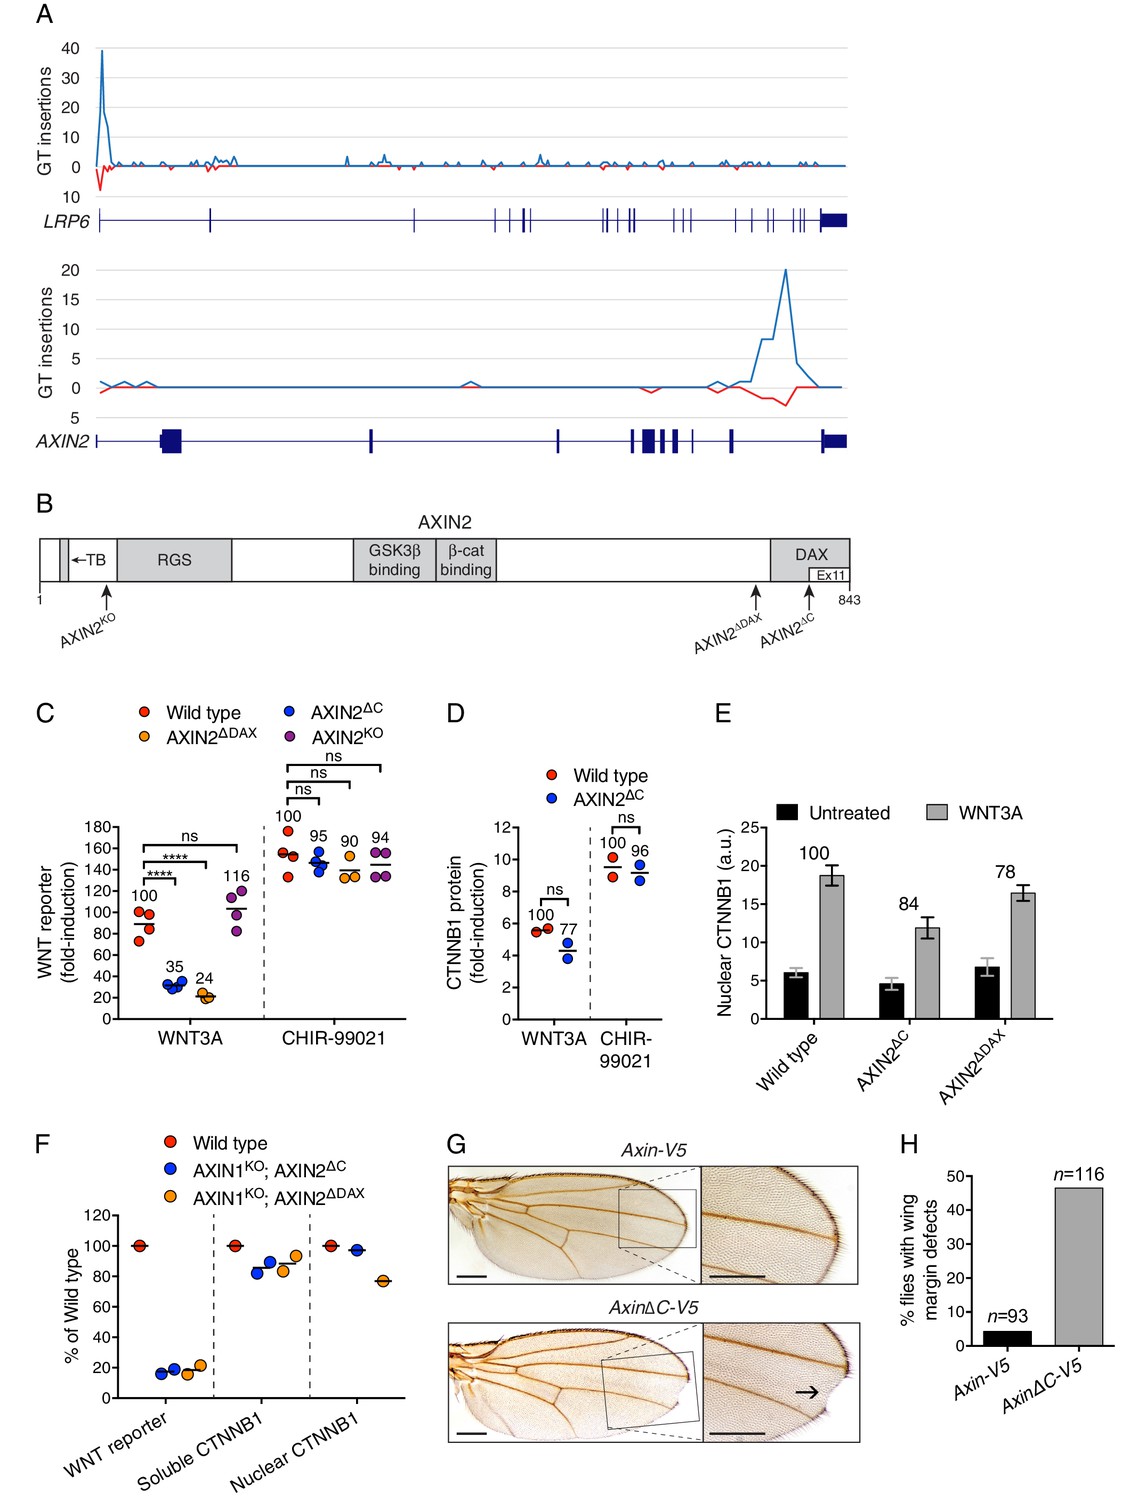
The C-terminal DAX domain of AXIN2 controls CTNNB1 transcriptional activity.
(A) GT insertions in LRP6 (top histogram) and AXIN2 (bottom histogram) mapped for the sorted cells from the WNT positive regulator, low stringency screen (Figure 1E). The histograms depict the number of GT integrations in the sense (blue) or antisense (red) orientation, relative to the coding sequence of the gene, within consecutive 500 base pair (bp) intervals along the length of each gene. Due to the directionality of the splice acceptor in the GT, typically only sense GT insertions in introns disrupt the gene, whereas GT insertions in exons generally disrupt the gene regardless of orientation. RefSeq gene tracks for LRP6 and AXIN2 are shown beneath each histogram following the University of California, Santa Cruz (UCSC) genome browser display conventions: coding exons are represented by thick blocks, UTRs by thin blocks, and introns by horizontal lines connecting the blocks. Both genes are displayed with their 5’ ends to the left, and encompass chromosome 12, bps 12267499–12116000 for LRP6, and chromosome 17, bps 65561999–65528500 for AXIN2 (hg18). (B) Schematic representation of the human AXIN2 protein drawn to scale in the horizontal dimension. Amino acid numbers are indicated below, and arrows show the sites at which truncations were made by CRISPR/Cas9-mediated genome editing in the indicated cell lines. Known domains, regions and motifs (based on UniProt annotation) are depicted in gray (TB, tankyrase-binding motif). Exon 11, eliminated by GT insertions found in cells sorted during the WNT screens for positive regulators, is delineated by a thinner white block. (C) Fold-induction in WNT reporter (median EGFP fluorescence from 20,000 cells) following treatment with 50% WNT3A CM or 10 μM of the GSK3 inhibitor CHIR-99021. Each circle represents a unique clonal cell line (determined by genotyping, Supplementary file 2), and the average of three to four independent clones for each genotype is indicated by a horizontal line. For each treatment, percentage reporter activation relative to WT cells is also indicated above each group of circles to facilitate comparisons. Significance was determined by one-way ANOVA, and is indicated as ****(p<0.0001) or ns (not significant). (D) Fold-induction in soluble CTNNB1 protein (average CTNNB1 intensity normalized to ACTIN intensity from duplicate immunoblots) following treatment with 50% WNT3A CM or 10 μM CHIR-99021. Each circle represents a unique clonal cell line, and the average of two independent clones for each genotype is indicated by a horizontal line. Significance was determined by unpaired t-test with Welch’s correction. Representative immunoblots used for quantification of CTNNB1 and ACTIN are shown in Figure 3—figure supplement 1C. (E) Nuclear CTNNB1 (average nuclear fluorescence per unit area from three fields of view) in single clonal cell lines of the indicated genotypes was quantified as described in Materials and methods. Cells were treated with 50% WNT3A CM where indicated. For each cell line, the fold-increase in CTNNB1 nuclear accumulation following treatment with WNT3A, expressed as percentage of WT, is also indicated above the bars to facilitate comparisons. For WNT3A-treated cells, differences in nuclear CTNNB1 between WT and mutant cells were not statistically significant as determined by one-way ANOVA. Examples of confocal sections used for quantification of nuclear CTNNB1 are shown in Figure 3—figure supplement 2B–2D. (F) WNT reporter activity (median EGFP fluorescence from 10,000 cells), soluble CTNNB1 protein (average CTNNB1 intensity normalized to ACTIN intensity from duplicate immunoblots), and nuclear CTNNB1 protein (average nuclear fluorescence per unit area from 2 to 3 fields of view), depicted as percentage of WT, for cells treated with 50% WNT3A CM. Each circle represents a unique clonal cell line, and where applicable the average of two independent clones is indicated by a horizontal line. (G) Adult D. melanogaster wings expressing Axin-V5 (top images) or AxinΔC-V5 (bottom images) under the control of the c765-Gal4 driver. Loss of sensory bristles and tissue at the wing margin, indicative of impaired Wg signaling, is shown (arrow) in the higher magnification view of the delineated area. While loss of Notch signaling can also result in wing margin defects due to a requirement of Notch signaling for Wg expression at the dorso-ventral boundary in the wing imaginal disc (Diaz-Benjumea and Cohen, 1995), we ruled out that possibility by confirming intact Wg expression in the wing imaginal disc of flies expressing AxinΔC-V5 (Figure 3—figure supplement 3B). Scale bars = 20 μm. (H) Percentage of flies with wing margin defects. 4.3% of flies expressing Axin-V5 exhibited loss of bristles at the wing margin, but no loss of wing tissue; 46.6% of flies expressing AxinΔC-V5 exhibited loss of bristles at the wing margin as well as loss of wing tissue.
Figure 3—figure supplement 1
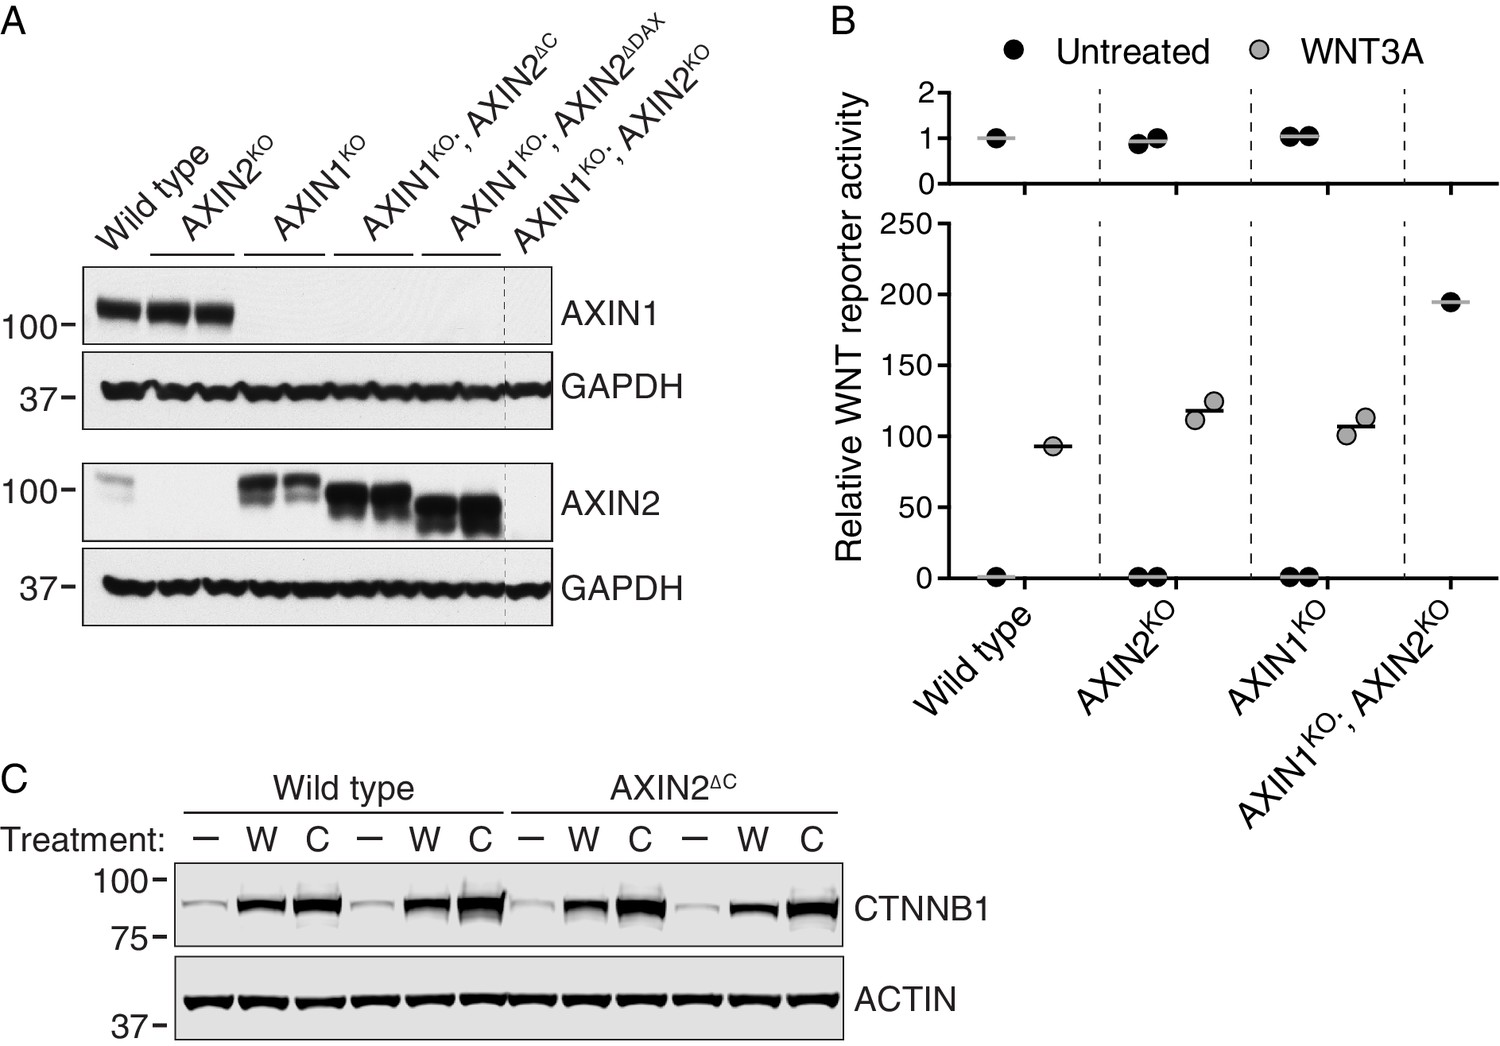
AXIN1 and AXIN2 are redundant in haploid human cells (A–B), and CTNNB1 protein is stabilized normally in AXIN2∆C cells (C).
(A) Immunoblots of total AXIN1, AXIN2 and GAPDH in various AXIN1 and/or AXIN2 deletion and/or truncation cell lines. GAPDH loading controls are shown below their respective blots. Single WT and AXIN1KO; AXIN2KO clonal cell lines, and two independent clonal cell lines for all other genotypes were analyzed. Genotypes are indicated above the blots. Cells were treated with 10 μM CHIR-99021 to increase AXIN2 expression, since under unstimulated conditions AXIN2 levels were almost undetectable. Both AXIN1 and AXIN2 are expressed in HAP1-7TGP cells. Disruption of AXIN1 led to a marked increase in full-length and truncated AXIN2 protein abundance. (B) WNT reporter activity (median EGFP fluorescence from 10,000 cells), relative to untreated WT cells. Cells were treated with 50% WNT3A CM where indicated. Each circle represents a unique clonal cell line (see Supplementary file 2). Single WT and AXIN1KO; AXIN2KO cell lines were analyzed. For AXIN2KO and AXIN1KO cells, the average of two independent clonal cell lines is indicated by a horizontal line. The top graph shows an expanded view of the y-axis to clearly show low levels of reporter activity for untreated cells. AXIN2 and AXIN1 are functionally redundant in HAP1-7TGP cells. (C) Representative immunoblots of soluble CTNNB1 and ACTIN used for quantification in Figure 3D. Two WT and two AXIN2∆C clonal cell lines were analyzed. Cells were treated with 50% WNT3A CM (‘W’) or 10 μM CHIR-99021 (‘C’) where indicated. CTNNB1 protein was stabilized normally in AXIN2∆C cells following both treatments.
Figure 3—figure supplement 2

Cells lacking the C-terminal DAX domain of AXIN2 exhibit normal CTNNB1 nuclear accumulation following WNT treatment.
(A) Kinetics of CTNNB1 nuclear accumulation following treatment with 50% WNT3A CM. Nuclear CTNNB1 (average nuclear fluorescence per unit area from three fields of view in a.u.) was quantified as described in Materials and methods. In all subsequent experiments, nuclear CTNNB1 was measured following 4 hr of treatment with WNT3A. (B–F) Single confocal sections though the center of the nucleus for the indicated cell lines, stained with DAPI (left images), immunostained for CTNNB1 (center images) and merged (right images). All images for a given channel were acquired using identical microscopy settings, and brightness and contrast was adjusted equally for display purposes. Cells were treated with 50% WNT3A CM for 4 hr where indicated. Representative regions demarcated by dashed squares ware magnified 3x and are shown in the insets. Scale bar = 18 μm in the main images, and 6 μm in the insets.
Figure 3—figure supplement 3

Expression of an Axin transgene encoding C-terminally truncated protein compromises Wg signaling in D. melanogaster.
(A) Schematic representation of the protein products encoded by transgenes Axin-V5 and AxinΔC-V5 drawn to scale in the horizontal dimension. Amino acid numbers are indicated below and known domains (based on UniProt annotation) are depicted in gray. The C-terminal 41 amino acids truncated in AxinΔC-V5 correspond to those encoded by human exon 11, eliminated by GT insertions found in cells sorted during the WNT screens for positive regulators (see Figure 3A and B). (B) Confocal images of third larval instar wing discs expressing Axin-V5 (top images) or AxinΔC-V5 (bottom images) using the c765-Gal4 driver, stained with Senseless (Sens, left images) or Wingless (Wg, right images) antibodies. Scale bars = 10 μm. In the fly imaginal wing disc, Wg secreted by cells at the dorso-ventral boundary controls expression of Sens in adjacent sensory organ precursor cells. Expression of Axin∆C-V5, but not WT Axin-V5, resulted in loss of Sens expression (arrows). Expression of Wg itself was unaffected by expression of Axin∆C-V5, indicative of reduced Wg signaling rather than impaired morphogen secretion. (C) Confocal images of stage 8, 9 and 11 embryos (embryonic stage of development and hours after egg lay (AEL) are indicated above the images) expressing Axin-V5 or AxinΔC-V5 (as indicated to the left of the images) using the mat-Gal4 driver, stained with Engrailed (En, top four rows of images) or Wg (bottom two rows of images) antibodies. For En staining, high-magnification views are also shown (second and fourth rows of images). Anterior is to the left, dorsal on top. Scale bars = 25 μm. Wg signaling in segmental stripes is required for maintenance, but not initiation, of En expression. In embryos expressing Axin-V5, En stripes two to three cells wide were observed at stages 8, 9 and 11 (dumbbell bars). In embryos expressing Axin∆C-V5, initiation of En expression at stage eight was normal but decayed after stage 9 (arrows), indicating defective Wg signaling. Expression of Wg itself in segmental stripes was unaffected by expression of Axin∆C-V5, suggesting that the loss of En was due to reduced Wg signaling output as opposed to defective morphogen production. (D) Quantification of embryos displaying normal En stripes at stages 9 and 11. The number of embryos quantified for each genotype and stage is indicated above each bar. (E) Immunoblot analysis of V5-fusion proteins and tubulin in lysates prepared from embryos (collected at 0–2 hr AEL) expressing Axin-V5 or Axin∆C-V5.(F) Quantification of immunoblot analysis shown in E. Axin-fusion protein (average ± SEM of V5 intensity from three biological replicates) is depicted as percentage of WT. Deleting the C-terminal domain of Axin did not affect expression levels. (G) First instar larval cuticles from embryos expressing Axin-V5 (top images) or AxinΔC-V5 (bottom images). The right image in each pair is a higher magnification view of the left image. Scale bars = 25 μm. The normal pattern of alternating naked cuticle and denticle belts, established by Wg-dependent specification of cell fate, was disrupted by expression of Axin∆C-V5. (H) Embryonic hatch rate (percentage of fertilized embryos that hatched within 24 hr AEL). The number of embryos quantified for each genotype is indicated above each bar. The embryonic hatch rate of embryos expressing Axin∆C-V5 was substantially reduced.
Figure 4 with 1 supplement
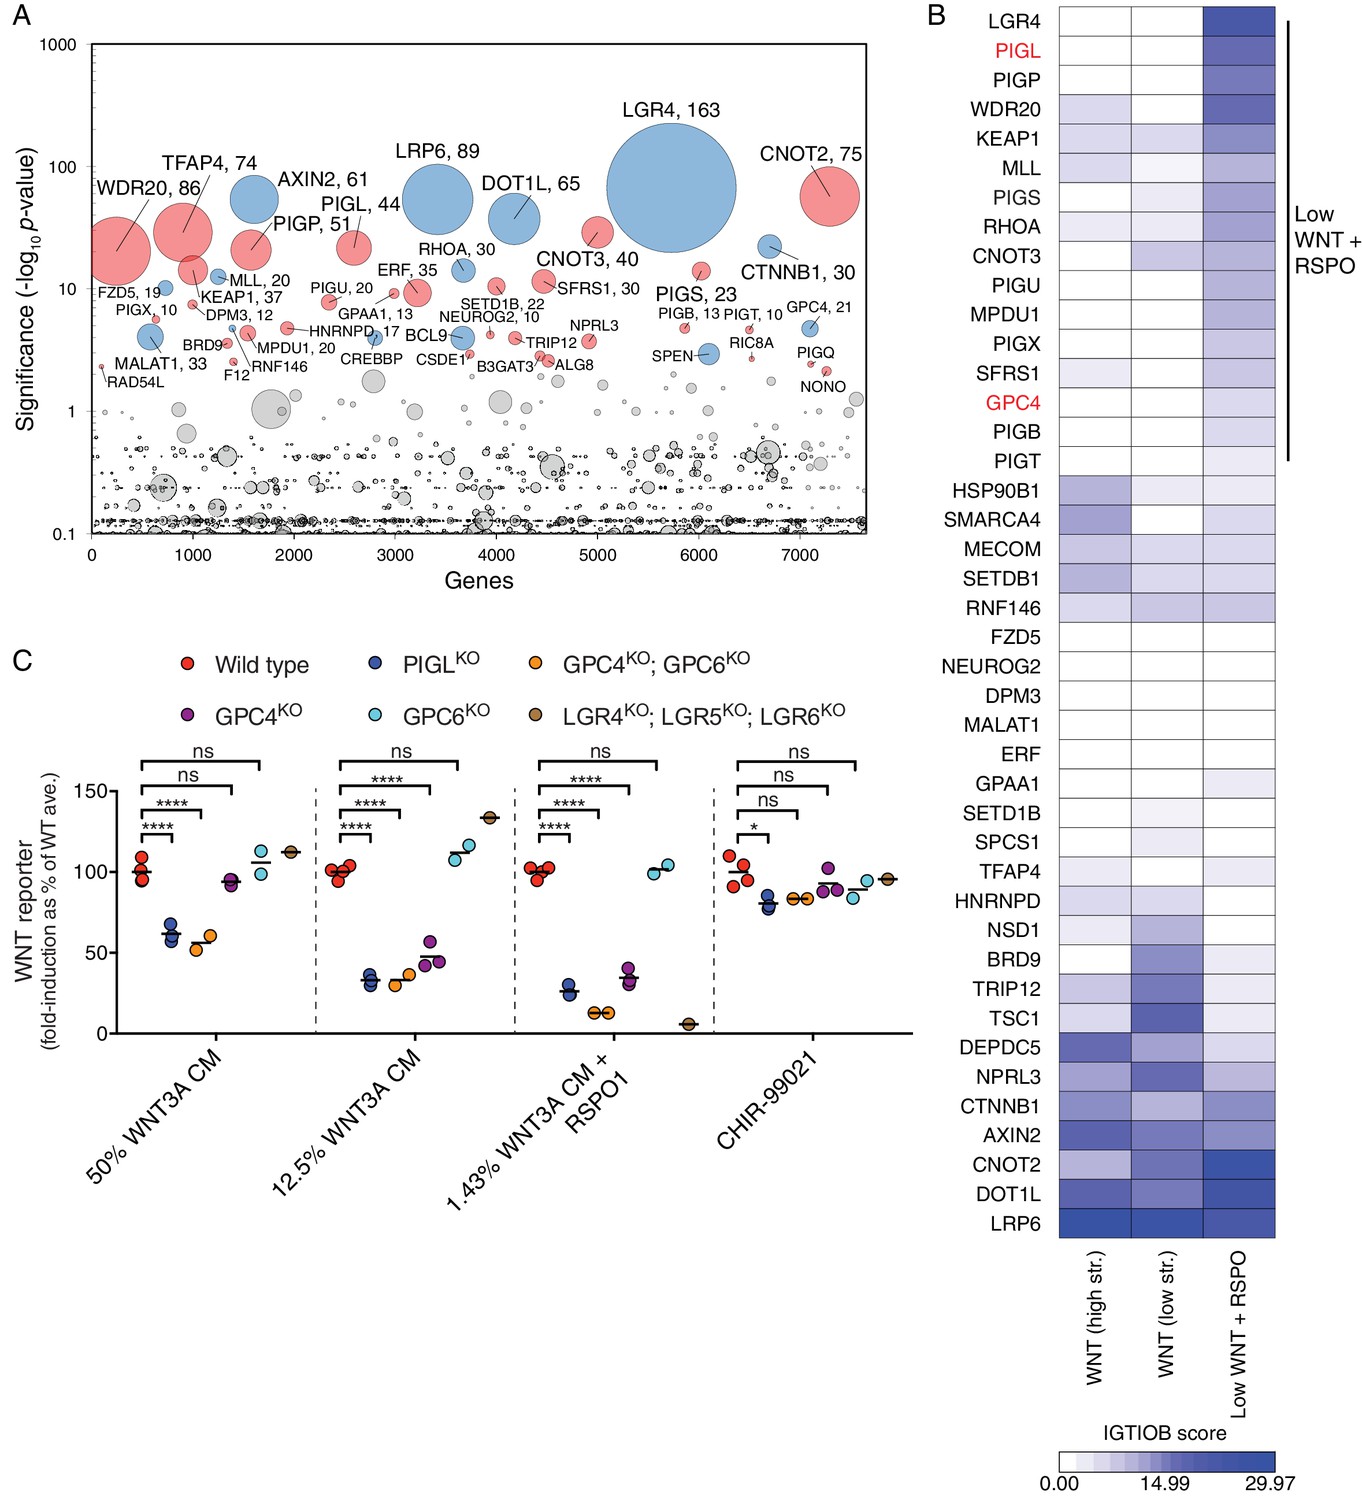
A comparative analysis of screens uncovers requirements for RSPO-potentiated signaling in response to low levels of WNT.
(A) Circle plot depicting genes enriched for GT insertions in the low WNT + RSPO screen for regulators of RSPO-enhanced WNT signaling. See legend to Figure 1C–F for details. (B) Heat map comparing the two WNT positive regulator screens (Figure 1E and F) and the low WNT + RSPO screen (Figure 4A). Genes enriched for GT insertions (FDR-corrected p-value<10−4) in at least one of the three screens were clustered based on their IGTIOB score in each screen (see Materials and methods and Supplementary file 3). A group of genes preferentially enriched for GT insertions in the low WNT + RSPO screen is indicated, headlined by the RSPO receptor LGR4. Genes selected for a detailed analysis are labeled in red. (C) Fold-induction in WNT reporter (average EGFP fluorescence from 10,000 cells) following treatment with 50% WNT3A CM, 12.5% WNT3A CM, 1.43% WNT3A CM + 20 ng/ml RSPO1 or 10 μM of the GSK3 inhibitor CHIR-99021, expressed as percentage of the average for WT cells to facilitate comparisons. Each circle represents the fold-induction for a unique clonal cell line (determined by genotyping, Supplementary file 2), and where applicable, the average of two to four independent clones for each genotype is indicated by a horizontal line. Significance was determined by one-way ANOVA, and is indicated as ****(p<0.0001), *(p<0.05) or ns (not significant).
Figure 4—figure supplement 1
Comparative genetic screens uncover requirements for RSPO-potentiated signaling in response to low levels of WNT.
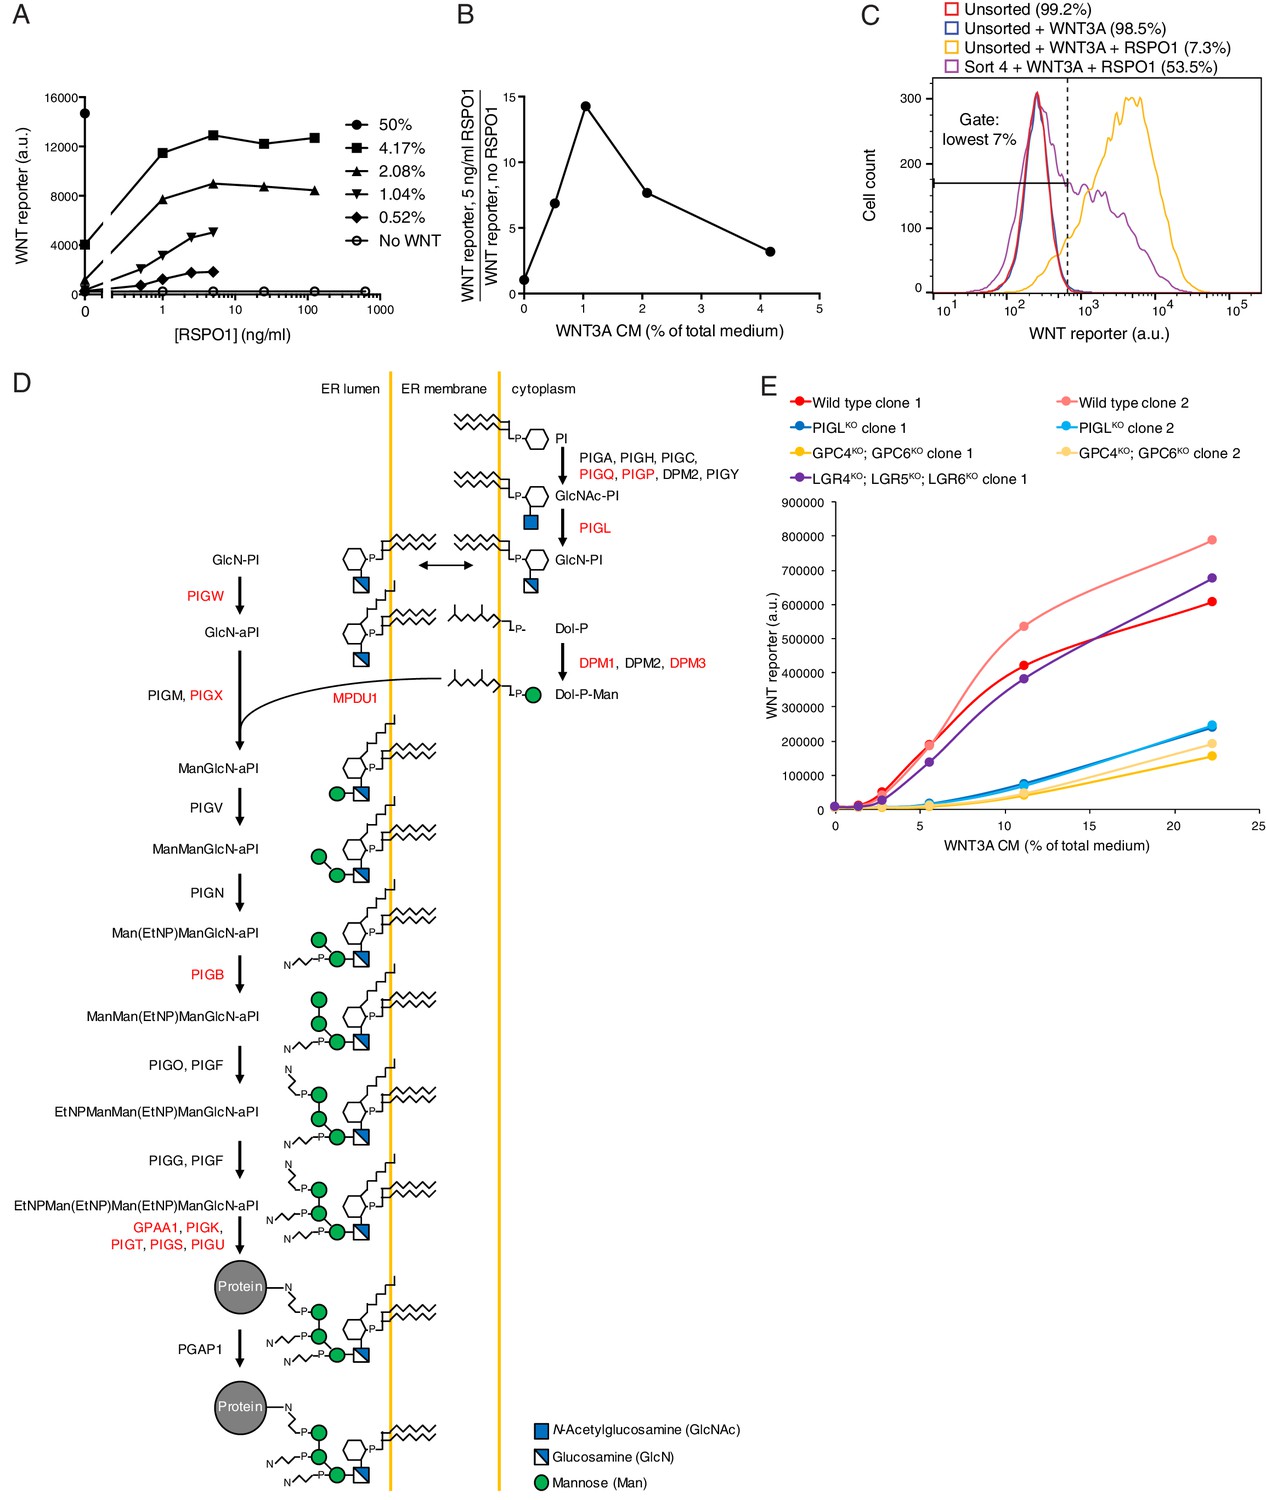
(A) Dose-response curves depicting WNT reporter activity (average EGFP fluorescence from 10,000 cells in a.u.) following treatment with the indicated concentrations of WNT3A CM (key on the right, expressed as percentage of total medium), as a function of RSPO1 concentration (in ng/ml). RSPO1-mediated effects in HAP1-7TGP cells are completely dependent on WNT. (B) RSPO1-dependent WNT reporter activity (average EGFP fluorescence from 10,000 cells following treatment with 5 ng/ml RSPO1, divided by EGFP fluorescence in the absence of RSPO1) as a function of WNT3A CM concentration (expressed as percentage of total medium). Treatment with 1.04% WNT3A CM, the concentration used in the low WNT + RSPO screen (Figure 4A), resulted in negligible pathway activation on its own, but a robust 14.3-fold increase in WNT reporter fluorescence in conjunction with RSPO1. (C) Histogram depicting WNT reporter activity from ~20,000 mutagenized HAP1-7TGP cells enriched during the low WNT + RSPO screen (Figure 4A). Cells were treated with 1.04% WNT3A CM or 1.04% WNT3A CM + 10 ng/ml RSPO1 where indicated. Unsorted cells and cells amplified following sort four using the indicated lowest 7% EGFP fluorescence gate are depicted, and the percentage of cells within this gate for each population is indicated in parenthesis. (D) Schematic of the mammalian GPI biosynthesis pathway (adapted with permission from Essentials of Glycobiology, second edition, Cold Spring Harbor Laboratory Press, Cold Spring Harbor, New York, © 2009 by The Consortium of Glycobiology Editors, La Jolla, California). Proteins involved in each enzymatic step are indicated next to the arrows, and the products of genes with an FDR-corrected p-value<0.05 for GT insertion enrichment in the low WNT + RSPO screen are labeled in red. Key at bottom right. (E) Dose-response curves depicting WNT reporter activity (average EGFP fluorescence from 10,000 cells in a.u.) following treatment with the indicated concentrations of WNT3A CM (expressed as percentage of total medium) in the absence of RSPO1, for a single LGR4KO; LGR5KO; LGR6KO clonal cell line and two independent clonal cell lines for all other genotypes. PIGLKO and GPC4KO; GPC6KO cells manifested a pronounced reduction in signaling when stimulated with low doses of WNT3A alone.
Figure 5 with 1 supplement
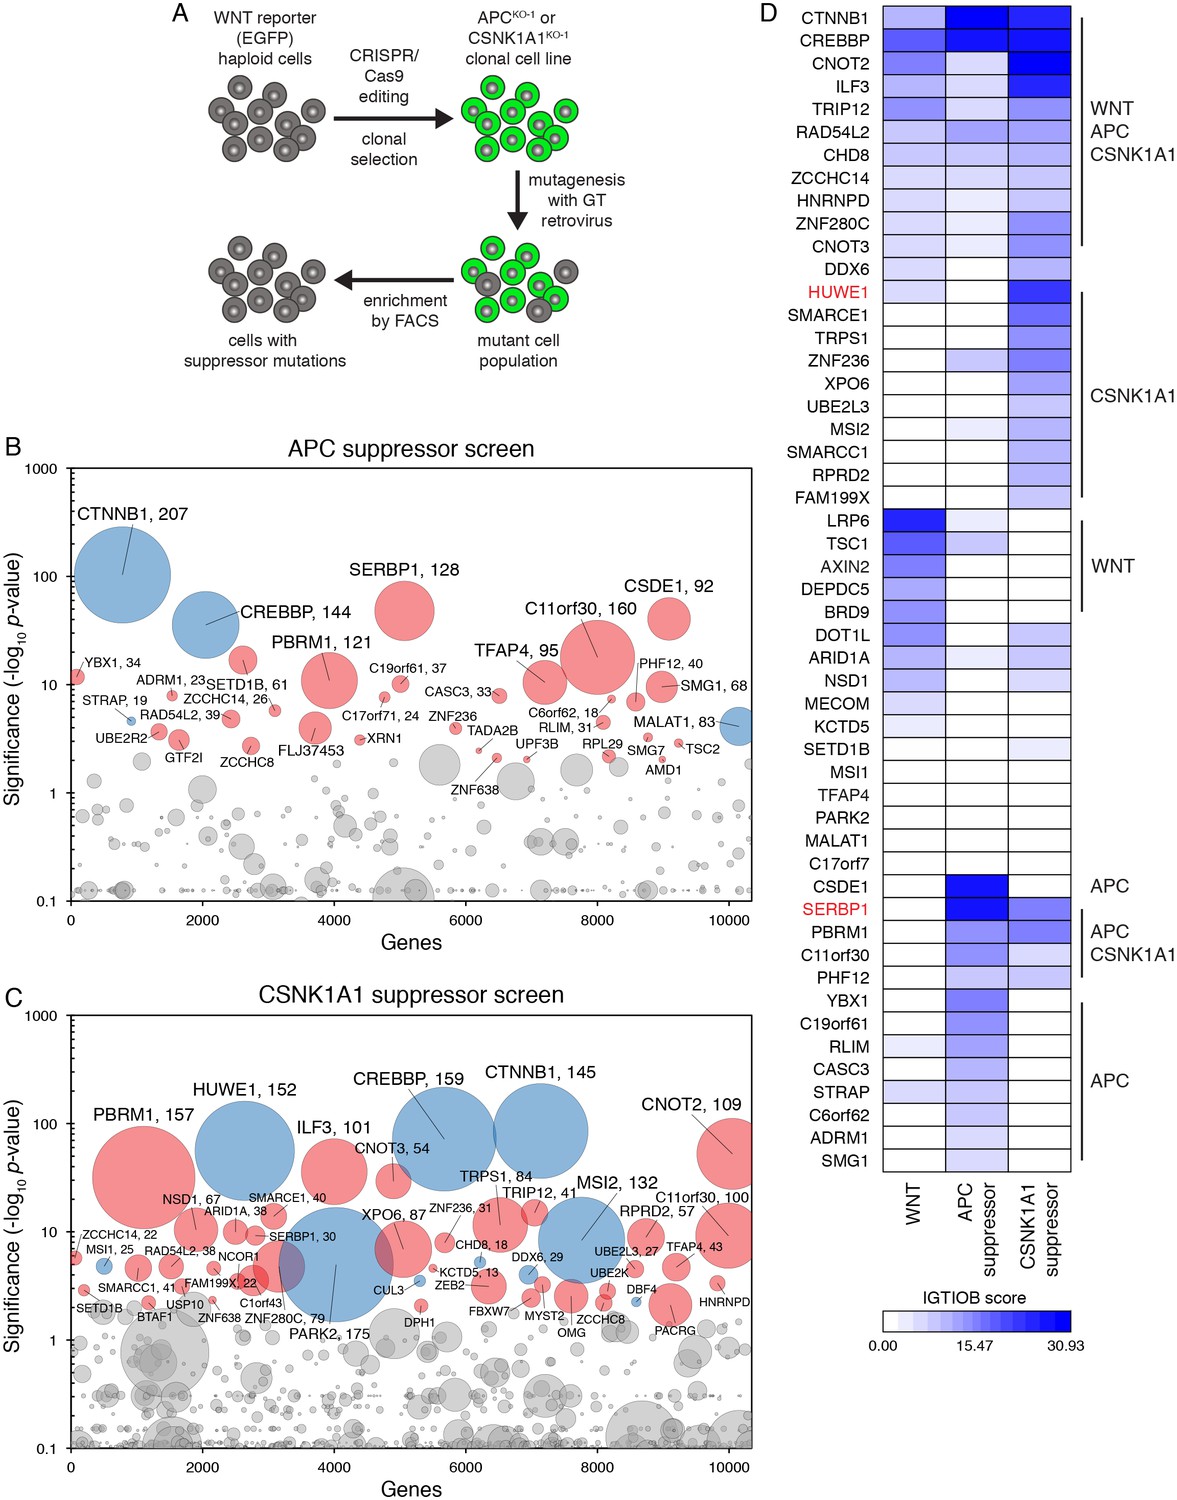
Suppressor screens in cells lacking APC or CSNK1A1 reveal genotype-specific signaling requirements.
(A) Schematic of WNT reporter-based suppressor screens. APC or CSNK1A1 was disrupted by CRISPR/Cas9-mediated genome editing of the WNT reporter haploid cell line HAP1-7TGP. Individual clonal cell lines were isolated (APCKO-1 and CSNK1A1KO-1, Supplementary file 2) and mutagenized using GT retrovirus. Cells with reduced reporter activity were enriched by FACS to identify suppressor mutations. (B–C) Circle plots depicting genes enriched for GT insertions in suppressor screens in which constitutive WNT signaling was induced by loss of APC (B) or CSNK1A1 (C). See legend to Figure 1C–1F for details. (D) Heat map comparing the WNT positive regulator, low stringency screen (Figure 1E), and the APC and CSNK1A1 suppressor screens (Figure 5B and C). Genes enriched for GT insertions (FDR-corrected p-value<10−4) in at least one of the three screens were clustered based on their IGTIOB score in each screen (see Materials and methods and Supplementary file 3). Classes of genes preferentially enriched for GT insertions in various screens are indicated. Genes selected for a detailed analysis are labeled in red.
Figure 5—figure supplement 1

Suppressor screens in cells lacking APC or CSNK1A1 reveal genotype-specific signaling requirements.
(A) Immunoblot analysis of the APCKO-1 (left blots) and CSNK1A1KO-1 (right blots) cell lines used for suppressor screens. For the APC blot, Ponceau S staining was used to assess loading. For the CSNK1A1 blot, the appropriate lanes from the CSNK1A1 blot shown in Figure 6H and the corresponding GAPDH loading controls (not pictured in Figure 6H) were cropped and juxtaposed. (B) Histogram depicting WNT reporter activity for ~22,500 WT HAP1-7TGP, APCKO-1, CSNK1A1KO-1 and APCKO-2 cells. Where indicated, WT cells were treated with 50% WNT3A CM or 10 μM of the GSK3 antagonist CHIR-99021. (C–D) Histograms depicting WNT reporter activity from ~9500 mutagenized APCKO-1 cells (C) or ~20,000 mutagenized CSNK1A1KO-1 cells (D) enriched during the APC and CSNK1A1 suppressor screens, respectively (Figure 5B and C). Unsorted cells and cells amplified following sort 1 or sort 2 using the indicated lowest 10% EGFP fluorescence gate are depicted, and the percentage of cells within this gate for each population is indicated in parenthesis. WT HAP1-7TGP cells are shown for reference.
Figure 6 with 1 supplement
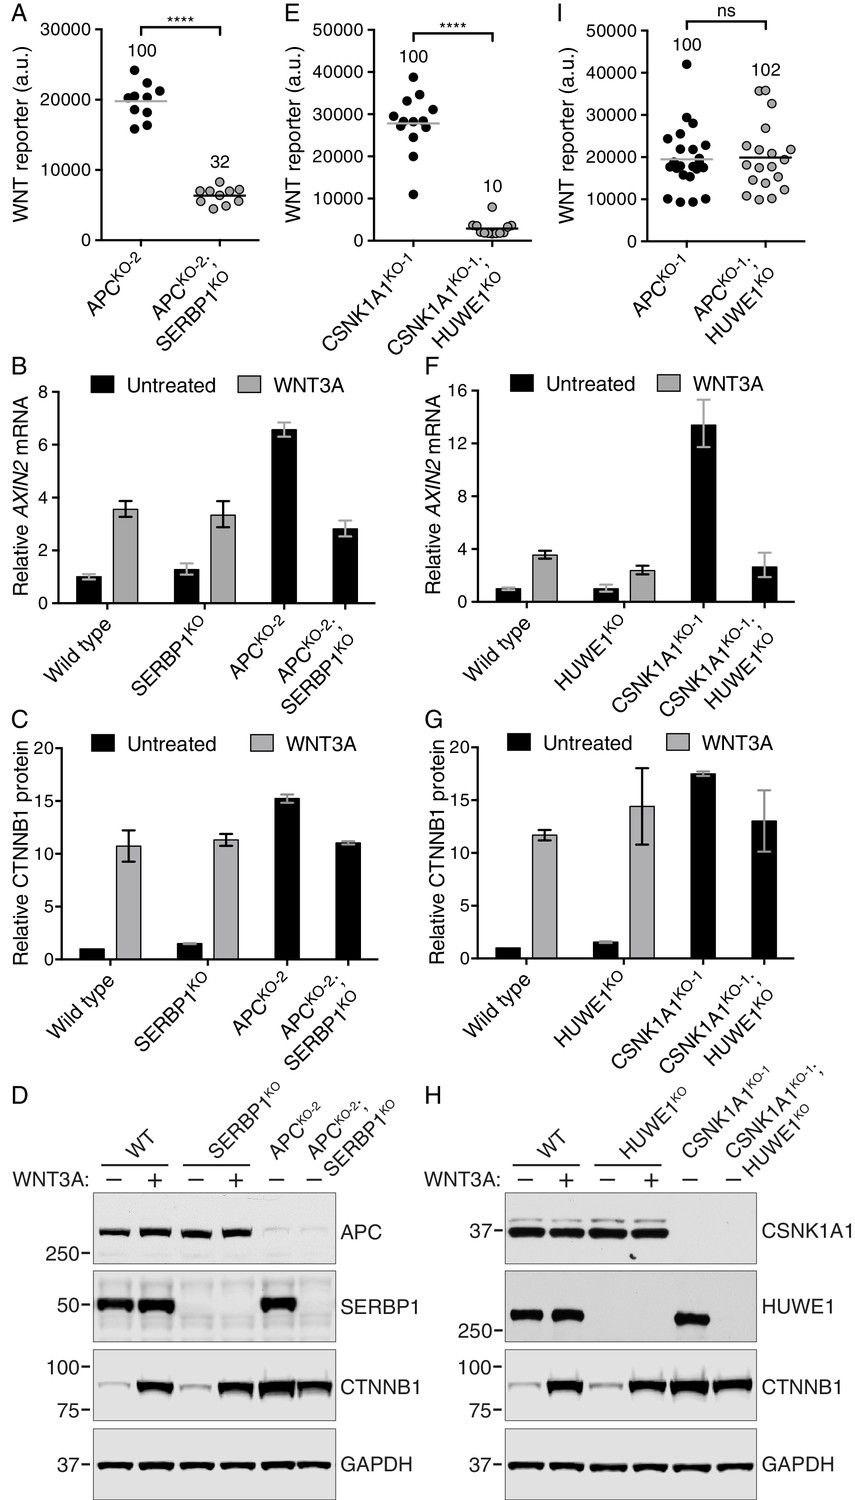
The mRNA binding protein SERBP1 controls CTNNB1 abundance in cells lacking APC (A–D), and the E3 ubiquitin ligase HUWE1 regulates WNT signaling in the absence of CSNK1A1 (E–I).
(A, E, I) WNT reporter activity (median EGFP fluorescence from 5000 (A), 20,000 (E) or 2000 (I) cells) for the indicated single- and double-mutant cell lines. Each circle represents a unique clonal cell line and the average of 10 (A), ≥12 (E) or ≥19 (I) independent clones for each genotype is indicated by a horizontal line. The average percentage reporter activity relative to single-mutant cell lines is also indicated above each group of circles. Significance was determined by unpaired t-test with Welch’s correction and is indicated as ****(p<0.0001) or ns (not significant). (B,F) AXIN2 mRNA (average ± SD of AXIN2 mRNA normalized to HPRT1 mRNA, each measured in triplicate reactions), relative to untreated WT cells, for a single clonal cell line of each indicated genotype. Cells were treated with 50% WNT3A CM where indicated. The same cell lines analyzed in B were also analyzed in C and D; the same cell lines analyzed in F were also analyzed in G and H. Analysis of additional independent clonal cell lines is presented in Figure 6—figure supplement 1. (C,G) Soluble CTNNB1 protein (average ± SD of CTNNB1 intensity normalized to GAPDH intensity from duplicate immunoblots), relative to untreated WT cells. Cells were treated with 50% WNT3A CM where indicated.(D,H) Representative immunoblots of the indicated clonal cell lines. The CTNNB1 and corresponding GAPDH blots depicted in D and H were used for quantification in C and G, respectively. Genotypes and treatments are indicated above the blots.
Figure 6—figure supplement 1
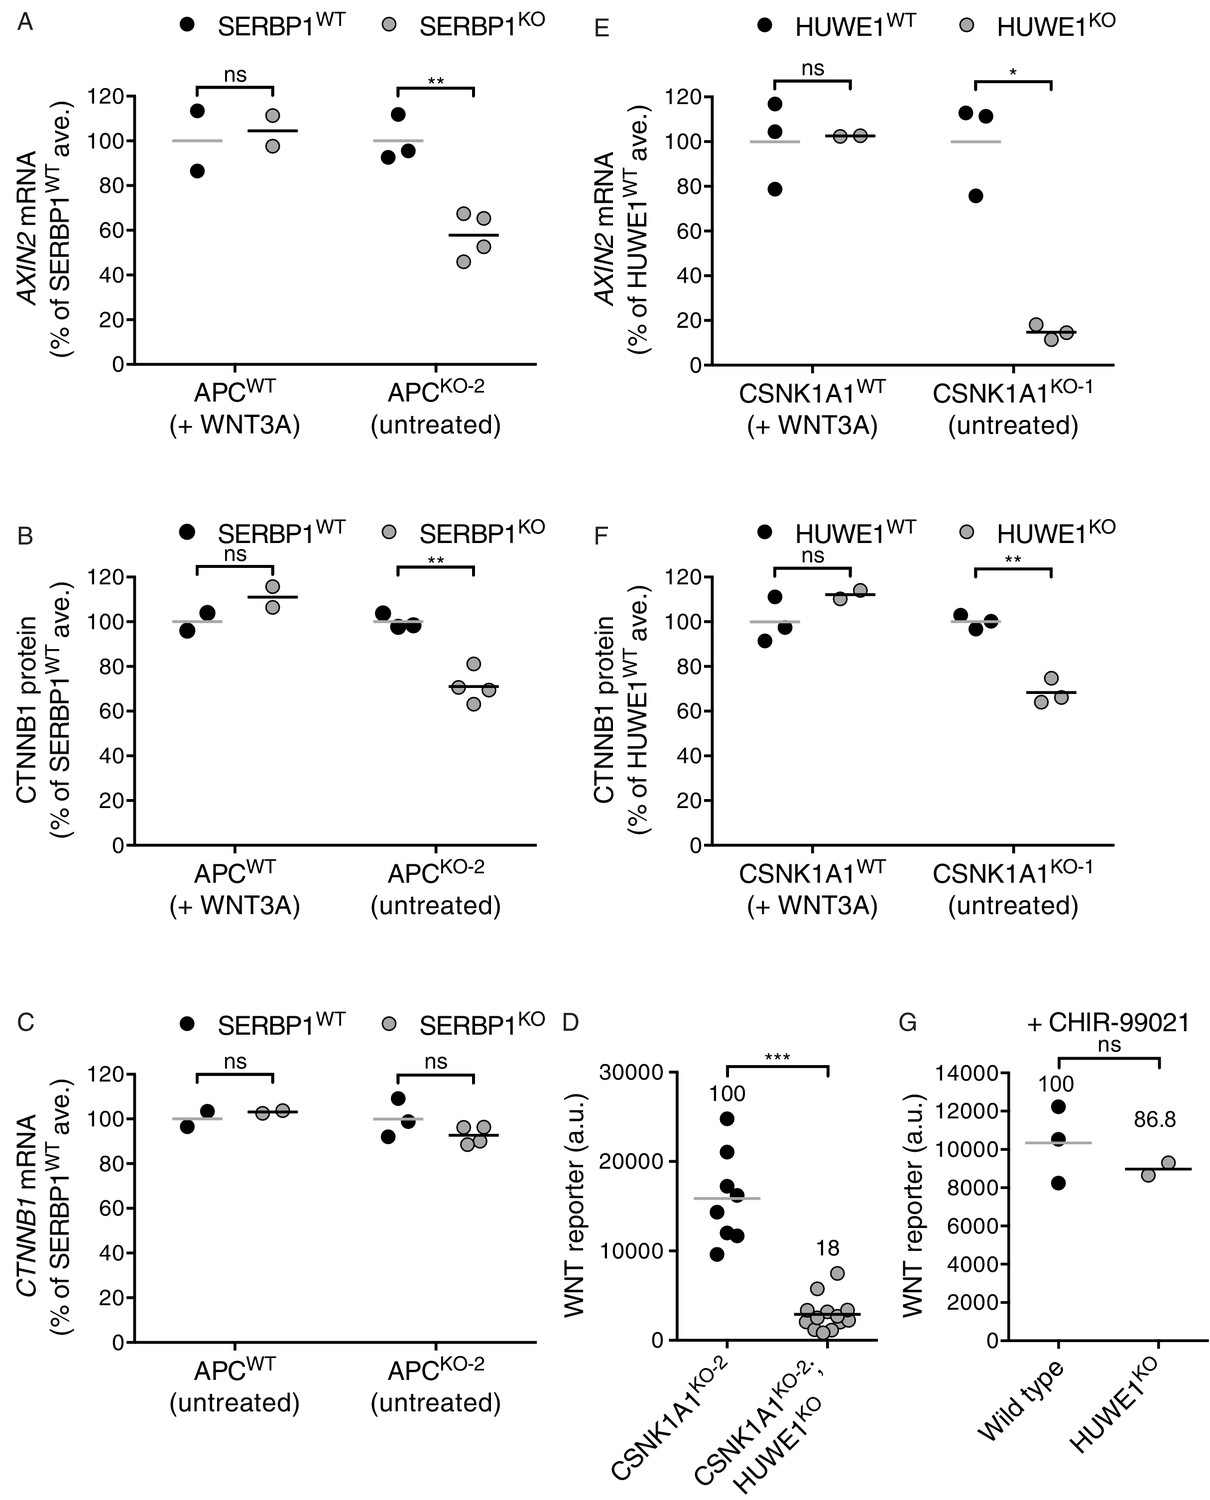
The mRNA binding protein SERBP1 controls CTNNB1 abundance in cells lacking APC (A–C), and the E3 ubiquitin ligase HUWE1 regulates WNT signaling in the absence of CSNK1A1 (D–G).
(A) AXIN2 mRNA (average AXIN2 mRNA normalized to HPRT1 mRNA, each measured in triplicate reactions) for SERBP1WTand SERBP1KO genotypes in APCWTand APCKO-2 genetic backgrounds, expressed as percentage of the average for SERBP1WT cells to facilitate comparisons. Cells were treated with 50% WNT3A CM where indicated. Each circle represents a unique clonal cell line and the average of two to four independent clones for each genotype is indicated by a horizontal line. The cell lines used in A were also analyzed in B and C. In all panels of this figure, significance was determined by unpaired t-test with Welch’s correction and is indicated as ***(p<0.001), **(p<0.01), *(p<0.05) or ns (not significant). (B) CTNNB1 protein (average CTNNB1 intensity normalized to ACTIN intensity from duplicate blots) expressed as percentage of the average for SERBP1WT cells. Cells were treated with 50% WNT3A CM where indicated. (C) CTNNB1 mRNA (average CTNNB1 mRNA normalized to HPRT1 mRNA, each measured in triplicate reactions) expressed as percentage of the average for SERBP1WT cells. (D) WNT reporter activity (median EGFP fluorescence from ~10,000 cells in a.u.). Each circle represents a unique clonal cell line and the average of ≥8 independent clones for each genotype is indicated by a horizontal line. The percentage reporter activity relative to control cells is also indicated above each group of circles. (E) AXIN2 mRNA (average AXIN2 mRNA normalized to HPRT1 mRNA, each measured in triplicate reactions) for HUWE1WTand HUWE1KO genotypes in CSNK1A1WTand CSNK1A1KO-1 genetic backgrounds, expressed as percentage of the average for HUWE1WT cells to facilitate comparisons. Cells were treated with 50% WNT3A CM where indicated. Each circle represents a unique clonal cell line and the average of two to three independent clones for each genotype is indicated by a horizontal line. The cell lines used in E were also analyzed in F and G. (F) CTNNB1 protein (average CTNNB1 intensity normalized to ACTIN intensity from duplicate blots) expressed as percentage of the average for HUWE1WT cells. Cells were treated with 50% WNT3A CM where indicated. (G) WNT reporter activity (median EGFP fluorescence from 20,000 cells) for WT and HUWE1KO cells (in a CSNK1A1WT genetic background) following treatment with 10 μM of the GSK3 inhibitor CHIR-99021. The percentage of reporter activity relative to WT is also indicated above the circles.
Figure 7
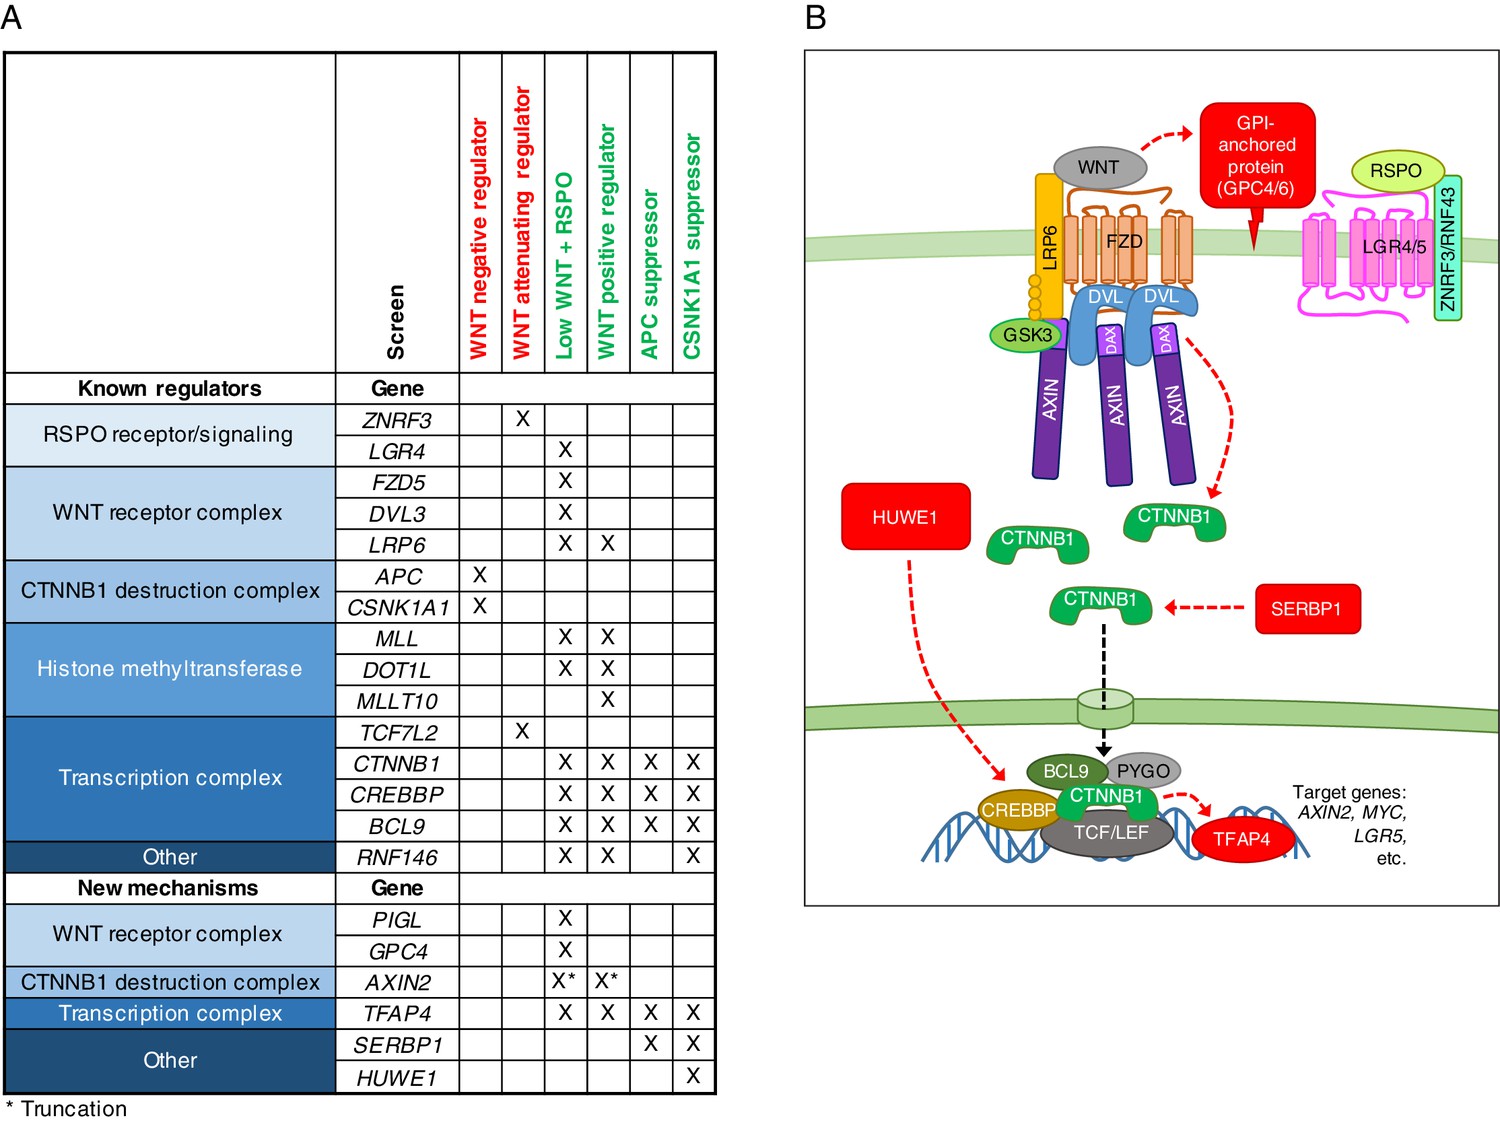
A comparative analysis of seven genome-wide screens revealed epistatic connections and regulatory mechanisms in WNT signaling.
(A) Summary of known regulators, and new regulators or regulators mediating new mechanisms in WNT signaling validated in this study. An ‘X’ denotes that the gene was enriched for GT insertions in the sorted cells from the indicated genetic screen (FDR-corrected p-value<0.05). Known regulators are grouped into functional modules and arranged according to previously described epistatic relationships. Epistatic relationships for new regulators or regulators mediating new mechanisms are inferred based on their patterns across screens. The screens in which cells were sorted for increased WNT reporter fluorescence are labeled in red, and those in which cells were sorted for reduced WNT reporter fluorescence are labeled in green. For the ‘WNT positive regulator’ column, hits from the WNT screens done at both low and high stringency (Figure 1E and F) were considered together. For AXIN2, the asterisk indicates that GT insertions mapped in the sorted cells generate a dominant allele that encodes a truncated protein product. (B) Model of WNT/CTNNB1 signaling, highlighting in red new regulatory mechanisms uncovered and validated in this study. Red arrows represent genetic (rather than biochemical) interactions. The various proposed mechanisms are discussed throughout the Results and Discussion sections.
Tables
Table 1
Relative gene expression level of selected WNT pathway regulators in HAP1 cells. RPKM values from duplicate RNAseq datasets generated as described in Materials and methods from two different passages of WT HAP1 cells are shown. Groups of paralogues and genes with similar functions are shaded in alternating colors to facilitate comparisons.
| Gene | RPKM | ||
|---|---|---|---|
| Replicate 1 | Replicate 2 | Average | |
| LGR4 | 160.61 | 174.69 | 167.65 |
| LGR5 | 0.02 | 0.00 | 0.01 |
| LGR6 | 0.02 | 0.00 | 0.01 |
| ZNRF3 | 30.90 | 33.30 | 32.10 |
| RNF43 | 0.12 | 0.08 | 0.10 |
| LRP5 | 55.92 | 64.38 | 60.15 |
| LRP6 | 109.51 | 121.08 | 115.30 |
| FZD1 | 19.57 | 18.85 | 19.21 |
| FZD2 | 19.56 | 21.09 | 20.33 |
| FZD3 | 48.02 | 55.82 | 51.92 |
| FZD4 | 19.60 | 22.10 | 20.85 |
| FZD5 | 31.85 | 34.52 | 33.19 |
| FZD6 | 33.53 | 31.95 | 32.74 |
| FZD7 | 13.89 | 14.89 | 14.39 |
| FZD8 | 4.02 | 4.48 | 4.25 |
| FZD9 | 3.66 | 2.80 | 3.23 |
| FZD10 | 10.40 | 9.86 | 10.13 |
| DVL1 | 73.91 | 69.61 | 71.76 |
| DVL2 | 51.74 | 48.80 | 50.27 |
| DVL3 | 88.84 | 90.25 | 89.54 |
| APC | 80.47 | 85.22 | 82.84 |
| APC2 | 2.94 | 3.69 | 3.32 |
| AXIN1 | 55.97 | 54.07 | 55.02 |
| AXIN2 | 10.04 | 12.51 | 11.27 |
| CSNK1A1 | 111.18 | 109.57 | 110.37 |
| GSK3A | 75.97 | 69.21 | 72.59 |
| GSK3B | 62.79 | 69.98 | 66.39 |
| TCF7L2 | 23.89 | 27.69 | 25.79 |
| LEF1 | 12.34 | 14.80 | 13.57 |
| CTNNB1 | 324.05 | 308.53 | 316.29 |
| CREBBP | 141.92 | 165.58 | 153.75 |
| PIGL | 4.07 | 4.51 | 4.29 |
| GPC4 | 209.39 | 229.86 | 219.63 |
| GPC6 | 13.88 | 14.90 | 14.39 |
| TFAP4 | 36.99 | 41.94 | 39.46 |
| SERBP1 | 721.65 | 698.99 | 710.32 |
| HUWE1 | 631.58 | 777.06 | 704.32 |
Additional files
-
Supplementary file 1
Ranked lists of hits from all screens.
Genes containing at least one GT insertion in the population of sorted cells from each genetic screen described in this work are listed in separate spreadsheets (the screen name is indicated on the tab of each spreadsheet), and are ranked based on the significance of GT insertion enrichment (p-value) in the sorted vs. the unsorted (control) cells. For the unsorted cells, the number of GT insertions in genes (regardless of orientation) is indicated for the complete dataset and for each gene (column B). For the sorted cells, the number of inactivating GT insertions in genes (sense and antisense insertions in exons and sense insertions in introns), as well as the number of sense or antisense GT insertions in exons or in introns, is indicated for the complete dataset and for each gene (columns C-G). Three measures of GT insertion enrichment are shown: the p-value and the FDR-corrected p-value (both derived from columns B and C), and the Intronic GT Insertion Orientation Bias (IGTIOB) score (derived from columns F and G). See Materials and methods for details.
- https://doi.org/10.7554/eLife.21459.018
-
Supplementary file 2
List of clonal cell lines used in this study.
Clones in which a single gene was targeted using CRISPR/Cas9 or disrupted by a GT insertion, and double- or triple-mutant clones in which multiple genes were disrupted using CRISPR/Cas9 or through a combination of CRISPR/Cas9 and a GT insertion are described in two separate spreadsheets labeled accordingly. For cell lines engineered using CRISPR/Cas9, when more than one clone was generated using the same CRISPR guide, the ‘Clone Name’ column indicates the generic name used throughout the manuscript to describe the genotype, and the ‘Clone #’ column identifies the specific allele in each individual clone. The ‘CRISPR guide’ column indicates the name of the guide used, which is the same as that of the oligos encoding sgRNAs (see Materials and methods and Supplementary file 4). The ‘Genomic Sequence’ column shows 80 bases of genomic sequence (5’ relative to the gene is to the left) surrounding the target site. For each group of clones made using the same CRISPR guide (separated by gray spacers), the ‘Genomic Sequence’ column is headlined by the reference WT genomic sequence (obtained from RefSeq), with the guide sequence colored blue. The site of the double strand cut made by Cas9 is between the two underlined bases. Sequencing results for individual clones are indicated below the reference sequence. Some WT clones are indicated as such and were used as controls. For mutant clones, mutated bases are colored red (dashes represent deleted bases, three dots are used to indicate that a deletion continues beyond the 80 bases of sequence shown, and large insertions are indicated in brackets), and the nature of the mutation, the resulting genotype (with the mutated amino acid number specified in parenthesis for selected clones) and any pertinent observations are also described. The figures in which each clone was used are also indicated. For the APCKO-2 clone containing a GT insertion, the 80 bases of genomic sequence (5’ relative to the gene is to the left) flanking the GT are shown in the ‘Genomic Sequence’ column. For double- or triple- mutant clones, the CRISPR guide or pair of guides used (if two different guides were used simultaneously to target adjacent sites in the same gene), the genomic sequence, the mutation, the genotype and any observations pertaining to each of the two or three targeted genes are designated ‘1’, ‘2’ and ‘3’ in the column headings, and are shown under green, orange and purple spacers, respectively.
- https://doi.org/10.7554/eLife.21459.019
-
Supplementary file 3
Lists of the most significant hits included in comparative analyses across screens.
Genes used to generate the heat map (Figure 4B) comparing the two WNT positive regulator screens (Figure 1E and F) and the low WNT + RSPO screen (Figure 4A) are shown in the first spreadsheet, and those used to generate the heat map (Figure 5D) comparing the WNT positive regulator, low stringency screen (Figure 1E) and the APC and CSNK1A1 suppressor screens (Figure 5B and C) are shown in the second spreadsheet. Genes with an FDR-corrected p-value<10−4 in at least one of the three screens included in each comparison are shown, and the FDR-corrected p-value and IGTIOB score for each gene in each screen is indicated. Genes are shown in the same order as in the heat maps, clustered based on their IGTIOB scores (see Materials and methods for details).
- https://doi.org/10.7554/eLife.21459.020
-
Supplementary file 4
List of oligonucleotides and primers used for generation and characterization of clonal cell lines engineered using CRISPR/Cas9.
The names and sequences of pairs of oligonucleotides encoding sgRNAs (which were cloned into pX330) are shown in columns A and B, respectively. The names and sequences of pairs of primers used to amplify corresponding genomic regions flanking sgRNA target sites are shown in columns C and D, respectively. The names and sequences of single primers used to sequence the amplified target sites are shown in columns E and F, respectively.
- https://doi.org/10.7554/eLife.21459.021
Download links
A two-part list of links to download the article, or parts of the article, in various formats.
Downloads (link to download the article as PDF)
Open citations (links to open the citations from this article in various online reference manager services)
Cite this article (links to download the citations from this article in formats compatible with various reference manager tools)
Comparative genetic screens in human cells reveal new regulatory mechanisms in WNT signaling
eLife 5:e21459.
https://doi.org/10.7554/eLife.21459


