Homeodomain protein Otp affects developmental neuropeptide switching in oxytocin neurons associated with a long-term effect on social behavior
- Weizmann Institute of Science, Israel
- Instituto Gulbenkian de Ciência, Portugal
- ISPA- Instituto Universitário, Portugal
Figures
Figure 1 with 1 supplement
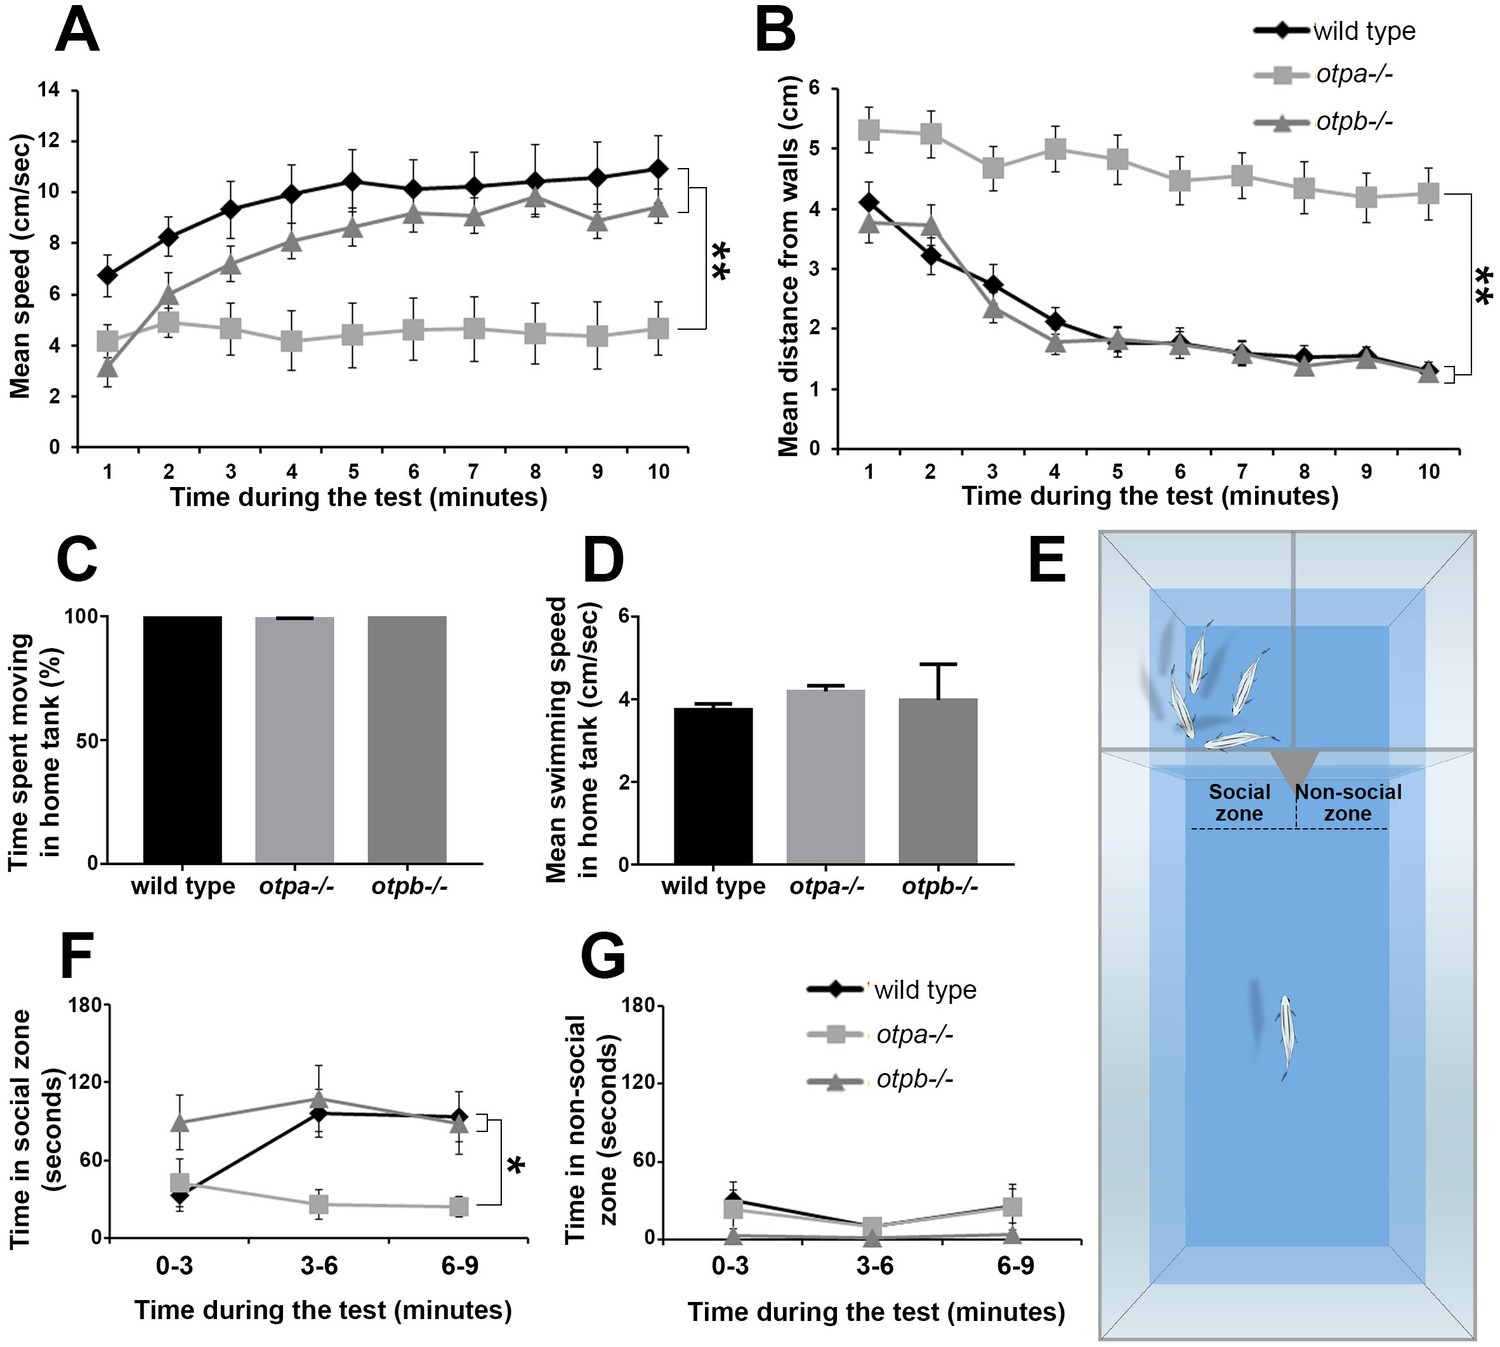
otpa but not otpb mutants display altered stress and social behavioral responses.
(A,B) Fish were placed in a novel circular tank and their behavior was recorded for 10 min. The mean and standard error (SEM) of the swimming speed (A) and the distance from the arena walls (B) in every minute of the test duration are plotted for wild types (n = 12), otpa−/− mutants (n = 23) and otpb−/− mutants (n = 13). Both wild type and otpb−/− exhibited significant (**p<0.01) habituation, as manifested by increased speed (A) and decreased distance from the wall (B), whereas otpa−/− did not habituate to the arena; they swam significantly (**p<0.01) slower (A) and farther from the wall (B) than both wild type and otpb−/− throughout the session. (C,D) Wild types (n = 12), otpa−/− (n = 20) and otpb−/− (n = 4) were recorded swimming for one minute in their home tanks and their locomotor parameters were analyzed. No differences were observed between the genotypes in either percent of time spent moving [X2(2)=3.605; p=0.165; C] or swimming speed [F(2)=1.293; p=0.288; D]. (E–G) Visually mediated social preference behavioral test of wild type, otpa−/− and otpb−/− mutants (n = 10 each). Fish were put in an isolated arena from which two compartments were visible, one containing a four-fish shoal and the other was empty (E). The time spent next to the shoal (‘social zone’; F) and next to the empty compartment (‘non-social zone’; G) were measured in three-minute time bins. Both wild type and otpb−/− exhibited significantly (*p<0.05) different social preference (F) specifically in the second and third time bins. Similar analyses of ‘time spent in the non-social zone’ indicated no differences between the genotypes (G).
-
Figure 1—source data 1
Swimming parameters for the behavioral tests.
- https://doi.org/10.7554/eLife.22170.004
Figure 1—figure supplement 1
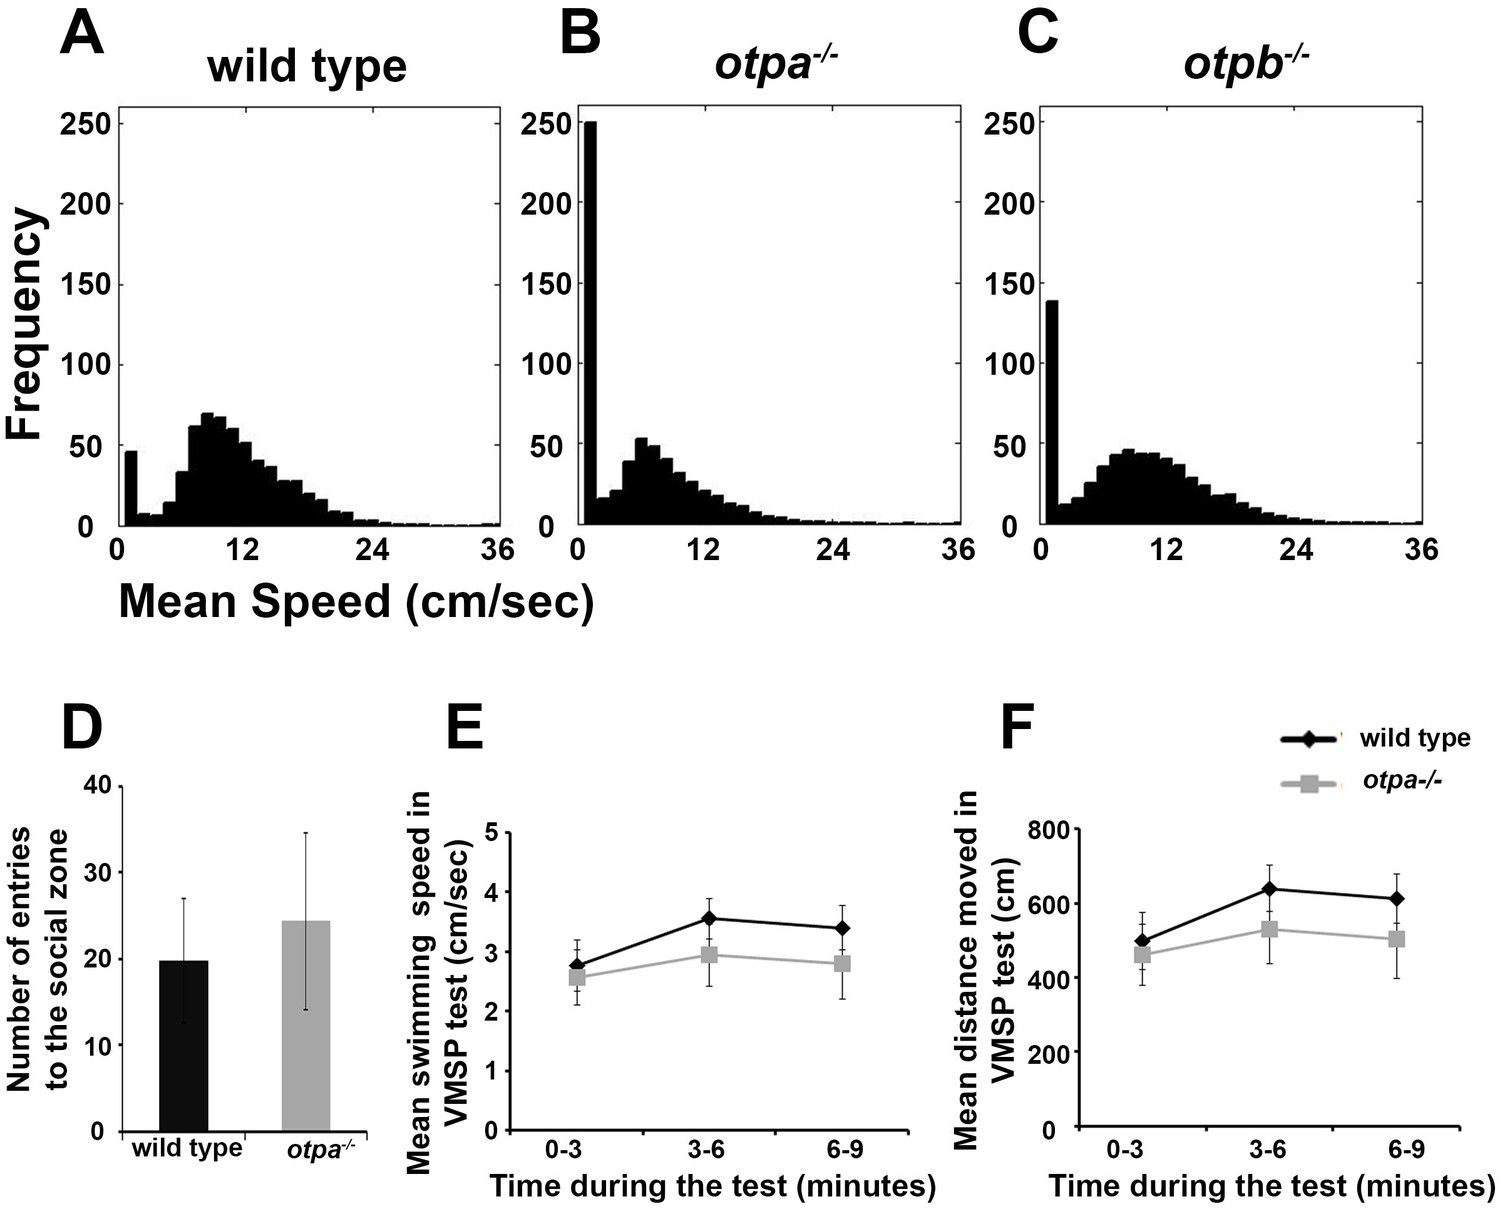
otpa−/− fish freeze more in the open field arena but display normal exploration of the social zone.
The swimming speeds of wild type (A; n = 12), otpa−/− (B; n = 23) and otpb−/− (C; n = 13) fish were recorded in one second time bins for 10 minutes in an open field arena. The distribution of frequencies of swimming speeds of all animals of the same genotype was normalized to the number of animals tested and was plotted in a 30-bin histogram. The frequency of incidence in which the fish displayed a mean swimming speed of zero cm/s was higher in otpa−/− compared to wild type and otpb−/− indicating higher freezing rate. (D–F) Swimming parameters of wild type and otpa−/− fish (n = 10 each) during the visually mediated social preference behavioral test. The number of entries to the social zone (D), mean swimming speed (E) and distanced moved (F) were recorded. No significant differences were found in any of the above parameters.
-
Figure 1—figure supplement 1—source data 1
Swimming parameters for the behavioral tests.
- https://doi.org/10.7554/eLife.22170.006
Figure 2 with 3 supplements
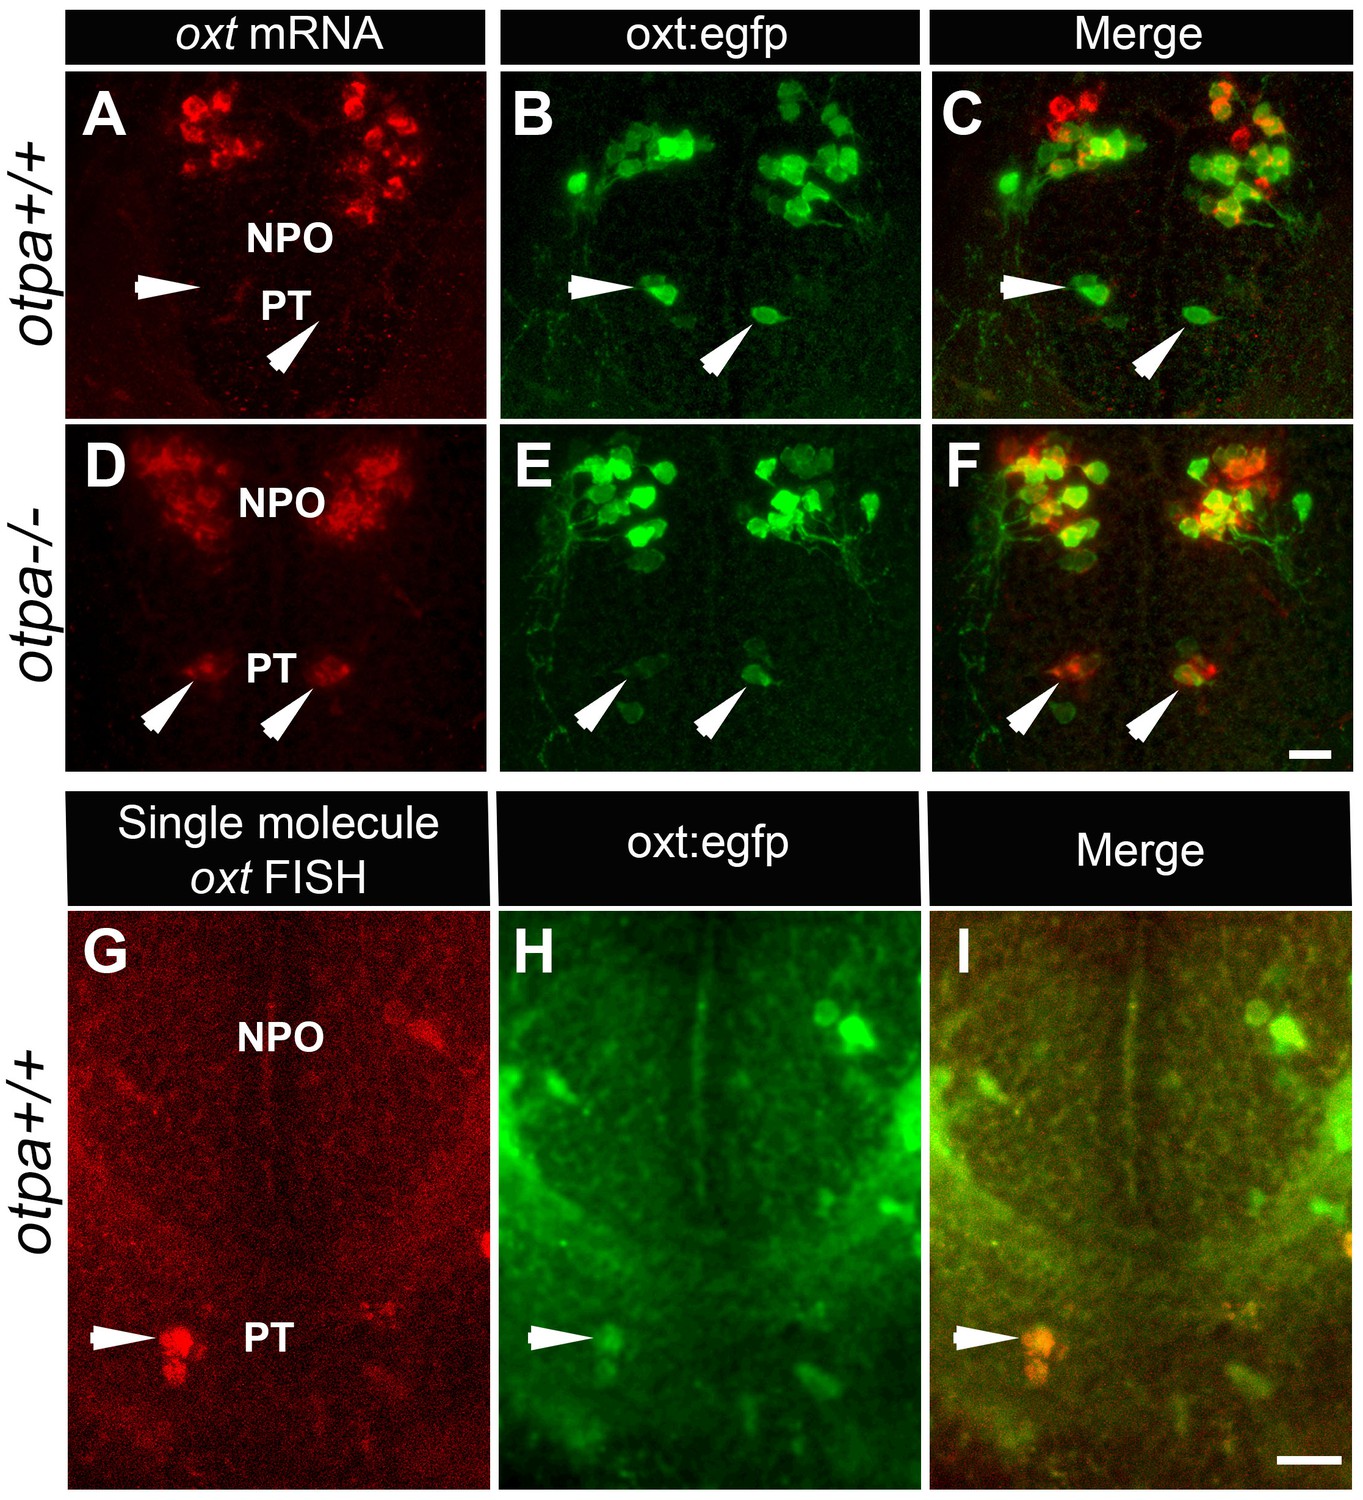
otpa mutant reveals a new cluster of hypothalamic OXT neurons.
(A–F) In situ hybridization of oxt mRNA in 5 day-old wild type (otpa+/+) and otpa−/− mutant on the background of a transgenic OXT reporter Tg(oxt:egfp) followed by confocal imaging (dorsal view, anterior to the top). otpa+/+;Tg(oxt:egfp) fish do not express detectable levels of oxt mRNA (A), but express EGFP in the posterior tuberculum (PT; B). otpa−/−; Tg(oxt:egfp) mutants express oxt mRNA (D) in oxt:egfp-positive cells of the PT (E). PT OXT neurons are indicated by arrowheads. Scale bar, 20 µm. (G–I) A representative image (single confocal plane) of a transgenic [otpa+/+;Tg(oxt:egfp)] larvae, which was subjected to fluorescent in situ hybridization (FISH) with a single-molecule oxt mRNA probe (Stellaris) showing co-localization (arrowhead) of oxt in EGFP-labelled PT cells. NPO, neurosecretory preoptic area. Scale bar, 20 µm.
Figure 2—figure supplement 1

Ectopic oxt mRNA expression in otpa−/− mutants.
Fluorescent in situ hybridization of oxt mRNA in wild type and otpa−/− mutants that were fixed at various developmental stages (2–5 days). The PT region of otpa−/− mutants is marked by a dotted rectangle. Dorsal view, anterior to the top. Scale bar, 20 µm.
Figure 2—figure supplement 2
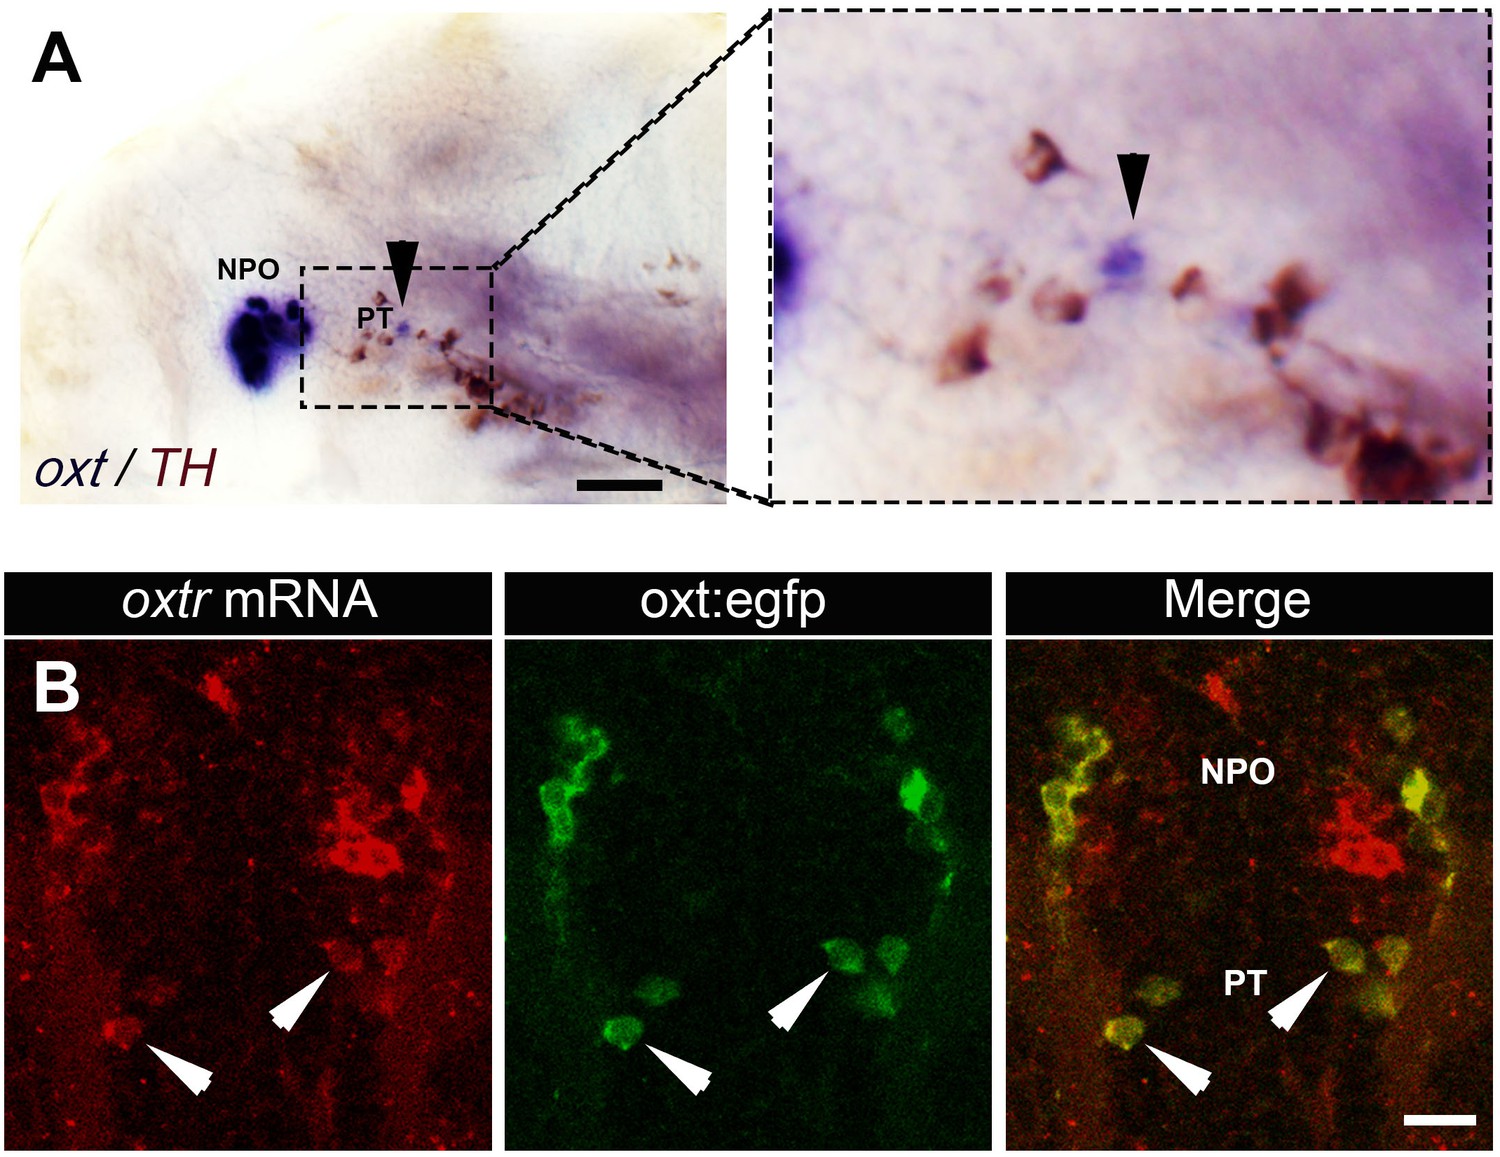
Expression of oxt and its receptor by PT OXT neurons.
(A) Whole-mount in situ hybridization with DIG-labeled RNA probe directed against the oxt followed by a long (e.g. to saturation) development to NBT-BCIP colorimetric substrate. The specimen was then subjected to immunostaining with an anti-tyrosine hydroxylase (TH) antibody to detect dopaminergic neurons that serves as a landmark for the position of the posterior tuberculum (PT). Arrowheads in the left and right (zoomed in) panels indicates the position of PT OXT neurons expressing low but detectable levels of oxt mRNA. Scale bar, 100 µm. (B) A representative image (single confocal plane) of a transgenic Tg(oxt:egfp) larvae, which was subjected to fluorescent in situ hybridization with an oxytocin receptor (oxtr) mRNA probe (red) followed by immunostaining for EGFP (green). PT OXT cells that express oxtr are indicated by arrowheads. Scale bar, 20 µm.
Figure 2—figure supplement 3
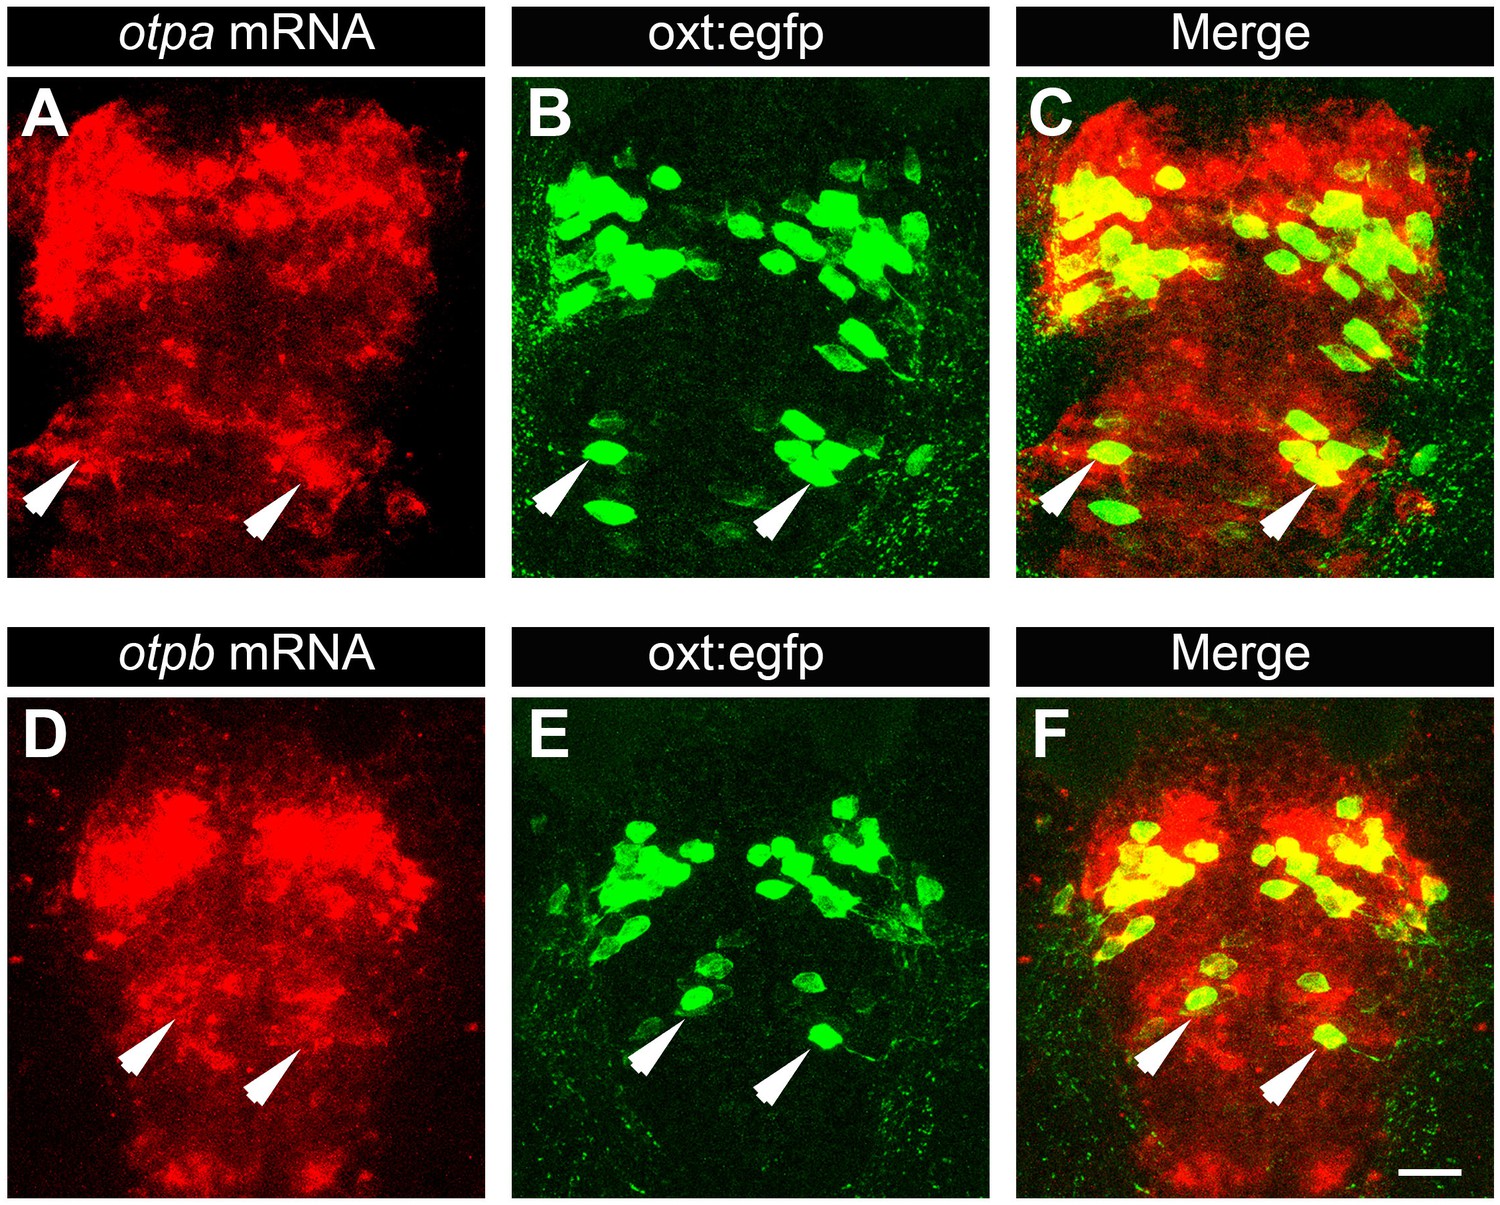
Posterior tuberculum (PT) OXT neurons express otpa and otpb.
Confocal imaging of 6 day-old Tg(oxt:egfp) larvae that were subjected to a whole mount in situ hybridization with otpa (A–C) or otpb (D–F) antisense probes followed by antibody-staining for EGFP (dorsal view, anterior to the top). Arrows indicate examples of OXT cells expressing otpa or otpb in the PT area. Scale bar, 20 µm.
Figure 3
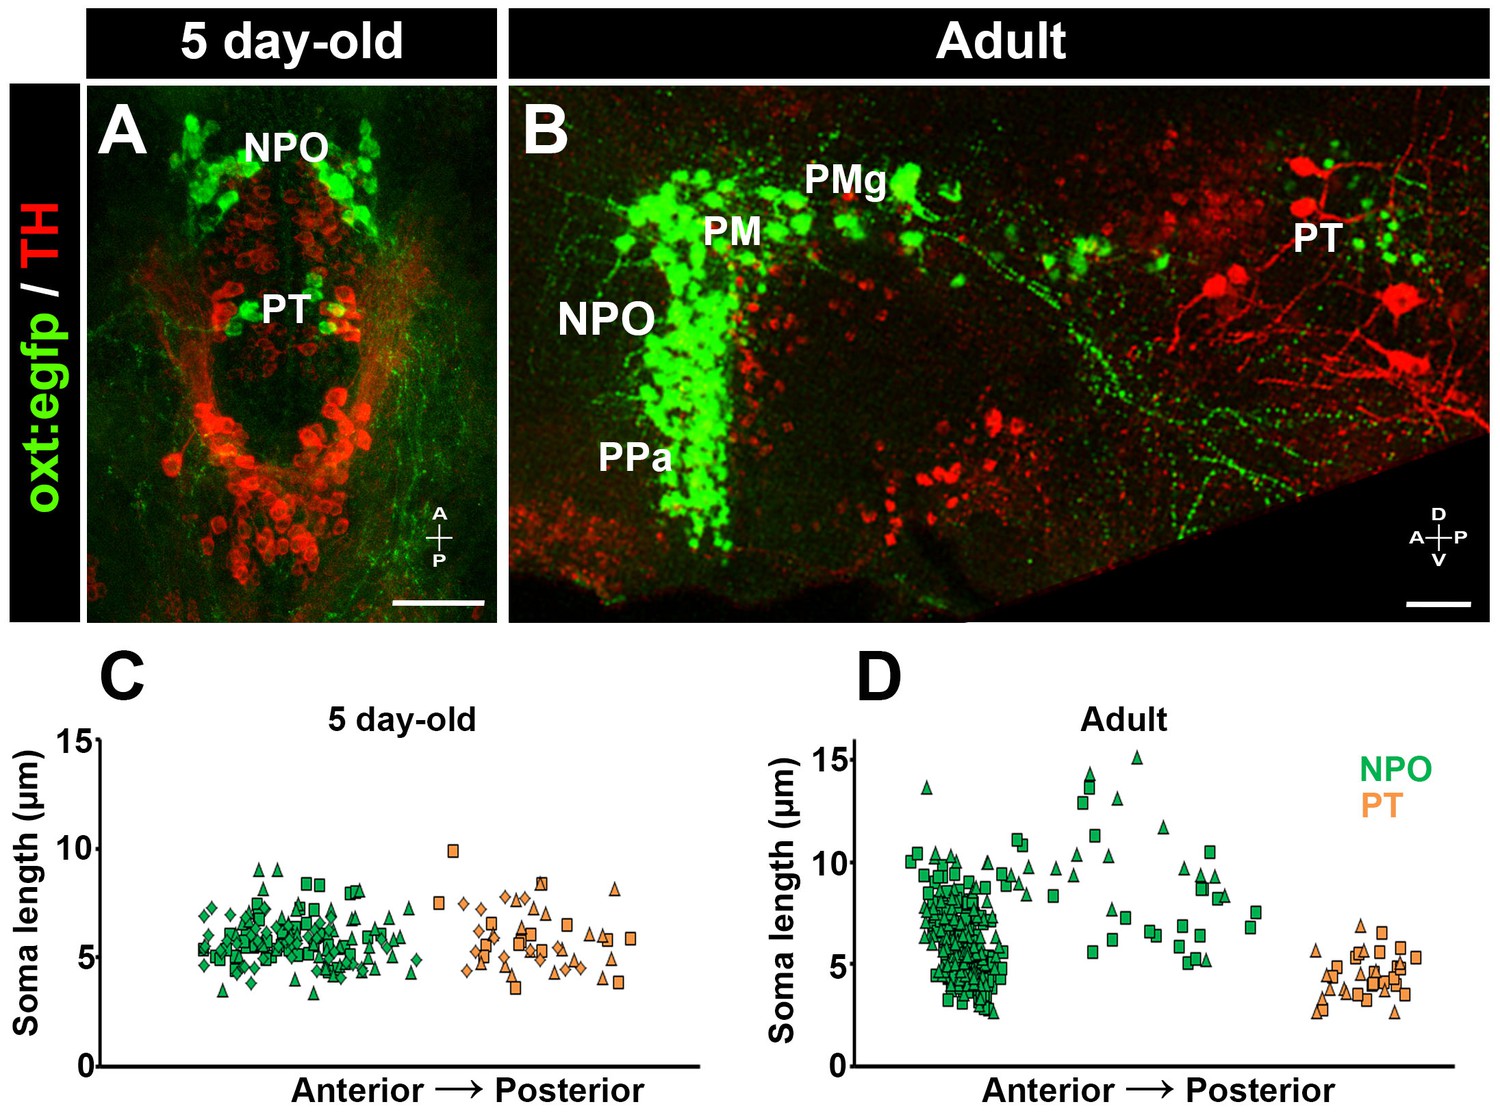
Posterior tuberculum (PT) OXT neurons represent a new cluster of zebrafish parvocellular neurons.
Immunostaining and confocal imaging of either 5 day-old larva (A) or adult (B; 150 µm sagittal section) transgenic OXT reporter Tg(oxt:egfp) with a tyrosine hydroxylase (TH) antibody which serves as an anatomical landmark. The soma size of OXT neurons was measured using FIJI image-processing package in three larvae (C) and two adults (D) and plotted as a function of their relative anterior-posterior position. Each individual animal is marked by a different shape. NPO and PT neurons are labeled in green and orange, respectively. NPO, neurosecretory preoptic area; PM, magnocellular preoptic nucleus; PMg, gigantocellular part of magnocellular preoptic nucleus; PPa, parvocellular preoptic nucleus - anterior part; PT, posterior tuberculum; TH, tyrosine hydroxylase.
-
Figure 3—source data 1
Size and location of OXT cell bodies.
- https://doi.org/10.7554/eLife.22170.012
Figure 4
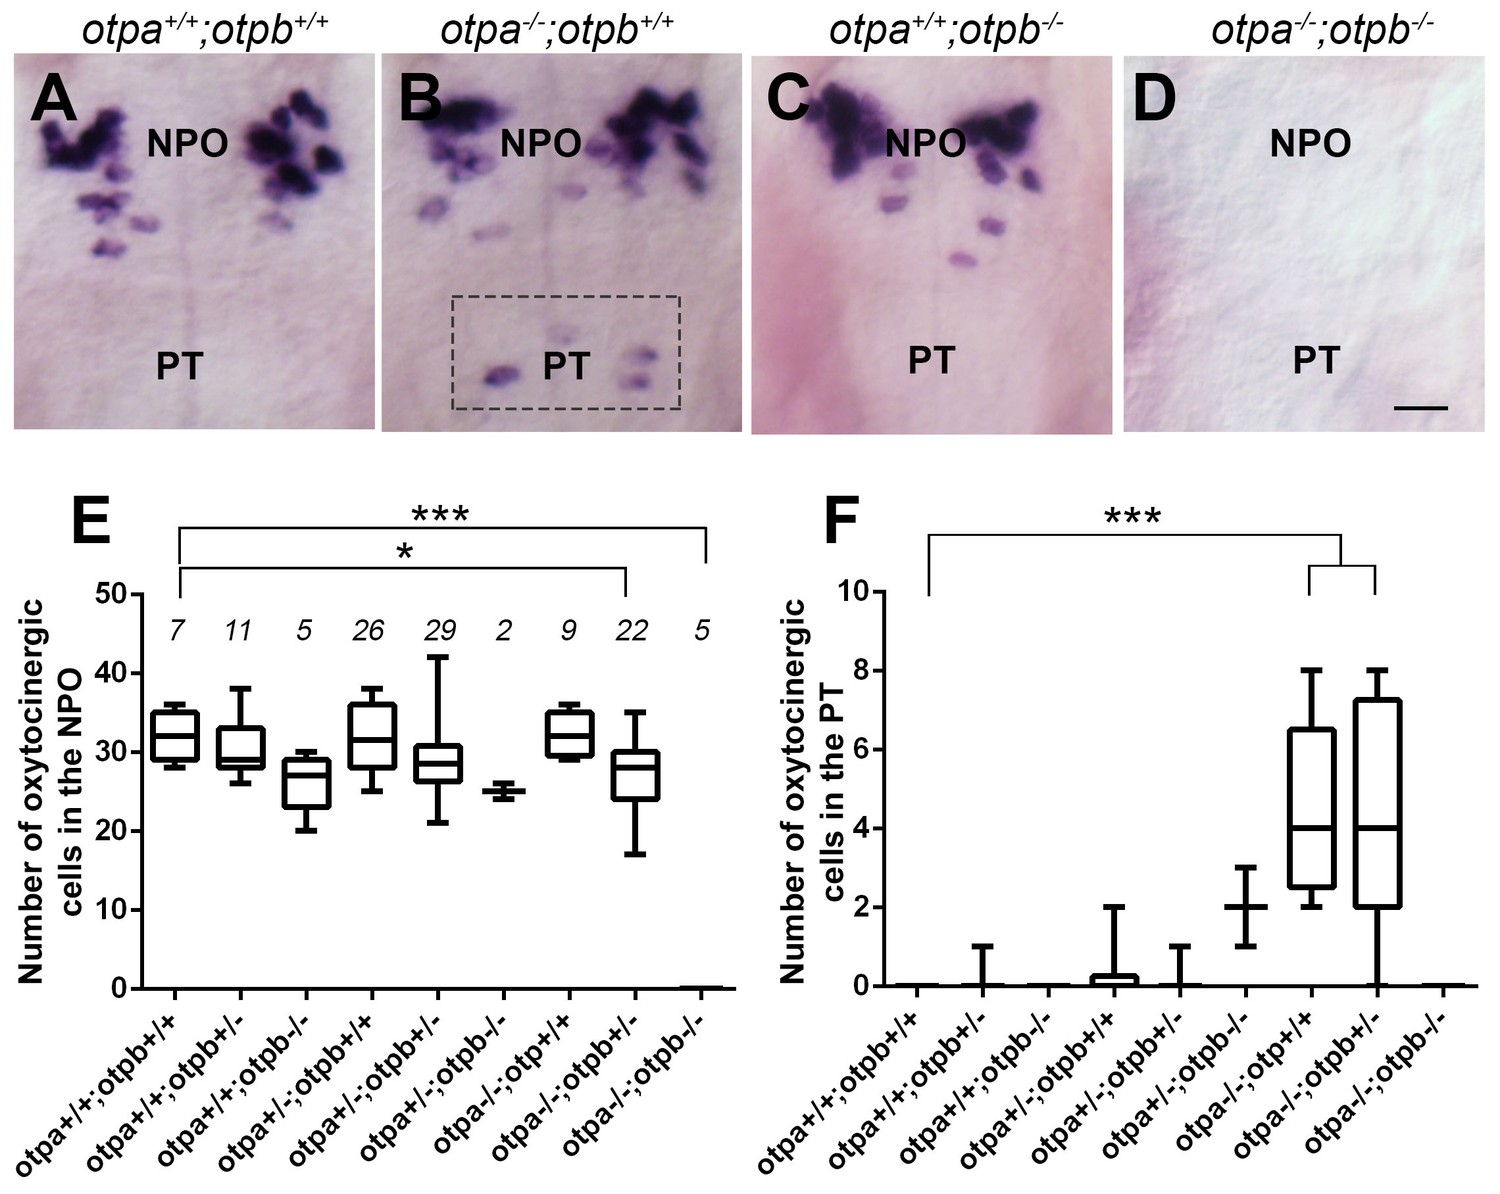
Otp paralogs have differential effect on hypothalamic oxt expression.
(A–D) Representative high-resolution micrographs of 5 day-old embryos that were subjected to whole mount in situ hybridization with oxt mRNA probe (dorsal view, anterior to the top). oxt-positive neurons in the posterior tuberculum (PT) of otpa−/− mutants are marked by a dotted rectangle (B). Scale bar, 20 µm. (E,F) Box and whisker plots showing OXT cell number counts in the neurosecretory preoptic area (NPO; E) and in the PT (F) in various genotypes. The numbers of embryos used for the quantification are indicated above each box. In the NPO, otpa+/+;otpb+/+ fish differed significantly only from otpa−/−;otpb+/− (*p=0.013) and otpa−/−;otpb−/− (***p=0.000). In the PT otpa+/+;otpb+/+ differed significantly (***p=0.000) only from otpa−/−;otpb+/− and otpa−/−;otpb+/+.
-
Figure 4—source data 1
Number of OXT neurons in the NPO and PT.
- https://doi.org/10.7554/eLife.22170.014
Figure 5
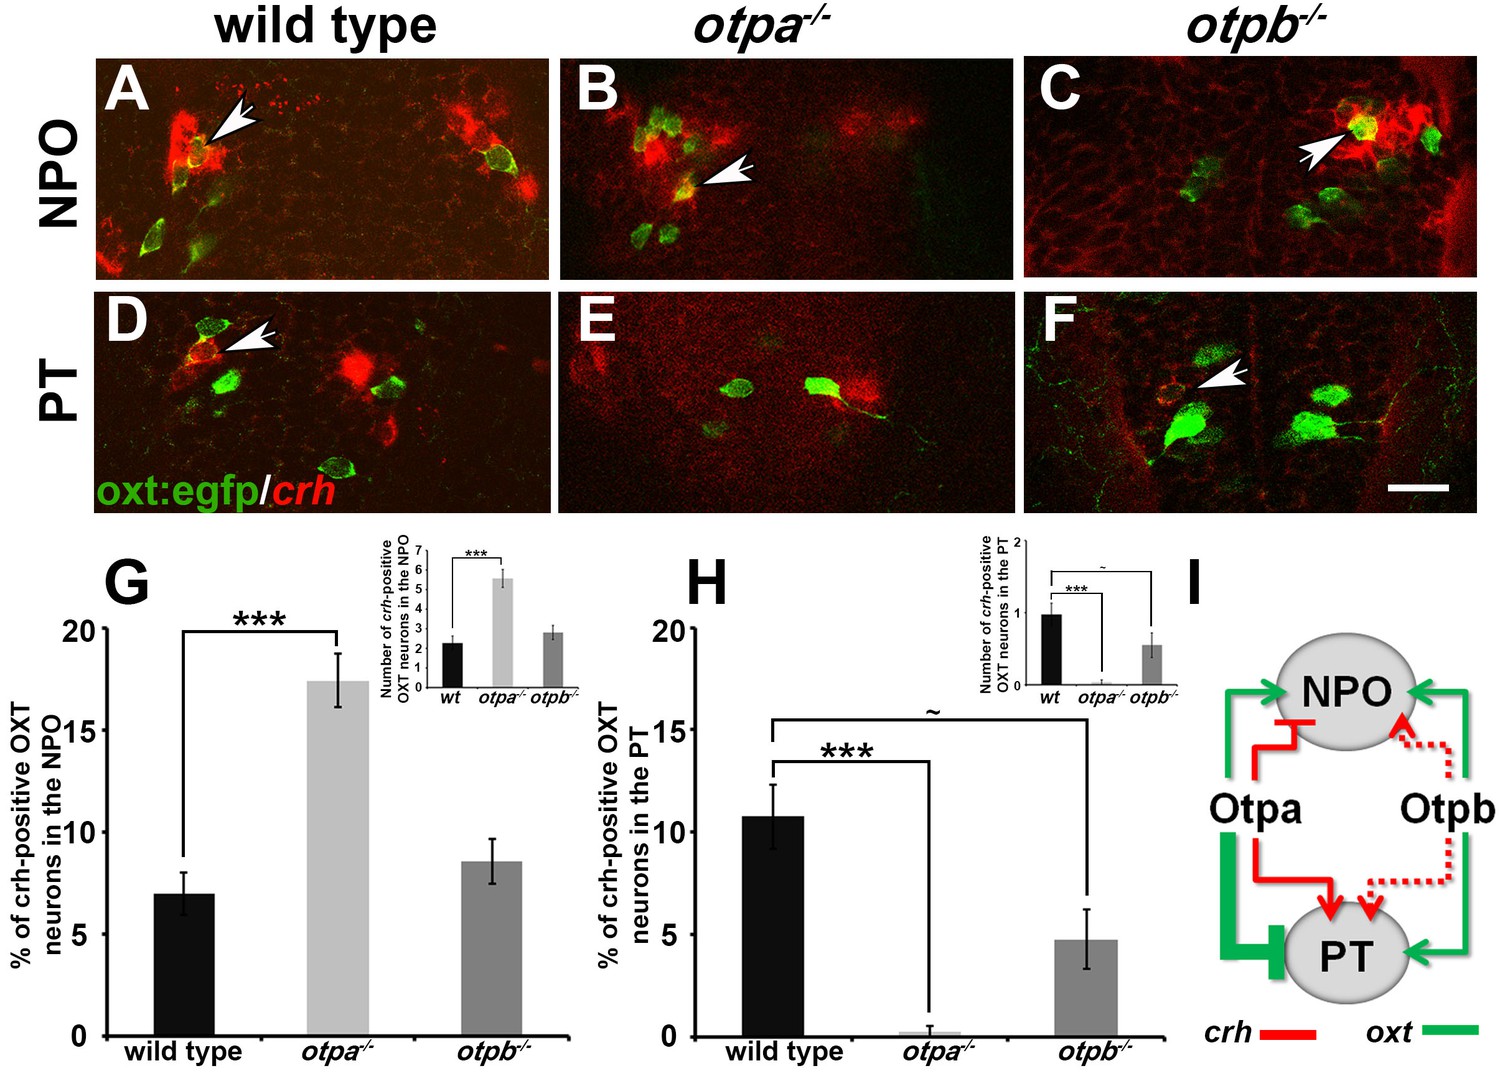
Otp paralogs regulate neuropeptide switching in OXT neurons.
(A–F) In situ hybridization of crh mRNA in wild type, otpa−/− and otpb−/− on the background of a transgenic OXT reporter [Tg(oxt:egfp)]. The image panels show representative single confocal planes (dorsal view, anterior to the top) of OXT neurons in either the neurosecretory preoptic area (NPO; A–C) or the posterior tuberculum (PT; D–F). OXT neurons expressing crh mRNA are indicated by arrowheads. Scale bar, 20 µm. (G,H) Bar histogram showing the percentage (%) and cell count (upper right insets) of OXT cells co-expressing crh in the NPO (G) and PT (H). wild type (n = 40), otpa−/− (n = 30) and otpb−/− (n = 20). Kruskal-Wallis indicated a significant main effects for ‘genotype’ on the percentage of crh-positive OXT neurons in both the NPO [X2(2)=29.284; p=0.000] and PT [X2(2)=27.174; p=0.000]; Dunn’s corrected pair-wise comparisons indicated that in both the NPO and PT, wild type differed significantly from otpa−/− (p=0.000). Notably, otpb−/− mutants exhibit a trend for decreased (p=0.077) crh-positive OXT neurons when compared to WT. (I) A model summarizing the suggested effects of otp paralogs on neuropeptide switching in OXT neuronal clusters in NPO and PT based on the results presented in Figures 4 and 5 (see text). Arrows and T-bars indicated a positive and negative effect, respectively. Dotted arrows indicate a trend for a positive effect of otpb on crh expression.
-
Figure 5—source data 1
Percentage of CRH-positive OXT neurons in the NPO and PT.
- https://doi.org/10.7554/eLife.22170.016
Figure 6 with 1 supplement
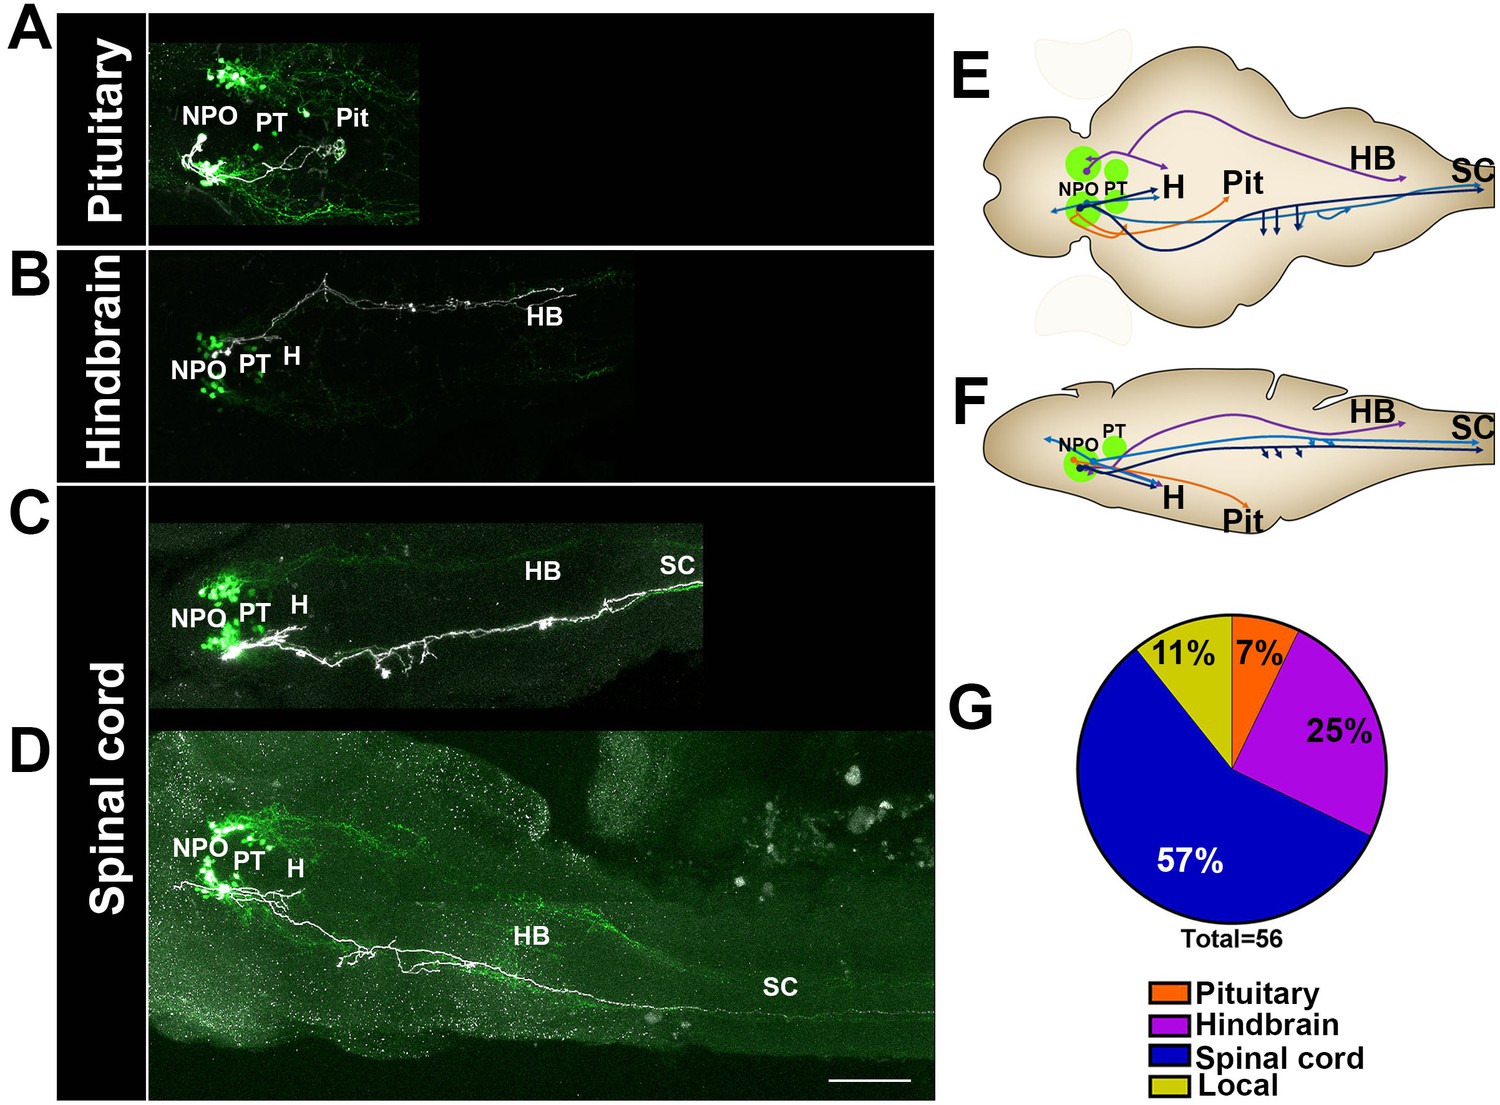
Single-cell projection mapping of anterior (NPO) OXT-ergic trajectories.
(A–D) Confocal images showing representative single-cell genetic labeling of the NPO OXT neurons (grey scale) in the context of the global OXT-ergic population in a oxt:egfp reporter (green). In short, the Tg(oxt:egfp) reporter line was microinjected with OXT-specific Gal4 driver, (oxt:Gal4) construct together with constructs harbouring membrane localized caax-tRFP under the control of a multimerized Gal4 upstream activation sequence (10xUAS). Neuronal projections of RFP-labelled cells were traced and reconstituted from the 3D confocal Z-Stack. Examples of single-cell labeling of OXT projections to the posterior pituitary/neurohypophysis (A; Pit), hindbrain (B; HB) and spinal cord (C, D; SC) as well as local projections to the hypothalamus (labelled ‘H’ in panels C and D) are shown. Scale bar, 100 µm. (E,F) Schemes illustrating dorsal (E) and lateral (F) views of the traced projecting neurons. (G) Pie chart showing the percentage of each type of projecting OXT neurons, which reside in the NPO.
Figure 6—figure supplement 1
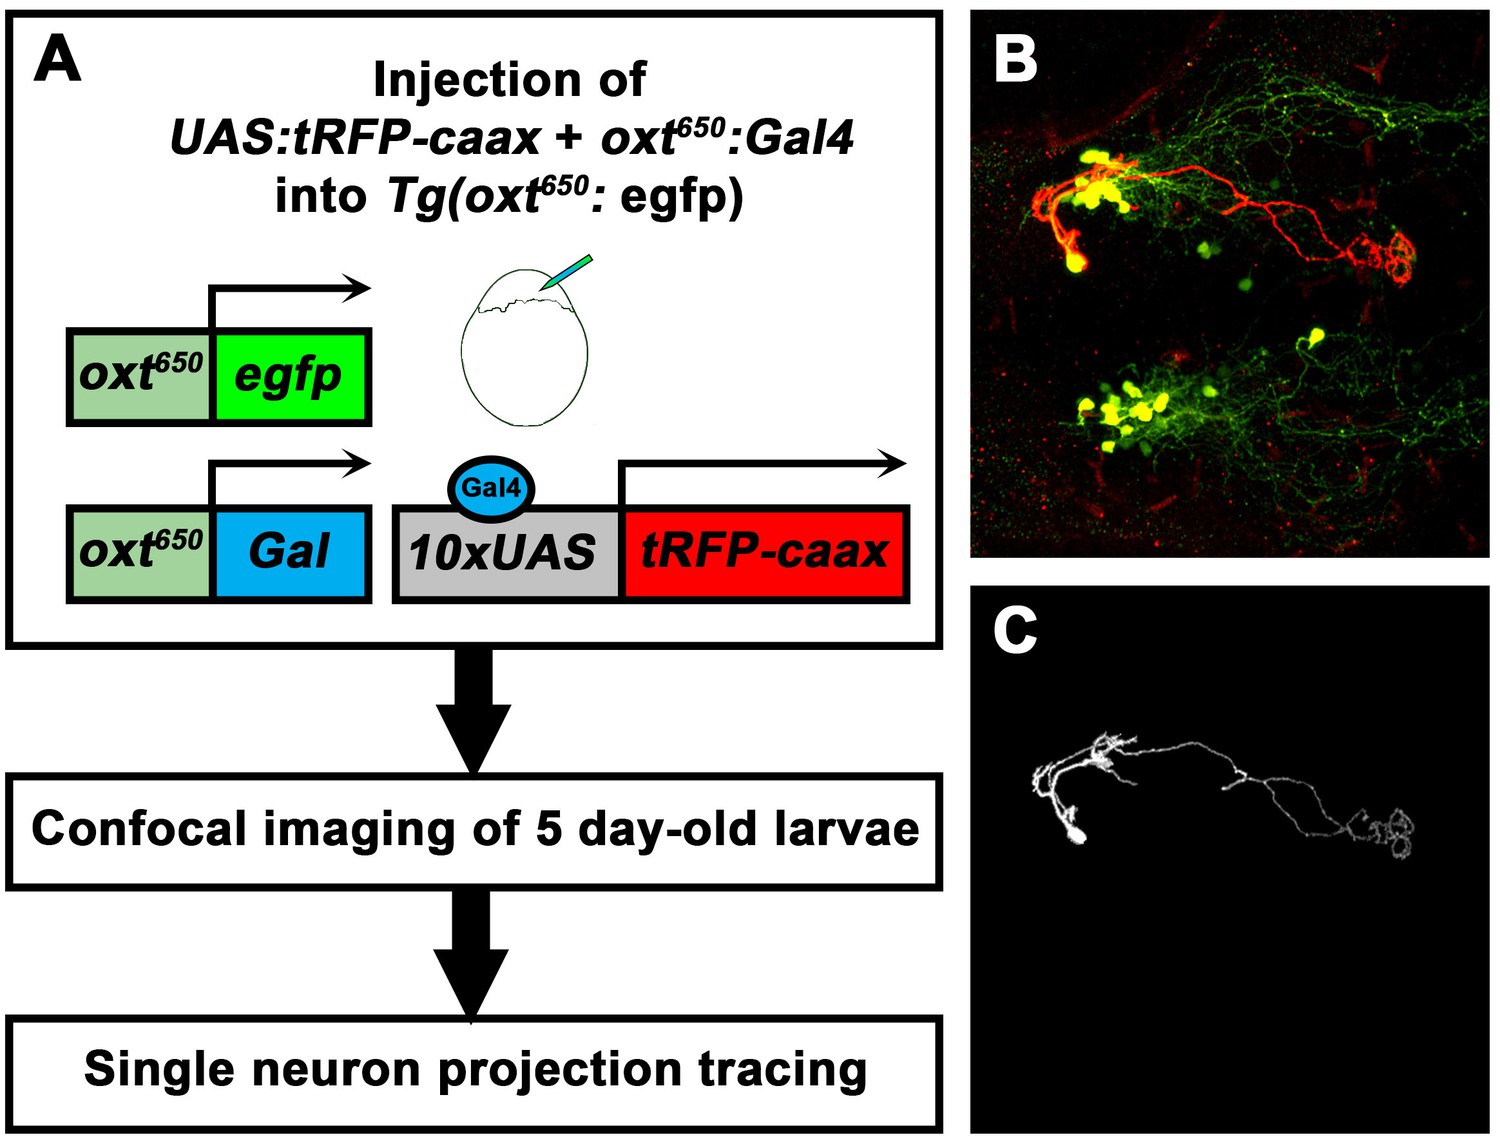
Single-cell labelling and projection tracing of OXT neurons.
(A) A scheme describing the single-cell labeling method used to trace the projections made by each OXT-ergic neuron. Transgenic Tg(oxt:egfp) embryos were co-microinjected with OXT-specific Gal4 driver, (oxt:Gal4) construct (Blechman et al., 2011) together with constructs harbouring membrane localized caax-tRFP under the control of a multimerized Gal4 upstream activation sequence (10xUAS). Injected embryos were fixed at five dpf, stained for tRFP and EGFP and imaged by a confocal microscope. Injection was calibrated to drives the mosaic expression of caax-tRFP at low efficiency, resulting in single-cell genetic labeling in OXT-ergic neurons. (B) An example of single-cell labeling of an hypothalamo-neurohypophyseal OXT projecting neuron to the posterior pituitary/neurohypophysis. (C) Labeled cells were traced from the 3D confocal Z-Stack using the Fiji image processing and analysis package for 3D tracing and reconstitution with the Simple Neurite Tracer plugin.
Figure 7 with 1 supplement
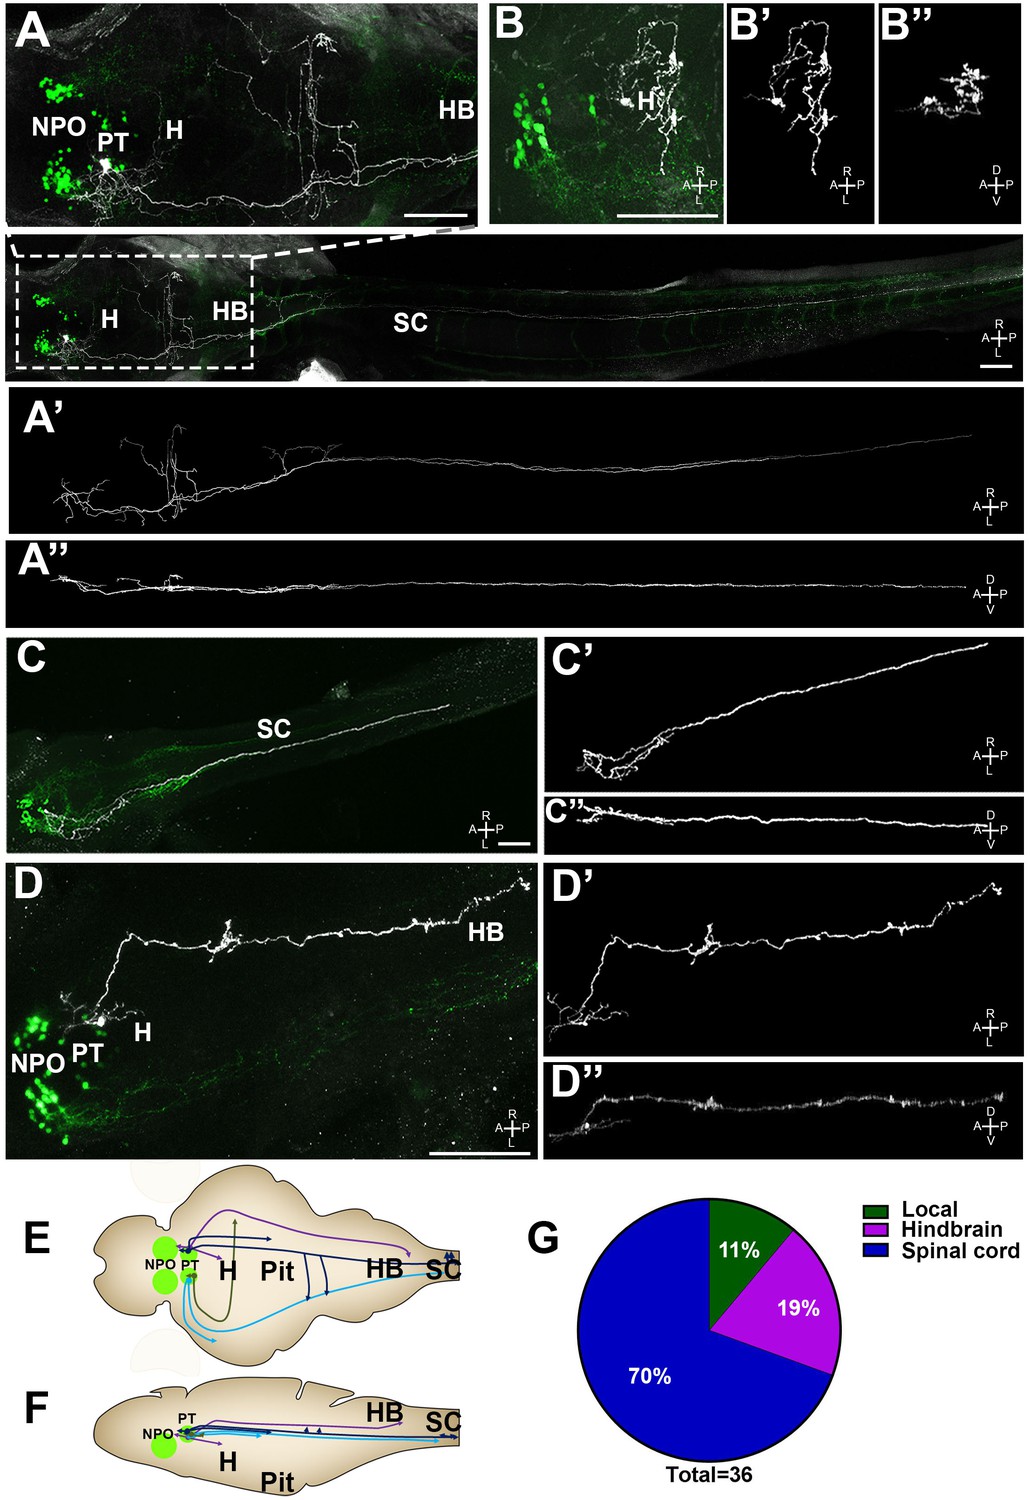
Single-cell projection mapping of posterior tuberculum (PT) OXT-ergic trajectories.
(A–D) Confocal images showing representative single-cell genetic labeling of the PT OXT neurons (grey scale) in the context of the global OXT-ergic population in a oxt:egfp reporter (green). The 3D-traced projecting neurons are presented in A’–D’ (dorsal) and A’’–D’’ (lateral). Examples of OXT projections to the spinal cord (SC; A and C), local (B) and hindbrain (HB; D) projecting neuron are presented. The fish orientation is indicated at the bottom right corner of each image: A, anterior; D, dorsal; L, left, P, posterior, R, right; V, ventral. Scale bars, 100 µm. (E,F) Schemes illustrating dorsal (E) and lateral (F) views of the traced projecting neurons. (G) Pie chart showing the percentage of each type of projecting OXT neurons, which reside in the PT.
Figure 7—figure supplement 1
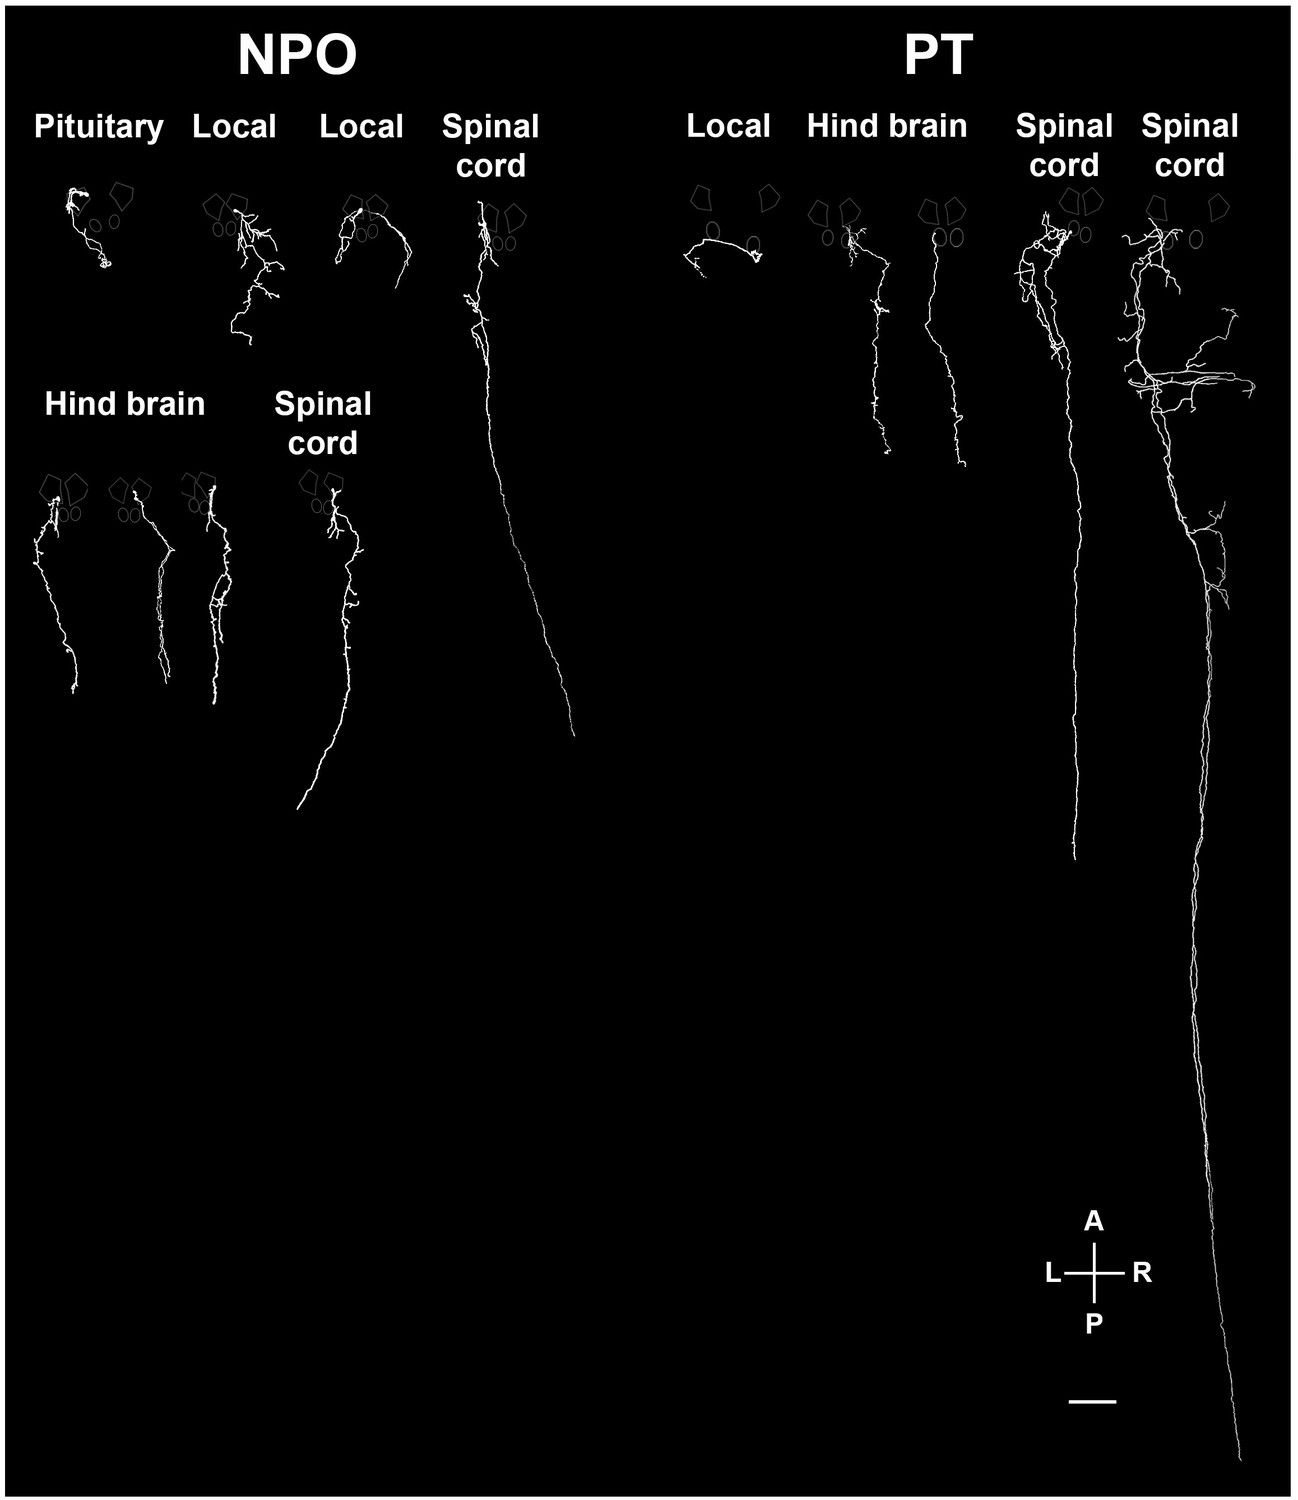
Various types of projecting OXT neurons.
Examples of neuronal tracing of labeled OXT neurons. The cell bodies reside within either the neurosecretory preoptic area (NPO) and the posterior tuberculum (PT) and project to the spinal cord, hindbrain, pituitary and proximate locations in the brain. The locations of the major OXT clusters are outlined in white. A, anterior; L, left; P, posterior; R, right. Scale bar, 100 µm.
Figure 8 with 1 supplement
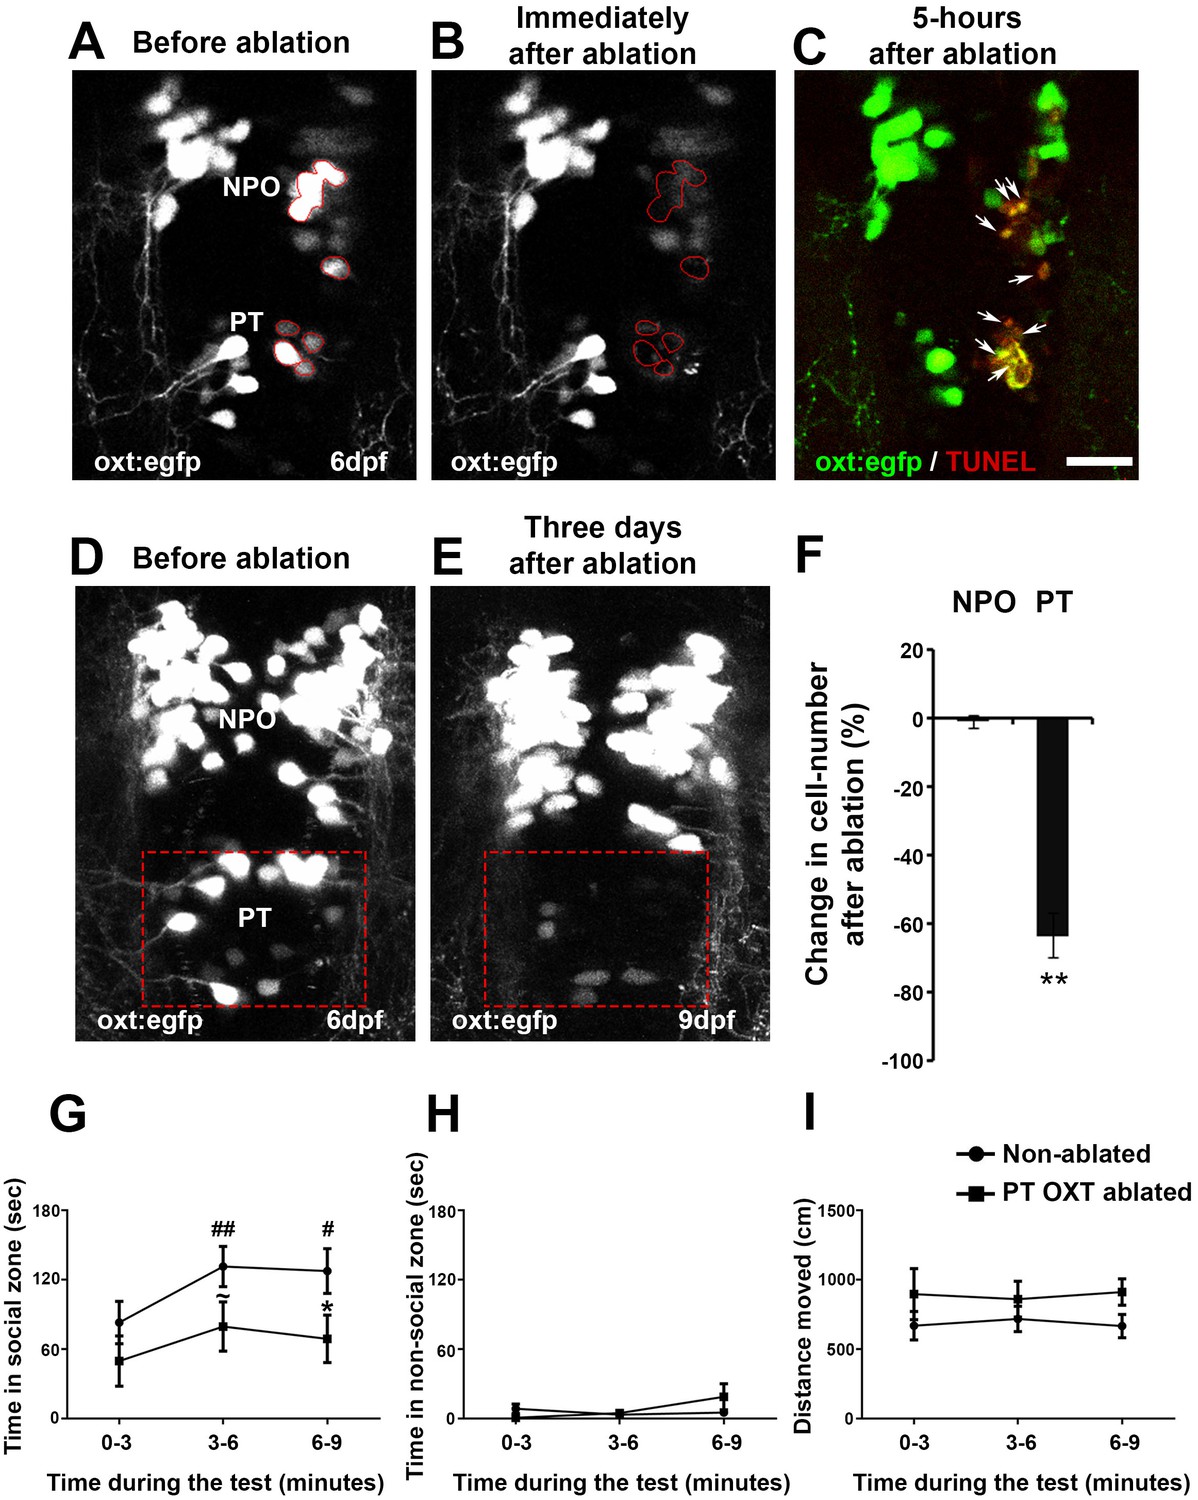
Ablation of posterior tuberculum (PT) OXT neurons affects social preference.
(A–C) Unilateral ablation of oxt:egfp cells using two-photon microscope. Region of interest for the targeted ablation of individual cells is outlined in red (A,B). Specimens were fixed 5 hr after ablation and were subjected to TUNEL staining (red) to detect apoptosis and verify lack of collateral damage to the surrounding cells/tissue (C). The ablated OXT neurons are marked by arrows (C). (D–F) Representative images taken before (D) and three days after (E) ablation of PT OXT neurons (marked by a red rectangle). (F) Percentage of the change in OXT cell number after the ablation procedure in the PT region and in the non-ablated NPO area (n = 5). Paired sample t-test indicated that the reduction in number of OXT cells in the PT was significant [t(4)=3.738; **p=0.010] but not in the NPO [t(4)=0.559; p=0.303]. (G–I) Graphs showing the analysis of visually mediated social preference (VMSP) test (see schemata in Figure 1E) comparing the place preference of PT OXT-ablated (n = 12) to non-ablated (n = 14) zebrafish. The time spent swimming in the social zone (G), non-social zone (H) and general locomotion (I; ‘distance moved’) were analyzed. (G) When comparing the ‘time in social zone’ between PT OXT ablated fish and non-ablated control, there is a trend for a difference in the second time bin (~p = 0.069) and a significant difference in the third time bin (*p=0.050). In addition, while the non-ablated group spends increasingly more time in the ‘social zone’ when compared to the first time bin (there is a significant main effect for ‘time’ in the non-ablated fish group (p=0.012); ##p≤0.01 for the 1st bin and #p≤0.05 for the second bin), no significant effect for ‘time’ was found for the PT OXT-ablated group (p=0.166). (H) Time spent in the ‘non-social zone’ did not differ between the groups [F(1,24)=0.212; p=0.649] and did not change throughout the test duration [F(2,48)=2.300; p=0.135]. (I) The total distance moved in the arena did not differ between the groups [F(1,24)=1.771; p=0.196] and did not change throughout the test duration [F(2,48)=0.010; p=0.969].
-
Figure 8—source data 1
Ablation efficiency of OXT neurons and associated behavioral effects.
- https://doi.org/10.7554/eLife.22170.022
Figure 8—figure supplement 1

PT OXT ablated fish habituate to an open field arena.
Open field test comparing non-ablated (n = 16) with PT OXT ablated (n = 13) fish. Swimming was recorded for 10 minutes and mean (± SEM) swimming speed (A) and distance from the arena walls (B) per minute were measured and plotted. No differences were found between the groups in ‘distance from wall’ as both groups exhibited significant (p<0.01) habituation, as manifested by swimming near the wall (B). A significant difference was found between the groups in swimming speed (p<0.05; A); whereas the ‘non-ablated’ group significantly (p<0.01) increased the swimming speed throughout the session, the ‘PT OXT ablated’ group swam at a relative high speed throughout the session.
-
Figure 8—figure supplement 1—source data 1
Swimming parameters for the open field test following OXT ablation.
- https://doi.org/10.7554/eLife.22170.024
Download links
A two-part list of links to download the article, or parts of the article, in various formats.
Downloads (link to download the article as PDF)
Open citations (links to open the citations from this article in various online reference manager services)
Cite this article (links to download the citations from this article in formats compatible with various reference manager tools)
Homeodomain protein Otp affects developmental neuropeptide switching in oxytocin neurons associated with a long-term effect on social behavior
eLife 6:e22170.
https://doi.org/10.7554/eLife.22170


