Changes in the free-energy landscape of p38α MAP kinase through its canonical activation and binding events as studied by enhanced molecular dynamics simulations
- The Barcelona Institute of Science and Technology, Spain
- University College London, United Kingdom
- Catalan Institution for Research and Advanced Studies (ICREA), Spain
- Joint BSC-CRG-IRB Program in Computational Biology, Spain
- University of Barcelona, Spain
Figures
Figure 1
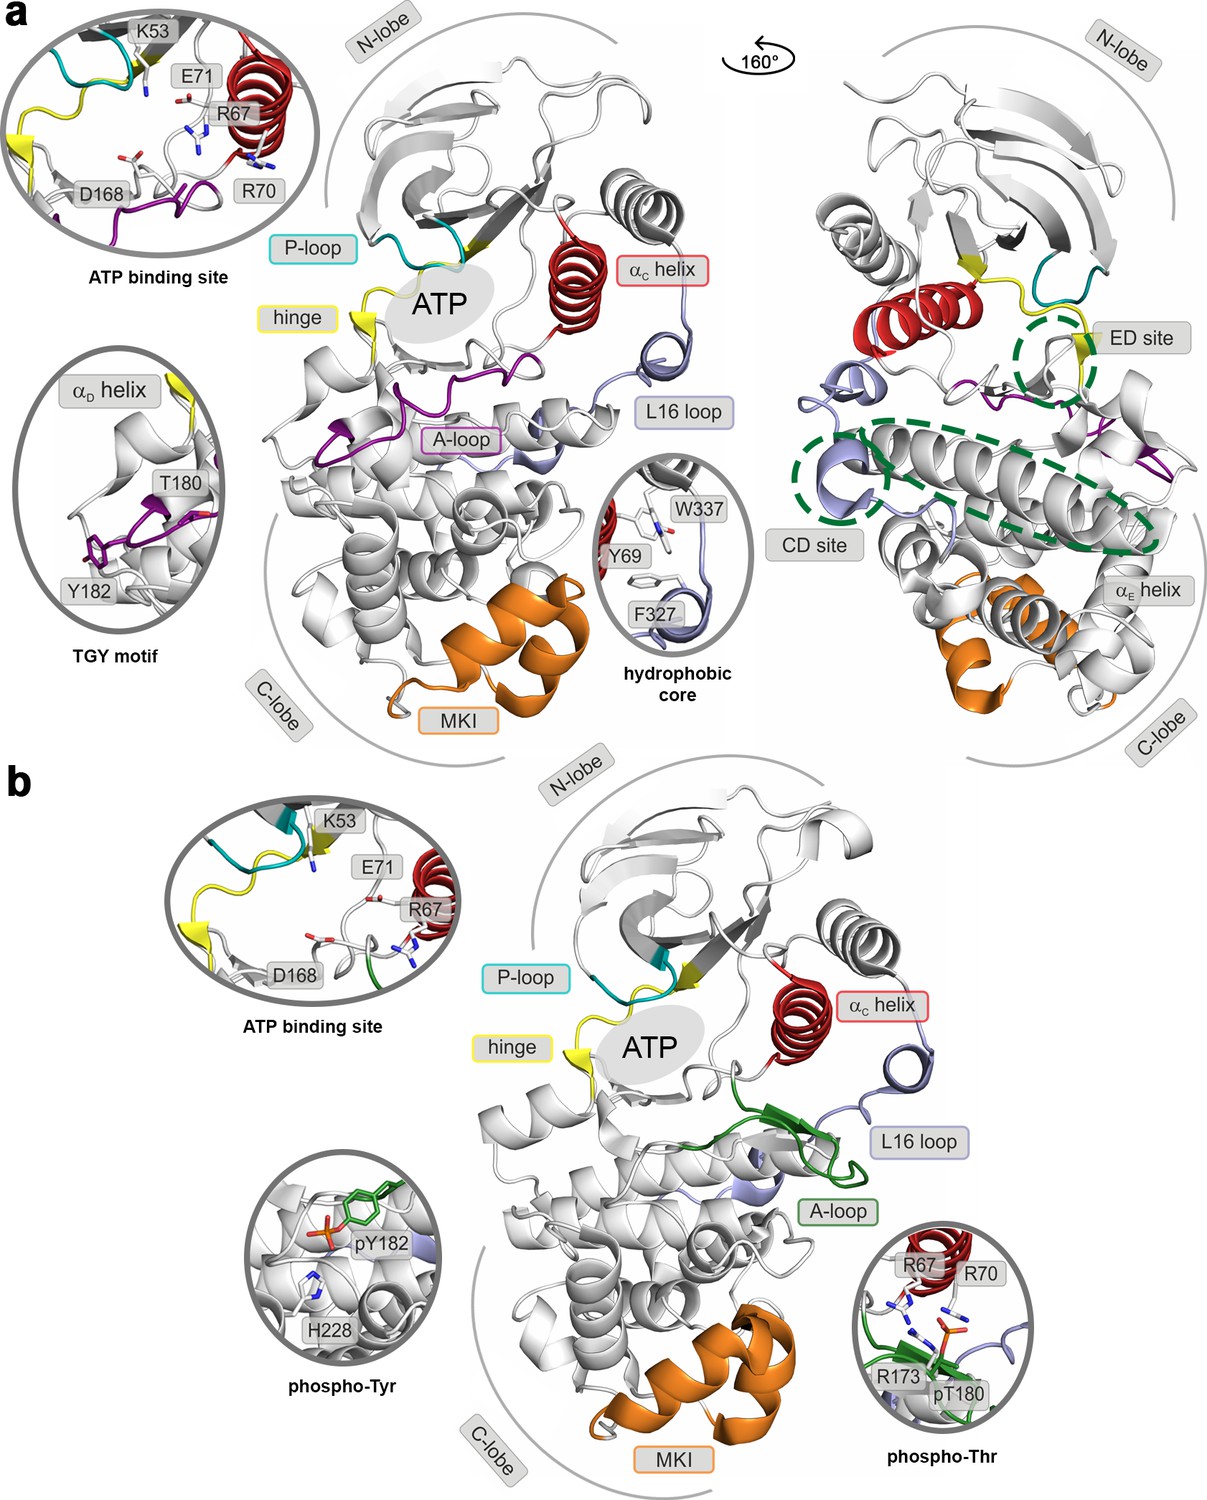
Structural models of (a) the inactive (PDB ID: 3S3I), and (b) the active, dually phosphorylated, p38α (PDB ID: 3PY3).
Main structural elements are colored as follows: A-loop in purple (inactive) and green (active), αC helix in red, L16 loop in slate, P-loop in cyan, hinge in yellow, and MKI in orange. Key residues are shown as sticks and labeled appropriately. The ATP-binding site is indicated by the grey filled ellipse, while the αE helix, and CD and ED sites by the green dashed ellipse.
Figure 2 with 6 supplements
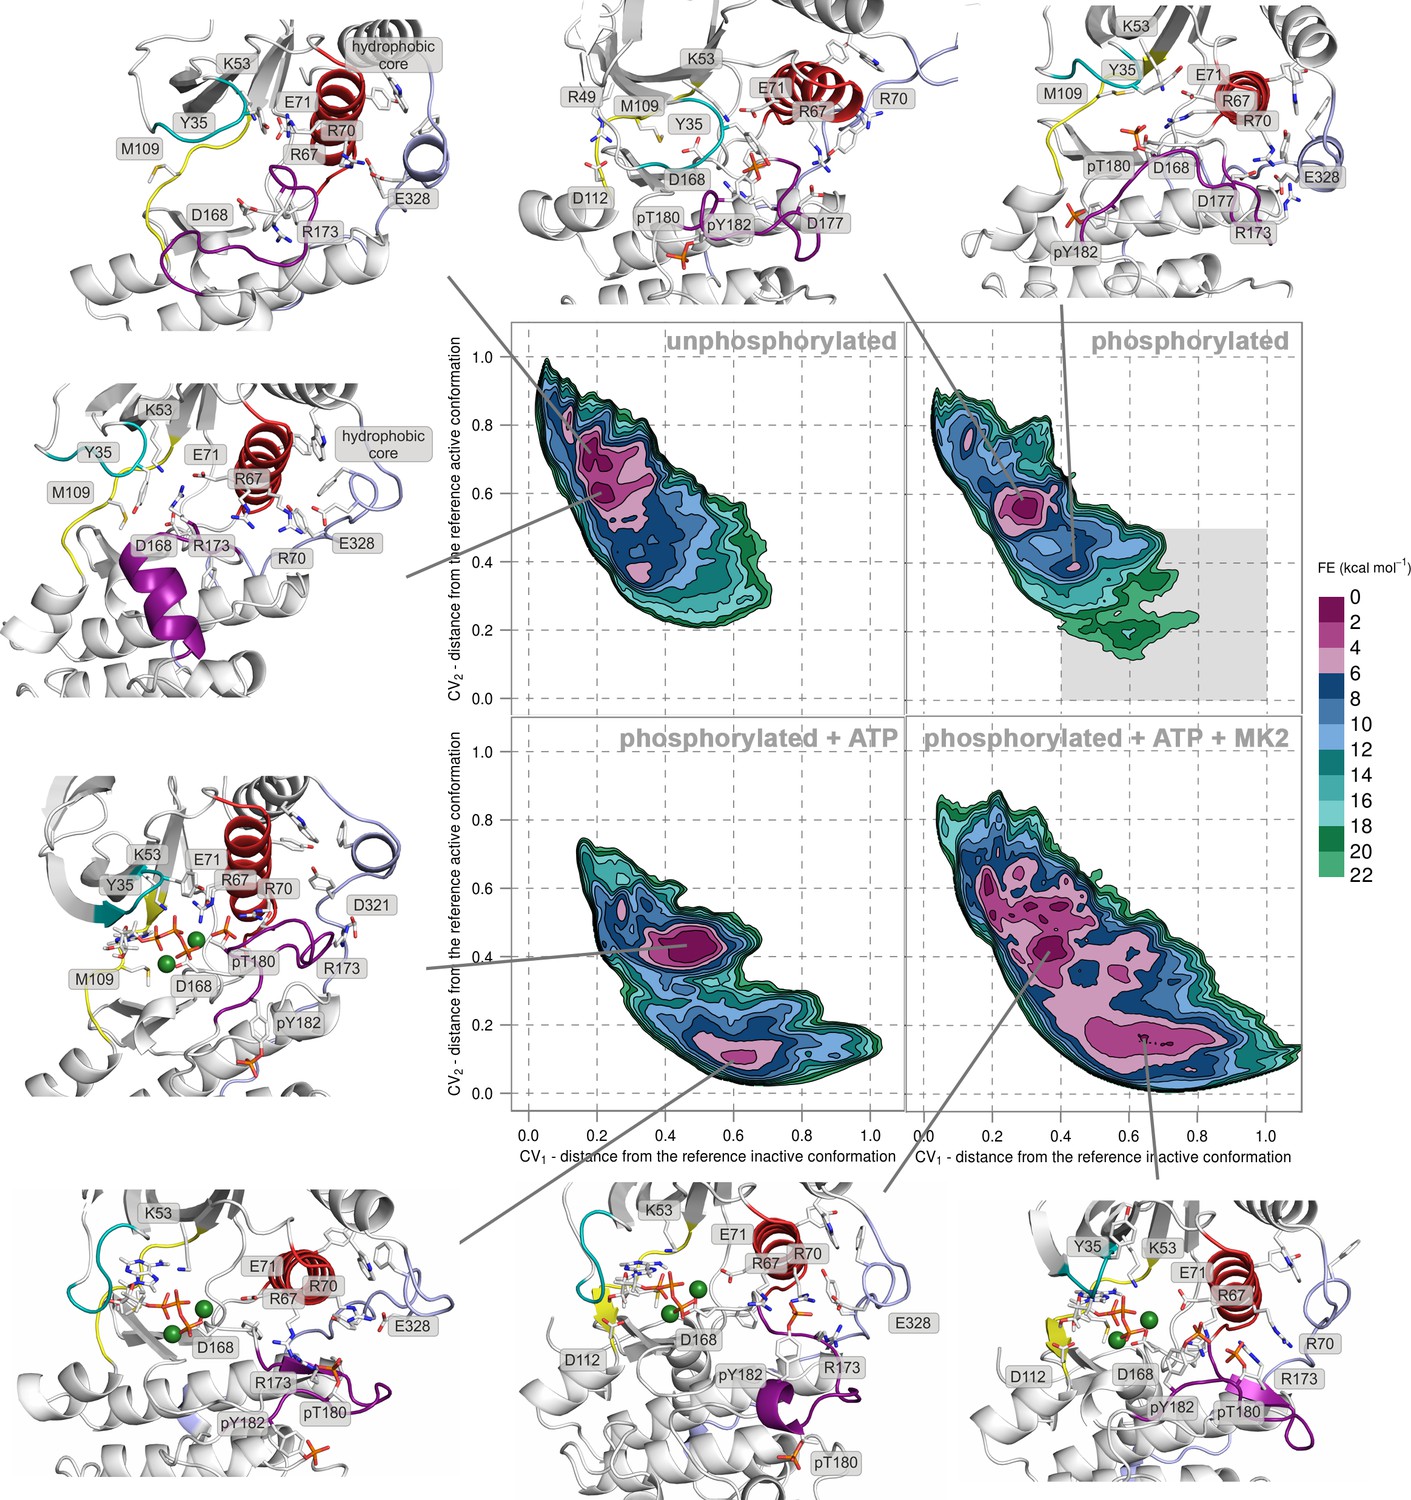
Free-energy surface for p38α (apo unphosphorylated, apo dually phosphorylated, dually phosphorylated with bound ATP-Mg2+, and dually phosphorylated with bound ATP-Mg2+ and MK2 peptide) as a function of CV1 and CV2 which indicate the distance from the reference inactive and active structures, respectively.
The contour lines are drawn every two kcal mol−1. Representative structures for the selected minima are shown and colored as follows: A-loop in purple, αC helix in red, L16 loop in slate, P-loop in cyan, and hinge in yellow. Key residues are shown as sticks and labeled appropriately. Part of the FES of the phosphorylated p38α that is populated by structures which are likely to bind ATP are highlighted with a grey rectangle (upper right panel).
Figure 2—figure supplement 1
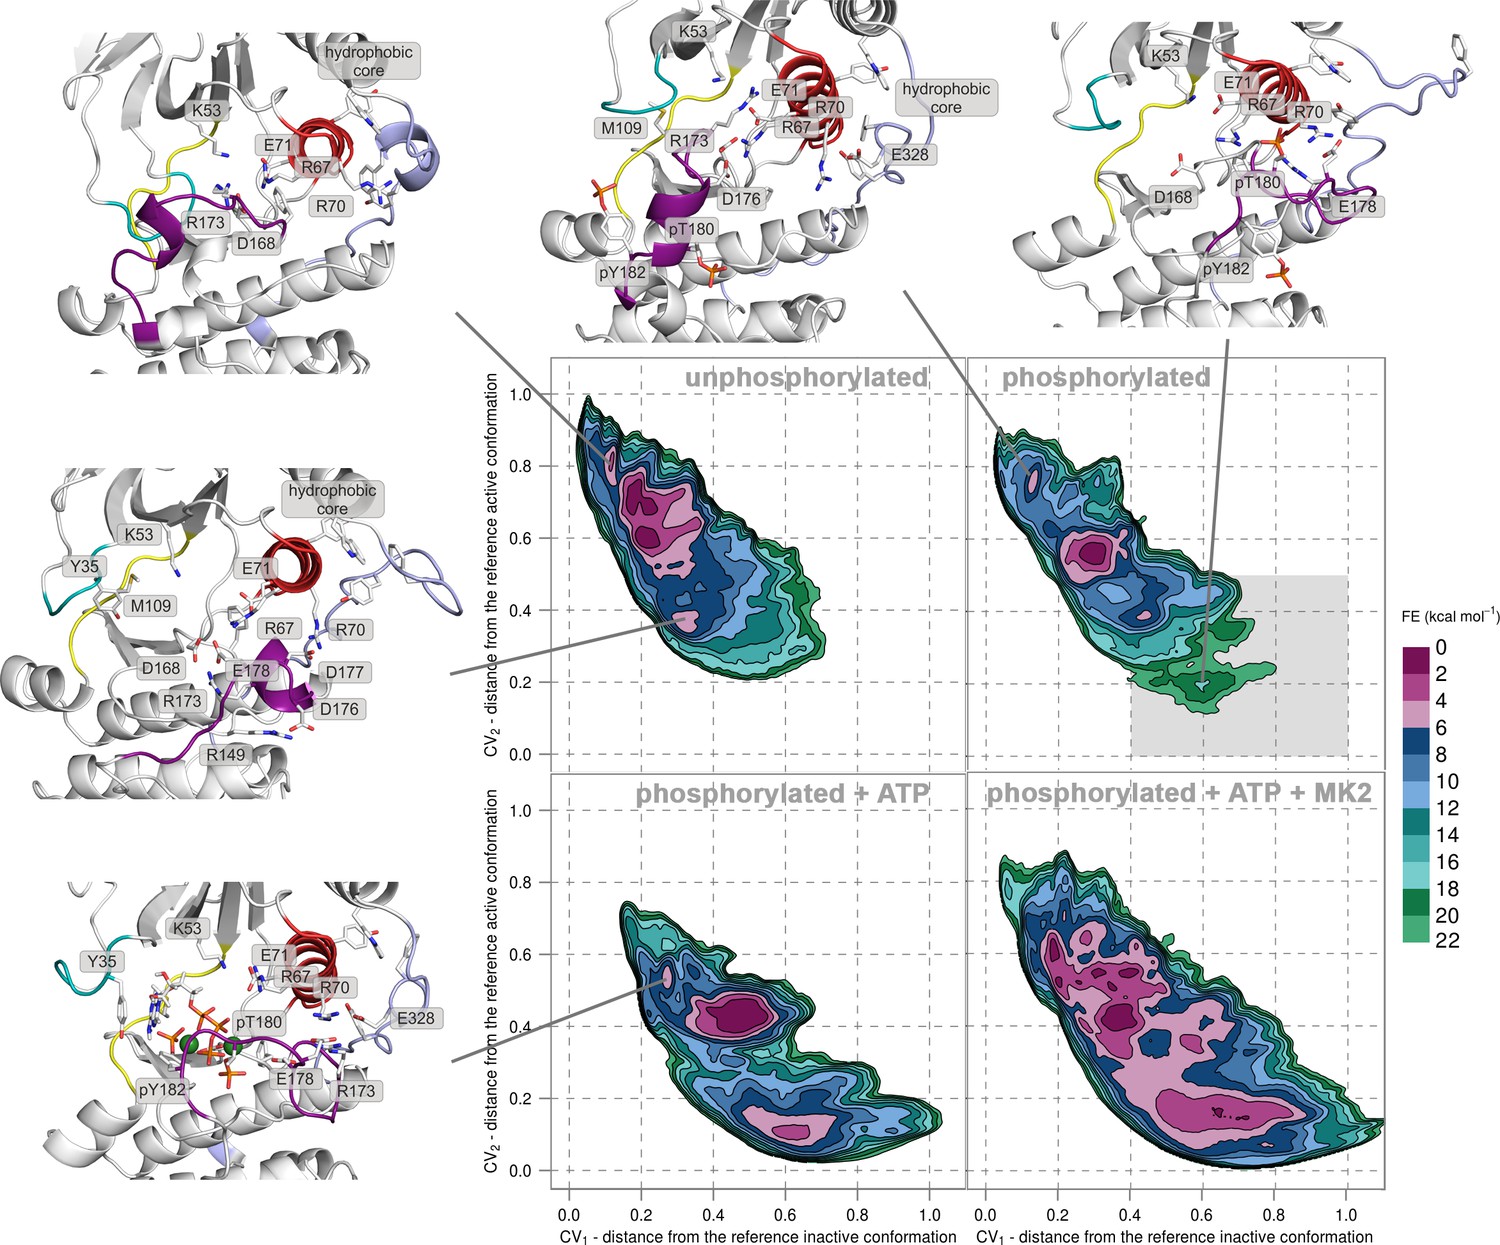
Free-energy surface for p38α (apo unphosphorylated, apo dually phosphorylated, and dually phosphorylated with bound ATP-Mg2+, and dually phosphorylated with bound ATP-Mg2+ and MK2 peptide) as a function of CV1 and CV2 which indicate the distance from the reference inactive and active structures, respectively.
The contour lines are drawn every two kcal mol−1. Representative structures for the selected minima are shown and colored as follows: activation loop in purple, αC helix in red, L16 loop in slate, P-loop in cyan, and hinge in yellow. Key residues are shown as sticks and labeled appropriately. Part of the FES of the phosphorylated p38α that is populated by structures which are likely to bind ATP are highlighted with a grey rectangle (upper right panel).
Figure 2—figure supplement 2
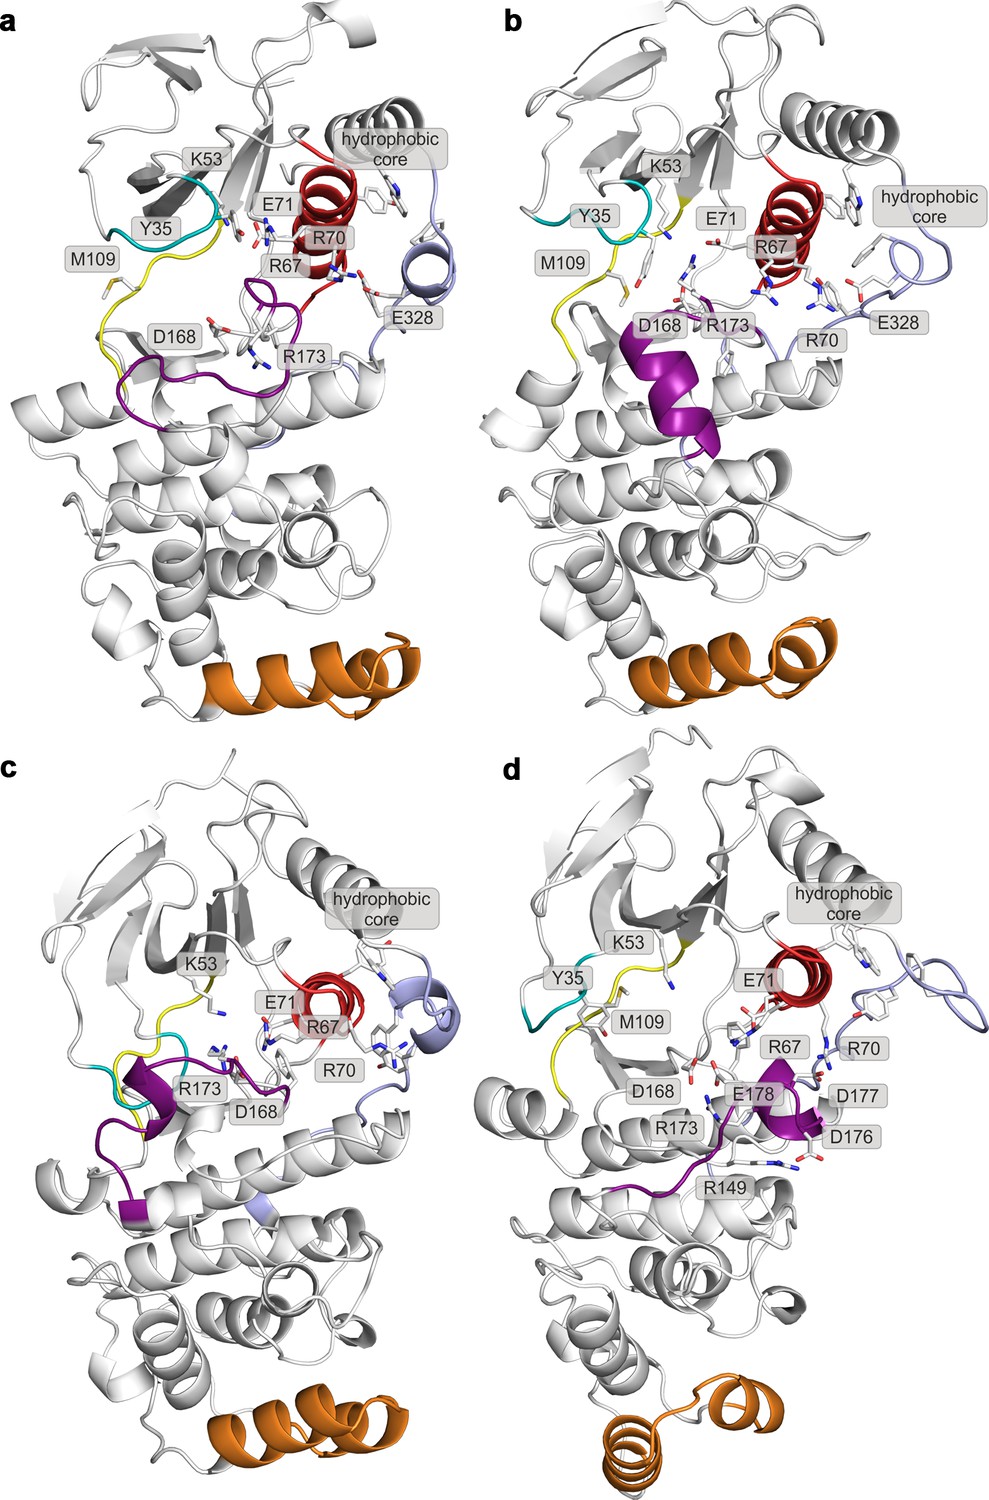
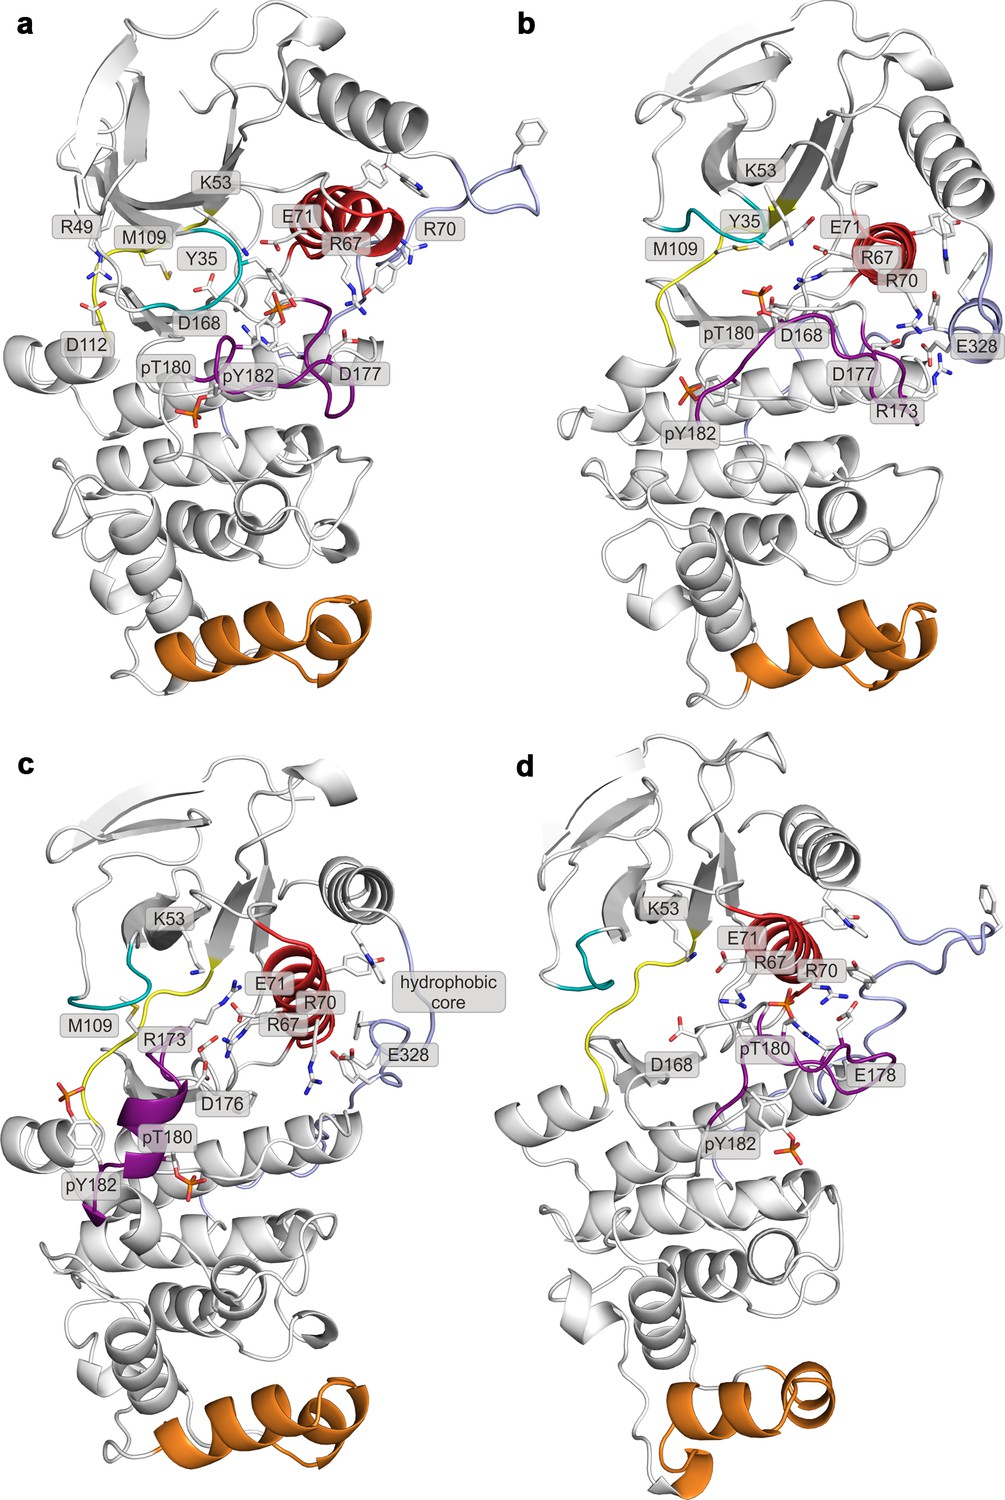
Representative structures of selected free-energy minima calculated for p38α in the apo unphosphorylated state located at: (a) (CV1, CV2) = (0.2, 0.7), (b) (CV1, CV2) = (0.2, 0.6), (c) (CV1, CV2) = (0.1, 0.8), and d) (CV1, CV2) = (0.3, 0.35).
The elements are colored as follows: activation loop in purple, αC helix in red, L16 loop in slate, P-loop in cyan, hinge in yellow, and MKI in orange. Key residues are shown as sticks and labeled appropriately.
Figure 2—figure supplement 3
Representative structures of selected free-energy minima calculated for p38α in the apo phosphorylated state located at: (a) (CV1, CV2) = (0.3, 0.55), (b) (CV1, CV2) = (0.45, 0.4), (c) (CV1, CV2) = (0.15, 0.75), and d) (CV1, CV2) = (0.6, 0.2).
The elements are colored as follows: activation loop in purple, αC helix in red, L16 loop in slate, P-loop in cyan, hinge in yellow, and MKI in orange. Key residues are shown as sticks and labeled appropriately.
Figure 2—figure supplement 4
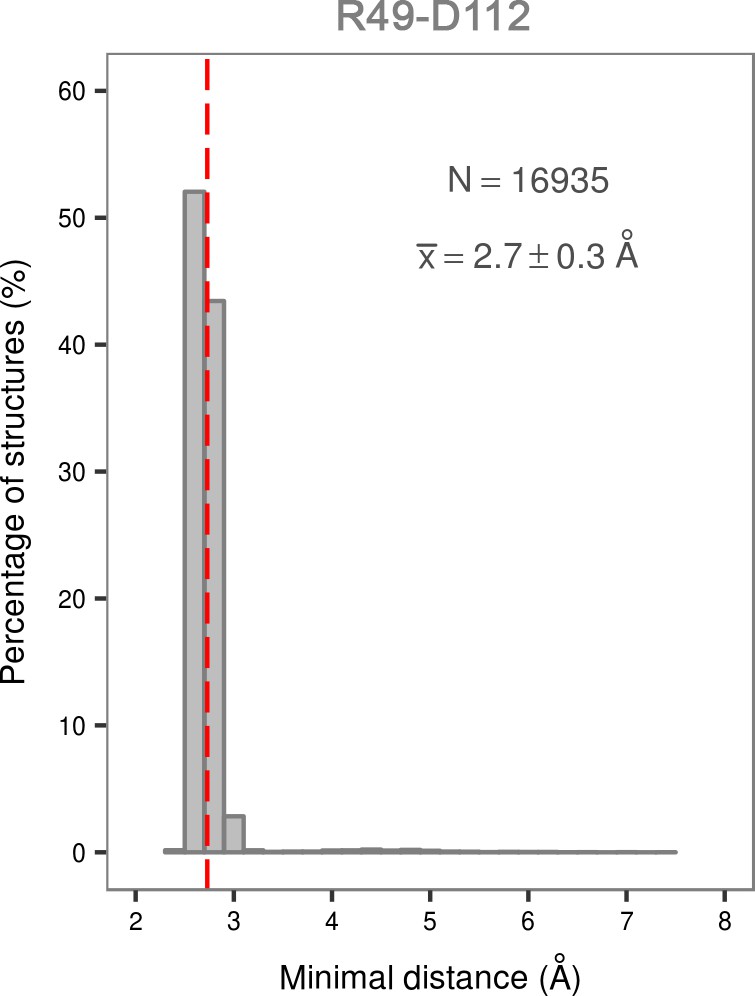
Histogram of the minimal distances between residues R49 and D112 calculated for the structures of the most populated cluster in the global minimum of the dually phosphorylated p38α.
The average value is shown as a red dashed line, while the bin size is 0.2 Å.
Figure 2—figure supplement 5

Representative structures of selected free-energy minima calculated for p38α in the phosphorylated state with bound ATP-Mg2+ located at: (a) (CV1, CV2) = (0.5, 0.4), (b) (CV1, CV2) = (0.6, 0.1), and (c) (CV1, CV2) = (0.25, 0.5).
The elements are colored as follows: activation loop in purple, αC helix in red, L16 loop in slate, P-loop in cyan, hinge in yellow, and MKI in orange. Key residues are shown as sticks and labeled appropriately.
Figure 2—figure supplement 6

Representative structures of selected free-energy minima calculated for p38α in the phosphorylated state with bound ATP-Mg2+ and MK2 peptide located at: (a) (CV1, CV2) = (0.7, 0.1), and (b) (CV1, CV2) = (0.4, 0.4).
The elements are colored as follows: activation loop in purple, αC helix in red, L16 loop in slate, P-loop in cyan, hinge in yellow, and MKI in orange. Key residues are shown as sticks and labeled appropriately.
Figure 3
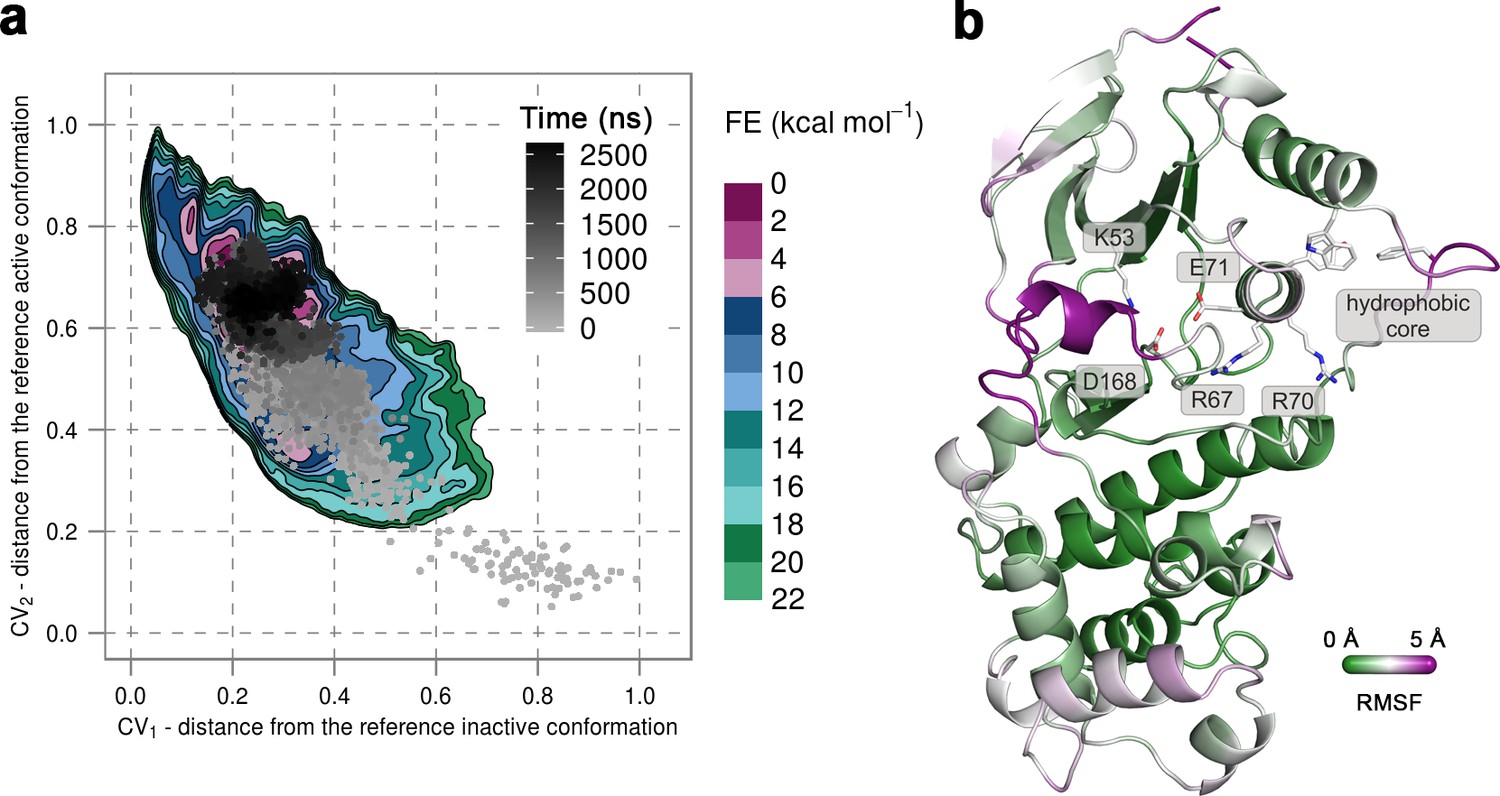
(a) Free-energy surface for the unphosphorylated p38α, obtained from metadynamics simulations, as a function of CV1 and CV2 which indicate the distance from the reference inactive and active structures, respectively.
The contour lines are drawn every two kcal mol−1. The CV values for the unbiased MD simulation of the same system are drawn every 0.5 ns and shown in a grey gradient as a function of time. (b) The conformation assumed by the protein at the end of the unbiased MD simulation. The backbone is colored according to the RMSF values, with purple indicating higher flexibility regions, while the key residues are shown as sticks and labeled appropriately.
Figure 4
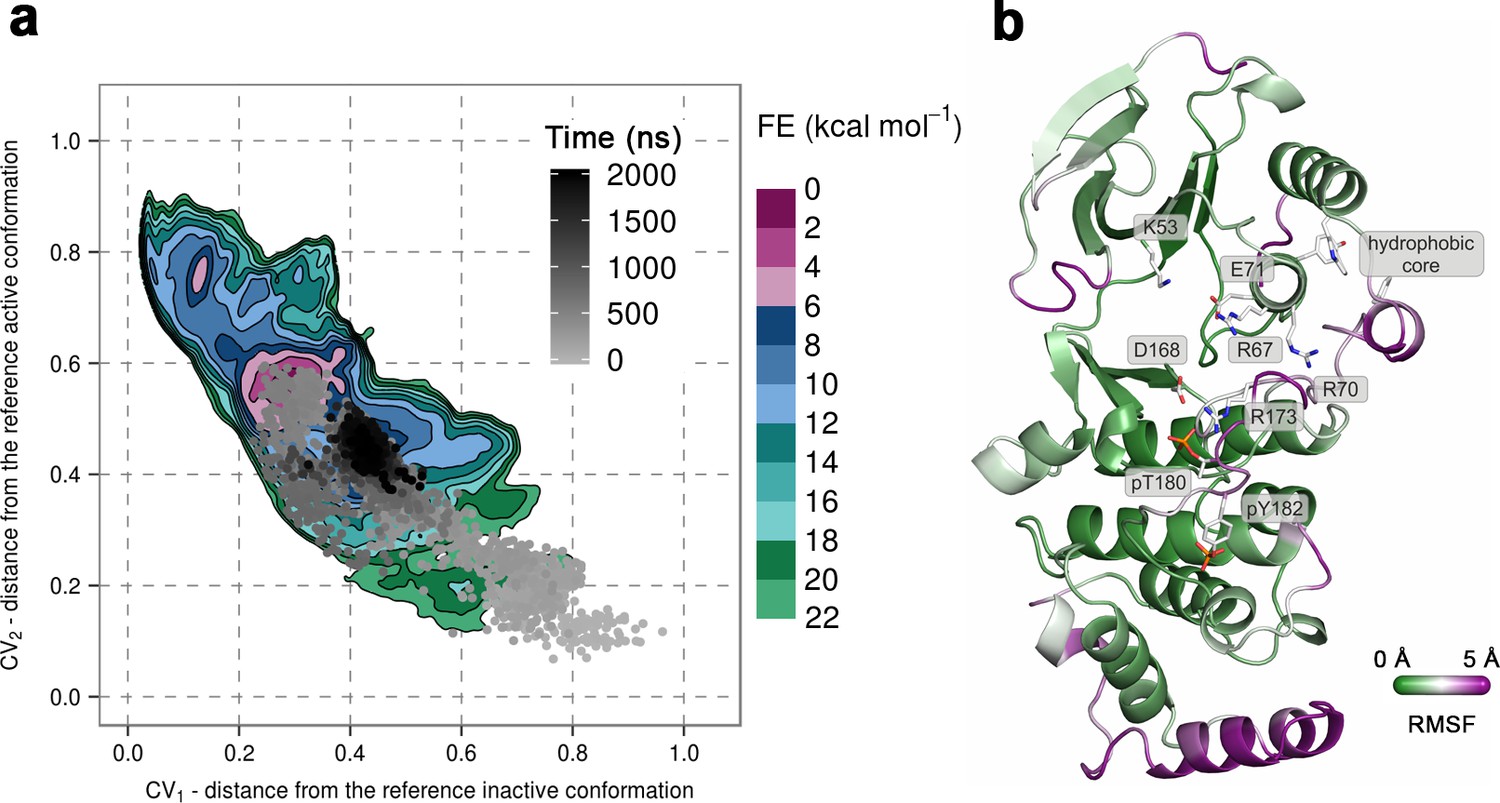
(a) Free-energy surface for the dually phosphorylated p38α, obtained from metadynamics simulations, as a function of CV1 and CV2 which indicate the distance from the reference inactive and active structures, respectively.
The contour lines are drawn every two kcal mol−1. The CV values for the unbiased MD simulation of the same system are drawn every 0.5 ns and shown in a grey gradient as a function of time. (b) The conformation assumed by the protein at the end of the unbiased MD simulation. The backbone is colored according to the RMSF values, with purple indicating higher flexibility regions, while the key residues are shown as sticks and labeled appropriately.
Figure 5

(a) Free-energy surface for the dually phosphorylated p38α with bound ATP-Mg2+, obtained from metadynamics simulations, as a function of CV1 and CV2 which indicate the distance from the reference inactive and active structures, respectively.
The contour lines are drawn every two kcal mol−1. The CV values for the unbiased MD simulation of the same system are drawn every 0.5 ns and shown in a grey gradient as a function of time. (b) The conformation assumed by the protein at the end of the unbiased MD simulation. The backbone is colored according to the RMSF values, with purple indicating higher flexibility regions, while the key residues are shown as sticks and labeled appropriately.
Figure 6

(a) Free-energy surface for the dually phosphorylated p38α with bound ATP-Mg2+ and MK2 docking peptide, obtained from metadynamics simulations, as a function of CV1 and CV2 which indicate the distance from the reference inactive and active structures, respectively.
The contour lines are drawn every two kcal mol−1. The CV values (calculated every 0.5 ns) for the unbiased MD simulations of the same system are shown as orange contours based on their density. (b) Histograms of the minimal distances between ATP and D112 calculated from the unbiased simulations of the dually phosphorylated p38α with bound ATP-Mg2+ with or without the MK2 docking peptide (colored grey and red, respectively). The average values are shown as dashed lines, while the bin size is 0.5 Å.
Figure 7
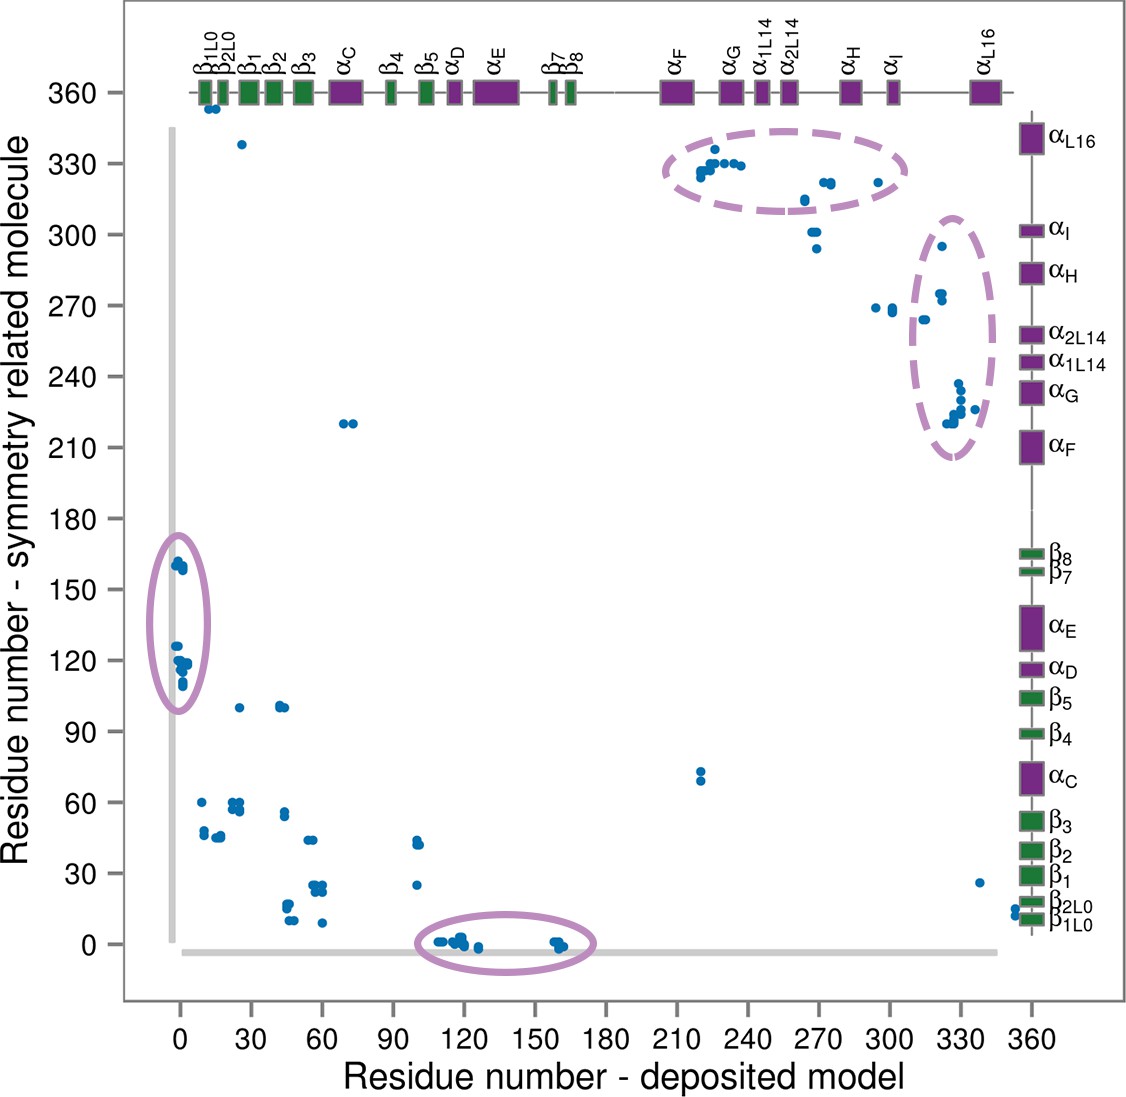
Contact map for interactions formed between the residues of the reported X-ray structure (PDB ID: 3PY3, p38α-pTpY) (x-axis) and its symmetry related neighbors (y-axis).
The residues are considered to be in contact if the minimal distance between any of their atoms is under 4 Å. The contacts formed by the docked elements are indicated by the solid ellipses, while the ones formed between functionally important elements are indicated by the dashed ellipses. Secondary structure elements are also shown with α-helices in purple, β-sheets in green, and loops in grey. Missing residues are shown as light grey rectangles.
Figure 8
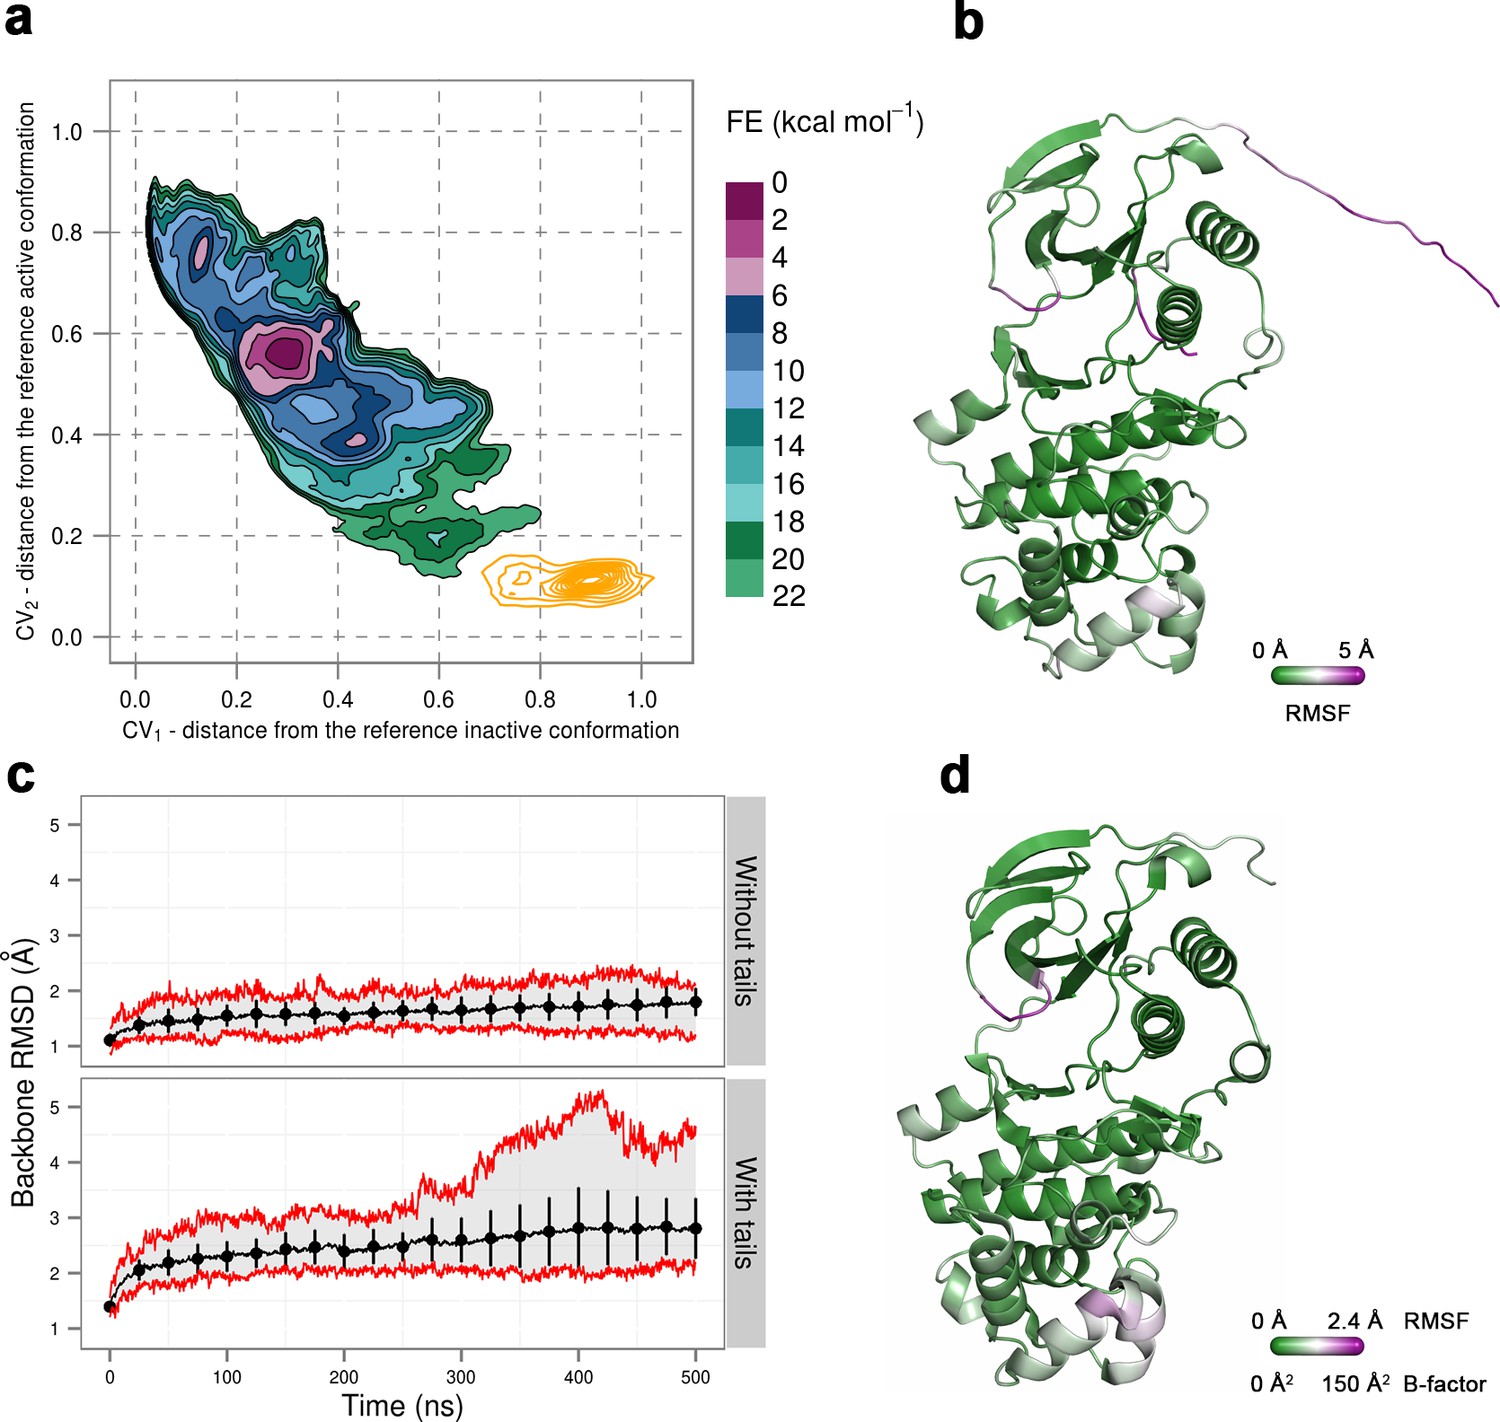
(a) Free-energy surface for the dually phosphorylated p38α, obtained from metadynamics simulations, as a function of CV1 and CV2 which indicate the distance from the reference inactive and active structures, respectively.
The contour lines are drawn every two kcal mol−1. The CV values (calculated every 0.5 ns) for the unbiased MD simulations of the 3PY3 crystal are shown as orange contours based on their density. (b) The average conformation of the protein calculated from the unbiased MD simulations. The protein is colored according to the calculated RMSF values after the backbone alignment with respect to the 3PY3 X-ray structure. (c) Backbone RMSD values calculated with respect to the 3PY3 X-ray structure either with or without N- and C-terminal tails. The average values over 16 molecules are shown by the black lines, the extreme values by the red lines, while the error bars depicting one standard deviation are shown every 25 ns. (d) X-ray structure of the dually phosphorylated p38α (PDB ID: 3PY3) colored by refined B-factors.
Figure 9

Histograms of the minimal distances between (a) K53-E71, (b) R49-D112, and c) R49-E160 calculated from p38α X-ray structures currently deposited in PDB (March, 2017).
K53-E71 distances were calculated for structures without any mutations, while R49-D112 and R49-E160 for structures without missing R49, D112, and E160 residues. The average values are shown as red dashed lines, while the bin size is 0.5 Å.
Figure 10

Multiple alignments of the αC helix and the activation loop (from the DFG motif to the P+1 loop) sequences of several human kinases.
Selected positively charged residues are colored green, negatively charged ones magenta, while the catalytically important residues in the αC helix are bolded, as well as the phosphorylated residues in the activation loop.
Author response image 1

Author response image 2
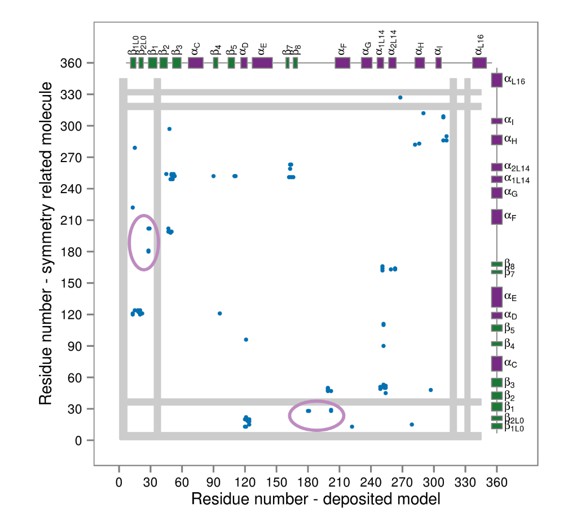
Contact maps for interactions formed between the residues of the reported X-ray structure (PDB ID: 1CM8, p38γ-pTpY) (x-axis) and its symmetry related neighbors (y-axis).
The residues are considered to be in contact if the minimal distance between any of their atoms is under 4 Å. The contacts formed by the A-loop are indicated by the solid ellipse. Secondary structure elements are also shown with α-helices in purple, β-sheets in green, and loops in grey. Missing residues are shown as light grey rectangles.
Videos
Video 1
Detailed presentation of p38α structural elements and binding sites which play an important role in its activation.
https://doi.org/10.7554/eLife.22175.003Tables
Table 1
Interactions of key residues observed in the free-energy minima. Residue pairs with interaction occupancy >75% in the most populated clusters of the selected minima are bolded, while the occupancy for the rest of the pairs is in the range of 60–75%.
| System | Minimum | Residue pairs |
|---|---|---|
| p38α | 0–2 kcal mol−1 (CV1, CV2 = 0.2, 0.7) | D176-R189, D177-R186, E178-K152, E178-R173 |
| 0–2 kcal mol−1 (CV1, CV2 = 0.2, 0.6) | R173-E71, D168-R173, D177-R186 | |
| p38α-pTpY | 0–2 kcal mol−1 | E178-R149, E178-R189, D177-R67, pY182-R173 |
| 4–6 kcal mol−1 (CV1, CV2 = 0.45, 0.4) | D176-R149, D176-R189, D177-R70, pT180-R67, R173-E328 | |
| p38α-pTpY (ATP-Mg2+) | 0–2 kcal mol−1 | pT180-R67, pT180-R70, pY182-R186, pY182-R189, E178-R70 |
| p38α-pTpY (ATP-Mg2+ + MK2 peptide) | 0–2 kcal mol−1 (CV1, CV2 = 0.7, 0.1) | pT180-R67, pT180-R173, D112-ATP |
| 0–2 kcal mol−1 (CV1, CV2 = 0.4, 0.4) | pY182-R67, pY182-R70, D177-R173, D112-ATP |
Additional files
-
Supplementary file 1
Interactions of key residues in the activation loop observed in the free-energy minima.
Residue pairs with interaction occupancy >75% in the most populated clusters of the selected minima are bolded, while the occupancy for the rest of the pairs is in the range of 60–75%.
- https://doi.org/10.7554/eLife.22175.020
Download links
A two-part list of links to download the article, or parts of the article, in various formats.
Downloads (link to download the article as PDF)
Open citations (links to open the citations from this article in various online reference manager services)
Cite this article (links to download the citations from this article in formats compatible with various reference manager tools)
Changes in the free-energy landscape of p38α MAP kinase through its canonical activation and binding events as studied by enhanced molecular dynamics simulations
eLife 6:e22175.
https://doi.org/10.7554/eLife.22175


