Distribution of neurosensory progenitor pools during inner ear morphogenesis unveiled by cell lineage reconstruction
- Universitat Pompeu Fabra, Spain
- USR3695 CNRS, France
- Center for Genomic Regulation, The Barcelona Institute of Science and Technology, Spain
- Slovak University of Technology, Slovakia
Figures
Figure 1 with 2 supplements

Expansion of the neuroblast delamination domain and formation of the SAG rudiment.
(a) Overview of the imaging and image processing strategy: inner ears of zebrafish embryos stained for cell membrane, nucleus and cell fate markers were imaged between 14-42 hpf. Image datasets were processed by nucleus center detection, cell tracking and cell shape segmentation. Data were validated and curated (Figure 1—figure supplement 1). (b–d) Time-lapse stills showing the posterior expansion of the neuroblast delamination domain over time; 3D-rendering of segmented epithelial neuroblasts (green) in context of the otic structure (plasma membranes in magenta) at indicated times; insets display only the segmented delamination domain with the otic vesicle contour in white. ID Dataset: 140210aX; see Figure 1—figure supplement 2d for additional analyses. (e–g) Time-lapse stills showing a segmented delaminating neuroblast (red; Video 2); (e’–g’) magnifications of framed regions in (e–g). ID Dataset: 140426aX. (h–i) Still images from Video 1 displaying: otic tissue architecture (h), and cellular distribution (i) upon SAG formation. Reconstructed cell centers are color-coded according to cell position/identity (see legend). ID Dataset: 140423aX. SAG/ALLg, statoacoustic/anterior lateral line ganglia. AM/PM, anterior/posterior maculae.
Figure 1—figure supplement 1
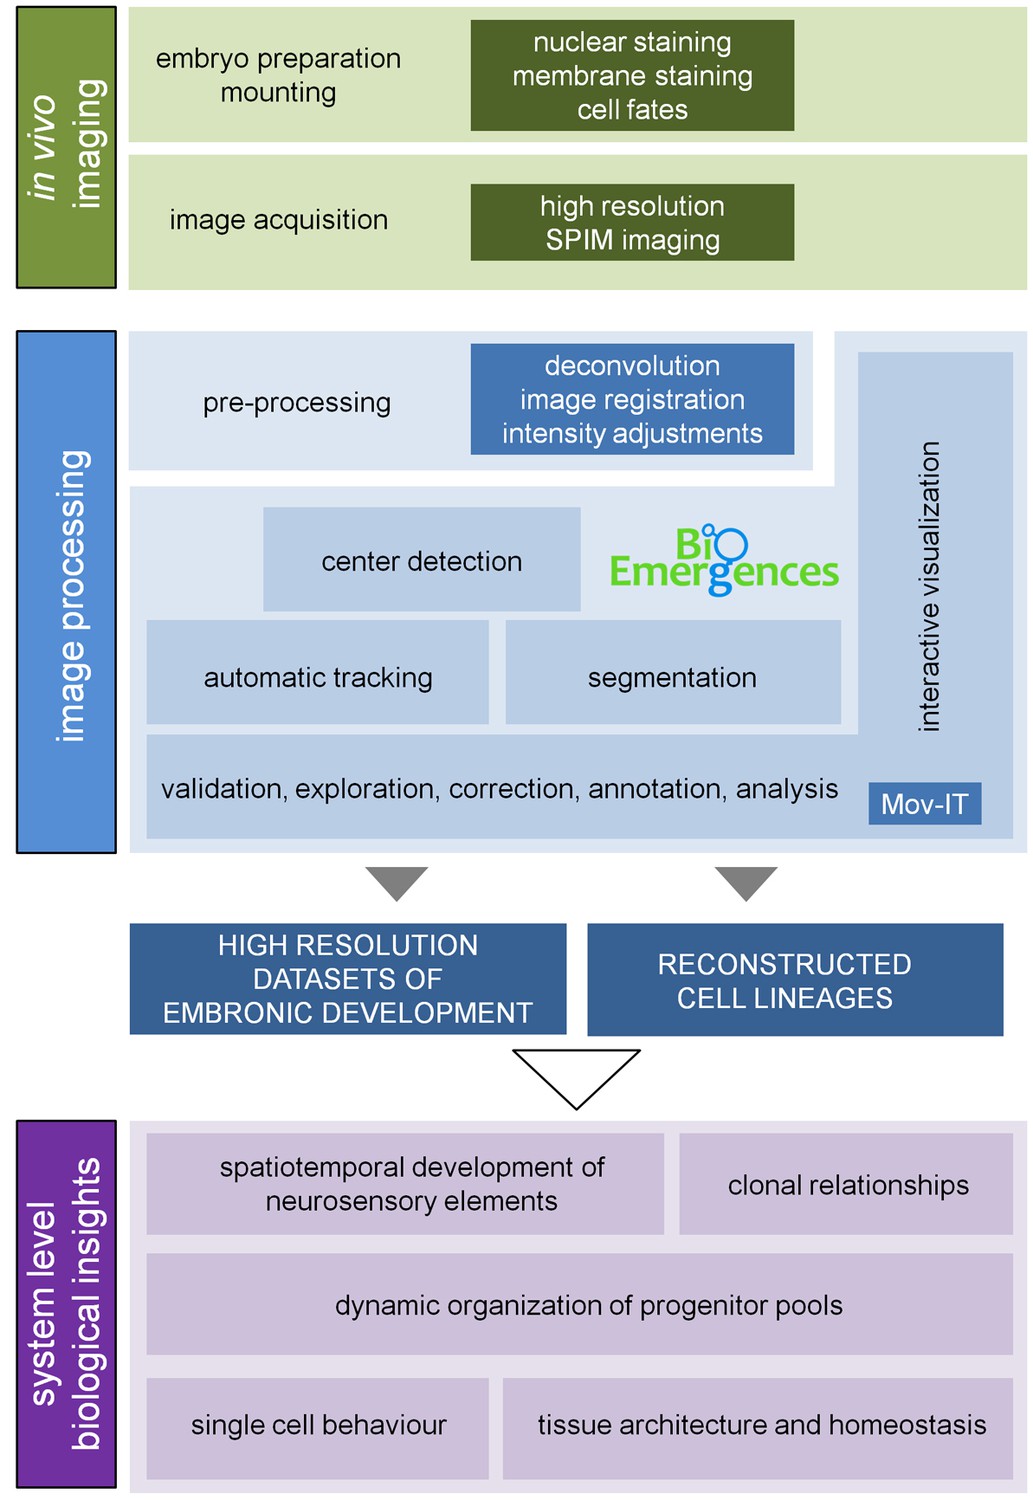
3D+time image analysis pipeline.
Information about plasma membranes, nuclei and cell fates was collected upon imaging the inner ears of zebrafish embryos for several hours (14-42 hpf; Table 1) under a Zeiss Lightsheet Z.1 microscope (3D+t SPIM imaging). The acquired data were preprocessed to generate the high-resolution datasets to be launched in BioEmergences platform (Faure et al., 2016; Olivier et al., 2010) for cell center detection and automatic tracking. Data were validated, curated and analyzed using an ad-hoc strategy based on Mov-IT, a custom-made graphical interface (Faure et al., 2016), which offers the tools for segmentation and tracking of cells to accurately reconstruct their positions, movements and divisions. The high-resolution datasets and reconstructed lineages were used for qualitative and quantitative studies of the indicated biological processes (Table 2). The cohort of embryos used in the study can be found in Table 1.
Figure 1—figure supplement 2
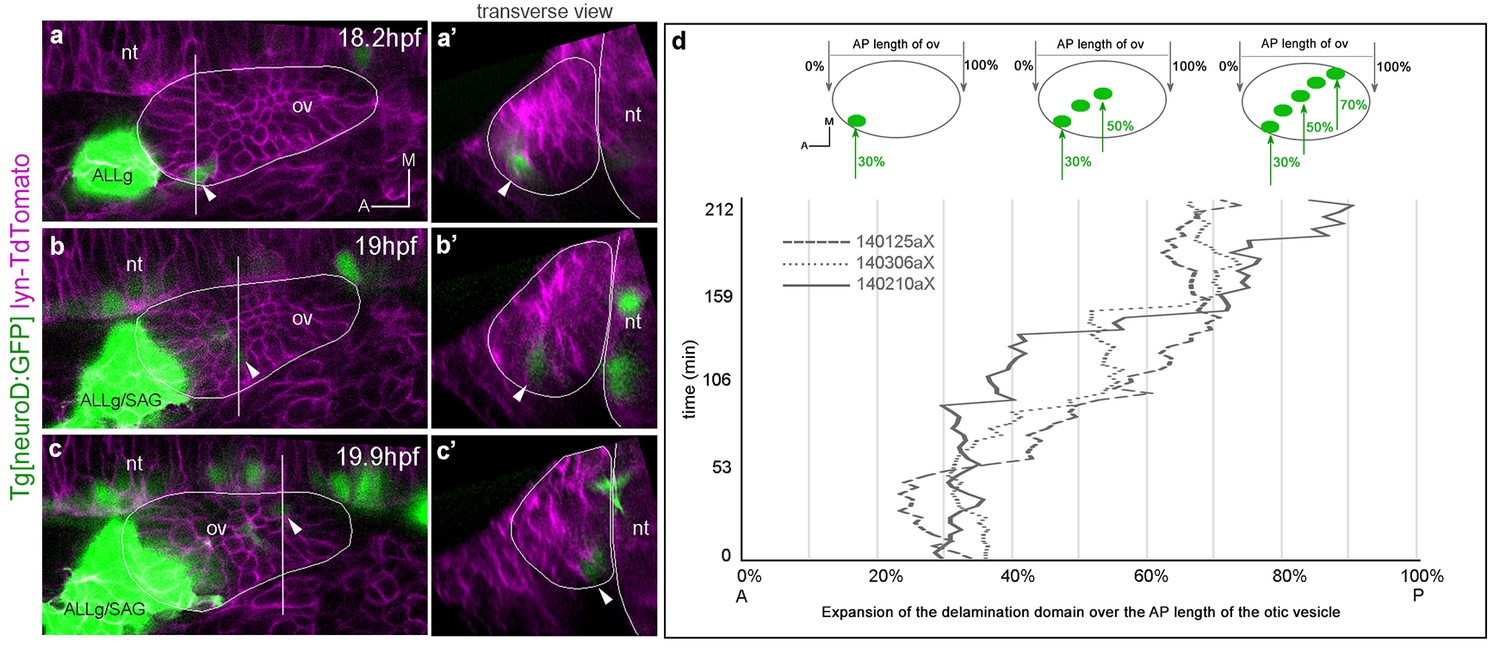
Posterior expansion of the otic neuroblast delamination domain.
Tg[neuroD:GFP] embryos were injected with lyn-TdTomato mRNA at 1cell-stage and imaged from 14.5 hpf onwards. Embryos express GFP (green) in neuronal progenitors and differentiating neuroblasts, and TdTomato in all cell membranes (magenta). In the case of the inner ear, GFP is expressed in epithelial neuroblasts just prior to delamination and in the SAG neuroblasts. (a–c) Still image views of the ventral otic vesicle at the indicated time points showing the quick expansion of the delamination domain in the otic epithelium within 2 hr from anterolateral to posteromedial regions; note that at this stage the rudiment of the adjacent ALLg is already visible. (a’–c’) Transverse views are digital reconstructions along the lines indicated in (a–c) and illustrate that the onset of neuroblasts’ delamination progresses from lateral to medial domains (see arrowheads). ALLg, anterior lateral line ganglion; SAG, statoacoustic ganglion; nt, neural tube. The otic vesicle contour is depicted in white. ID Dataset: 140210aX. (d) Plot depicting the posterior expansion of the neuroblast delamination domain as assessed by neuroD-GFP expression. The position of posterior-most neuroD-GFP expressing cells in the otic epithelium, and the anterior and posterior edge of the otic vesicle (dorsal view) were assessed over time (see scheme). The plot displays the position of posterior-most GFP epithelial cells as a percent of the AP otic vesicle length (ID datasets: 140306aX, 140125aX, 140210aX).
Figure 2 with 1 supplement
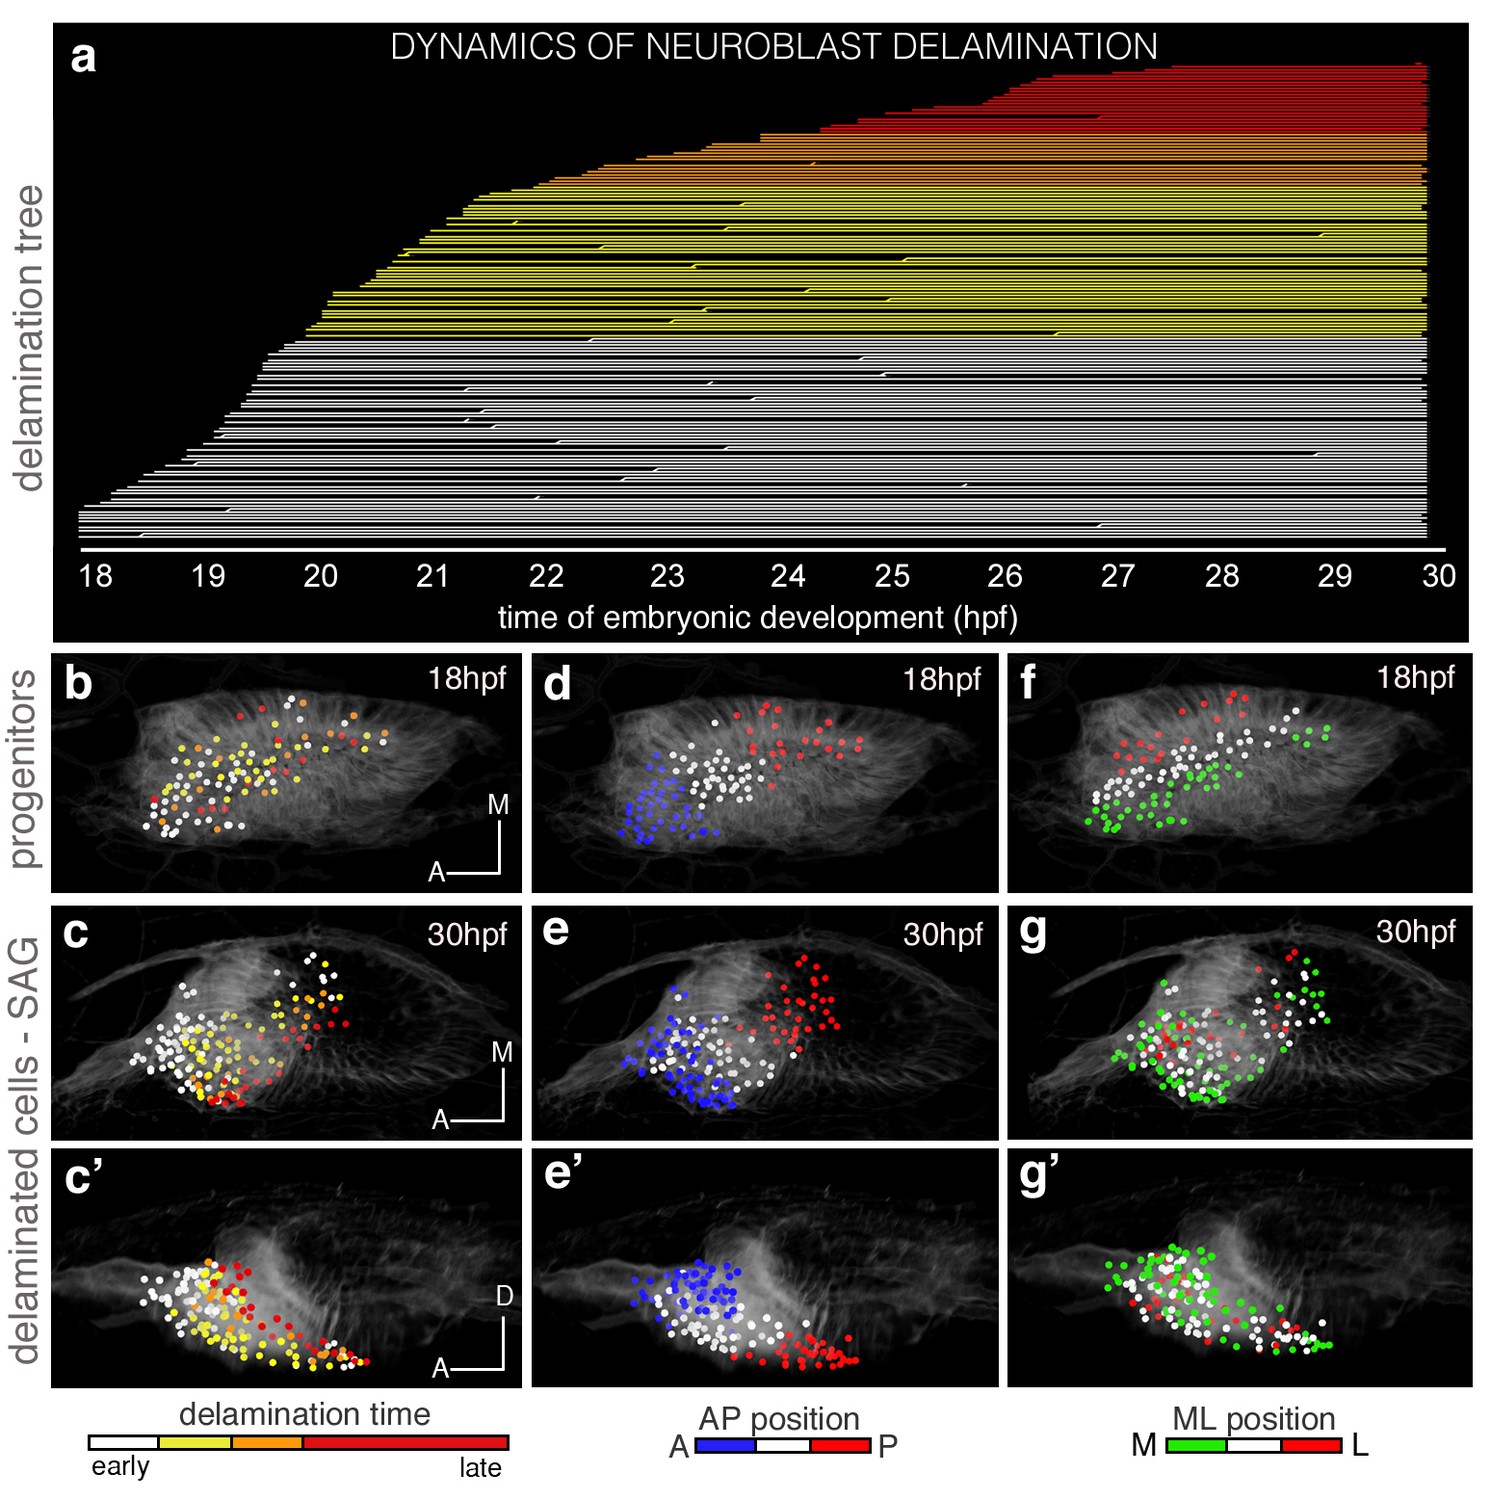
The organization of cells within the SAG relies on specific temporal and spatial cues.
(a) Flat representation of the neuroblast lineage tree with branches indicating cell divisions. The x-axis displays the time of embryonic development in hours post-fertilization (hpf). Neuroblast lineages are displayed from the moment of delamination onwards and ordered and color-coded according to delamination timing (intervals: 18–20 hpf white, 20–22 hpf yellow, 22–24 hpf orange, 24–30 hpf red). Some cells were not tracked until the end of the sequence, and are depicted as interrupted lines. The extensive cell loss during the early stages of delamination (18–22 hpf) was verified in a second embryo; in both cases, about 25% (23.2% and 26.8%) of the otic epithelial cells at 18 hpf exit by delamination in the consecutive four hours. (c–c’,e–e’,g–g’) Neuroblasts within the SAG (n = 144 of roughly total n = 250) were backtracked to their progenitor state in the epithelium (n = 98; b,d,f; Videos 3 and 5). Cell lineages were color-coded for: time of delamination (b–c’; same intervals as in (a)), position in the epithelium along the AP (d–e’), or ML (f–g’) axes. Note that ML organization of neuroblasts within the SAG (c–c’) relies on their delamination order, and that the blue/white/red epithelial pattern (d–e’; neuroblasts AP position) but not the green/white/red one (f–g’; neuroblasts ML position) is maintained in the SAG over this time period (18–30 hpf). Reconstructed cell centers were displayed as colored-dots together with the corresponding raw images (plasma membranes in grey level). (b,d,f) dorsal views; (c,e,g) ventral views; (c’,e’,g’) lateral views. Anterior is always to the left. For this analysis, Tg[cldnb:lynGFP] Tg[Isl3:GFP] line was injected with H2B-mCherry mRNA at 1cell-stage (Tables 1–2). ID Dataset: 140426aX; see Figure 2—figure supplement 1 for additional analysis.
Figure 2—figure supplement 1

Time of delamination and position of epithelial neuroblasts prefigure their location within the SAG.
Tg[cldnb:lynGFP] Tg[Brn3c:GFP] embryo was injected with H2B-mCherry at 1cell-stage, imaged and analyzed from 16 hpf (Table 1). Reconstructed cell centers from neuronal progenitors were color-coded for time of delamination (a), or position along the AP axis in the otic epithelium (c), and followed from 18 hpf to 24 hpf. Note that: (i) among the delaminated neuroblasts from 18 hpf to 24 hpf, those delaminating earlier (white cell centers in a-b) are more medially located in the SAG than those delaminating later (purple cell centers in a-b); and (ii) the relative position of neuronal precursors along the AP axis in the otic epithelium is conserved within the SAG (see cyan anterior cells vs. red posterior cells in c-d’). ID dataset: 140423aX.
Figure 3 with 1 supplement
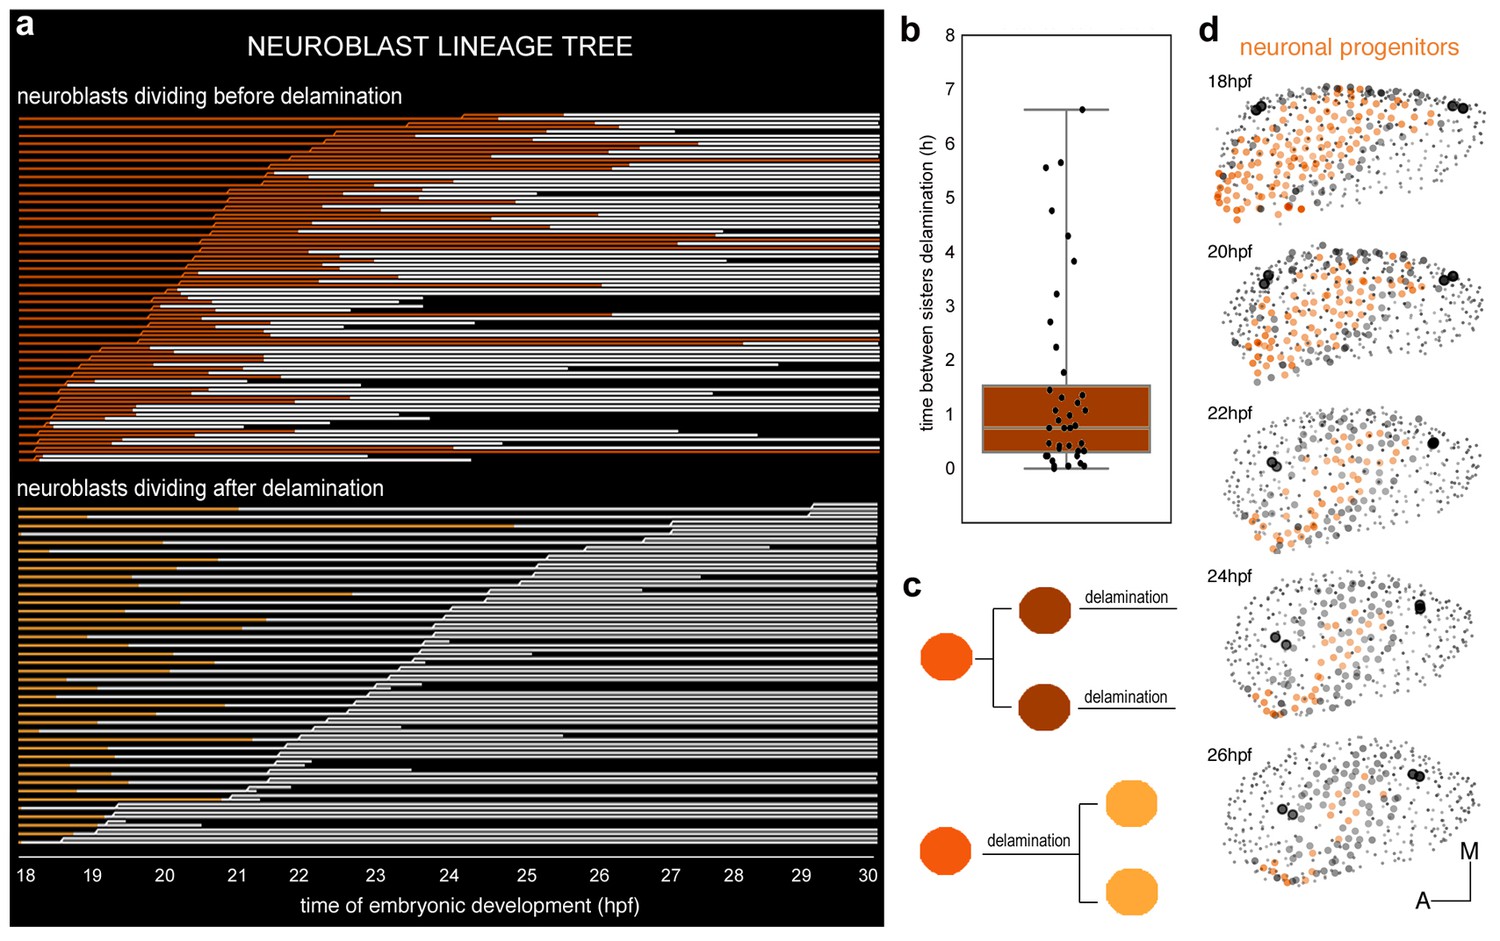
Clonal analysis of neuroblasts.
(a) Lineages of neuroblasts (epithelial: colored; delaminated: white) ordered by time of division and grouped according to the division behavior -dividing before (red, top) or after (orange, bottom) delamination. Each line corresponds to a single neuroblast. Discontinued lines represent cells that were not tracked further. The x-axis displays the corresponding time of embryonic development (hpf). (b) Box plot illustrating the temporal delay in delamination between sister cells (Figure 3—figure supplement 1d). (c) Illustration of neuroblast division behavior colored as in (a). (d) Dynamic map of neuronal progenitors (orange circles) and their epithelial neighboring cells (grey circles) in the context of the whole otic vesicle (grey dots) over time; see Video 8 for the 24 hpf animation. The color intensity of cell centers depicts the position of cells along the dorsoventral axis of the otic vesicle. The map was built after following the lineages from 18 hpf to 26 hpf of all encircled cells. Note how neuroblast delamination impacts on the size and position of the progenitor domain (orange cell centers) over time. Tether cells are depicted as black circles. For this analysis, Tg[cldnb:lynGFP] Tg[Isl3:GFP] line was injected with H2B-mCherry mRNA at 1cell-stage (Tables 1–2). ID Dataset: 140426aX.
Figure 3—figure supplement 1
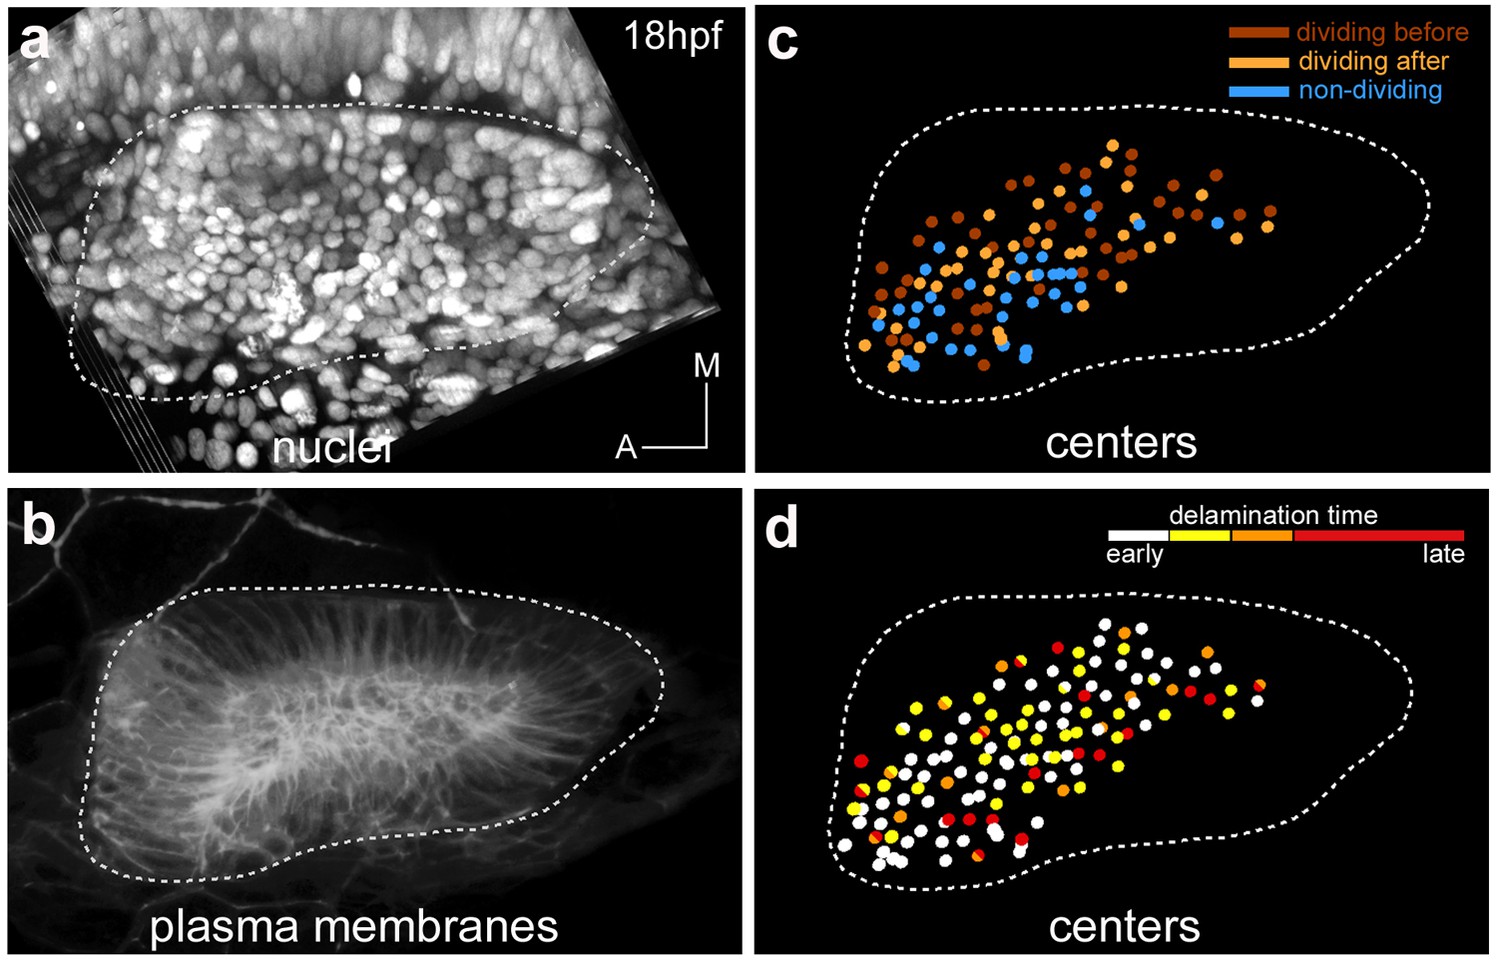
Spatial distribution of epithelial neuroblasts according to division behavior or delamination time.
Tg[cldnb:lynGFP] Tg[Isl3:GFP] embryo was injected with H2B-mCherry at 1cell-stage, imaged and analyzed from 18 hpf to 36.2 hpf (Table 1). Images of (a) nuclei as Maximal Intensity Projection of few orthoplanes of the ventral otic vesicle, and (b) plasma membranes as 3D-rendering are displayed. (c) Spatial distribution of neuroblasts, whose reconstructed cell centers were color-coded according to their division behavior -before or after delamination- (Figure 3). Out of 116 tracked epithelial neuroblasts, 42 divide before delamination (red), 40 do so after delamination (orange), and 34 do not divide within this time window (blue). Note that there is no preferential spatial distribution of cells for these features. (d) Reconstructed cell centers of neuroblasts (n = 131) were color-coded according to time of delamination: 18–20 hpf white, 20–22 hpf yellow, 22–24 hpf orange, 24–30 hpf red. Neuroblasts giving rise to two sister cells falling into distinct delamination intervals are shown as bicolored cell centers (n = 11). ID Dataset: 140426aX.
Figure 4 with 1 supplement
Spatiotemporal pattern of hair cell differentiation and map of sensory progenitors.
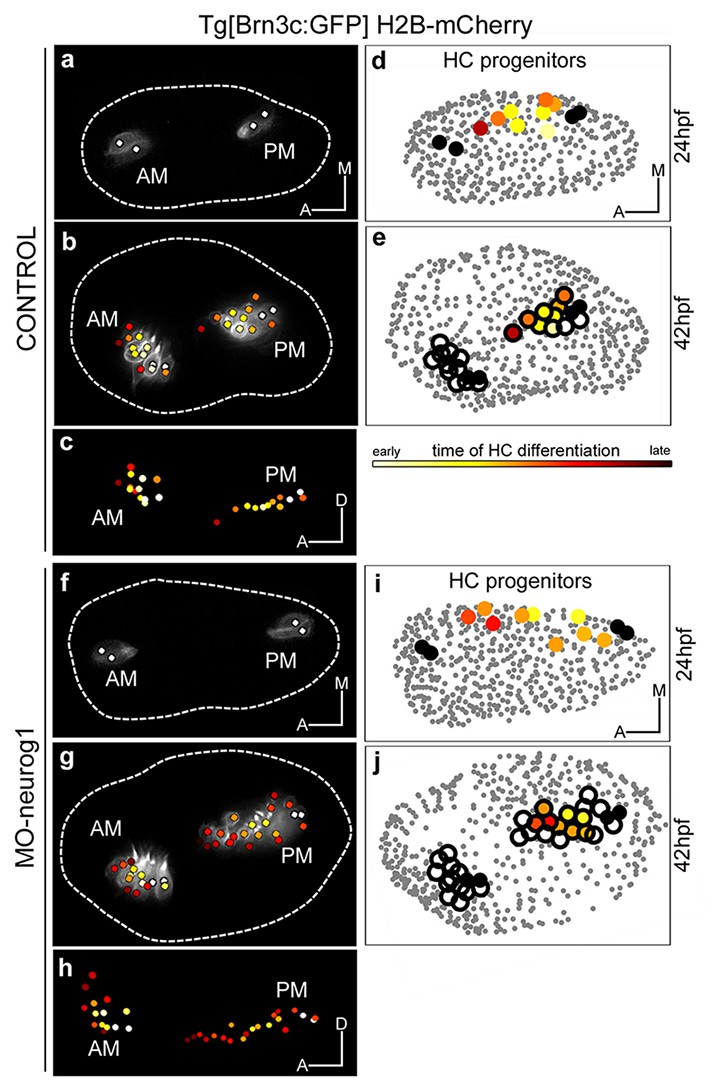
Differentiated hair cells were tracked during 18 hr in control and MO-neurog1, and reconstructed cell centers were color-coded according to the differentiation time displayed in the legend (Video 6). (a–b,f–g) Spatiotemporal pattern of hair cell differentiation of the anterior/posterior maculae (AM/PM); reconstructed colored cell centers overlaid with the corresponding raw images (hair cell fate in grey level) from Tg[Brn3c:GFP] embryos; (c,h) reconstructed colored cell centers in lateral view. Note how the temporal but not the spatial development is altered in the MO-neurog1 PM (see Figure 4—figure supplement 1). (d,i) Map of hair cell progenitors in the whole otic vesicle (Videos 7–8); the maps were generated by backtracking the differentiated PM hair cells (e,j). ID Datasets: 140507aX for control, 140519aX for MO-neurog1; see Figure 4—figure supplement 1 for additional analyses
Figure 4—figure supplement 1

Temporal pattern of hair cell differentiation in AM and PM.
Tg[Brn3c:GFP] embryos injected with H2B-mCherry mRNA at 1cell-stage (with/without MO-neurog1) were imaged from 24 hpf to 42 hpf. (a) Graphs showing the increase of differentiated hair cells in the anterior (AM) and posterior (PM) maculae over time; the final number of differentiated hair cells at 42 hpf is indicated. Each line corresponds to a differentiated hair cell plotted from and color-coded for time of differentiation (see legend). Tether cells are depicted as white lines. Note the temporal differences in the development of the PM between control and MO-neurog1 embryos, with no major changes in the spatial pattern (Figure 4). Asterisk depicts an apoptotic hair cell. ID Datasets: 140507aX for control, 140519aX for MO-neurog1. (b) Spatiotemporal pattern of hair cell differentiation of the AM and PM of both ears of Tg[Brn3c:GFP]Tg[Isl3:GFP] embryo injected with lyn-TdTomato and H2B-mCherry mRNA at 1cell-stage (imaged from 25 hpf to 36 hpf). Differentiated hair cells were tracked and reconstructed colored cell centers overlaid with the corresponding raw images (hair cell fate/SAG in grey level as 3D-rendering). Graphs showing the increase of differentiated hair cells in the AM and PM over time; the final number of differentiated hair cells at 36 hpf is indicated. ID Dataset: 140402aX. (c) Spatiotemporal pattern of hair cell differentiation of AM and PM. Tg[Brn3c:GFP] embryo injected with lyn-TdTomato mRNA at 1cell-stage and imaged from 25 hpf to 45 hpf. Graphs displaying the increase of differentiated hair cells in AM/PM. Hair cell progenitors and differentiated hair cells were tracked (except for the one encircled in blue), and reconstructed colored cell centers overlaid with the corresponding raw images (MIP of lynTomato and GFP signal of a few slices in grey level). ID Dataset: 130326aX. Legend in panel (a) applies to all plots and diagrams of the figure.
Figure 5 with 1 supplement
Heterogeneous cell behavior in the non-sensory and sensory domains.
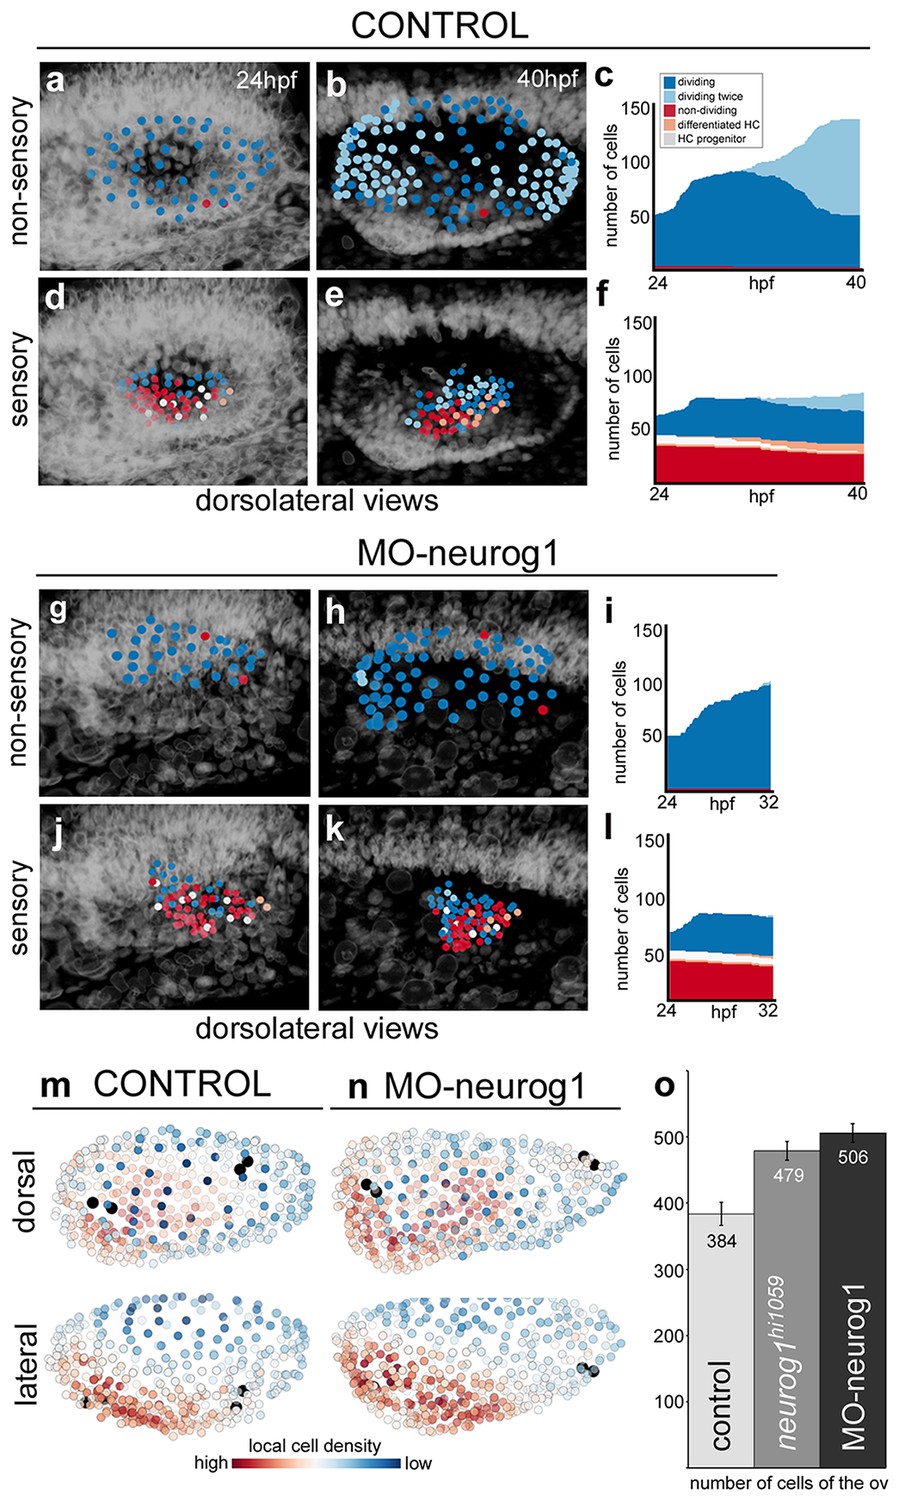
Neighboring cells in the non-sensory and sensory domains of control (a–f) and MO-neurog1 (g–l) were tracked and reconstructed cell centers were color-coded according to cell proliferation/differentiation status (see legend in (c); Video 9); they were plotted on the top of the corresponding raw images (a–b,d–e,g–h,j–k; nuclei in grey level), or in graphs over time (c,f,i,l) displaying the total number of cells in each domain and their status in the course of the video. Note the differences in the graphs between non-sensory and sensory domains, but not between control and MO-neurog1 embryos. (m–n) Estimated local cell densities at 24 hpf are represented by color-coded cell centers across the whole otic epithelium (Video 10). Tg[Brn3c:GFP] embryos injected with H2B-mCherry and with/without MO-neurog1 at 1cell-stage were used for full lineage reconstruction (Tables 1–2). Anterior is always to the left. ID Datasets: 140507aX for control, 140519aX for MO-neurog1; see Figure 5—figure supplement 1 for additional analyses. (o) Graphic depicting the total number of cells in the otic vesicles for wild type (control, n = 3), neurog1hi1059/ hi1059 mutant in the Tg[Isl3:GFP] background (n = 3), and MO-neurog1 embryos (n = 2) at 24 hpf.
Figure 5—figure supplement 1
Tissue architecture in sensory and non-sensory domains.
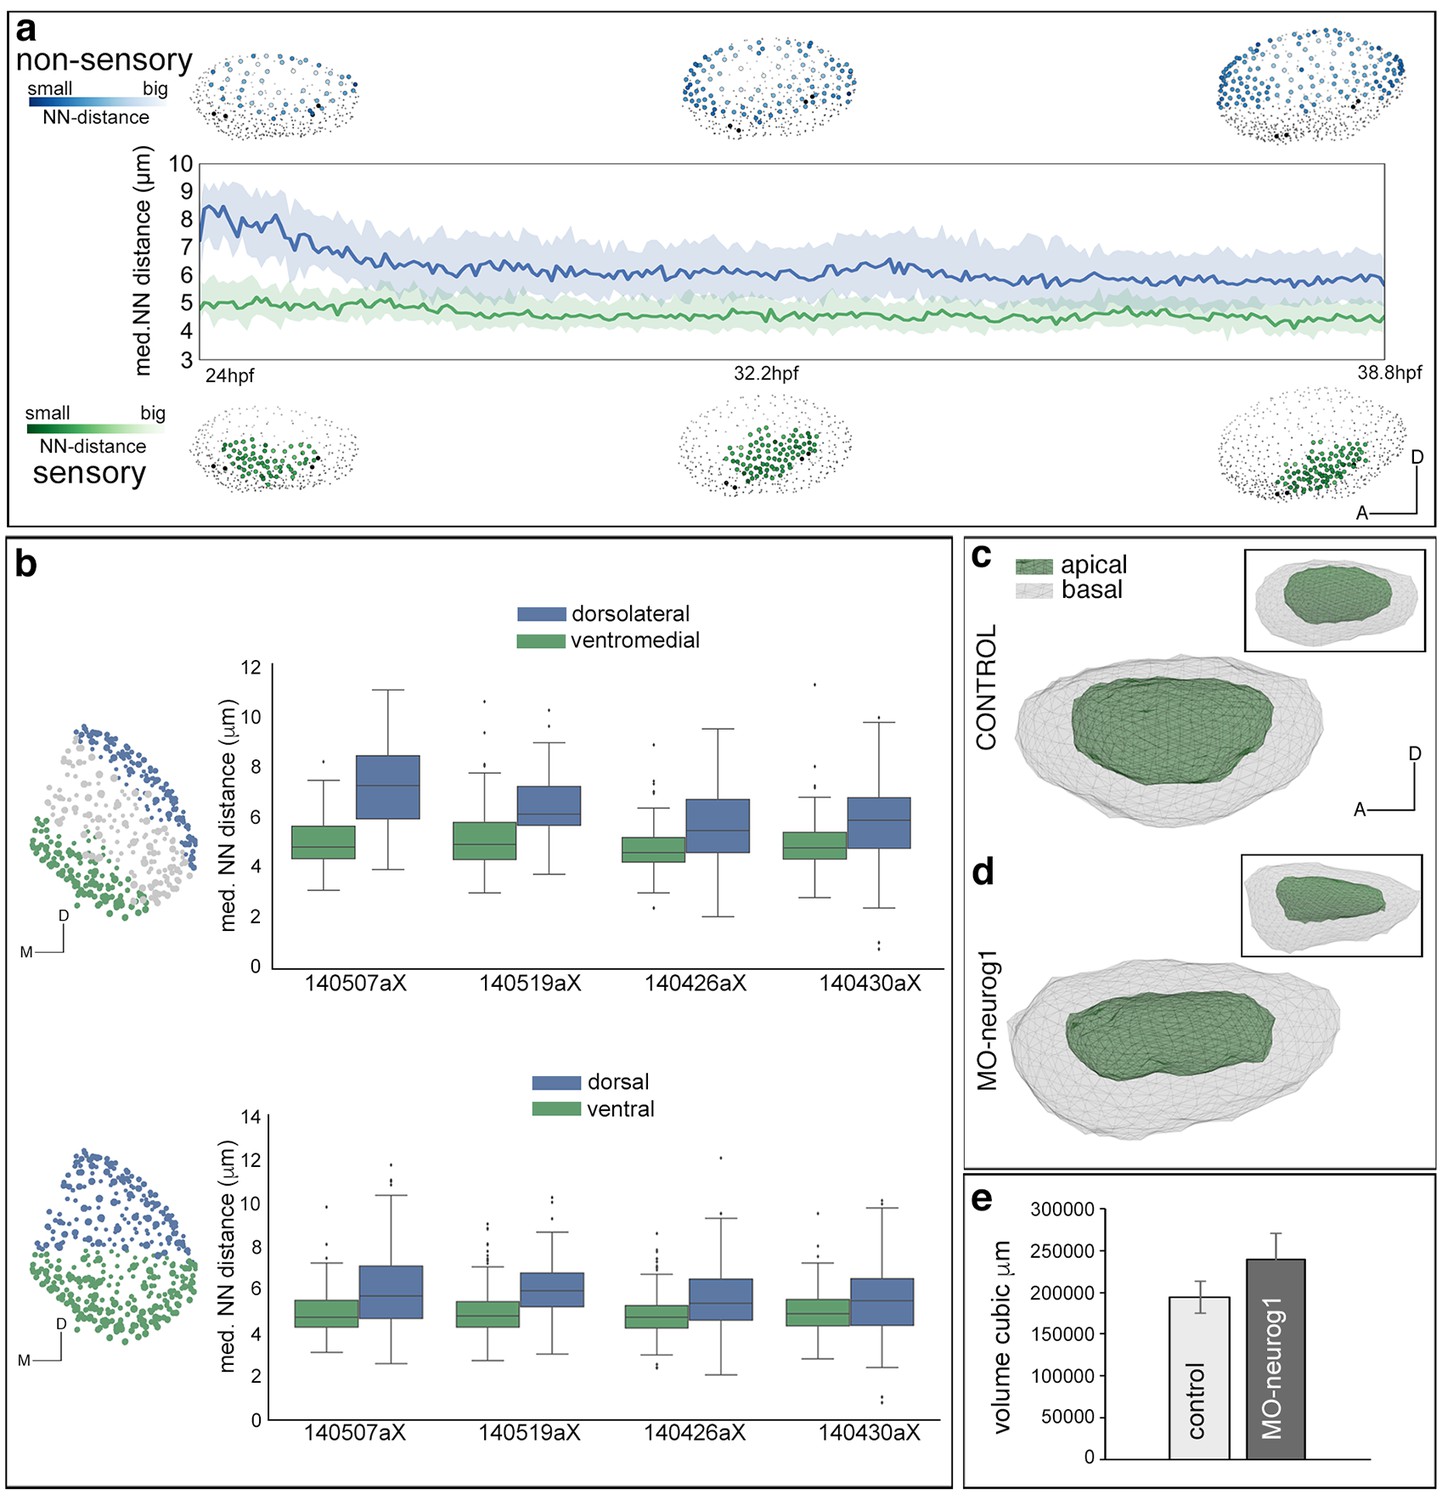
Tg[Brn3c:GFP] injected with H2B-mCherry mRNA at 1cell-stage were imaged and analyzed. (a) Plots at three time points showing the distribution of tracked neighboring otic cells within the non-sensory (blue) or sensory (green) domains in the context of the whole otic vesicle (grey dots). Color intensities represent the nearest neighbor distance (NN-distance, see legend); graph shows the median and quartiles of the NN-distance for each domain over time. Note that cells within the non-sensory territory are more spaced than cells in the sensory domain. ID Dataset: 140507aX. (b) Graph showing the differences in average NN-distances between the ventromedial and dorsolateral domains (top), or ventral and dorsal territories (bottom) of several ears. Note that cells within the dorsolateral/dorsal territories are more spaced than cells in the ventromedial/ventral domains. Cell selections in the context of the whole ear for 140426aX are shown in the left-hand side. ID Datasets: 140507aX, 140519aX, 140430aX, 140426aX. (c–e) Comparison of the volumes of otic vesicles of control and MO-neurog1 embryos at 24 hpf. (c–d) Lateral views of otic vesicle volumes depicting the epithelial surfaces: basal/outer (grey mesh) and apical/inner (green mesh); insets in (c–d) display the corresponding dorsal views. ID Datasets: 140507aX for control, 140519aX for MO-neurog1. (e) Graph showing the average volume of otic vesicles for control (n = 3) and MO-neurog1 (n = 2) embryos in cubic µm. Note the increase of the average volume in MO-neurog1. Tg[Brn3c:GFP] embryos were injected with H2B-mCherry and with/without MO-neurog1 at 1cell-stage.
Videos
Video 1
Early organization of neuroblasts within the SAG.
Tg[cldnb:lynGFP]Tg[Brn3c:GFP] embryos injected with H2B-mCherry mRNA were imaged, and reconstructed cell centers were color-coded according to their location/identity (see legend). The projection view video (large panel) simultaneously displays the topological organization of the cell group selection and tissue architecture as a projection of the GFP channel (plasma membranes in grey) in x,y,z-axes. The distinct visualization modes displayed on the right hand side allow for a detailed 3D-visualization of data during the analyses. Orthogonal views are used to validate cell tracking, the oblique slice view allows orienting the orthoplane along the embryonic axes, and the rendering view permits to display validated cell centers in the context of the whole image volume. ID Dataset: 140423aX.
Video 2
Segmentation of delaminating neuroblasts.
Tg[cldnb:lynGFP]Tg[Isl3:GFP] embryos were injected with H2B-mCherry mRNA at 1cell-stage, and single delaminating neuroblasts (n = 5) were automatically segmented. A representative segmentation (red colored cell) is shown. Transverse and lateral views (top and bottom rows) with their respective high magnifications on the right hand side. Note that the neuroblast changes shape and exits the otic epithelium basally within one hour. ID Dataset: 140426aX.
Video 3
The order of delamination foreshadows the mediolateral gradient of neuroblasts differentiation within the SAG.
A cohort of 144 delaminated neuroblasts was analyzed for time of delamination. Reconstructed cell centers were color-coded according to four delamination intervals: 18–20 hpf white, 20–22 hpf yellow, 22–24 hpf orange, 24–30 hpf red. Note that neuroblasts exit randomly from the delamination domain. Those delaminating earlier are located more medially in the SAG than the later delaminating ones prefiguring the gradient of differentiation. Reconstructed cell centers were displayed as colored dots together with the corresponding volume rendering images (plasma membranes in grey level) with higher intensity on the left hand side. Tg[cldnb:lynGFP] Tg[Isl3:GFP] embryo was injected with H2B-mCherry mRNA at 1cell-stage. ID Dataset: 140426aX.
Video 4
The anterior and posterior SAG neuronal populations derive from the anterior and posterior otic epithelium, respectively.
Neuroblasts belonging to distinct SAG neuronal populations, anterior or posterior (cyan/red), were backtracked to their otic epithelial origin prior to delamination. Note that cells of the anterior and posterior SAG delaminate from the anterior and posterior otic epithelium, respectively, and they maintain this relative position. The video is played backwards. These neuroblasts are the same set of cells as used in Video 3, but analyzed for AP position in the SAG instead of delamination time. ID Dataset: 140426aX.
Video 5
Position of epithelial neuroblasts along the anteroposterior axis prefigures their location within the SAG.
Reconstructed cell centers from neuronal progenitors were color-coded for position along the anteroposterior (AP) (left) or mediolateral (ML) (right) axes in the otic epithelium and followed from 18 hpf to 30 hpf. Note that the relative position of neuroblasts along the AP but not the ML axis is maintained from the otic epithelium to the SAG. These neuroblasts are the same set of cells as used in Video 3, but analyzed for epithelial position along the AP/ML axes instead of delamination time. ID Dataset: 140426aX.
Video 6
Spatiotemporal pattern of hair cell generation of sensory maculae in control and MO-neurog1 embryos.
Tg[Brn3c:GFP] embryos were injected with H2B-mCherry mRNA at 1cell-stage (in the presence or absence of MO-neurog1), and differentiated hair cells of the anterior (AM) and posterior (PM) maculae were tracked during 18 hr (Table 1). The centers of hair cells were reconstructed and color-coded according to their time of differentiation as given by the onset of GFP expression. Top row displays reconstructed color-coded cell centers together with imaging data (orthoslice views of the maculae with raw images of hair cells in grey level), middle row shows imaging data alone (GFP signal as volume rendering), and bottom row displays only the reconstructed color-coded cell centers. Volume rendering and reconstructed cell centers panels rotate from dorsal to lateral view to illustrate the 3D-organization of hair cells within the maculae. ID Datasets: 140507aX for control, 140519aX for MO-neurog1.
Video 7
Position of the posterior macula hair cell progenitor pools in control and MO-neurog1 embryos.
Dynamic display of the posterior macula hair cell progenitors in control and MO-neurog1 embryos at 24 hpf. Progenitor pools were determined from the backtracking of differentiated hair cells in the Tg[Brn3c:GFP] line injected with H2B-mCherry at 1cell-stage. Hair cell progenitors are color-coded for time of differentiation and plotted in the context of the whole otic vesicle (grey dots depict reconstructed cell centers of the otic epithelium). Tether cells are shown as black circles. The animation displays a rotation of otic vesicles around the anteroposterior axis. ID Datasets: 140507aX for control, 140519aX for MO-neurog1.
Video 8
Maps of neuroblasts and PM hair cell progenitors in the whole otic vesicle.
The neuronal progenitors (orange; Figure 3d) and the posterior macula hair cell progenitors (blue; Figure 4d) are plotted in the context of the whole otic vesicle (grey dots) at 24 hpf. Tether cells are shown as black circles. The animation displays a rotation of otic vesicles around the anteroposterior axis. Note that the two progenitor domains are adjacent, and neuroblasts are located more ventrally while sensory progenitors are more medially. ID Datasets: 140426aX for neuronal progenitors, 140507aX for PM hair cell progenitors.
Video 9
Cell proliferative activity in the non-sensory and sensory domains.
Tg[Brn3c:GFP] embryos injected with H2B-mCherry at 1cell-stage were used for full lineage reconstruction (from 24 hpf to 38 hpf) of 51 and 64 neighboring cells located in the non-sensory and sensory domains of the otic vesicle, respectively. Transverse view on the left is to better illustrate the position of the cell population domains along the axes. Reconstructed cell centers color-coded according to cell division/differentiation status and plotted in context of the raw images (nuclei channel as volume rendering in grey levels). ID Dataset: 140507aX.
Video 10
Local cell densities across the whole epithelium in control and MO-neurog1.
All cells of the otic epithelium in a control and a MO-neurog1 embryo are plotted and color-coded according to their estimated local cell density at 24 hpf. Tether cells are depicted in black for better orientation. The animation displays a rotation of otic vesicles around the anteroposterior axis. Note that the anteroventral territory displays higher cell density in both cases. ID Datasets: 140507aX for control, 140519aX for MO-neurog1.
Video 11
Innervated sensory patches in the embryonic inner ear.
Animation of a Tg[Brn3:GFP]Tg[Isl3:GFP] embryo displaying the sensory patches with differentiated cellular neurosensory elements in green at 48 hpf. Differentiated hair cells of the maculae (AM/PM) and cristae (ac/lc/pc) are innervated by sensory neurons of the SAG, which shows the typical segregation into anterior and posterior portion alongside with the segregated projections to the hindbrain (Sapède and Pujades, 2010).
Tables
Table 1
Cohort of embryos and datasets used for the study.
Datasets used in this study with corresponding information about transgenic embryos and mRNA injections. Temporal frequency of image acquisition (timestep imaging) and corresponding imaging sequences are depicted. Each dataset corresponds to one imaged embryonic inner ear for the corresponding time period, except for dataset 140402aX in which both ears were imaged.
ID dataset | Transgenic embryo | mRNA injection | Timestep imaging | Imaging sequences |
|---|---|---|---|---|
140210aX | Tg[neuroD:GFP] | lyn-TdTomato | 5 min | 14.5–31.5 hpf |
140125aX | Tg[neuroD:GFP] | lyn-TdTomato | 5 min | 16–37.5 hpf |
140306aX | Tg[neuroD:GFP] | lyn-TdTomato H2B-cerulean | 5 min | 12–32.9 hpf |
140426aX | Tg[cldnb:lynGFP]Tg[Isl3:GFP] | H2B-mCherry | 4 min | 18–36.2 hpf |
140430aX | Tg[cldnb:lynGFP]Tg[Brn3c:GFP] | H2B-mCherry | 4 min | 17–37.2 hpf |
140423aX | Tg[cldnb:lynGFP]Tg[Brn3c:GFP] | H2B-mCherry | 4 min | 16–26.5 hpf |
140507aX | Tg[Brn3c:GFP] | H2B-mCherry | 5 min | 24–43 hpf |
140326aX | Tg[Brn3c:GFP] | lyn-TdTomato | 10 min | 25–45 hpf |
140519aX | Tg[Brn3c:GFP] | H2B-mCherry MO-neurog1 | 5 min | 24–42 hpf |
140513aX | Tg[Brn3c:GFP] | H2B-mCherry MO-neurog1 | 5 min | 24–32.9 hpf |
140402aX | Tg[Brn3c:GFP] Tg[Isl3:GFP] | lyn-TdTomato H2B-cerulean | 10 min | 25–34 hpf |
Table 2
Datasets used for the study of the different biological questions.
Datasets used for each addressed biological question, and Figures in which the corresponding analyzed data are displayed. Each dataset corresponds to one imaged embryonic inner ear, except for 140402aX in which both ears were imaged. All datasets correspond to control samples, except for 140519aX and 140513aX that correspond to MO-neurog1 embryos (see Table 1). Note that we have performed deep and detailed analyses in few datasets, and supported the observations and conclusions with partial analyses of other datasets mainly included in supplementary figures.
Download links
A two-part list of links to download the article, or parts of the article, in various formats.
Downloads (link to download the article as PDF)
Open citations (links to open the citations from this article in various online reference manager services)
Cite this article (links to download the citations from this article in formats compatible with various reference manager tools)
Distribution of neurosensory progenitor pools during inner ear morphogenesis unveiled by cell lineage reconstruction
eLife 6:e22268.
https://doi.org/10.7554/eLife.22268


