Structure and function of the mycobacterial transcription initiation complex with the essential regulator RbpA
- The Rockefeller University, United States
- Sloan-Kettering Institute, United States
- Independent Researcher, United States
- Memorial Sloan-Kettering Cancer Center, United States
Figures
Figure 1 with 1 supplement

Structure of the Msm RbpA/TIC.
(A) (top) The RbpA structural architecture is represented schematically. The CD is shown as a thick region, with β-strands represented as arrows. The α-helices of the SID are shown as rectangles. Linker regions lacking secondary structure, the NTT and BL, are represented by a thin line. The NTT is disordered in the crystal structure and is shown as a dashed line. Conserved basic residues in the BL (K74, K76, R79) that interact with the DNA phosphate backbone are denoted. (bottom) Overall structure of the Msm RbpA/TIC. The color-coding of most of the structural features is denoted in the legend. Protein components (core RNAP, σA, RbpA) are shown as molecular surfaces. The surfaces of RbpA and the lineage-specific insert β’i1 are transparent, revealing the α-carbon backbone ribbon underneath. RbpA side chains K74, K76, and R79 are shown in stick format. The DNA is shown as CPK atoms, with the −35 and −10 elements colored yellow. (B) Magnified view of the region including RbpA and the promoter DNA near the −10 element. The DNA is shown in stick format. The β’ZBD surface is transparent with the Zn2+-ion shown as a sphere.
Figure 1—figure supplement 1
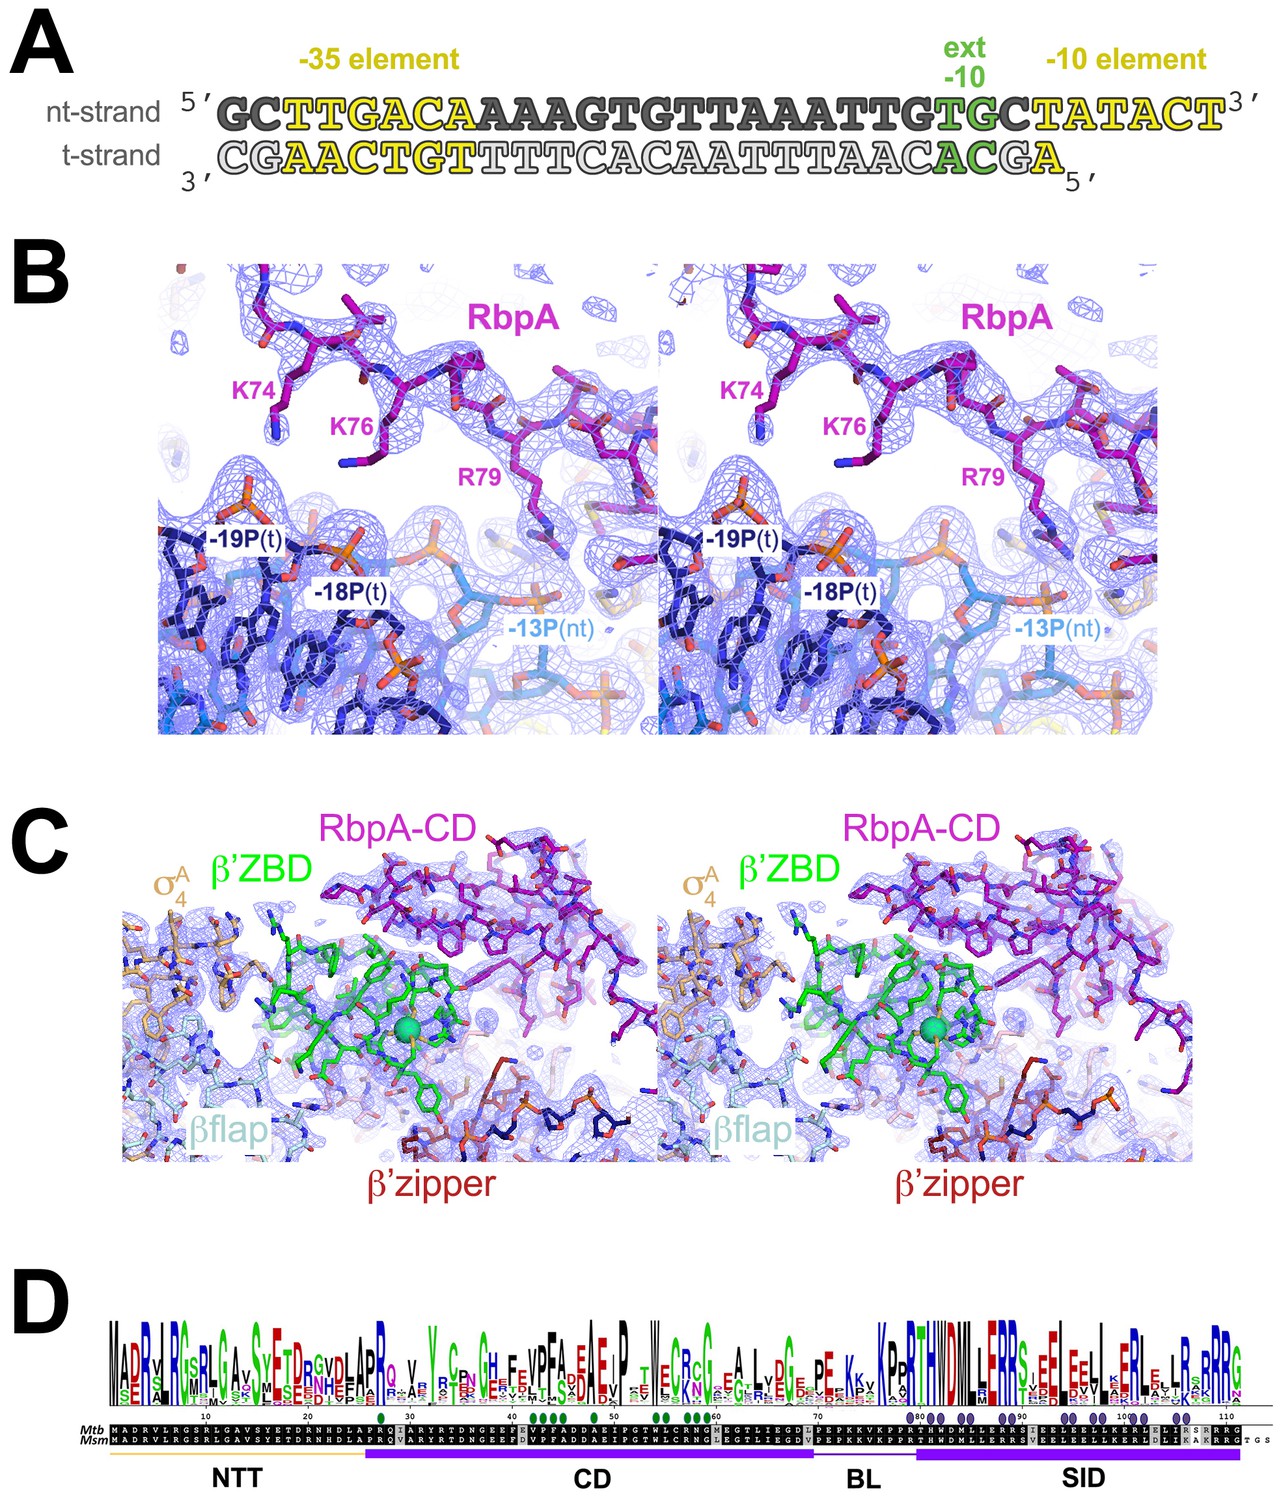
Crystallization oligonucleotides, electron density maps, and RbpA sequence conservation.
(A) Synthetic oligonucleotides used for the Msm RbpA/TIC crystallization. The DNA sequence is derived from the full con promoter (Gaal et al., 2001). The nt-strand DNA (top strand) is colored dark gray; the t-strand DNA (bottom strand), light grey. The −35 and −10 elements are shaded yellow. The extended −10 (Keilty and Rosenberg, 1987) is colored green. (B) Stereo view of the refined 2Fo – Fc map (light blue mesh, contoured at 1σ), with superimposed structure showing the RbpABL residues K74, K76, and R79 interactions with the DNA phosphate backbone. (C) Stereo view of the refined 2Fo – Fc map (light blue mesh, contoured at 1σ), with superimposed structure showing the RbpACD interface with the β’ZBD and β’zipper region. (D) Sequence logo (top) derived from an alignment of 890 RbpA orthologs. Below are shown the Mtb and Msm RbpA sequences and at the bottom, the RbpA structural elements (NTT, CD, BL, SID). The filled dots above the sequences denote RbpA residues that interact with the β’ZBD/β’zipper region (green dots) or σA (blue dots).
Figure 2 with 1 supplement
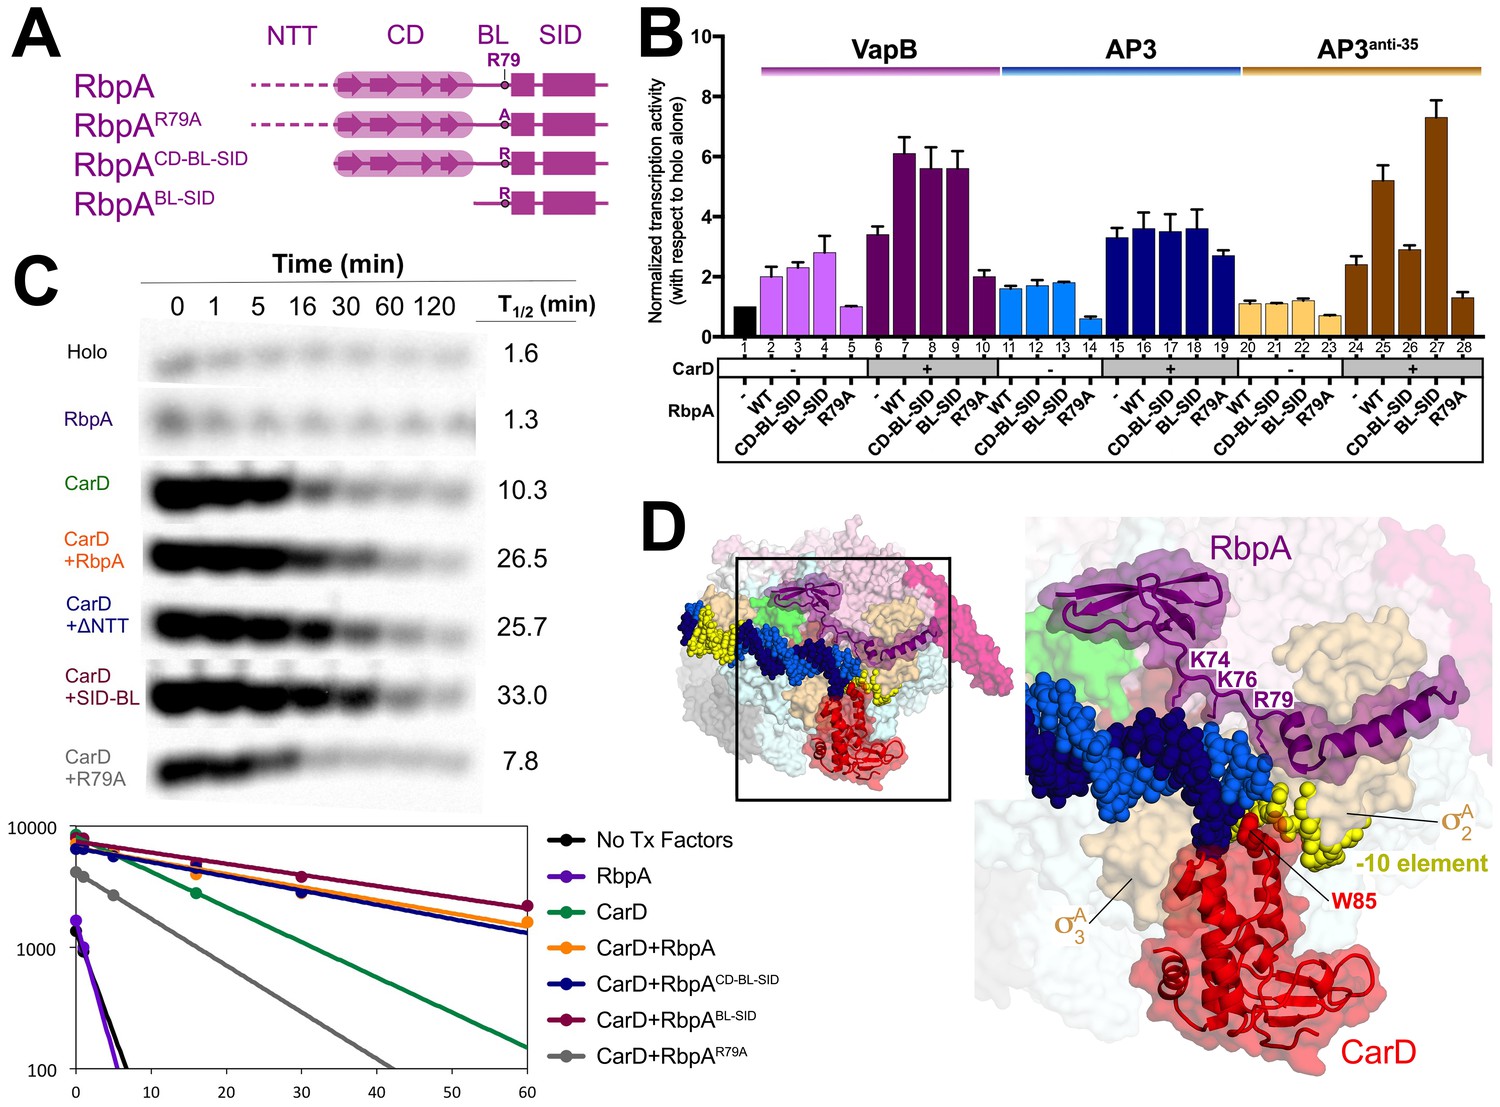
Function of RbpA and RbpA derivatives in transcription initiation and cooperativity with CarD.
(A) Schematic diagram denoting the RbpA derivatives used in subsequent assays. (B) The effect of RbpA or RbpA derivatives (denoted at the bottom) on activation of abortive initiation from three different promoters (VapB, AP3, AP3anti-35, denoted at the top) with or without CarD. The transcription activity for each promoter was normalized with respect to holo activity on that promoter (holo alone on each promoter was normalized to a value of 1, as shown in lane 1). The error bars denote the standard error from a minimum of three experiments. (C) Promoter complex lifetimes measured by abortive initiation on the AP3 promoter. In the top panel, [32P]-labeled abortive transcript production at times after addition of a large excess of competitor promoter trap DNA (Davis et al., 2015) was monitored by polyacrylamide gel electrophoresis and autoradiography. On the bottom, transcript production was quantified by phosphorimagery and plotted. The lines indicate single-exponential decay curves fit to the data points. The calculated decay half-lives (t1/2) are shown to the right of the gel images. (D) Structural model showing the Msm RbpA/TIC (color coded as in Figure 1) along with CarD (red), superimposed by aligning the thermus CarD/RPo structure (PDB ID 4XLR; (Bae et al., 2015a).
Figure 2—figure supplement 1
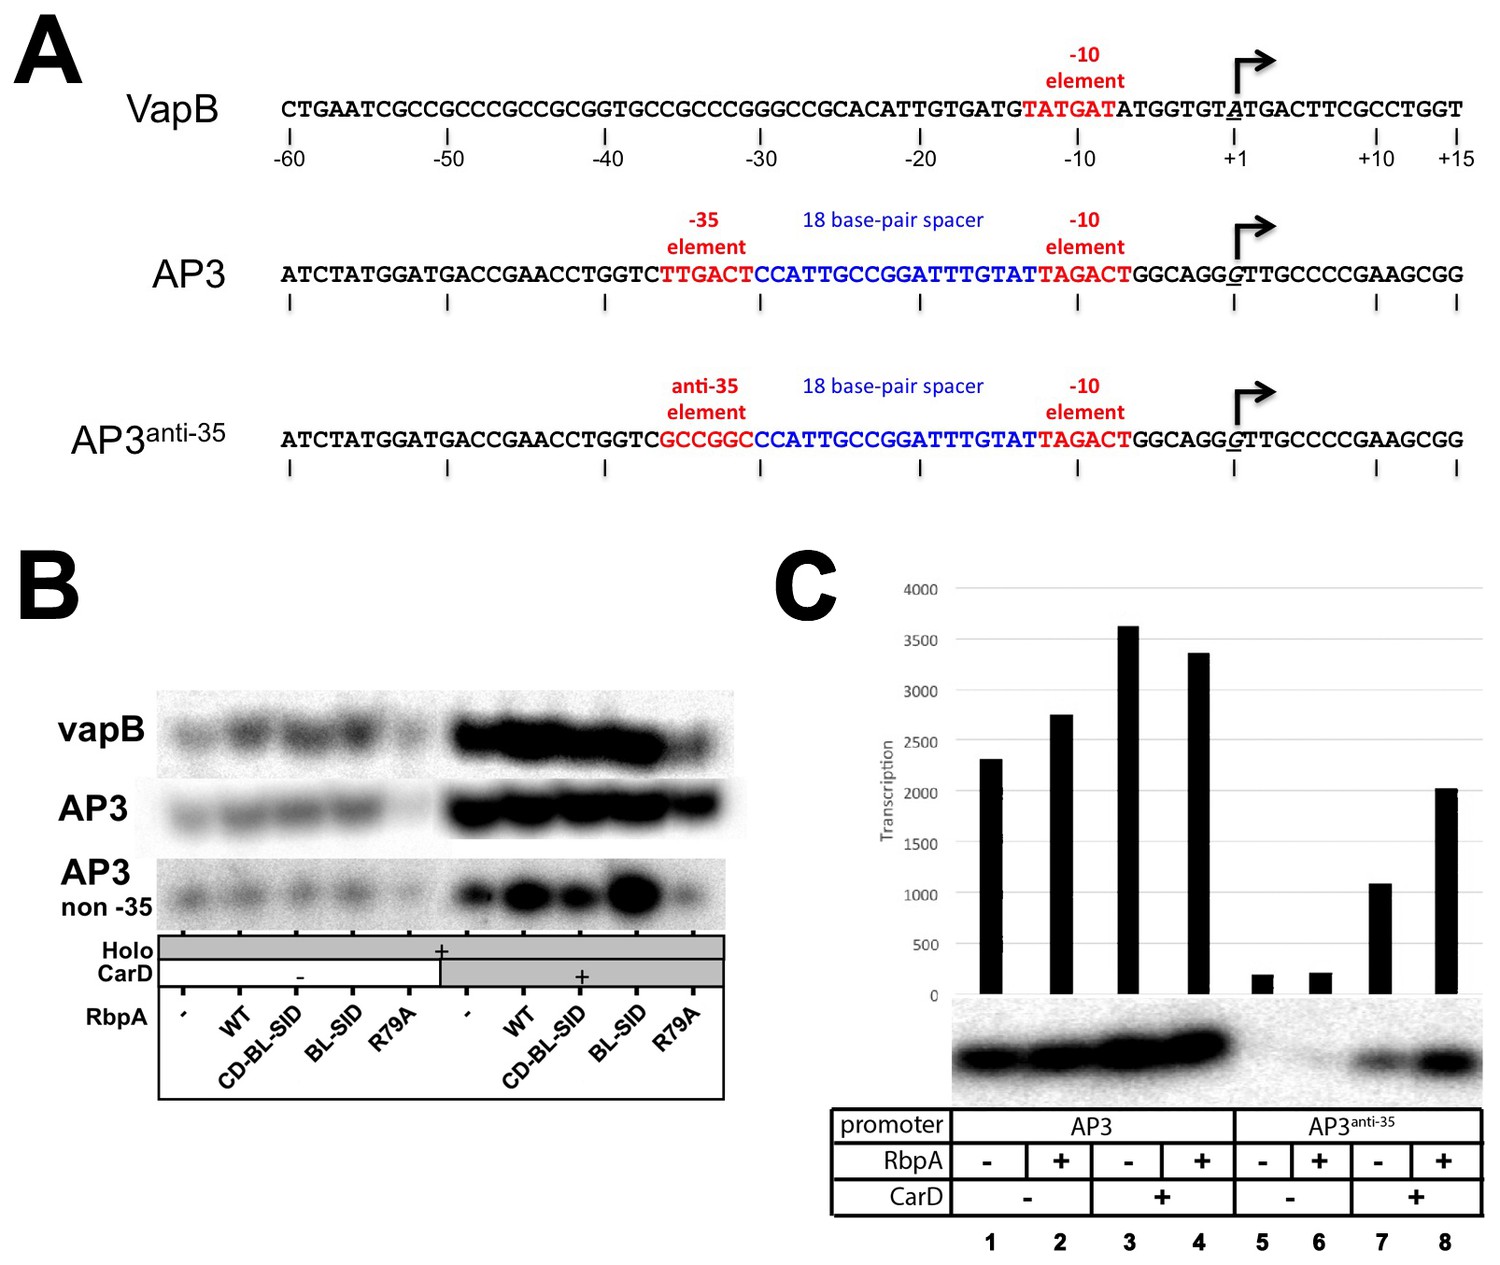
Transcription templates and abortive initiation data.
(A) Sequences of promoter templates used in the transcription experiments (sequences shown only from −60 to +15) for the VapB, AP3, and engineered AP3anti-35 promoters. (B) Example abortive transcription data used to generate Figure 2B. [32P]-labeled abortive transcripts were visualized by polyacrylamide gel electrophoresis and autoradiography. Experiments on each promoter were performed using different specific activities of [32P] so the band intensities between each promoter are not comparable. (C) Abortive transcription reactions directly comparing transcription on AP3 (left) and AP3anti-35 (right). Transcription by holo alone on AP3anti-35 (lane 5) is more than 10-fold weaker than on AP3 (lane 1).s.
Figure 3 with 1 supplement
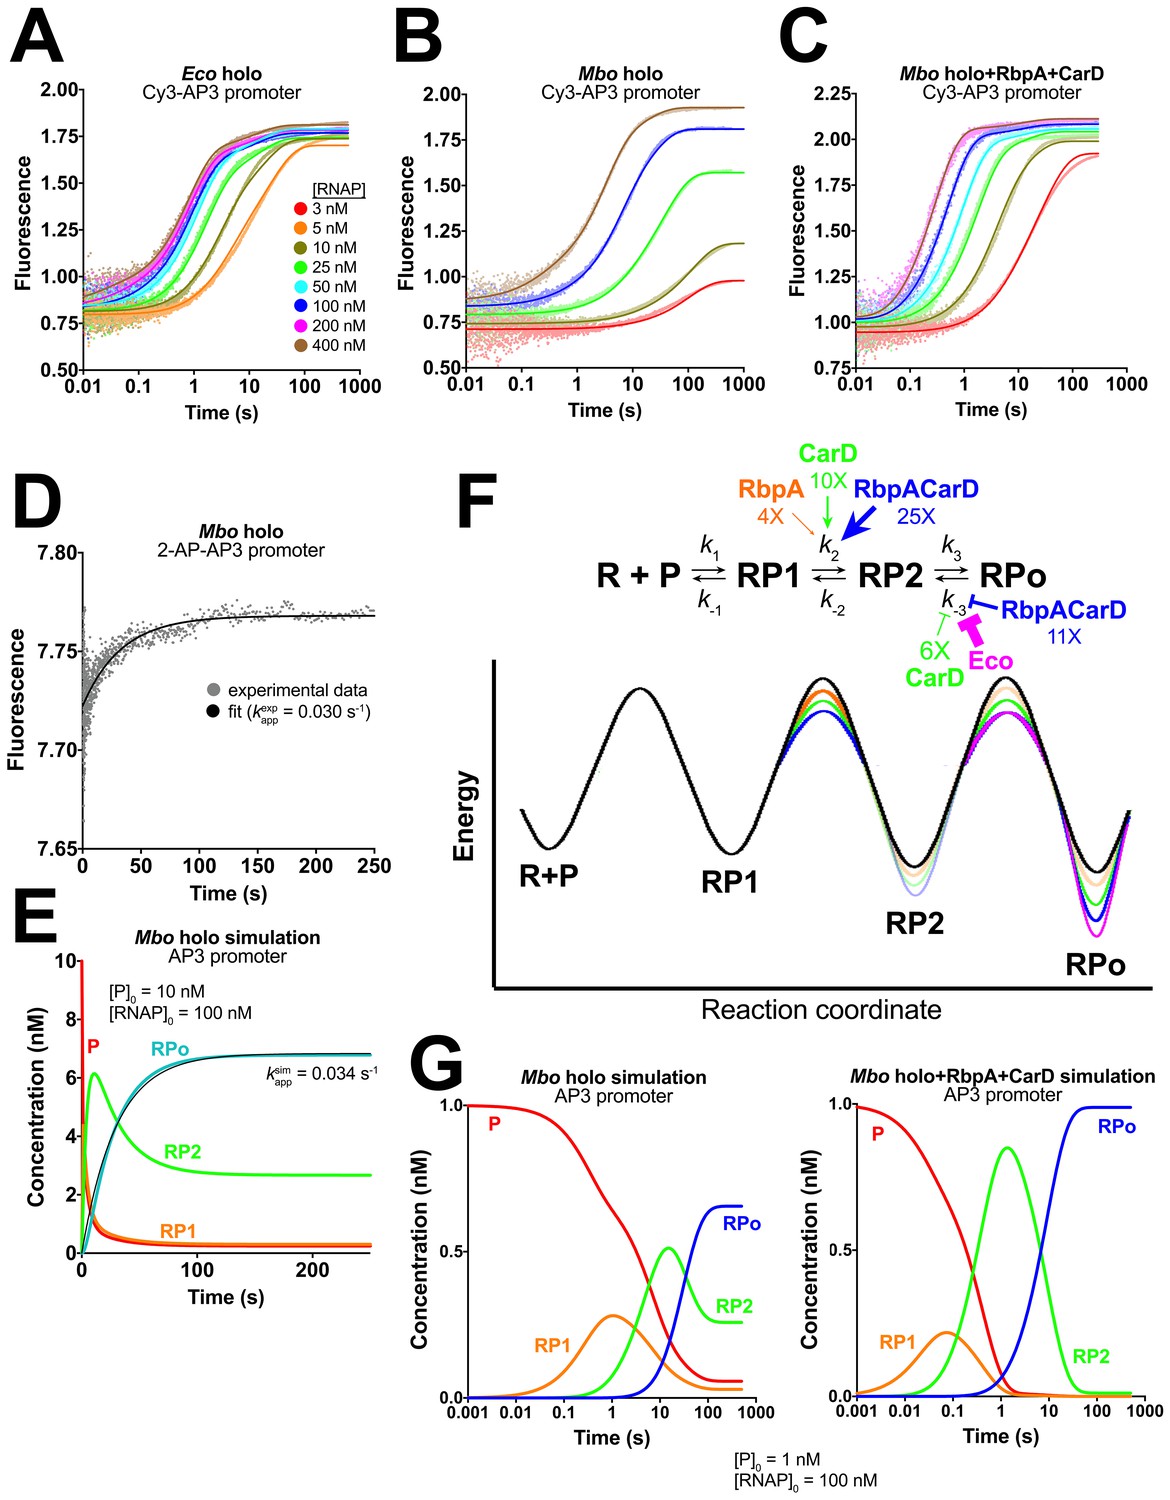
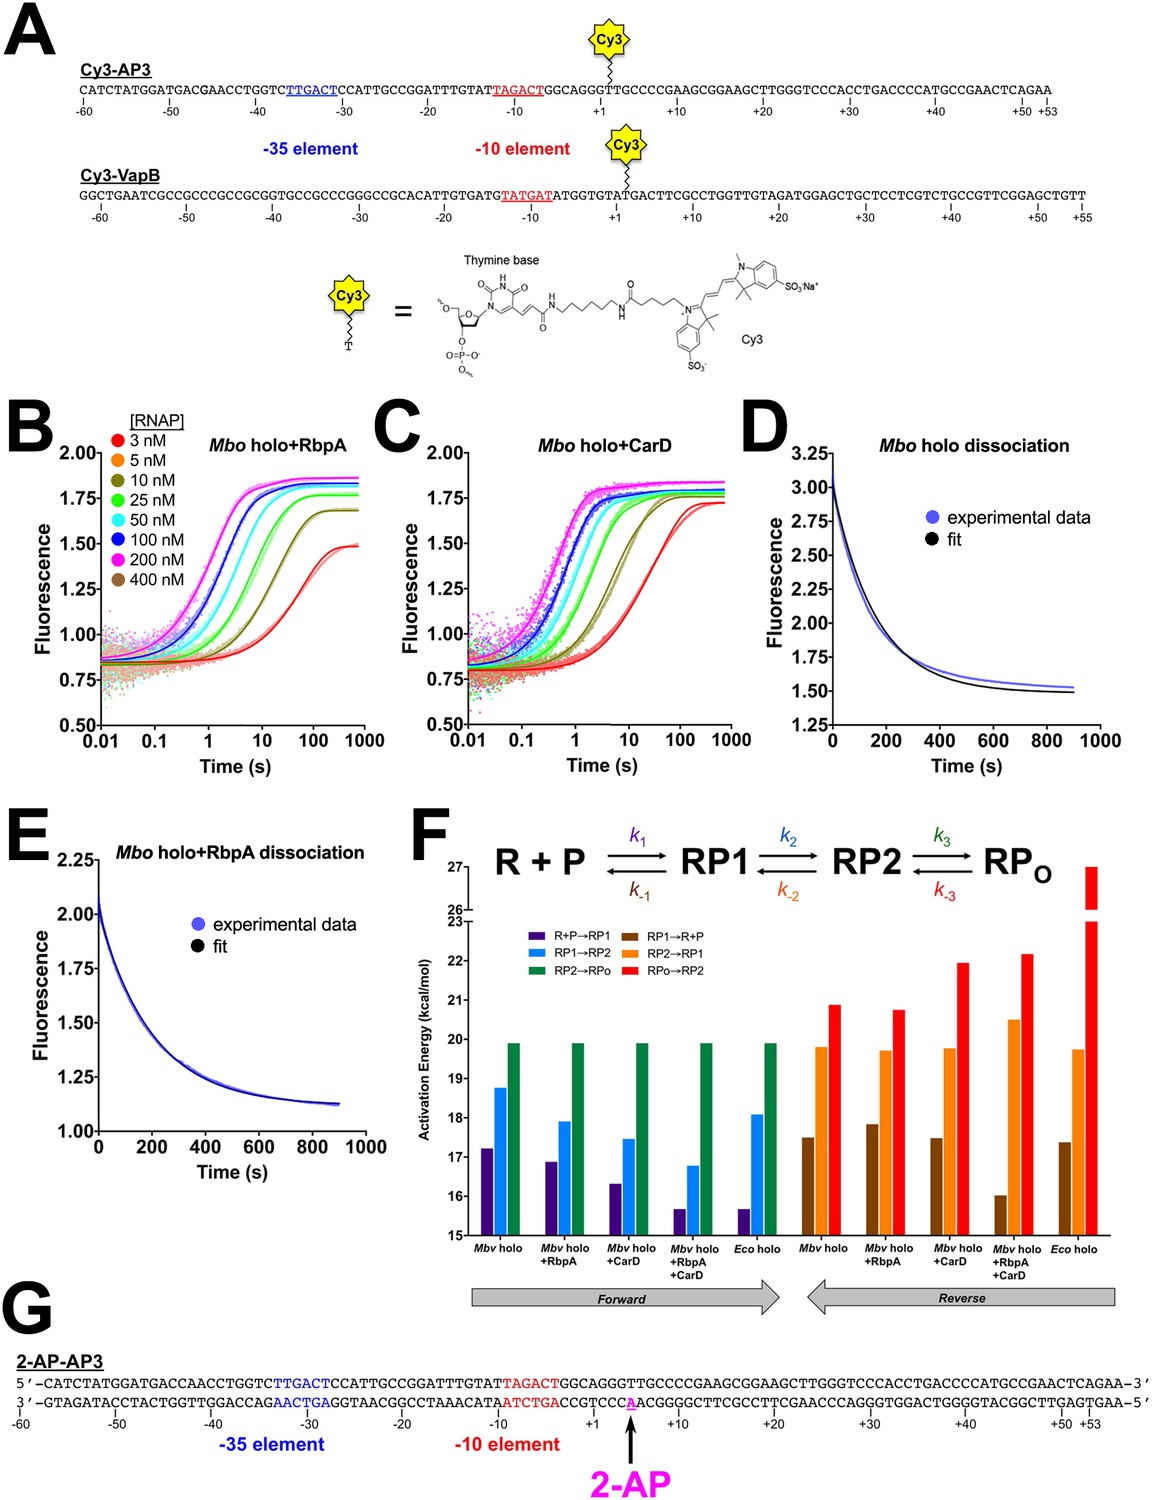
Kinetics of RPo formation on the AP3 promoter.
(A) Plot showing the fluorescence signal vs. time after rapid mixing of Eco holo with Cy3-AP3 promoter (Figure 3—figure supplement 1A) in a stopped flow fluorimeter. The [RNAP] giving rise to each curve is color-coded as shown in the legend. The experimental data are shown as points. The data were fit using the three-step sequential kinetic scheme (Equation 1), yielding the parameters listed in Supplementary file 4. The curve fits are shown as solid lines. (B) Same as (A) but with Mbo holo. (C) Same as (A) but with Mbo holo+RbpA+CarD. (D) Plot showing the fluorescence signal vs. time after mixing 100 nM Mbo holo with 10 nM 2-AP-AP3 promoter (Figure 3—figure supplement 1G) in a stopped flow fluorimeter. The experimental data are shown as points. The data were fit to a single-exponential (solid black line): yielding kappexp = 0.030 s−1. (E) Simulation of changes in the populations of P (red), RP1 (orange), RP2 (green), and RPo (blue) under the same conditions as the experiment of panel (D). The kinetic parameters used to generate the simulation are from Supplementary file 4. The data were fit to a single-exponential (thin black line), yielding kappsim = 0.034 s−1. (F) (top) The three-step sequential kinetic scheme that best accounts for all of the kinetic data is shown. The steps targeted by the transcription factors RbpA (orange), CarD (green), or RbpACarD together (blue) are denoted. Arrows pointing at a parameter indicate an increase in that parameter in the presence of the factor (compared to Mbo holo alone by the fold-amount shown below); the ‘T’ symbol indicates the factor reduces the parameter. The most important difference between the reference (Mbo holo alone) and Eco holo (magenta) is also illustrated. RbpA, CarD, and RbpACarD all increase k2 significantly. CarD also reduces k-3, as does Eco holo to a much greater extent. (bottom) Schematic free energy profile for RPo formation. The black curve represents Mbo holo alone. The colored curves illustrate the most important changes induced by the factors (RbpA, orange; CarD, green; RbpACarD, blue; Eco holo, magenta). (G) Simulations of changes in the populations of P (red), RP1 (orange), RP2 (green), and RPo (blue) when [P]0 = 1 nM and [RNAP]0 = 100 nM for Mbo holo alone (left) and Mbo holo+RbpA+CarD (right). The kinetic parameters used to generate the simulation are listed in Supplementary file 4. RbpA and CarD together induce a significant increase in k2, producing a large transient burst of RP2, driving formation of RPo.
Figure 3—figure supplement 1
Cy3 promoters, association and dissociation data, activation energies, and 2-AP promoter.
(A) Schematics showing the sequences of the Cy3-AP3 and Cy3-VapB promoter constructs, illustrating the attachment points for the Cy3 label by the chemistry shown below. (B) Plot showing the fluorescence signal vs. time after rapid mixing of different concentrations of Mbo holo+RbpA with 1 nM Cy3-AP3 promoter (Figure 3—figure supplement 1A) in a stopped flow fluorimeter. The [RNAP] giving rise to each curve is color coded as shown in the legend of Figure 3A. The experimental data are shown as points. The data were fit using the three-step sequential kinetic scheme (Equation 1), yielding the parameters listed in Supplementary file 4. The curve fits are shown as solid lines. (C) Same as (B) but with Mbo holo+CarD. (D) Mbo holo RPo dissociation experiment. RPo was preformed by incubating 250 nM Mbo holo with 1 nM Cy3-AP3 DNA (Figure 3—figure supplement 1A), then mixed with 1 µM unlabeled competetive promoter trap DNA (Davis et al., 2015). The fluorescence signal was monitored as a function of time (blue data points). The thin black line shows the simulated experiment calculated fro the kinetic parameters listed in Supplementary file 4. (E) Same as (D) but with Mbo holo+RbpA. (F) The effect of RbpA and CarD on the activation energies of the kinetic steps of RPo formation on the AP3 promoter. The three-step sequential kinetic scheme is illustrated on top, with the rate constants for each step color-coded. Below, the activation energies for the different steps (color-coded) are plotted in a bar graph. (G) Sequence of the 2-AP-AP3 construct used in the experiment of Figure 3D. The introduced 2-AP is shown in magenta.
Figure 4
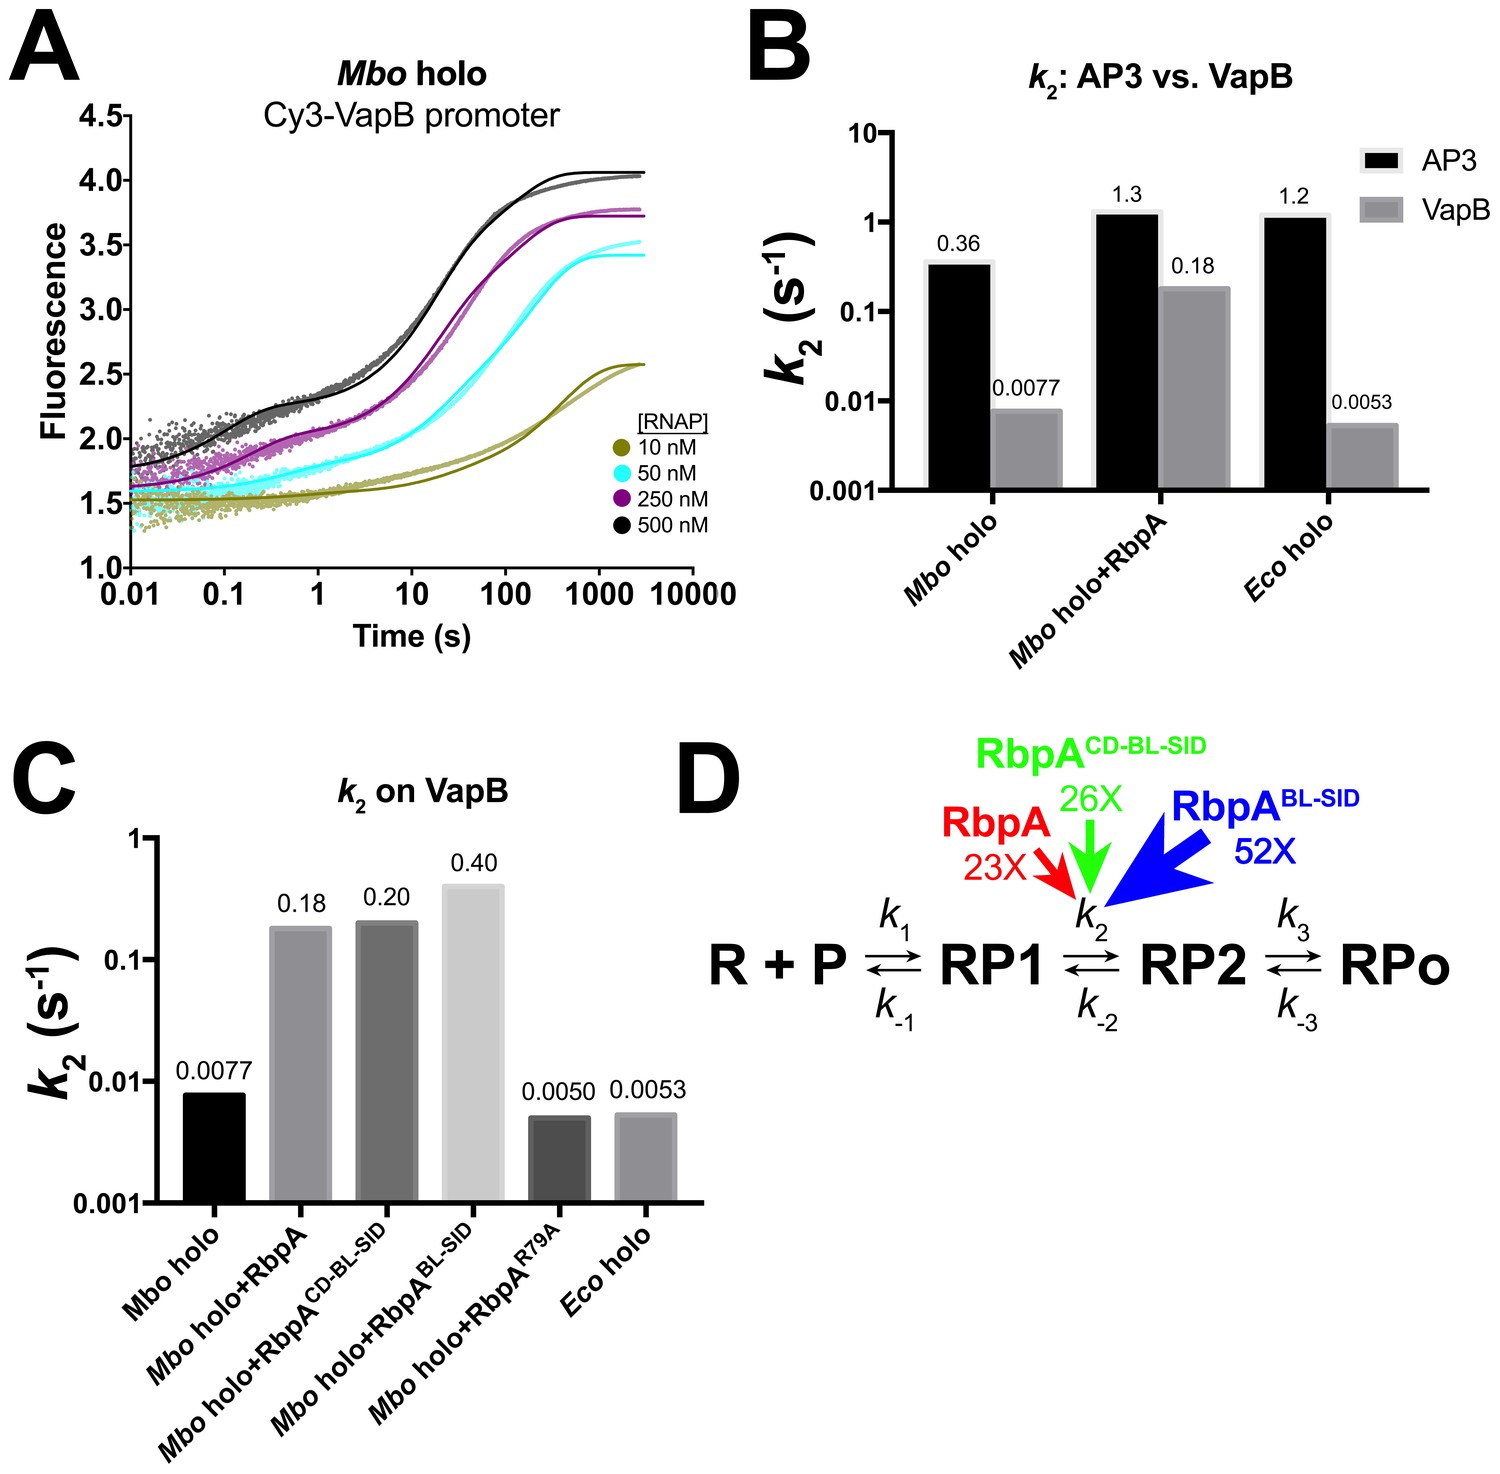
Kinetics of RPo formation on the VapB promoter.
(A) Plot showing the fluorescence signal vs. time after rapid mixing of Mbo holo with Cy3-VapB promoter (Figure 3—figure supplement 1A) in a stopped flow fluorimeter. The [RNAP] giving rise to each curve is color-coded as shown in the legend. The experimental data are shown as points. The data were fit using the three-step sequential kinetic scheme (Equation 1), yielding the parameters listed in Supplementary file 8. The curve fits are shown as solid lines. (B) Bar graph comparing the values of k2 for Mbo holo, Mbo holo+RbpA, and Eco holo on the AP3 promoter (black bars) and the VapB promoter (grey bars). (C) Bar graph comparing the values of k2 for the denoted samples on the VapB promoter. (D) The three-step sequential kinetic scheme that best accounts for all of the kinetic data is shown. The steps targeted by the transcription factors RbpA (red), RbpACD-BL-SID (green), or RbpABL-SID (blue) are denoted. Arrows pointing at the relevant parameter indicate an increase in that parameter in the presence of the factor (compared to Mbo holo alone) by the fold-amount shown below.
Figure 5
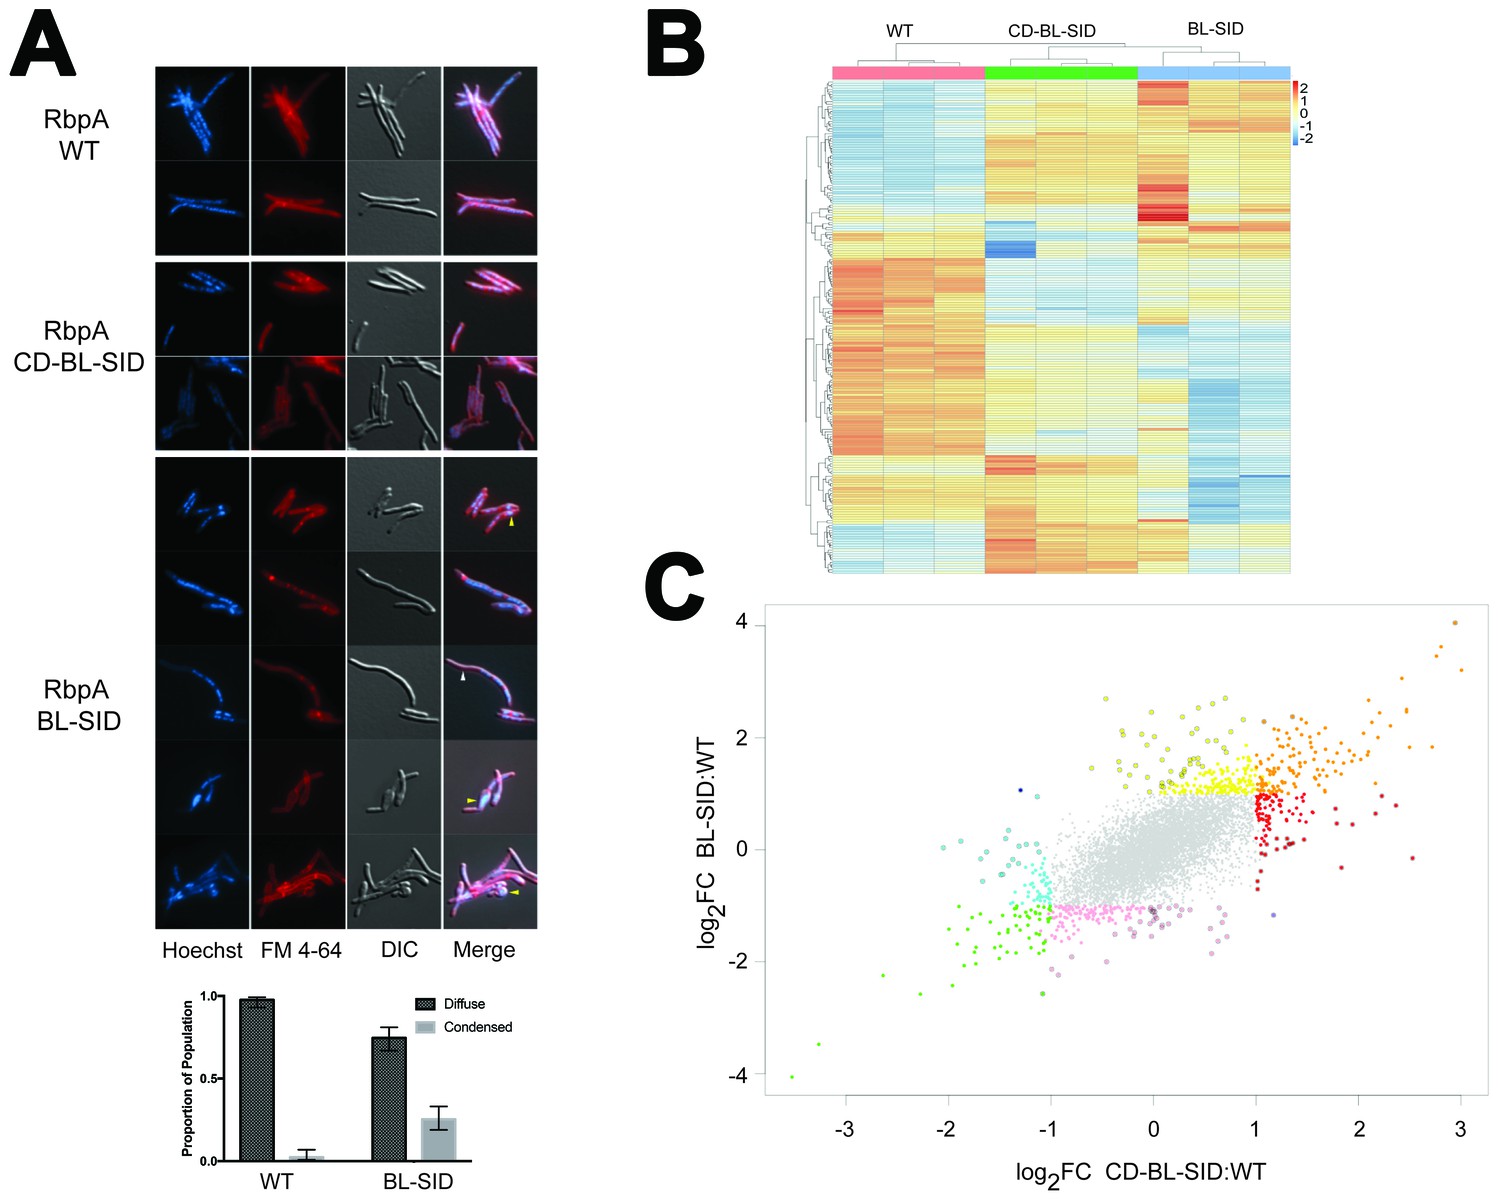
In vivo functions of RbpA NTT and CD.
(A) Morphologic effects of RbpA truncations. Msm expressing either RbpAwt, RbpACD-BL-SID, or RbpABL-SID were stained with Hoechst (DNA) and FM 4–64 (membranes), and viewed by both fluorescence illumination and DIC imaging. Representative images are shown. The yellow arrowheads indicate aberrant cell morphology with condensed nucleoid in the RbpABL-SID strain. The white arrowhead indicates an anucleate filament. Quantitation of nucleoid morphology in WT (n = 208) and RbpABL-SID (n = 248) cells is graphed below the image as described in the text. Error bars are 99% confidence interval and p<0.0001 by chi squared test. (B) Unsupervised clustering of RNA-seq gene expression data from triplicate RNA samples from cells expressing RbpAwt, RbpACD-BL-SID, or RbpABL-SID. The cluster was generated from the 200 genes with the greatest variance between strains. The strains are clustered across the top of the heat map and genes clustered to the left of the heat map. (C) Distinct gene expression signatures associated with RbpA domains. Scatterplot of gene expression comparing the log2 fold change of RbpACD-BL-SID (X axis), to RbpABL-SID (Y axis) each compared to wild type cells. All colored points represent genes with statistically significant differences in RNA level compared to WT (adjusted p<0.01) with a fold change of >2 (log2 FC of >1 or <-1). The genes are classified by color according to their expression pattern as follows: orange (overexpressed in both strains), green (underexpressed in both strains), yellow (overexpressed in BL-SID but not CD-BL-SID), pink (underexpressed in BL-SID but not CD-BL-SID), red (overexpressed in CD-BL-SID but not BL-SID), cyan (underexpressed in CD-BL-SID but not BL-SID). Points with dark outline indicate genes in which the difference in fold change between the two strains is two fold or greater. The single dark blue and purple points represent genes in which the difference between strains is >2 fold but in opposite direction. See Supplementary file 7 for gene lists corresponding to each color class.
Figure 6
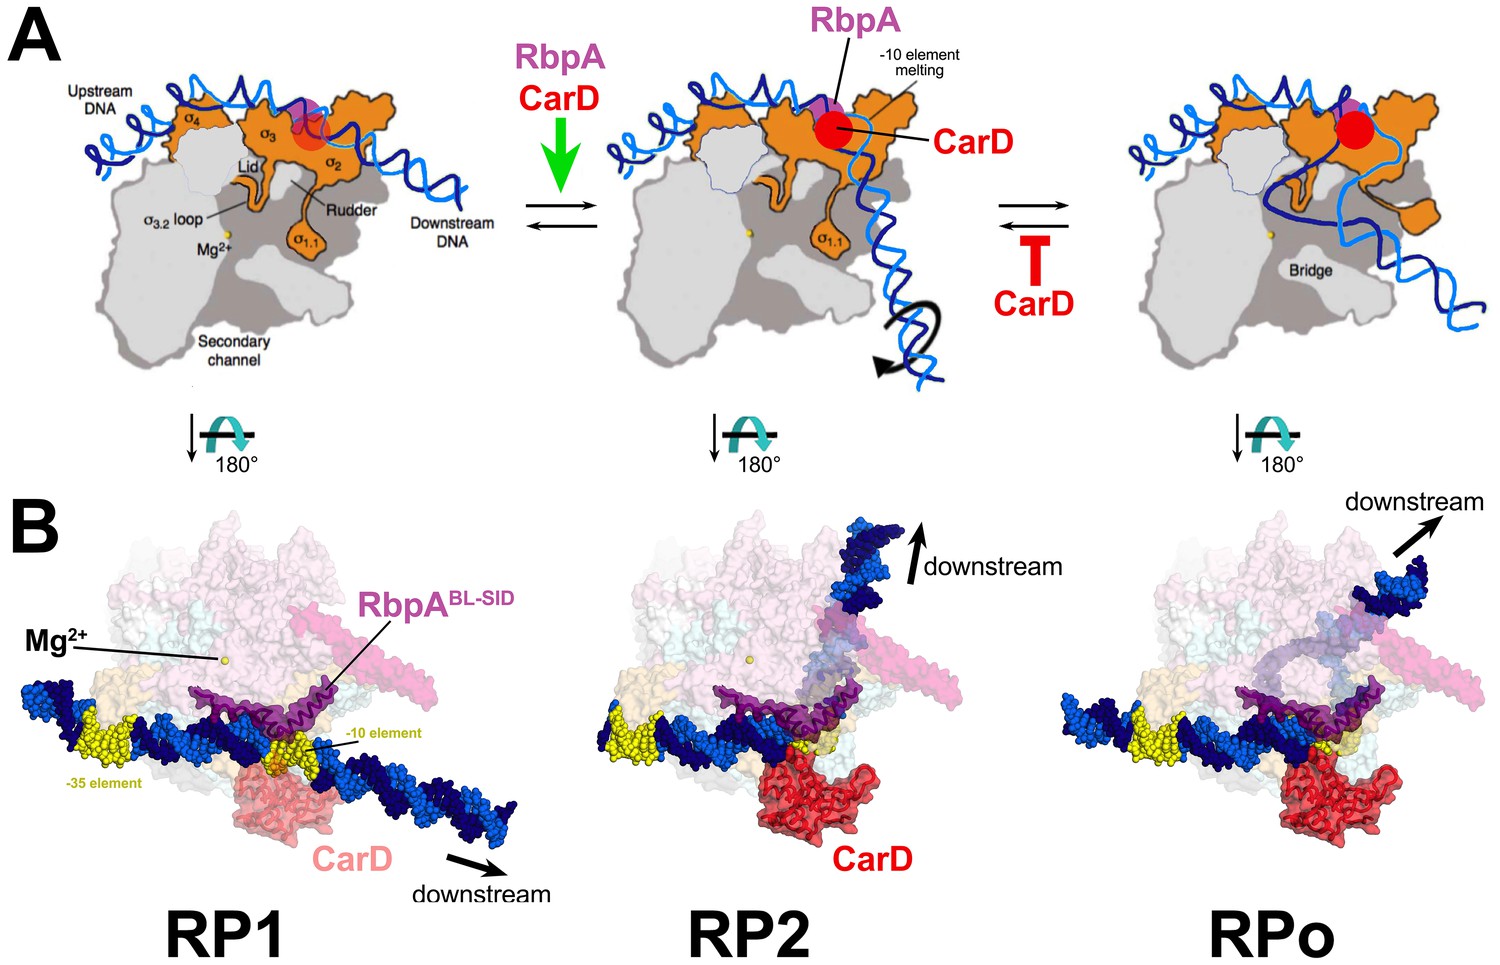
Structural transitions during the steps of RPo formation.
(A) Schematic, cross-sectional views of the RNAP holo (catalytic Mg2+, yellow sphere) and the promoter DNA (t-strand, dark blue; nt-strand, blue). RP1 and RP2 represent hypothetical models (Saecker et al., 2011). Crystal structures of RPo are available (Bae et al., 2015b; Zuo and Steitz, 2015). The important functional interaction of RbpA and CarD with the promoter DNA are schematically illustrated (RbpA, purple dot; CarD, red dot), based on the Msm RbpA/TIC structure (Figure 1). (B) Explicit structural models of the Msm RbpA/CarD/TIC with promoter DNA modeled as in the hypothetical models in (A). The RNAP is shown as a transparent molecular surface (color-coded as in Figure 1). RbpA and the modeled CarD (Figure 2D) are shown as transparent molecular surfaces with the backbone ribbon also shown. The −35 and −10 elements are colored yellow.
Appendix 1—figure 1
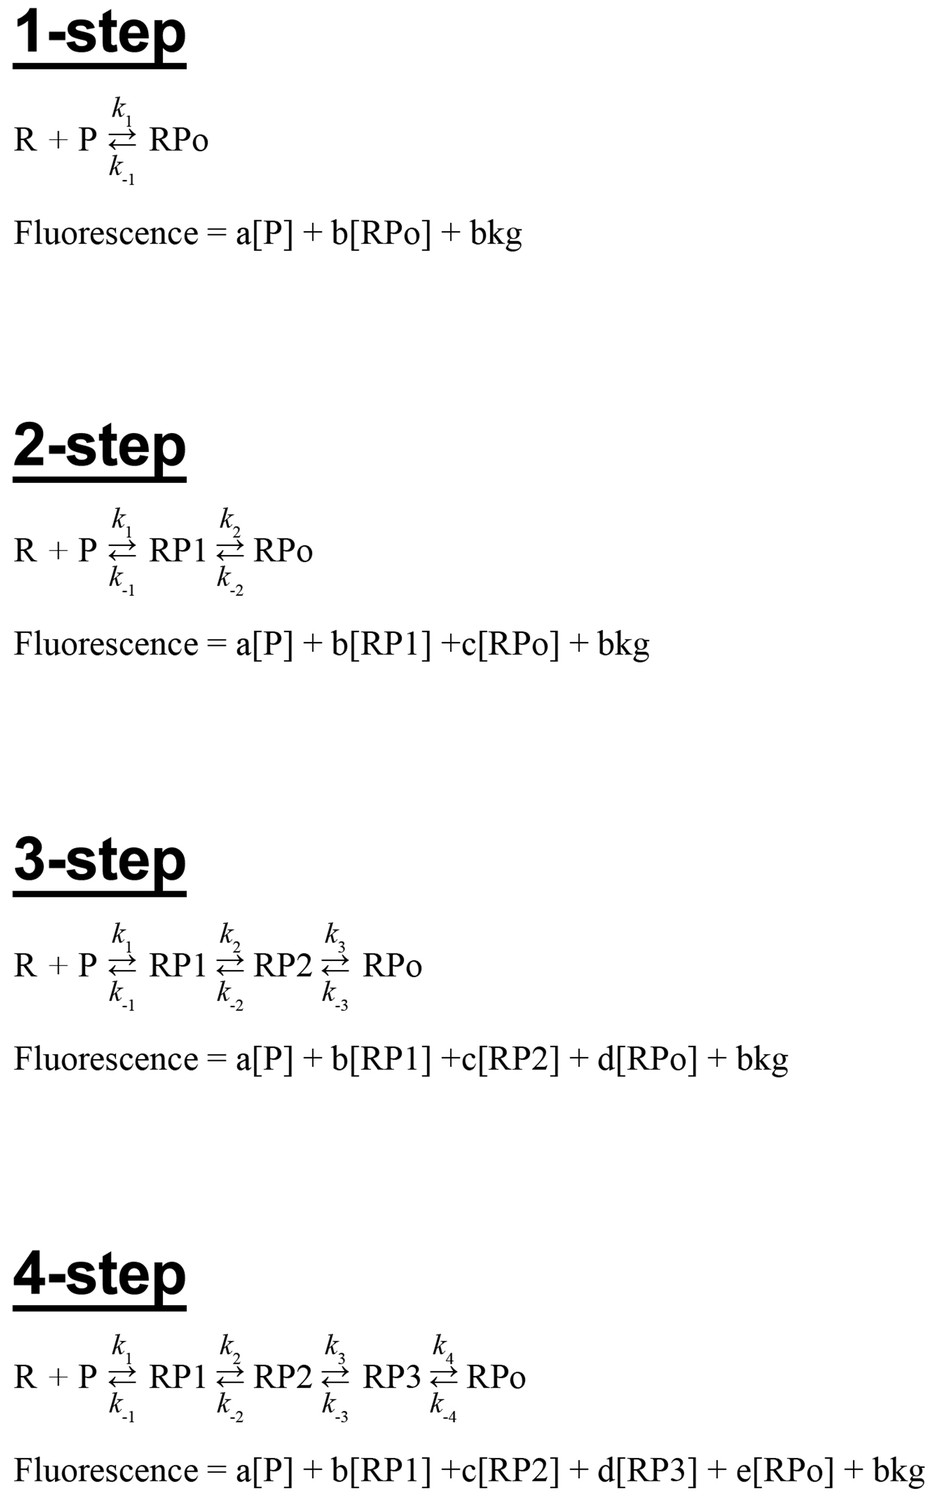
Kinetic mechanisms.
The four sequential kinetic mechanisms considered, along with the equations used to describe the fluorescence signal (the observable).
Appendix 1—figure 2
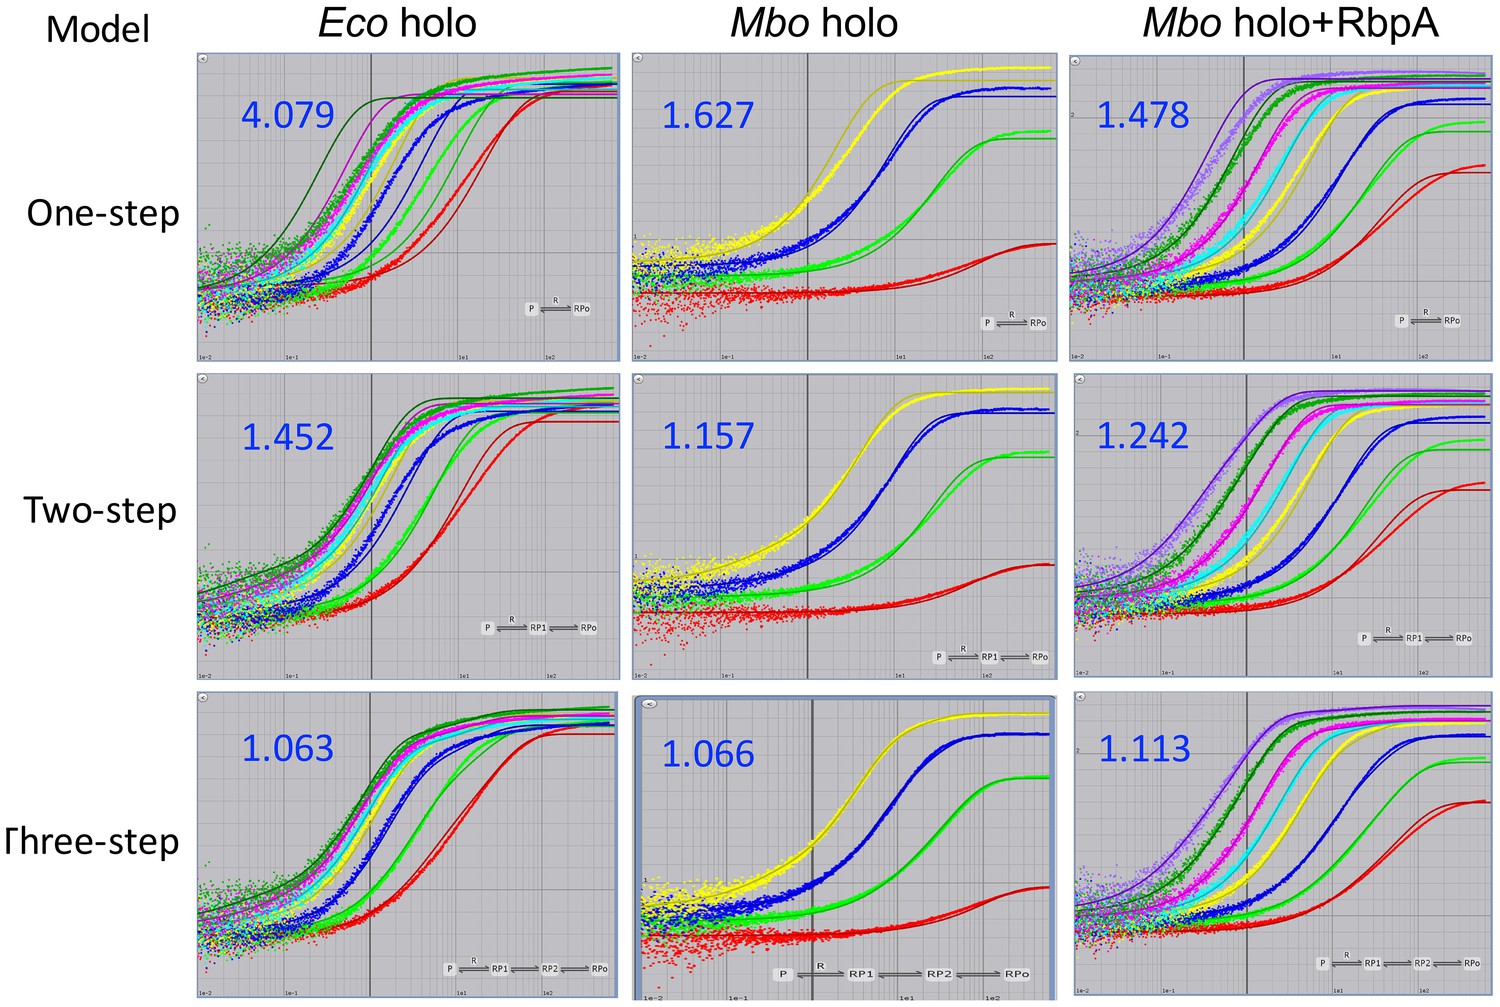
Fits of kinetic mechanisms to selected data.
Plots showing the fluorescence signal vs. time after mixing Eco holo (left column), Mbo holo (middle column), or Mbo holo+RbpA (right column) with 1 nM Cy3-AP3 promoter (Figure 3—figure supplement 1A) in a stopped flow fluorimeter. The experimental data are shown as points. The data were fit using the 1-step (top row), 2-step (middle row), or 3-step (bottom row) sequential kinetic scheme (Appendix –figure 1). The curve fits are shown as solid lines. The blue numbers show the χ2/DOF for each fit.
Appendix 1—figure 3
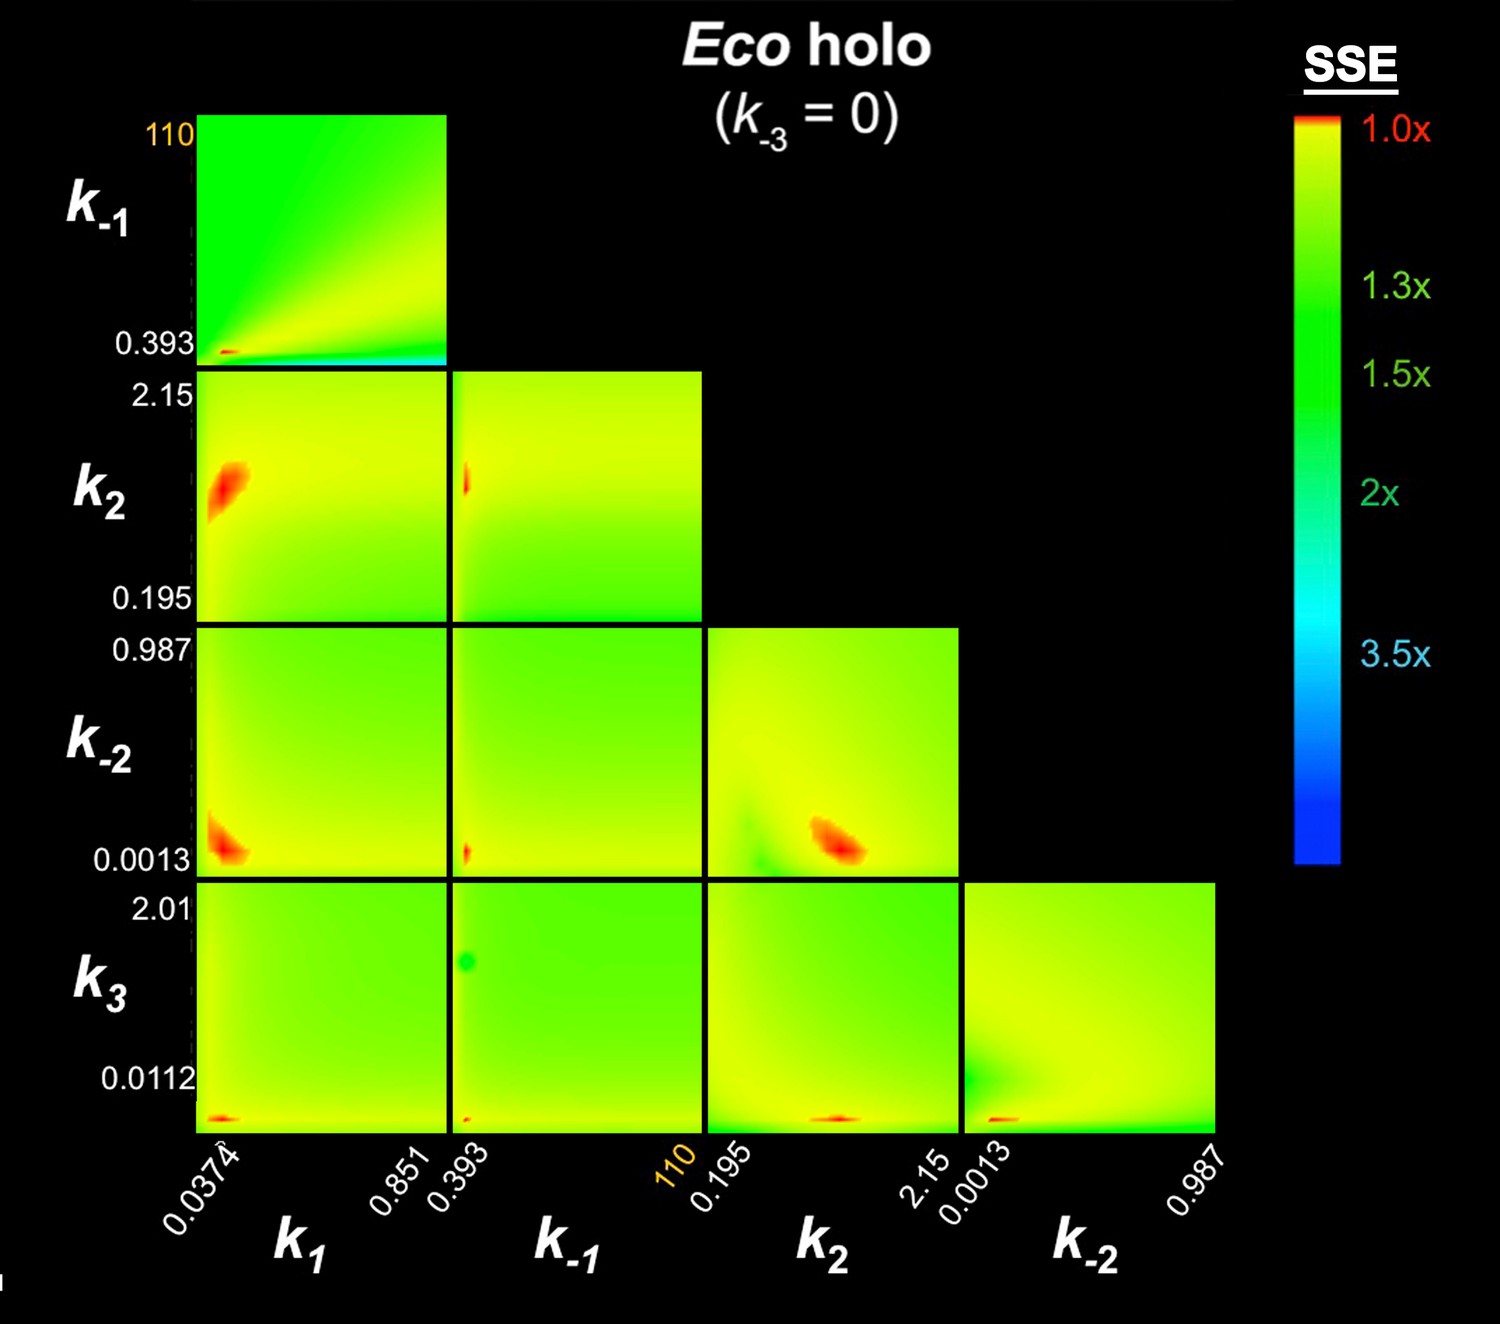
FitSpace calculation for Eco holo (k-3 = 0).
The results of the contour confidence analysis for Eco holo (parameters listed in Table 1) with k-3 fixed at 0. Each panel represents a grid where two kinetic parameters were varied systematically. For example, the upper left panel shows the result of systematically varying k1 from 3.74 × 10⁷ to 8.51 × 10⁸ M−1s−1 (x-axis) and k-1 from 0.393 to 110 s−1 (y-axis). At each point, the values of k1 and k-1 were fixed, then the other parameters (k2, k-2, k3) were refined against the data (the fluorescence progress curves; Figure 3A). The resulting sum squared error (SSE) is normalized by the minimum SSE (SSEmin) and plotted as a heat map. The minimum SSE (normalized by itself, so with a value of 1) is red in the heat map, higher SSE values are color-coded as shown. Each panel shows that the optimal pair of parameter values are restricted to a small red area, indicating the parmeters are constrained by the data.
Appendix 1—figure 4
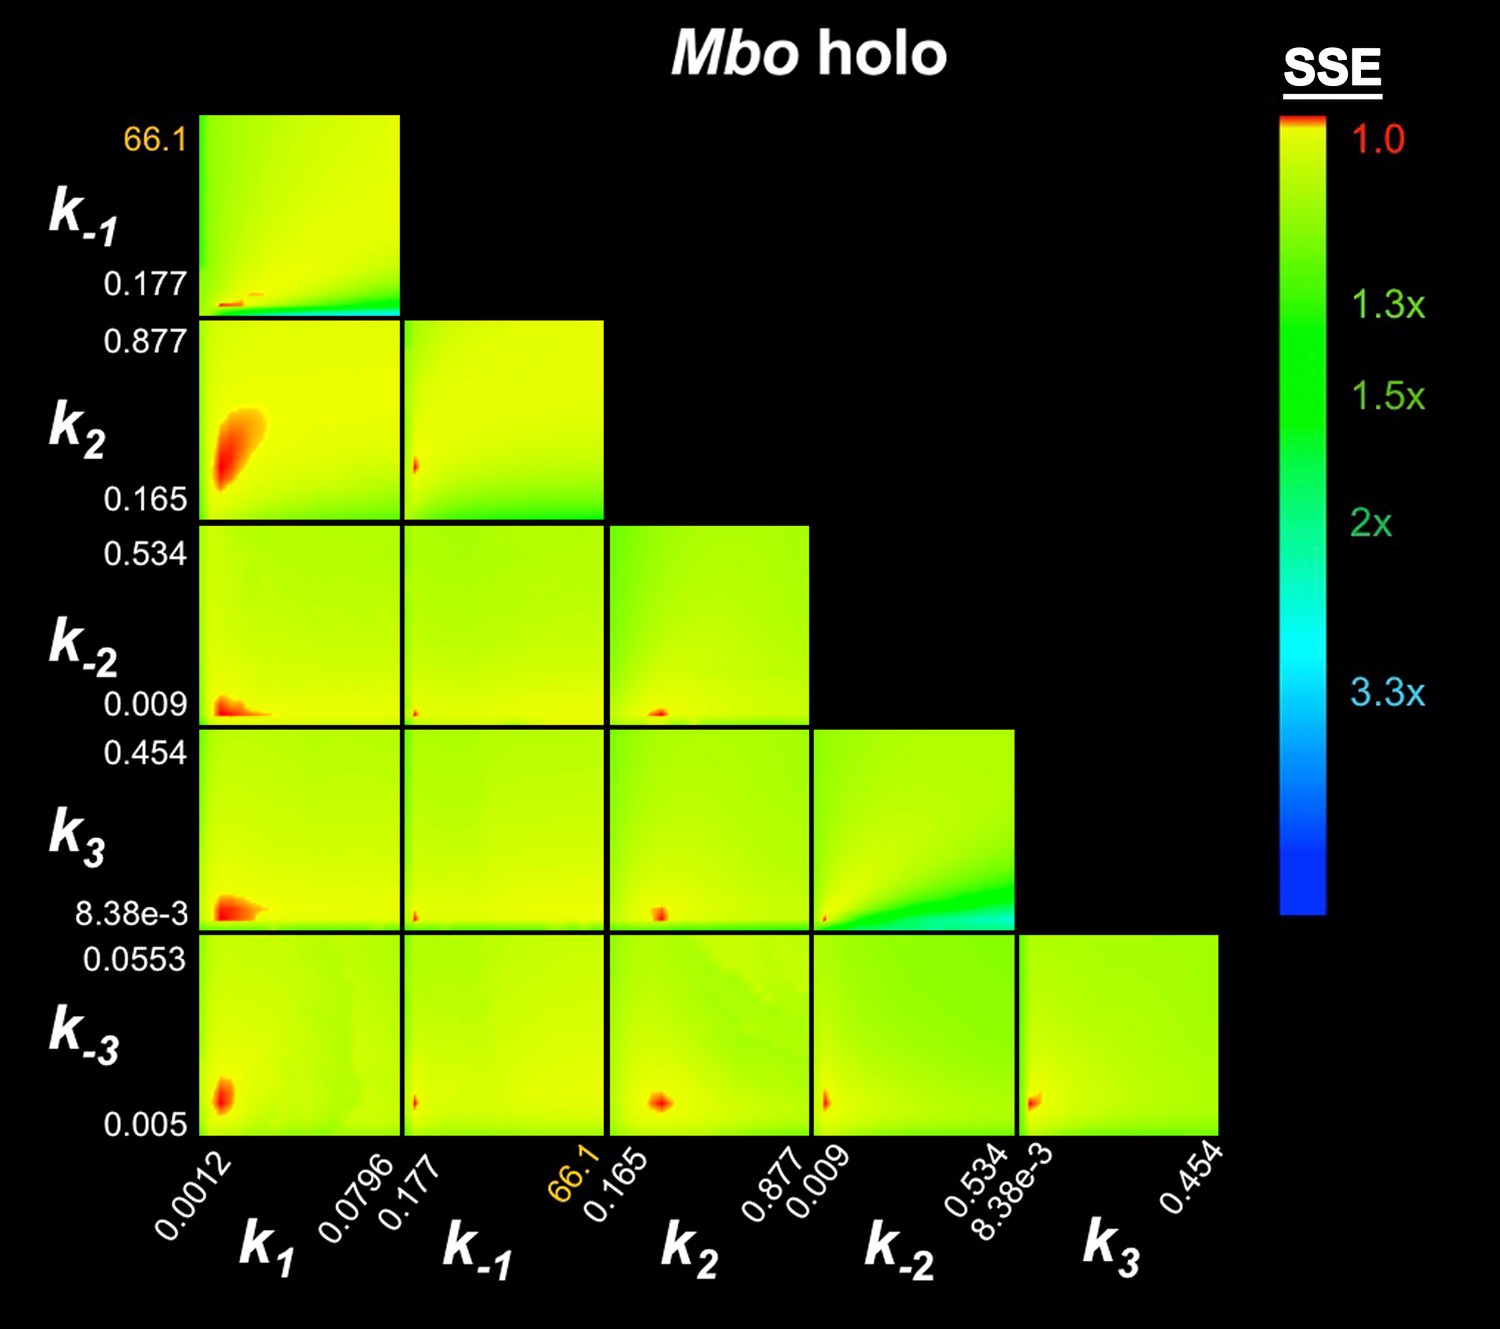
FitSpace calculation for Mbo holo.
https://doi.org/10.7554/eLife.22520.030
Appendix 1—figure 5
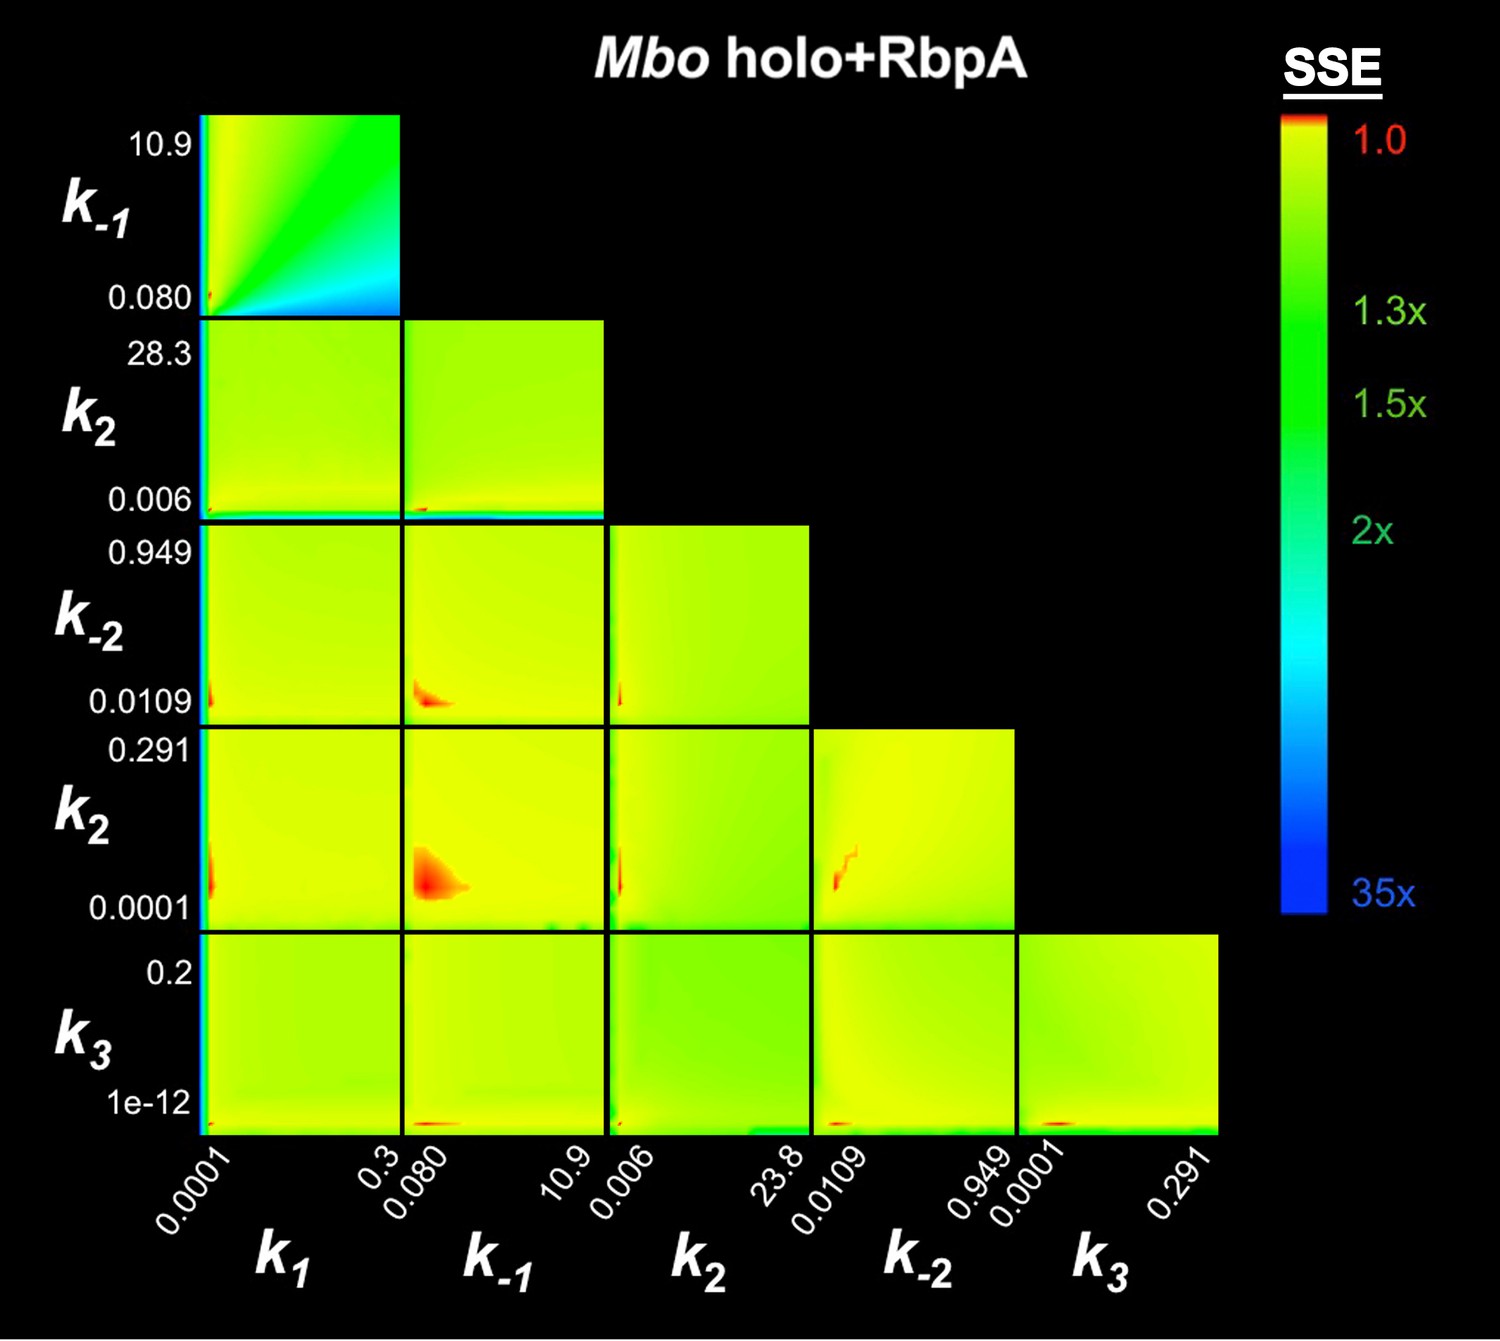
FitSpace calculation for Mbo holo+RbpA.
https://doi.org/10.7554/eLife.22520.031
Appendix 1—figure 6

FitSpace calculation for Mbo holo+CarD (k-3 = 2.3×10⁻³ s−1).
https://doi.org/10.7554/eLife.22520.032
Appendix 1—figure 7
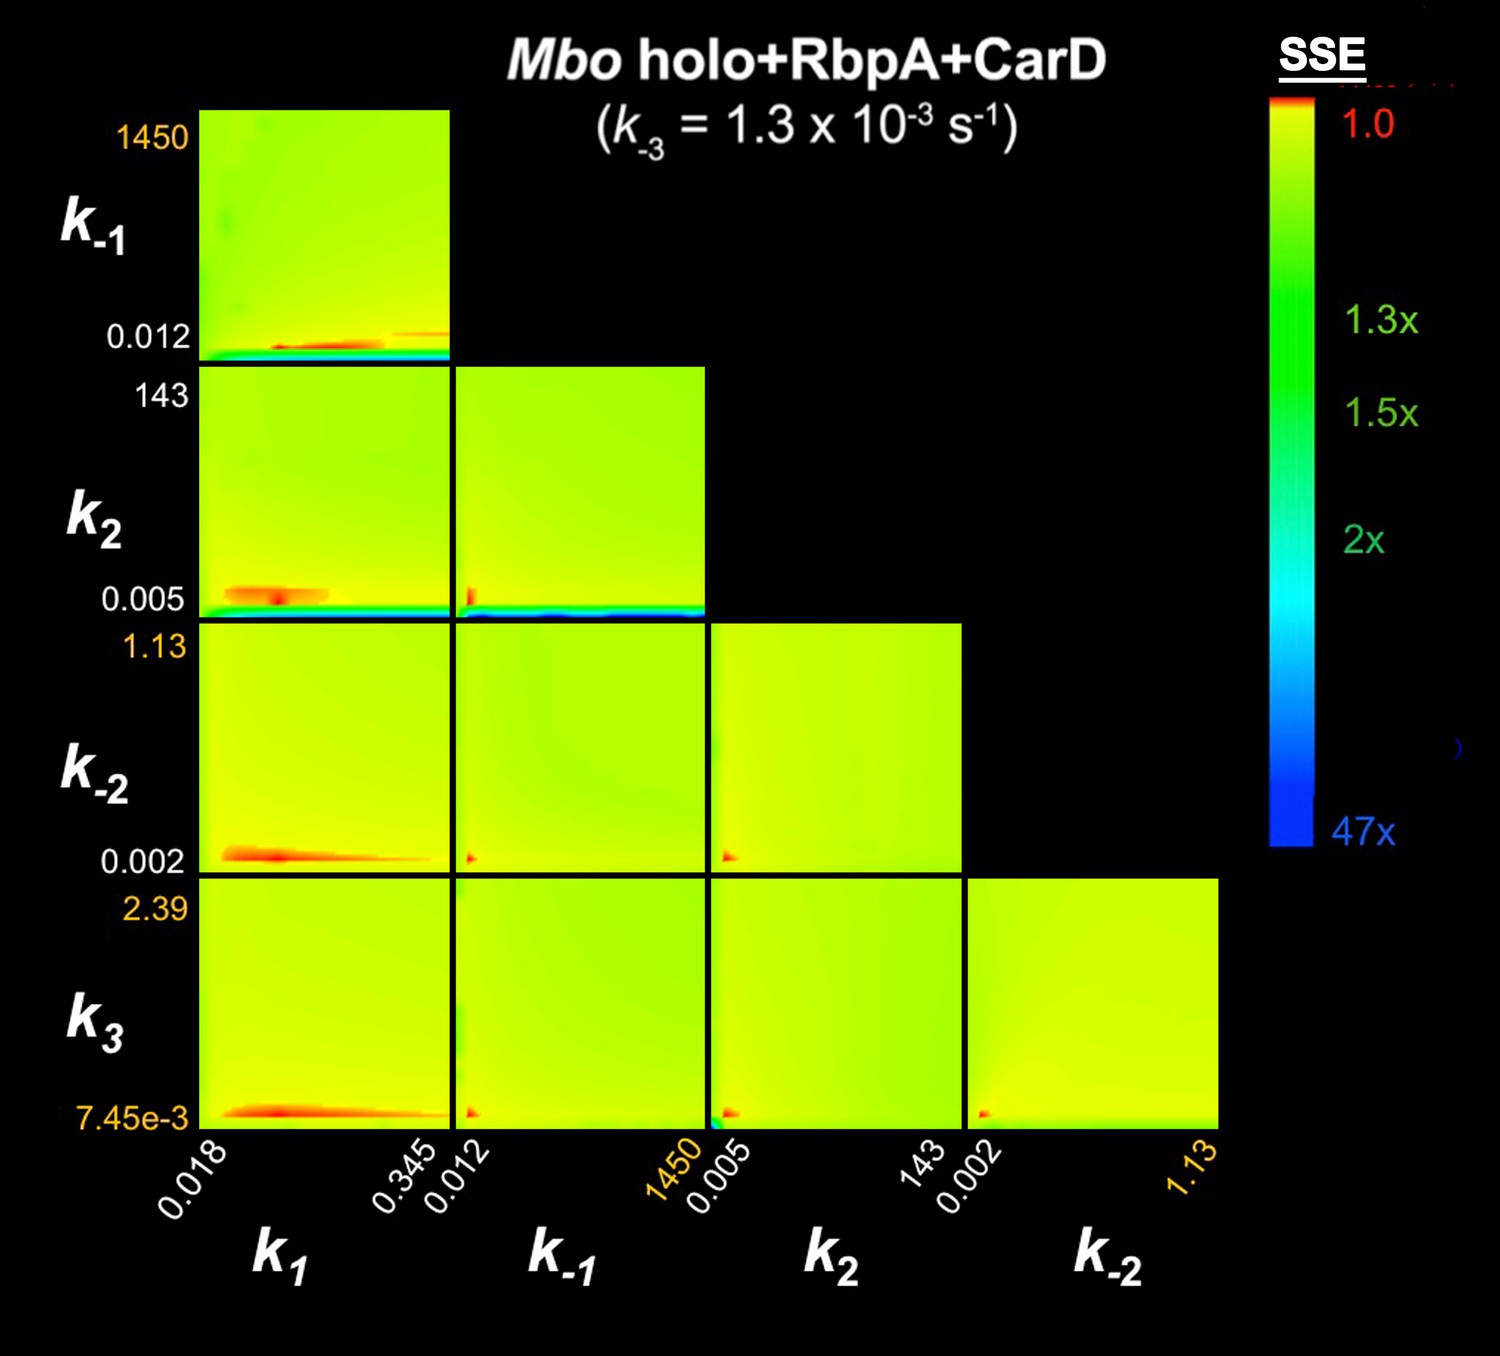
FitSpace calculation for Mbo holo+RbpA+CarD (k-3 = 1.3×10⁻³ s−1).
https://doi.org/10.7554/eLife.22520.033Tables
Table 1
Constrained kinetic parameters on the Mtb AP3 promoter. The fluorescence progress curves (Figure 3A–C, Figure 3—figure supplement 1B–C) were fit according to the 3-step sequential kinetic scheme:
RNAP | |||||
|---|---|---|---|---|---|
Mbo holo | Eco holo | ||||
parameter*** | +RbpA | + CarD | +CarD+RbpA | ||
n* | 5† | 4‡ | 2 | 2 | 1 |
k1 (M−1s−1) | 1.1 × 10⁷ | 1.7 × 10⁷ | 4.4 × 10⁷ | 1.2 × 10⁸ | 1.2 × 10⁸ |
k-1 (s−1) | 2.1 | 1.3 | 3.6 | 23 | 3.4 |
K1 (M−1)§ | 5.2 × 10⁶ | 1.3 × 10⁷ | 1.2 × 10⁷ | >5.2×10⁶ | >3.5×10⁷ |
k2 (s−1) | 0.36 | 1.3 | 3.5 | 9.2 | 1.2 |
k-2 (s−1) | 0.041 | 0.13 | 0.076 | 0.046 | 0.11 |
K2 | 8.8 | 10 | 46 | 200 | 11 |
k3 (s−1) | 0.035 | 0.082 | 0.066 | 0.11 | 0.083 |
k-3 (s−1) | 0.014 | 0.013 | 2.3 × 10⁻³ | 1.3 × 10⁻³ | 0 |
K3 | 2.5 | 6.3 | 29 | 85 | - |
K1K2K3 (M−1) | 1.2 × 10⁸ | 8.3 × 10⁸ | 1.6 × 10¹⁰ | 8.8 × 10¹⁰ | - |
kd (s−1)¶ | 6.3 × 10⁻³ | 7.1 × 10⁻³ | 1.2 × 10⁻³ | 3.7 × 10⁻⁴ | - |
t1/2 (min)¶ | 1.8 | 1.6 | 9.9 | 31 | - |
t1/2exp (min)** | ~2 | ~1.5 | ~10 | ~30 | >>60 |
-
Color coding:
-
Grey: 5–10-fold > Mbo holo; Pink: 5–10-fold < Mbo holo
-
Green: > 10 fold over Mbo holo; Red: more than 10-fold < Mbo holo
-
Bold text denotes that that parameter was fixed during the refinement (see Appendix).
-
***Because the independent trials for each sample were analyzed together, we could not calculate errors in the fitted parameters across trials. The standard errors from the fits are likely to be underestimates of the errors (Johnson et al., 2009a; 2009b). Therefore, Table 1 does not report errors in the fitted parameters and we presume the errors are around 10–15%, as seen in the unconstrained analysis (Supplementary file 4).
-
*Number of independent trials.
-
†Includes three association series (Figure 3B), one dissociation experiment (Figure 3—figure supplement 1D), and the 2-AP experiment (Figure 3E).
-
‡Includes three association series (Figure 3—figure supplement 1B) and one dissociation experiment (Figure 3—figure supplement 1E).
-
§The values for K1, K2, and K3 were calculated from the fitted parameters: K1 = k1/k-1, K2 = k2/k-2, K3=k3/k-3.
-
¶The value for kd, the dissociation rate for RPo, was calculated using equation (17) of Tsodikov and Record (1999):
-
(2)
-
The value for t1/2 was calculated as t1/2 = ln(2)/kd.
-
**The experimental half-life (t1/2exp) was determined from promoter lifetime experiments (Figure 2C).
Appendix 1—table 1
Kinetic model determination for Mbo holo on the Cy3-AP3 promoter.
Mbo holo** | ||||
|---|---|---|---|---|
Model* | 1-step | 2-step | 3-step | 4-step |
k1 (M−1s−1) | (1.1 ± 0.4) x 106 | (7.8 ± 1.2) x 106 | (9.5 ± 1.3) x 106 | (9.9 ± 1.7) x 106 |
k-1 (s−1) | (6.0 ± 2.2) x 10−3 | 2.0 ± 0.2 | 2.0 ± 0.2 | 1.6 ± 0.3 |
K1 (M−1) | (1.8 ± 0.9) x 108 | (3.9 ± 0.7) x 106 | (4.8 ± 0.8) x 106 | (6.2 ± 1.6) x 106 |
k2 (s−1) | 0.37 ± 0.02 | 0.40 ± 0.02 | 0.3 ± 0.07 | |
k-2 (s−1) | (9.5 ± 2.3) x 10−3 | 0.058 ± 0.007 | 0.097 ± 0.021 | |
K2 | 39 ± 10 | 6.9 ± 0.9 | 3.1 ± 1.0 | |
k3 (s−1) | 0.057 ± 0.011 | 0.21 ± 0.16 | ||
k-3 (s−1) | 0.015 ± 0.004 | 2.2 ± 11.5 | ||
K3 | 3.8 ± 1.3 | 0.095 ± 0.504 | ||
k4 (s−1) | 3.8 ± 25.5 | |||
k-4 (s−1) | 0.048 ± 0.105 | |||
K4 | 0.025 ± 0.215 | |||
χ2/DOF | 1.62744 | 1.15668 | 1.06622 | 1.06737 |
kd† | 6.0 × 10⁻³ | 9.4 × 10⁻³ | 6.6 × 10⁻³ | 6.0 × 10⁻³ |
t1/2 (min) | 1.9 | 1.2 | 1.7 | 1.9 |
t1/2exp (min)‡ | ~2 | |||
a | 0.48 | 0.55 | 0.30 | 0.65 |
b | 1.3 | 0.81 | 0.51 | 0.83 |
c | 1.4 | 1.2 | 1.8 | |
d | 1.2 | 0.026 | ||
e | 1.5 | |||
bkg | 1.3 | 0.16 | 0.41 | 0.064 |
-
**The errors listed are the standard errors from the global fit as reported by Kintek Global Kinetic Explorer (Johnson et al., 2009a).
-
†For the 1-step, 2-step, and 3-step models, the value for kd, the dissociation rate for RPo, was calculated using equation (17) of (Tsodikov and Record, 1999):
-
(2)
-
For the 1-step model, K2 = K3 = 0, k-2 = k-3 = ∞; for the 2-step model, K3 = 0, k-3 = ∞. For the 4-step model, dissociation was simulated and the result was fit to a single exponential decay to derive kd. The value for t1/2 was calculated as t1/2 = ln(2)/kd.
-
‡The experimental half-life (t1/2exp) was determined from promoter lifetime experiments (Figure 2C).
Appendix 1—table 2
Kinetic model determination for Mbo holo+RbpA on the Cy3-AP3 promoter.
Mbo holo+RbpA** | ||||
|---|---|---|---|---|
Model* | 1-step | 2-step | 3-step | 4-step |
k1 (M−1s−1) | (6.4 ± 0.3) x 106 | (1.2 ± 0.1) x 107 | (1.5 ± 0.1) x 107 | (1.6 ± 0.1) x 107 |
k-1 (s−1) | (6.5 ± 1.1) x 10−3 | 0.80 ± 0.07 | 1.1 ± 0.1 | 0.88 ± 0.09 |
K1 (M−1) | (9.9 ± 1.7) x 108 | (1.5 ± 0.2) x 107 | (1.4 ± 0.2) x 107 | (1.8 ± 0.2) x 107 |
k2 (s−1) | 1.1 ± 0.1 | 1.4 ± 0.1 | 0.81 ± 0.08 | |
k-2 (s−1) | 0.017 ± 0.002 | 0.090 ± 0.020 | 0.062 ± 0.030 | |
K2 | 65 ± 10 | 16 ± 4 | 13 ± 6 | |
k3 (s−1) | 0.046 ± 0.015 | 0.59 ± 0.75 | ||
k-3 (s−1) | 0.011 ± 0.004 | 1.6 ± 0.7 | ||
K3 | 4.2 ± 2.0 | 0.37 ± 0.50 | ||
k4 (s−1) | 0.091 ± 0.193 | |||
k-4 (s−1) | (9.9 ± 14) x 10−3 | |||
K4 | 4.1 ± 10.2 | |||
χ2/DOF | 1.47786 | 1.24241 | 1.11268 | 1.10116 |
kd† | 6.4 × 10⁻³ | 0.016 | 6.4 × 10⁻³ | 3.6 × 10⁻³ |
t1/2 (min) | 1.8 | 0.71 | 1.8 | 3.2 |
t1/2exp (min)‡ | ~1.5 | |||
a | 0.099 | 0.038 | 0.16 | 0.65 |
b | 1.2 | 0.70 | 0.68 | 0.83 |
c | 1.1 | 1.3 | 1.8 | |
d | 1.3 | 0.026 | ||
e | 1.5 | |||
bkg | 0.81 | 0.86 | 0.74 | 0.064 |
-
**The errors listed are the standard errors from the global fit as reported by Kintek Global Kinetic Explorer (Johnson et al., 2009a).
-
†TT For the 1-step, 2-step, and 3-step models, the value for kd, the dissociation rate for RPo, was calculated using equation (17) of (Tsodikov and Record, 1999):
-
(2)
-
For the 1-step model, K2 = K3 = 0, k-2 = k-3 = ∞; for the 2-step model, K3 = 0, k-3 = ∞. For the 4-step model, dissociation was simulated and the result was fit to a single exponential decay to derive kd. The value for t1/2 was calculated as t1/2 = ln(2)/kd.
-
‡The experimental half-life (t1/2exp) was determined from promoter lifetime experiments (Figure 2C).
Appendix 1—table 3
Kinetic model determination for Mbo holo+CarD on the Cy3-AP3 promoter.
Mbo holo+CarD** | ||||
|---|---|---|---|---|
Model* | 1-step | 2-step | 3-step | 4-step |
k1 (M−1s−1) | (1.3 ± 0.1) x 107 | (5.4 ± 0.4) x 107 | (5.8 ± 0.5) x 107 | (3.8 ± 0.3) x 107 |
k-1 (s−1) | (3.2 ± 1.4) x 10−3 | 10 ± 1 | 6.2 ± 1.0 | 1.4 ± 0.2 |
K1 (M−1) | (4.1 ± 1.8) x 109 | (5.4 ± 0.7) x 106 | (9.4 ± 1.7) x 106 | (2.7 ± 0.4) x 107 |
k2 (s−1) | 4.0 ± 0.3 | 3.1 ± 0.2 | 1.1 ± 0.2 | |
k-2 (s−1) | (2.7 ± 1.8) x 10−3 | 0.067 ± 0.019 | 0.049 ± 0.024 | |
K2 | 1500 ± 99 | 46 ± 14 | 22 ± 12 | |
k3 (s−1) | 0.074 ± 0.027 | 0.72 ± 0.41 | ||
k-3 (s−1) | (2.5 ± 3.0) x 10−3 | 1.4 ± 0.4 | ||
K3 | 30 ± 37 | 0.51 ± 0.32 | ||
k4 (s−1) | 0.11 ± 0.06 | |||
k-4 (s−1) | (3.9 ± 5.3) x 10−3 | |||
K4 | 4.7 ± 3.9 | |||
χ2/DOF | 1.34903 | 1.22448 | 1.10877 | 1.1021 |
kd† | 3.2 × 10⁻³ | 2.6 × 10⁻³ | 1.1 × 10⁻³ | 1.2 × 10⁻³ |
t1/2 (min) | 3.6 | 4.3 | 10 | 9.6 |
t1/2exp (min)‡ | ~10 | |||
a | 0.50 | 0.56 | 0.28 | 0.80 |
b | 1.5 | 0.75 | 0.45 | 1.1 |
c | 1.5 | 1.2 | 2.6 | |
d | 1.2 | 5.3 × 10⁻⁵ | ||
e | 1.8 | |||
bkg | 0.31 | 0.24 | 0.52 | 2.9 × 10⁻³ |
-
**The errors listed are the standard errors from the global fit as reported by Kintek Global Kinetic Explorer (Johnson et al., 2009a).
-
†For the 1-step, 2-step, and 3-step models, the value for kd, the dissociation rate for RPo, was calculated using equation (17) of Tsodikov and Record (1999):
-
(2)
-
For the 1-step model, K2 = K3 = 0, k-2 = k-3 = ∞; for the 2-step model, K3 = 0, k-3 = ∞. For the 4-step model, dissociation was simulated and the result was fit to a single exponential decay to derive kd. The value for t1/2 was calculated as t1/2 = ln(2)/kd.
-
‡The experimental half-life (t1/2exp) was determined from promoter lifetime experiments (Figure 2C).
Appendix 1—table 4
Kinetic model determination for Mbo holo+RbpA+CarD on the Cy3-AP3 promoter.
Mbo holo+RbpA+CarD** | ||||
|---|---|---|---|---|
Model* | 1-step | 2-step | 3-step | 4-step |
k1 (M−1s−1) | (2.7 ± 0.1) x 107 | (1.2 ± 0.2) x 108 | (1.1 ± 0.2) x 108 | (5.4 ± 0.3) x 107 |
k-1 (s−1) | (6.1 ± 1.5) x 10−3 | 27 ± 5 | 20 ± 5 | 2.0 ± 0.4 |
K1 (M−1) | (4.4 ± 1.1) x 109 | (4.4 ± 1.1) x 106 | (5.5 ± 1.7) x 106 | (2.7 ± 0.6) x 107 |
k2 (s−1) | 9.6 ± 0.4 | 9.7 ± 0.5 | 3.9 ± 0.5 | |
k-2 (s−1) | 1.1 × 10⁻⁷ | 0.031 ± 0.011 | 0.11 ± 0.43 | |
K2 | 8.7 × 10⁷ | 310 ± 11 | 35 ± 140 | |
k3 (s−1) | 0.13 ± 0.03 | 11 ± 34 | ||
k-3 (s−1) | (1.3 ± 8.2) x 10−3 | 9.0 ± 30 | ||
K3 | 100 ± 63 | 1.2 ± 5.6 | ||
k4 (s−1) | 0.16 ± 0.42 | |||
k-4 (s−1) | (2.9 ± 3800) x 106 | |||
K4 | 7.6 ± 40 | |||
χ2/DOF | 1.32367 | 1.09473 | 1.05035 | 1.0458 |
kd† | 6.1 × 10⁻³ | 1.1 × 10⁻⁷ | 2.5 × 10⁻⁴ | 4.3 × 10⁻⁷ |
t1/2 (min) | 1.9 | 1.1 × 10⁵ | 47 | 2.7 × 10⁴ |
t1/2exp (min)‡ | ~30 | |||
a | 0.59 | 0.63 | 0.28 | 0.91 |
b | 1.7 | 0.63 | 0.28 | 0.95 |
c | 1.6 | 1.2 | 4.2 | |
d | 1.3 | 5.7 × 10⁻⁶ | ||
e | 1.9 | |||
bkg | 0.34 | 0.28 | 0.63 | 1.1 × 10⁻⁶ |
-
**The errors listed are the standard errors from the global fit as reported by Kintek Global Kinetic Explorer (Johnson et al., 2009a).
-
†For the 1-step, 2-step, and 3-step models, the value for kd, the dissociation rate for RPo, was calculated using equation (17) of Tsodikov and Record (1999):
-
(2)
-
For the 1-step model, K2 = K3 = 0, k-2 = k-3 = ∞; for the 2-step model, K3 = 0, k-3 = ∞. For the 4-step model, dissociation was simulated and the result was fit to a single exponential decay to derive kd. The value for t1/2 was calculated as t1/2 = ln(2)/kd.
-
c‡The experimental half-life (t1/2exp) was determined from promoter lifetime experiments (Figure 2C).
Appendix 1—table 5
Kinetic model determination for Eco holo on the Cy3-AP3 promoter.
Eco holo** | ||||
|---|---|---|---|---|
Model* | 1-step | 2-step | 3-step | 4-step |
k1 (M−1s−1) | (9.9 ± 0.7) x 106 | (1.2 ± 0.1) x 108 | (1.2 ± 0.1) x 108 | (8.5 ± 0.6) x 107 |
k-1 (s−1) | (2.7 ± 2.2) x 10−3 | 4.6 ± 0.7 | 3.4 ± 0.5 | 1.1 ± 0.1 |
K1 (M−1) | (3.7 ± 3.0) x 109 | (2.6 ± 0.5) x 107 | (3.5 ± 0.6) x 107 | (7.7 ± 0.9) x 107 |
k2 (s−1) | 1.0 ± 0.01 | 1.2 ± 0.03 | 0.39 ± 0.04 | |
k-2 (s−1) | ~ 0 | 0.11 ± 0.01 | 0.024 ± 0.023 | |
K2 | - | 11 ± 1 | 16 ± 16 | |
k3 (s−1) | 0.083 ± 0.015 | 0.66 ± 0.25 | ||
k-3 (s−1) | ~ 0 | 0.65 ± 0.19 | ||
K3 | - | 1.0 ± 0.5 | ||
k4 (s−1) | 0.048 ± 0.119 | |||
k-4 (s−1) | ~ 0 | |||
K4 | - | |||
χ2/DOF | 4.07941 | 1.45273 | 1.0631 | 1.04588 |
kd† | 2.7 × 10⁻³ | ~ 0 | ~ 0 | ~ 0 |
t1/2 (min) | 4.3 | - | - | - |
t1/2exp (min)‡ | >>60 | |||
a | 0.53 | 0.55 | 0.52 | 0.60 |
b | 1.5 | 0.81 | 0.62 | 0.72 |
c | 1.4 | 1.4 | 2.9 | |
d | 1.4 | 6.1 × 10⁻⁴ | ||
e | 1.5 | |||
bkg | 0.32 | 0.16 | 0.28 | 0.20 |
-
**The errors listed are the standard errors from the global fit as reported by Kintek Global Kinetic Explorer (Johnson et al., 2009a).
-
†For the 1-step, 2-step, and 3-step models, the value for kd, the dissociation rate for RPo, was calculated using equation (17) of Tsodikov and Record (1999):
-
(2)
-
For the 1-step model, K2 = K3 = 0, k-2 = k-3 = ∞; for the 2-step model, K3 = 0, k-3 = ∞. For the 4-step model, dissociation was simulated and the result was fit to a single exponential decay to derive kd. The value for t1/2 was calculated as t1/2 = ln(2)/kd.
-
‡The experimental half-life (t1/2exp) was determined from promoter lifetime experiments (Figure 2C).
Additional files
-
Supplementary file 1
Table showing sequence identity of Msm, Mtb, and Mbo transcription initiation proteins.
- https://doi.org/10.7554/eLife.22520.012
-
Supplementary file 2
Table of crystallographic statistics for the Msm RbpA/TIC crystals.
- https://doi.org/10.7554/eLife.22520.013
-
Supplementary file 3
Table of conditions for kinetic experiments with the Cy3-AP3 promoter.
- https://doi.org/10.7554/eLife.22520.014
-
Supplementary file 4
Table of unconstrained kinetic parameters on the Mtb AP3 promoter.
- https://doi.org/10.7554/eLife.22520.015
-
Supplementary file 5
Table of conditions for kinetic experiments with the Cy3-VapB promoter.
- https://doi.org/10.7554/eLife.22520.016
-
Supplementary file 6
Table comparing kinetic parameters for Mbo holo and Eco holo on AP3 vs.
VapB promoters.
- https://doi.org/10.7554/eLife.22520.017
-
Supplementary file 7
Excel file listing transcripts identified from the RNA-seq data as well as gene lists corresopnding to the different colored datapoints in Figure 5B).
- https://doi.org/10.7554/eLife.22520.018
-
Supplementary file 8
Table of kinetic parameters on the Mtb VapB promoter.
- https://doi.org/10.7554/eLife.22520.019
-
Supplementary file 9
Msm strains and oligos used in this study.
(A) Table of Msm strains used in this study. (B) Table of oligos used in generating Msm strains.
- https://doi.org/10.7554/eLife.22520.020
-
Supplementary file 10
Table of plasmids used in generating Msm strains.
- https://doi.org/10.7554/eLife.22520.021
Download links
A two-part list of links to download the article, or parts of the article, in various formats.
Downloads (link to download the article as PDF)
Open citations (links to open the citations from this article in various online reference manager services)
Cite this article (links to download the citations from this article in formats compatible with various reference manager tools)
Structure and function of the mycobacterial transcription initiation complex with the essential regulator RbpA
eLife 6:e22520.
https://doi.org/10.7554/eLife.22520


