Inhibitory peptidergic modulation of C. elegans serotonin neurons is gated by T-type calcium channels
- The Helen L. and Martin S. Kimmel Center for Biology and Medicine, Department of Cell Biology, NYU Langone School of Medicine, United States
Figures
Figure 1 with 2 supplements
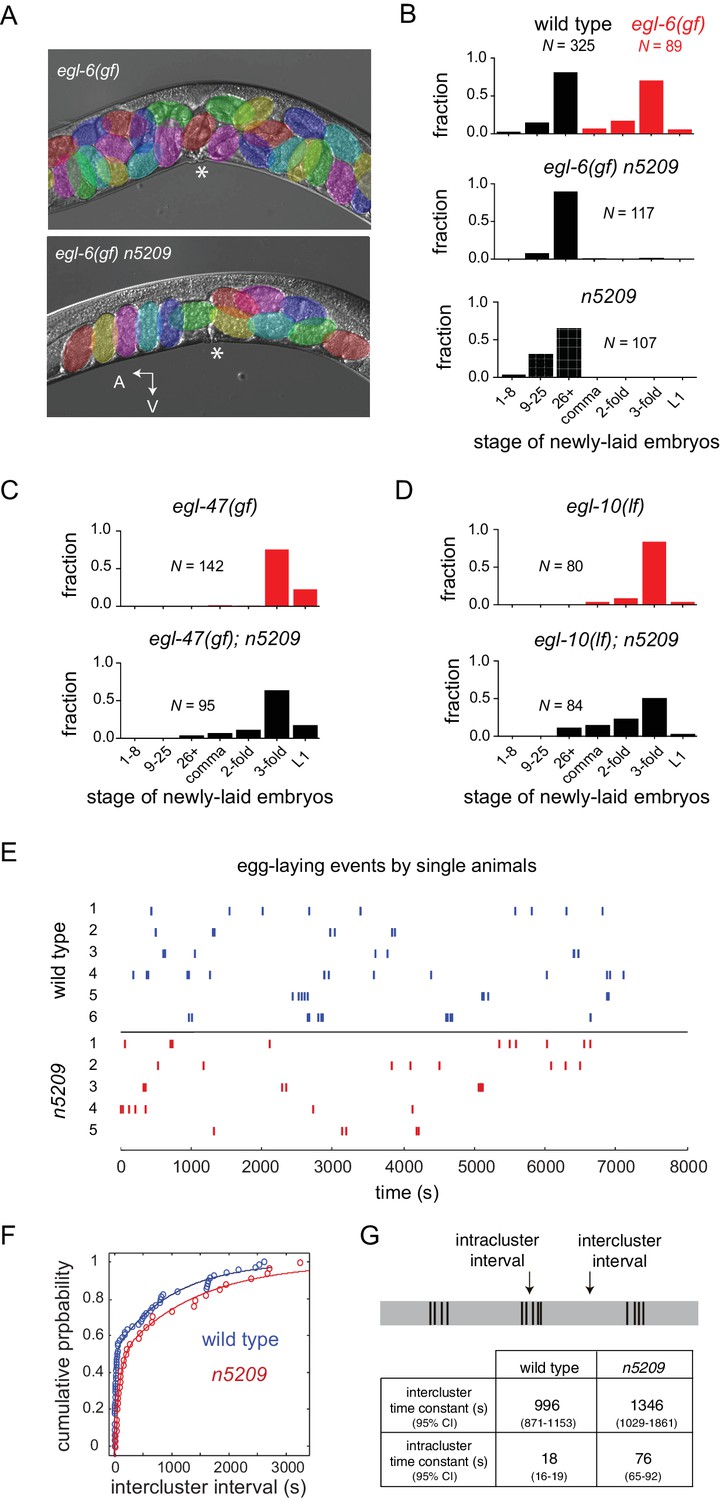
The n5209 mutation is a potent and specific suppressor of inhibitory neuropeptide signaling.
(A) Micrograph of egl-6(gf) and egl-6(gf) n5209 animals. Eggs are colored for emphasis. Asterisk indicates vulva. (B) Distribution of the developmental stages of eggs laid by wild type, egl-6(gf), egl-6(gf) n5209, and n5209 animals. C and D) n5209 has little effect on egl-47(gf) or egl-10(lf). Shown are distributions of the developmental stages of eggs laid by egl-47(gf) and egl-10(lf) mutants with and without the n5209 allele. (E) Raster plots of egg-laying events for wild type animals (blue) and n5209 animals (red). Single animals were tracked for two hours. Each egg-laying event is represented by a hash mark. (F) Cumulative probability plots of wild type (blue) and n5209 (red) intercluster intervals fit to the model described by Waggoner et al. (1998). (G) Time constants computed from the same model. 95% confidence interval is in parentheses. Connectivity of the egg-laying neuromusculature is depicted in Figure 1—figure supplement 1, and the data from 1F are replotted as a histogram of the natural log of interval times in Figure 1—figure supplement 2.
-
Figure 1—source data 1
Raw data of developmental stage of newly laid embryos from Figure 1.
- https://doi.org/10.7554/eLife.22771.003
-
Figure 1—source data 2
Time of egg-laying event during tracking.
- https://doi.org/10.7554/eLife.22771.004
Figure 1—figure supplement 1
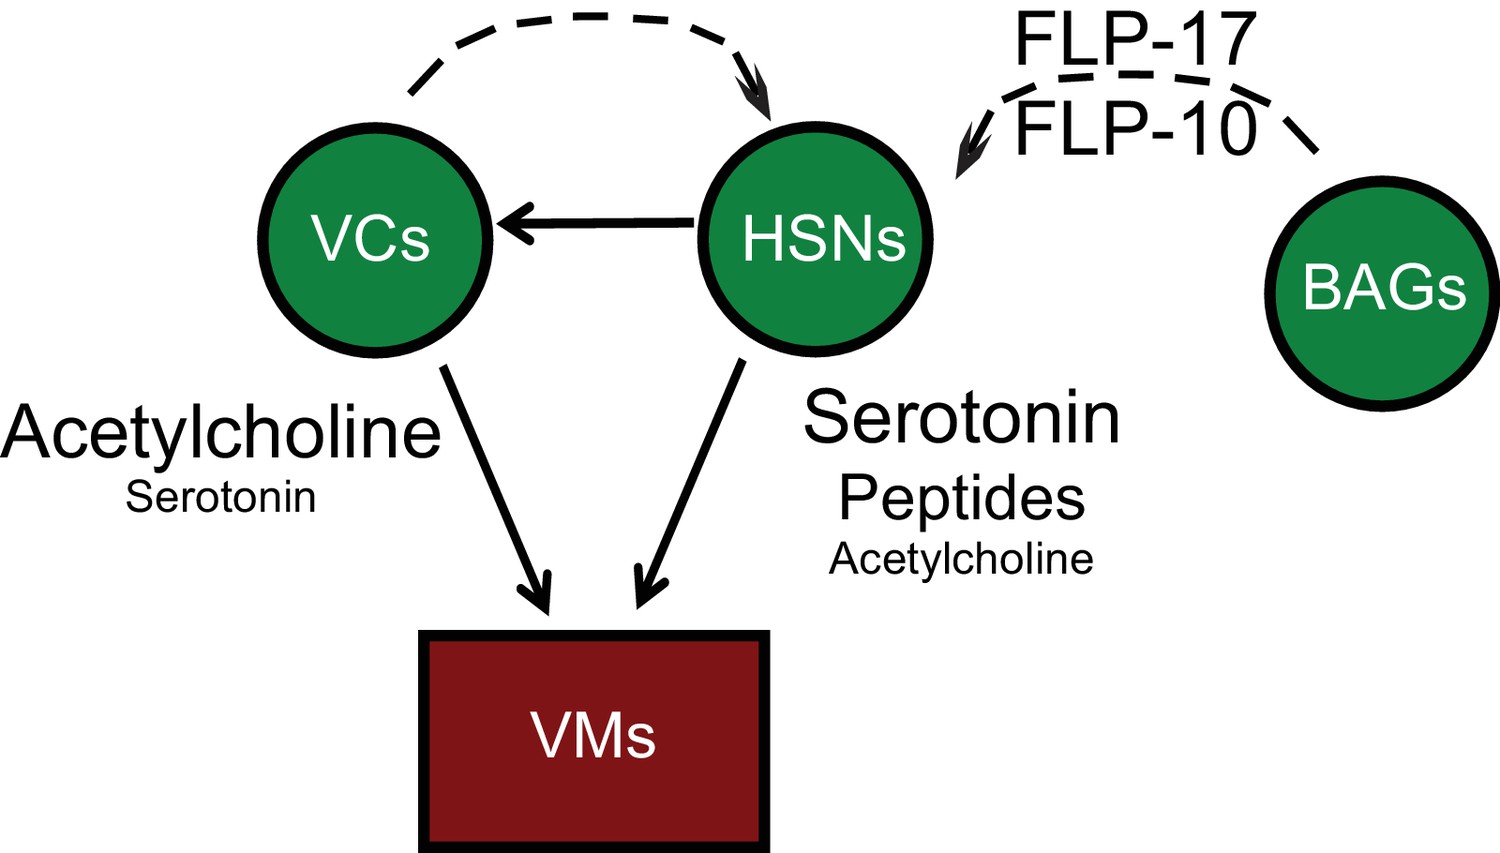
Anatomy and connectivity of the C. elegans egg-laying circuit.
Arrows denote synaptic connections. Dashed lines denote extrasynaptic inputs. Neurons are green. Sex muscles are red.
Figure 1—figure supplement 2

Histogram of interval times on a natural log scale.
Data replotted from Figure 1F.
Figure 2 with 1 supplement
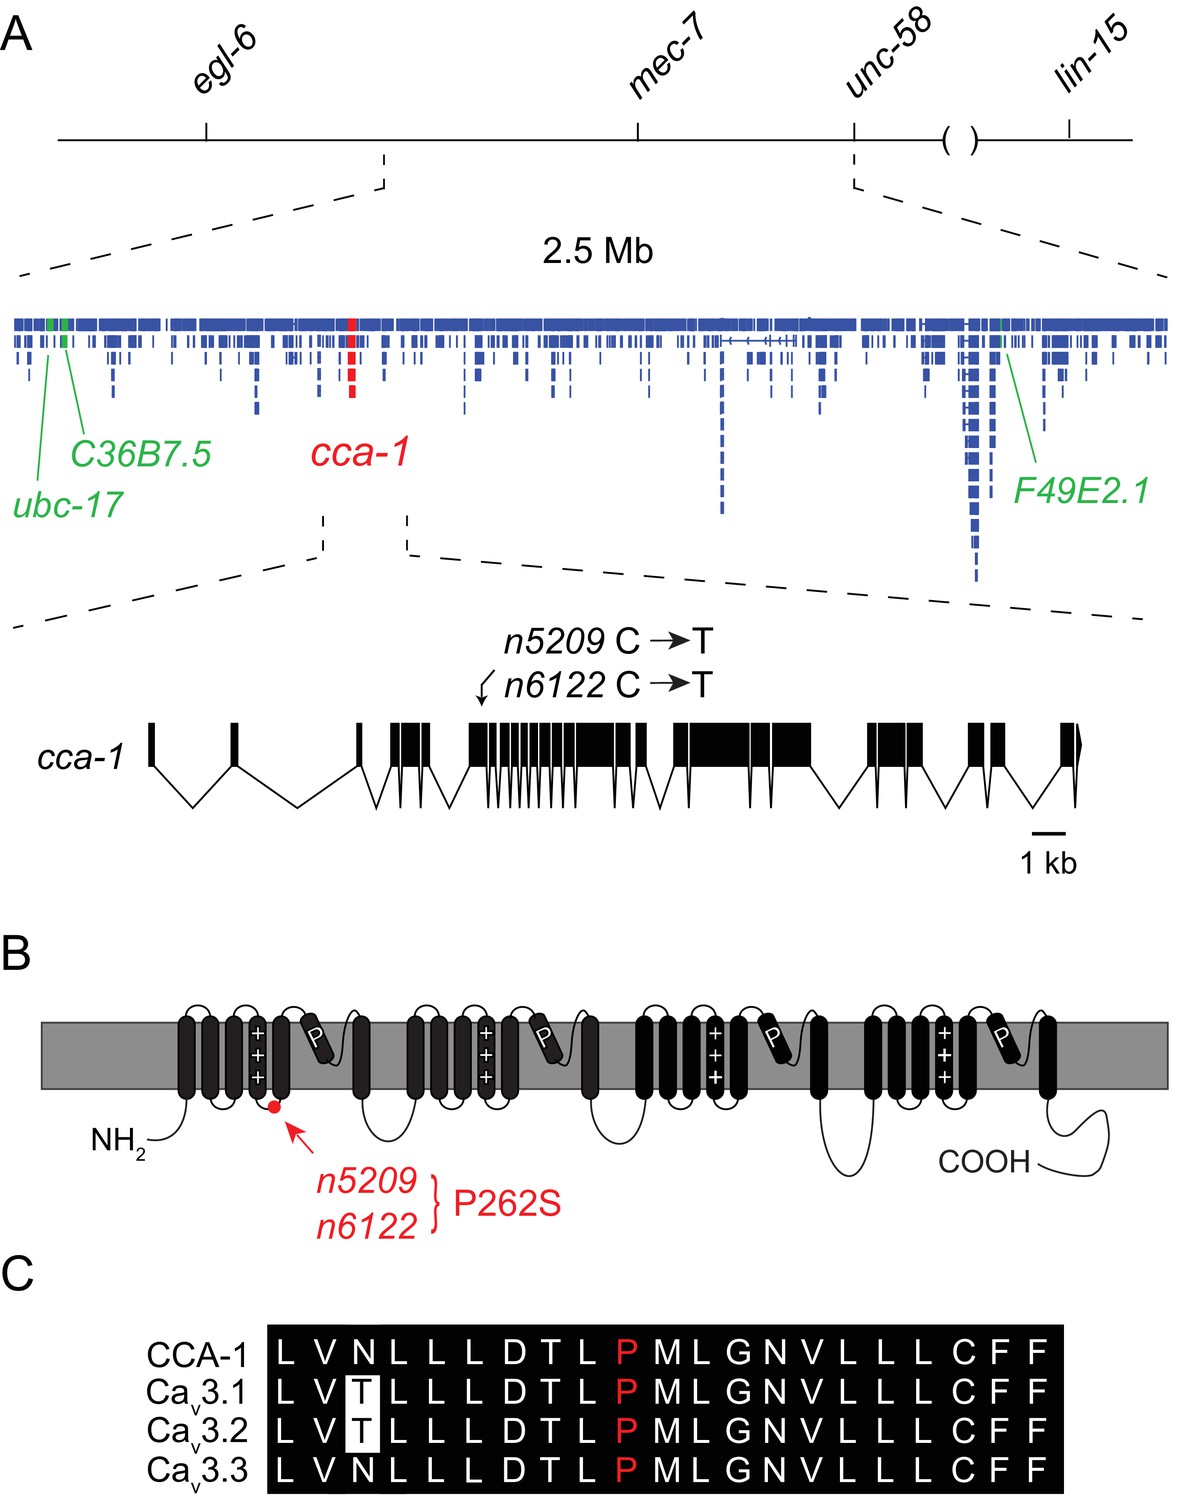
The n5209 suppressor of peptidergic inhibition affects the T-type calcium channel gene cca-1.
(A) The suppressor mutation, n5209, was mapped to a 2.5 Mb interval on Linkage Group X using a marked egl-6(gf) strain (top). Inset: Gene models within the 2.5 Mb interval. Sequence variants in this interval predicted to affect protein-coding sequences and that were used as markers for genetic mapping are in green. The causative suppressor mutation in cca-1 is in red. The cca-1 gene model is enlarged to show detail (bottom). (B) Schematic of CCA-1 protein. n5209 and n6122 are predicted to cause a proline to mutate to a serine in the intracellular domain next to the voltage sensor. (C) Amino acid sequence alignment shows that the affected proline residue is present in all three mammalian T-type channels. All sequence variants in this interval in n5209 and n6122 mutants are shown in Figure 2—figure supplement 1.
Figure 2—figure supplement 1
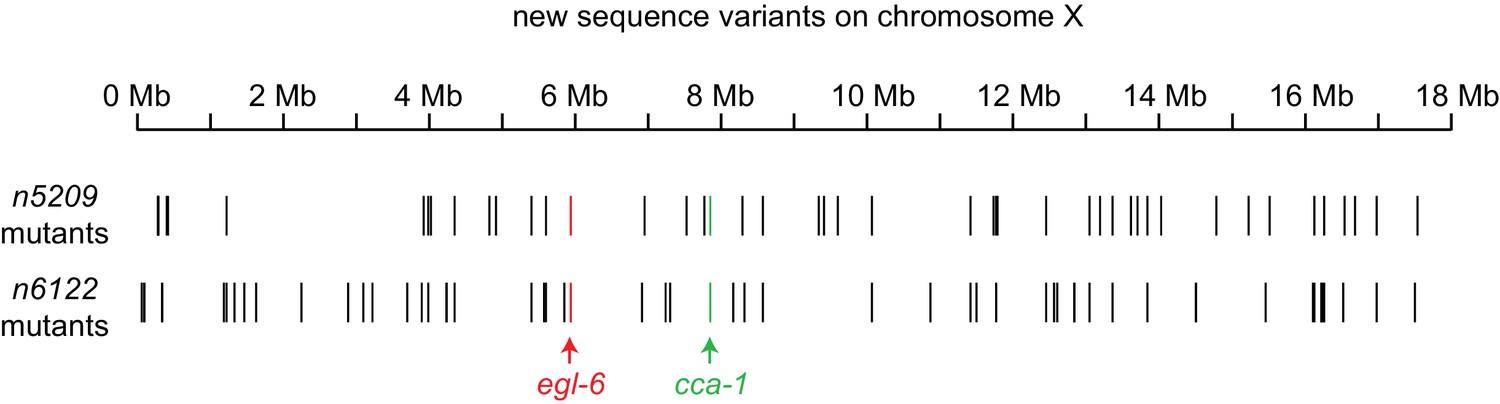
X-linked sequence variants in n5209 and n6122 mutants.
New sequence variants were identified in the independently derived n5209 and n6122 mutants. Variants were called using the Genome Analysis ToolKit (McKenna et al., 2010a; DePristo et al., 2011; Van der Auwera, 2013) and variants present in egl-6(gf) mutants were filtered using SnpSift (Cingolani, 2012). The egl-6(gf) mutation is red, cca-1 variants are green, and all other variants are black.
Figure 3
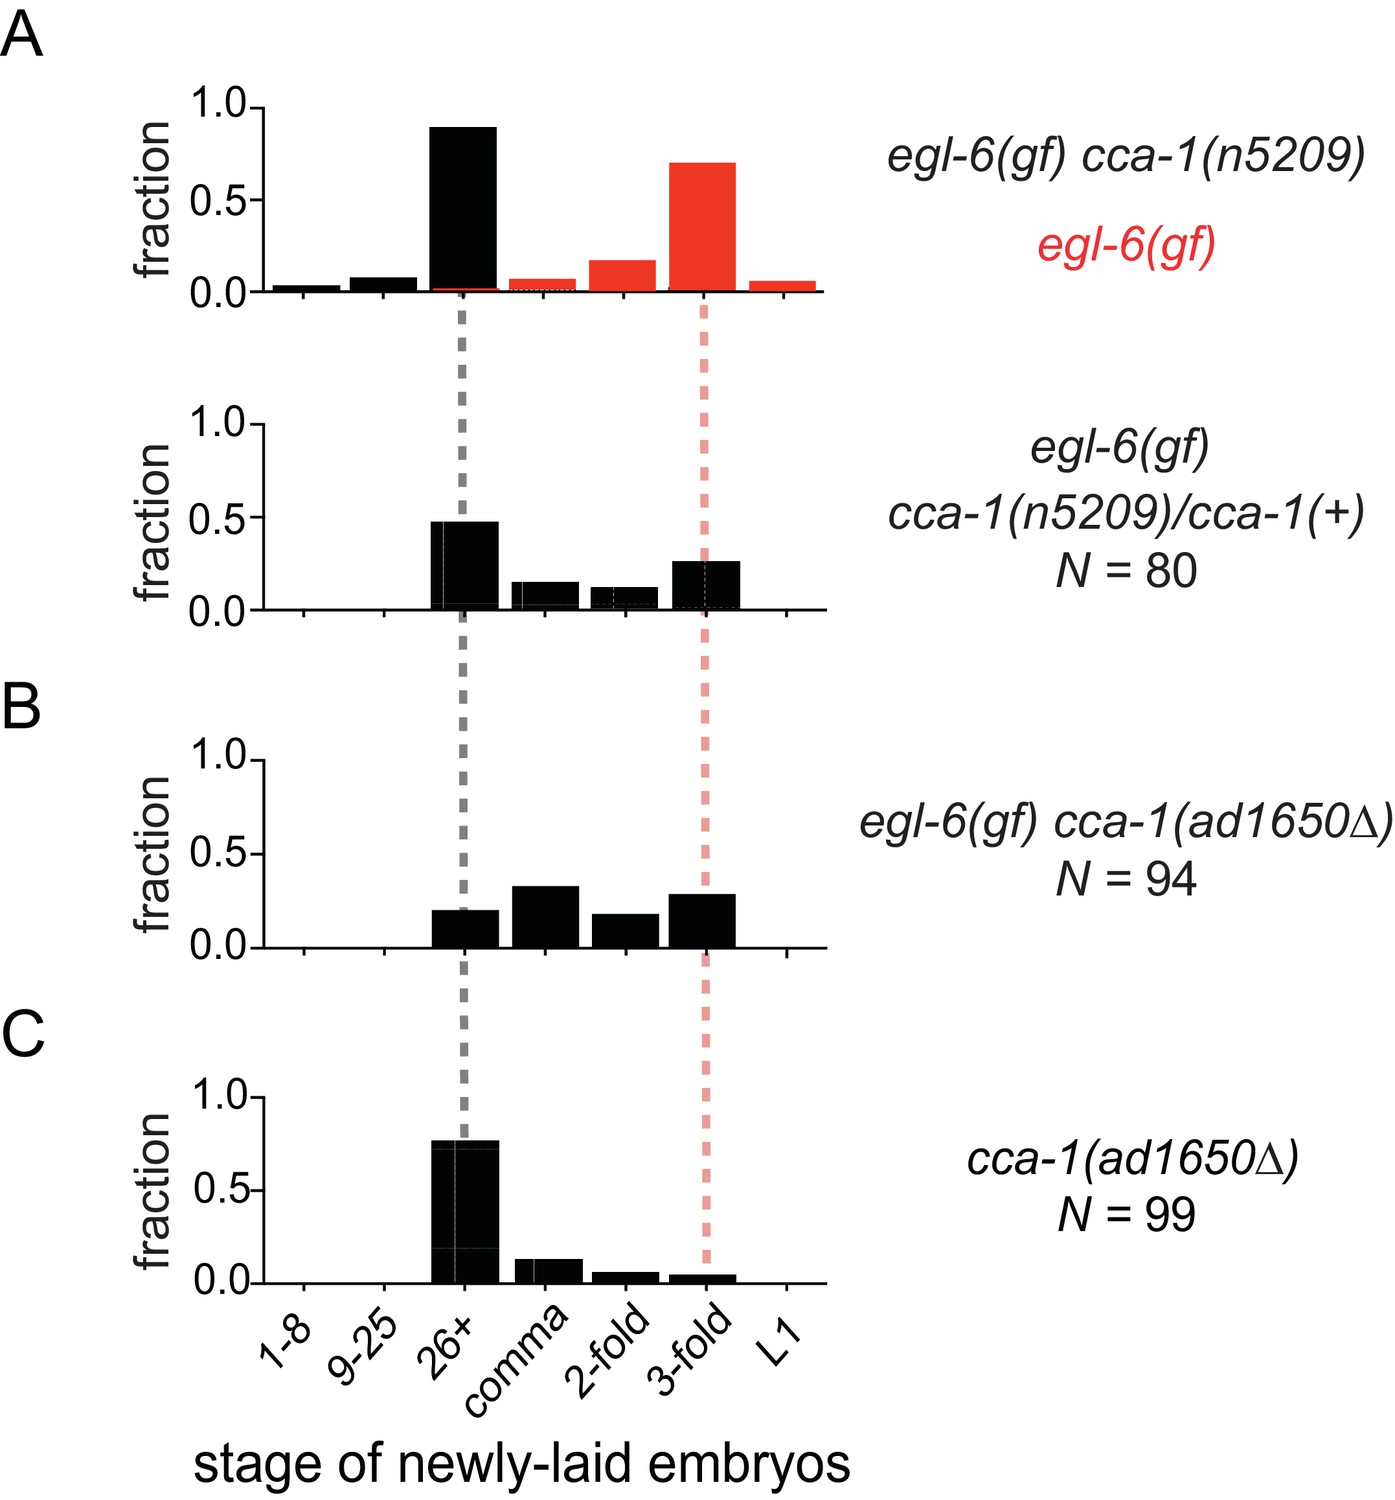
The n5209 suppressor mutation alters cca-1 function.
(A) cca-1(n5209) is a potent suppressor of egl-6(gf) (top; data replotted from Figure 1). One copy of the n5209 allele was sufficient to partially suppress the egl-6(gf) phenotype (bottom). (B) A deletion allele of cca-1 partially suppressed egl-6(gf), but not as potently as n5209 did. (C) cca-1(Δ) significantly altered the stage of newly laid embryos when compared to wild type.
-
Figure 3—source data 1
Raw data of developmental stage of newly laid embryos from Figure 3.
- https://doi.org/10.7554/eLife.22771.010
Figure 4 with 1 supplement
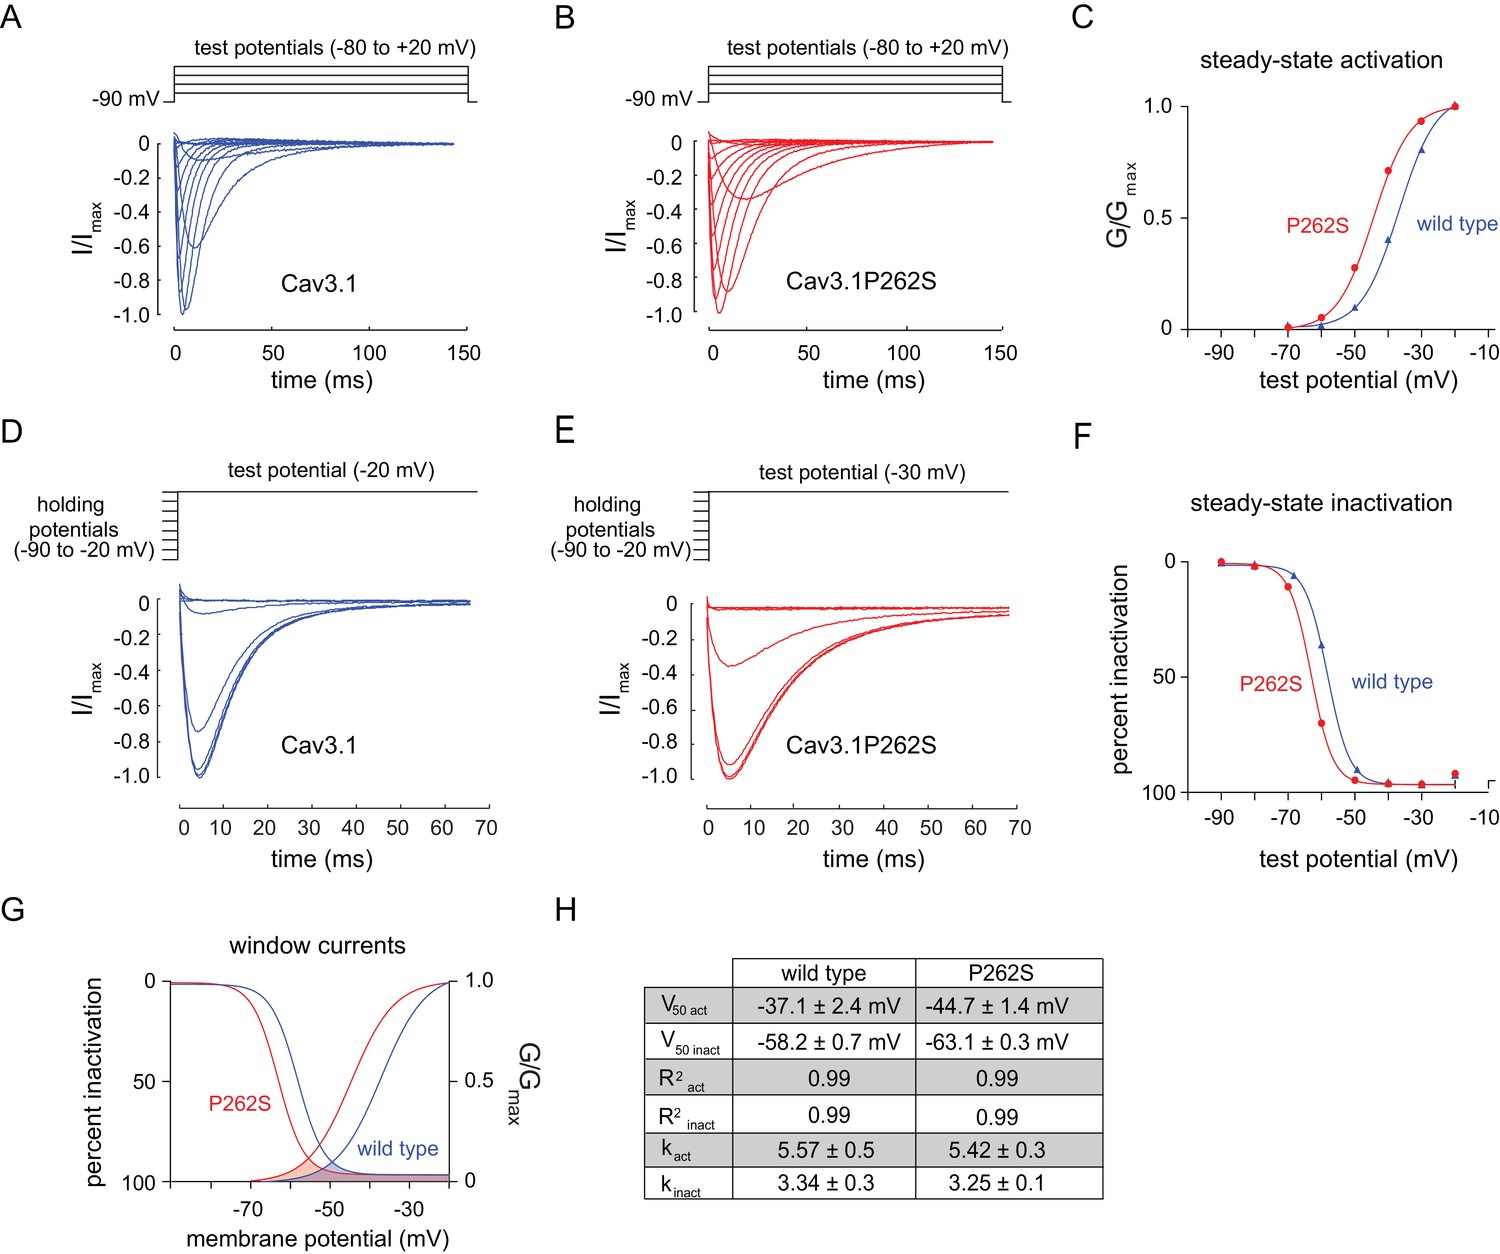
The n5209 mutation changes the voltage-dependence of steady-state activation and inactivation of T-type channels.
(A–C) Steady-state activation of wild-type and mutant T-type channels expressed in X. laevis oocytes. (A) Representative trace of wild type Cav3.1, the mammalian homolog of CCA-1. (B) Representative trace of mutant Cav3.1 (Cav3.1P262S). (C) Steady-state activation curve. Chord conductances were obtained using the Goldman-Hodgkin-Katz equation. Cav3.1P262S was activated at significantly more hyperpolarized potentials than wild type. (D–F) Steady state inactivation measured in X. laevis oocytes. (D) Representative trace of wild type Cav3.1. (E) Representative trace of Cav3.1P262S. (F) Steady-state inactivation curve. (G) Cav3.1P262S had a window current that is significantly shifted toward hyperpolarized potentials. (H) Table of values for wild-type and mutant Cav3.1 channels. N = 10 for activation of wild-type Cav3.1 channels. N = 5 for activation of mutant Cav3.1P262S channels. N = 7 for inactivation of wild-type channels. N = 6 for inactivation of mutant channels. For the mutant and wild-type IV curves, see Figure 4—figure supplement 1.
Figure 4—figure supplement 1
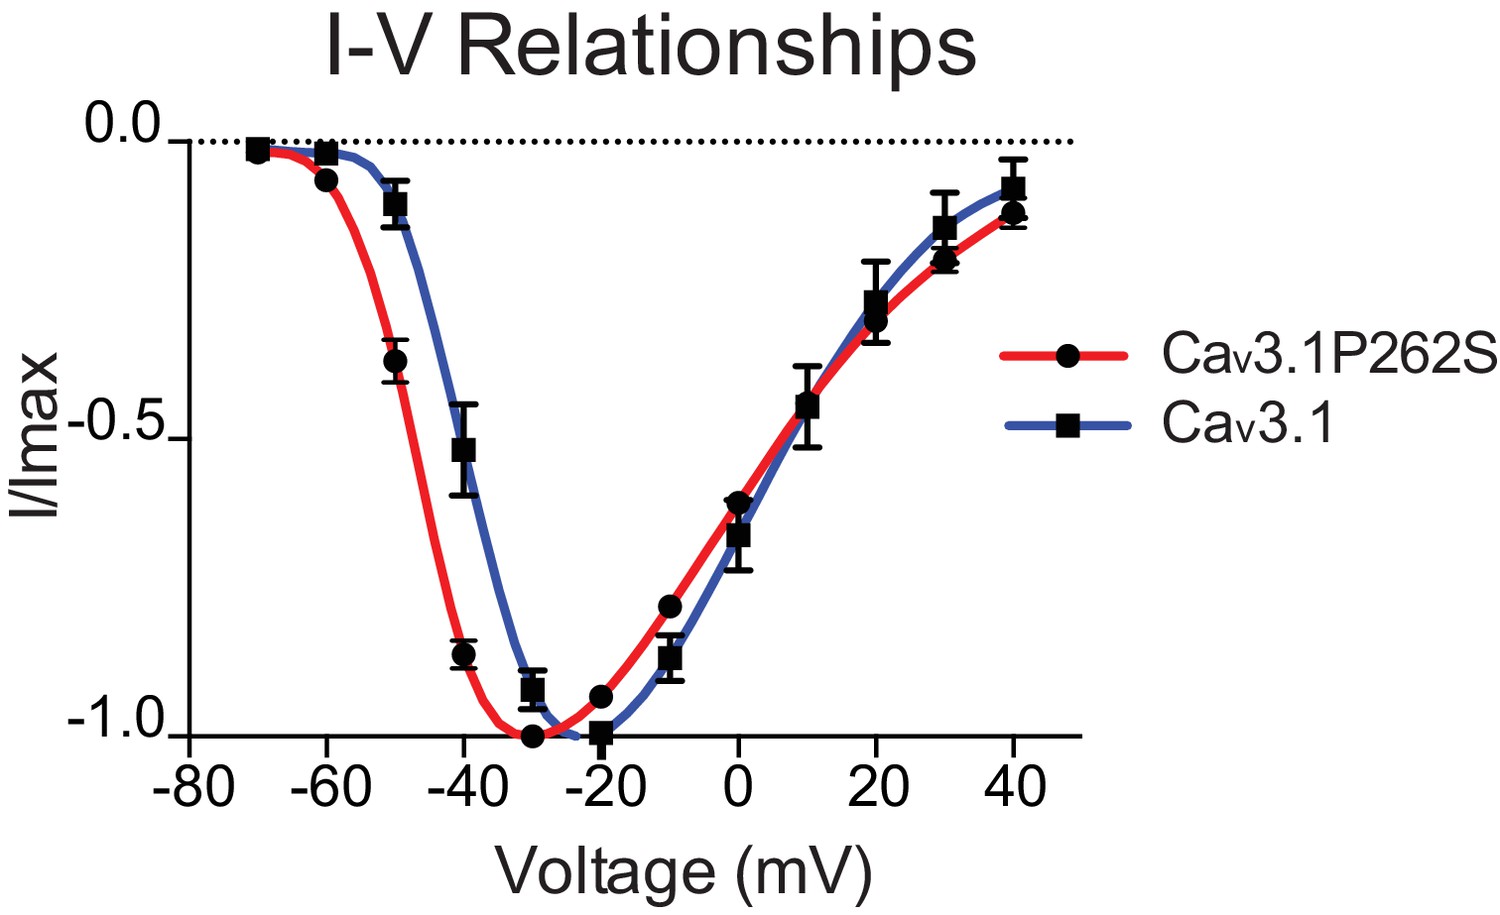
n5209 mutation shifts the current-voltage relationship of Cav3.1 to more hyperpolarized potentials.
IV curves of wild-type (blue) and mutant (red) channels. N = 10 for wild type; N = 5 for mutant.
Figure 5
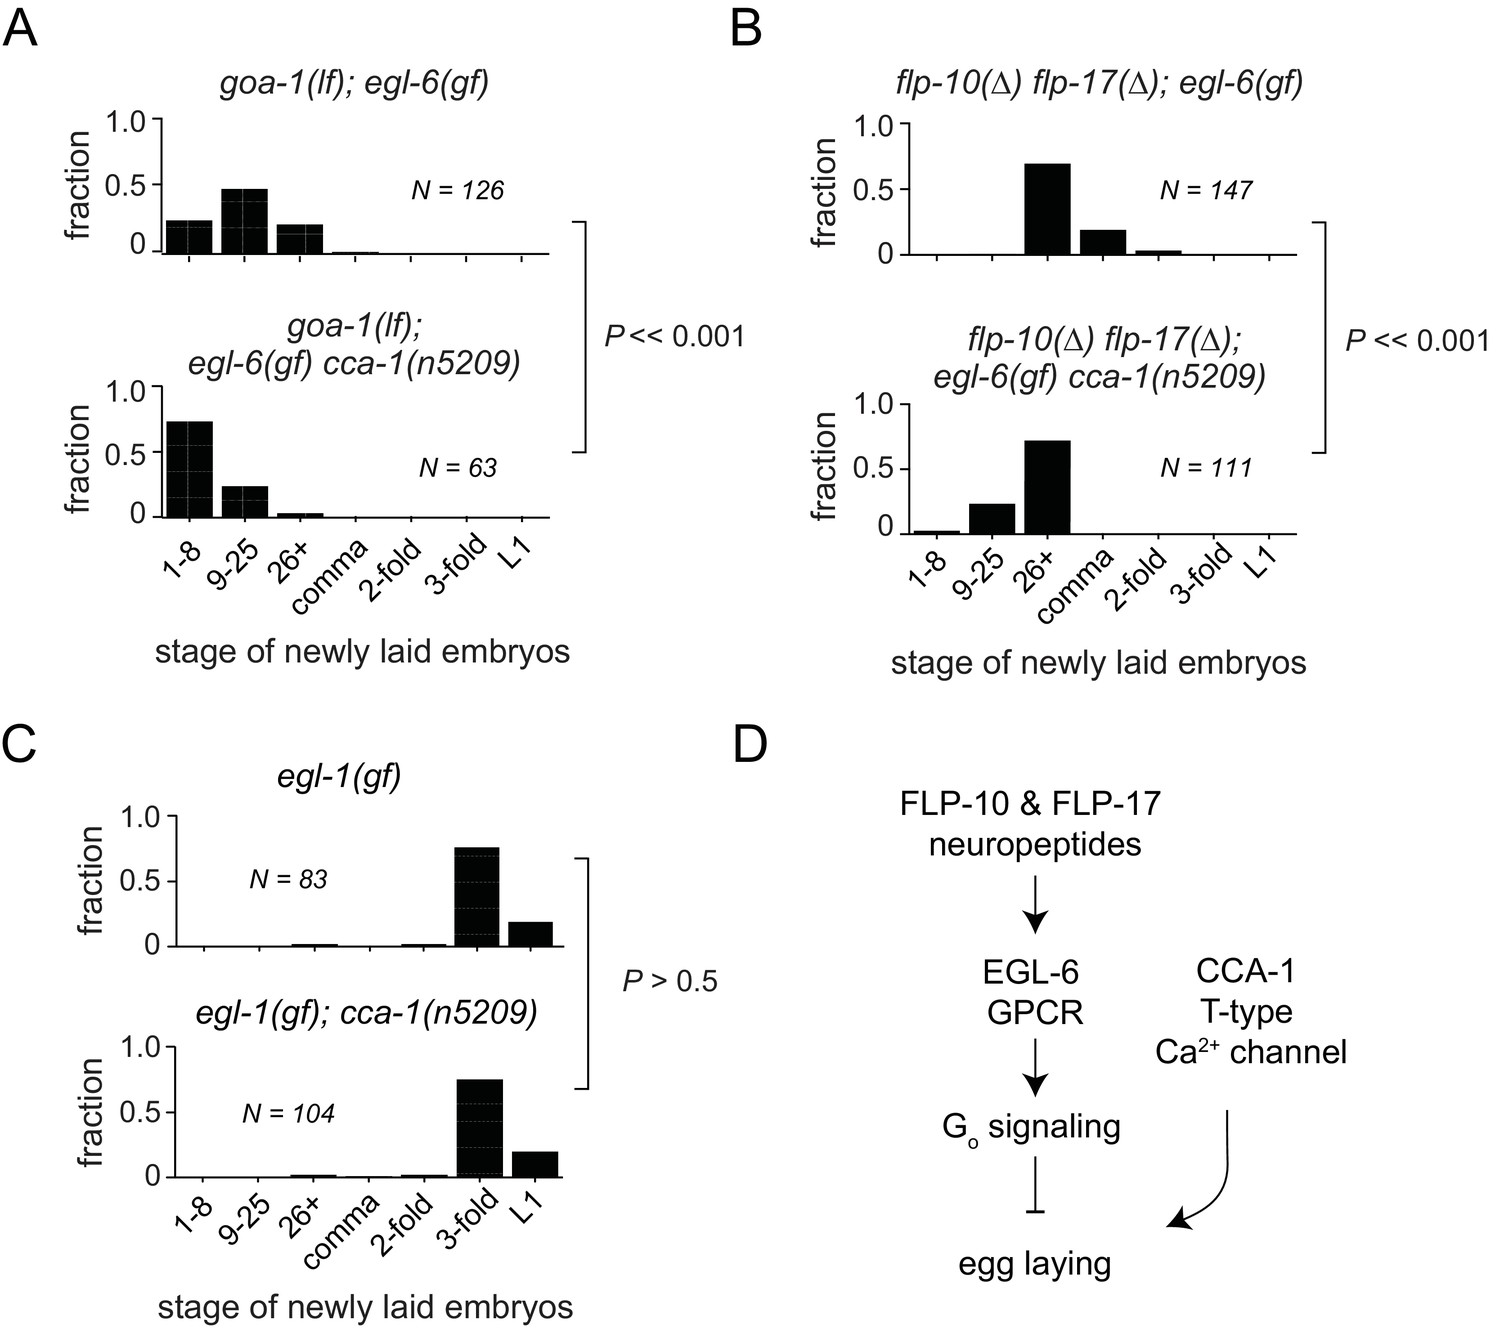
T-type Ca2+ channels act in parallel to the GPCR signaling pathway that mediates peptidergic inhibition.
(A) cca-1(n5209) enhanced suppression of the egl-6(gf) phenotype caused by loss of its downstream effector, GOA-1. (B) cca-1(n5209) enhanced the suppression of egl-6(gf) caused by the loss of its neuropeptide ligands, FLP-10 and FLP-17. (C) cca-1(n5209) had no effect on animals that do not have HSNs. (D) Our data support a model in which CCA-1(n5209) acts in parallel to EGL-6 signaling.
-
Figure 5—source data 1
Raw data of developmental stage of newly laid embryos from Figure 5.
- https://doi.org/10.7554/eLife.22771.014
Figure 6 with 2 supplements
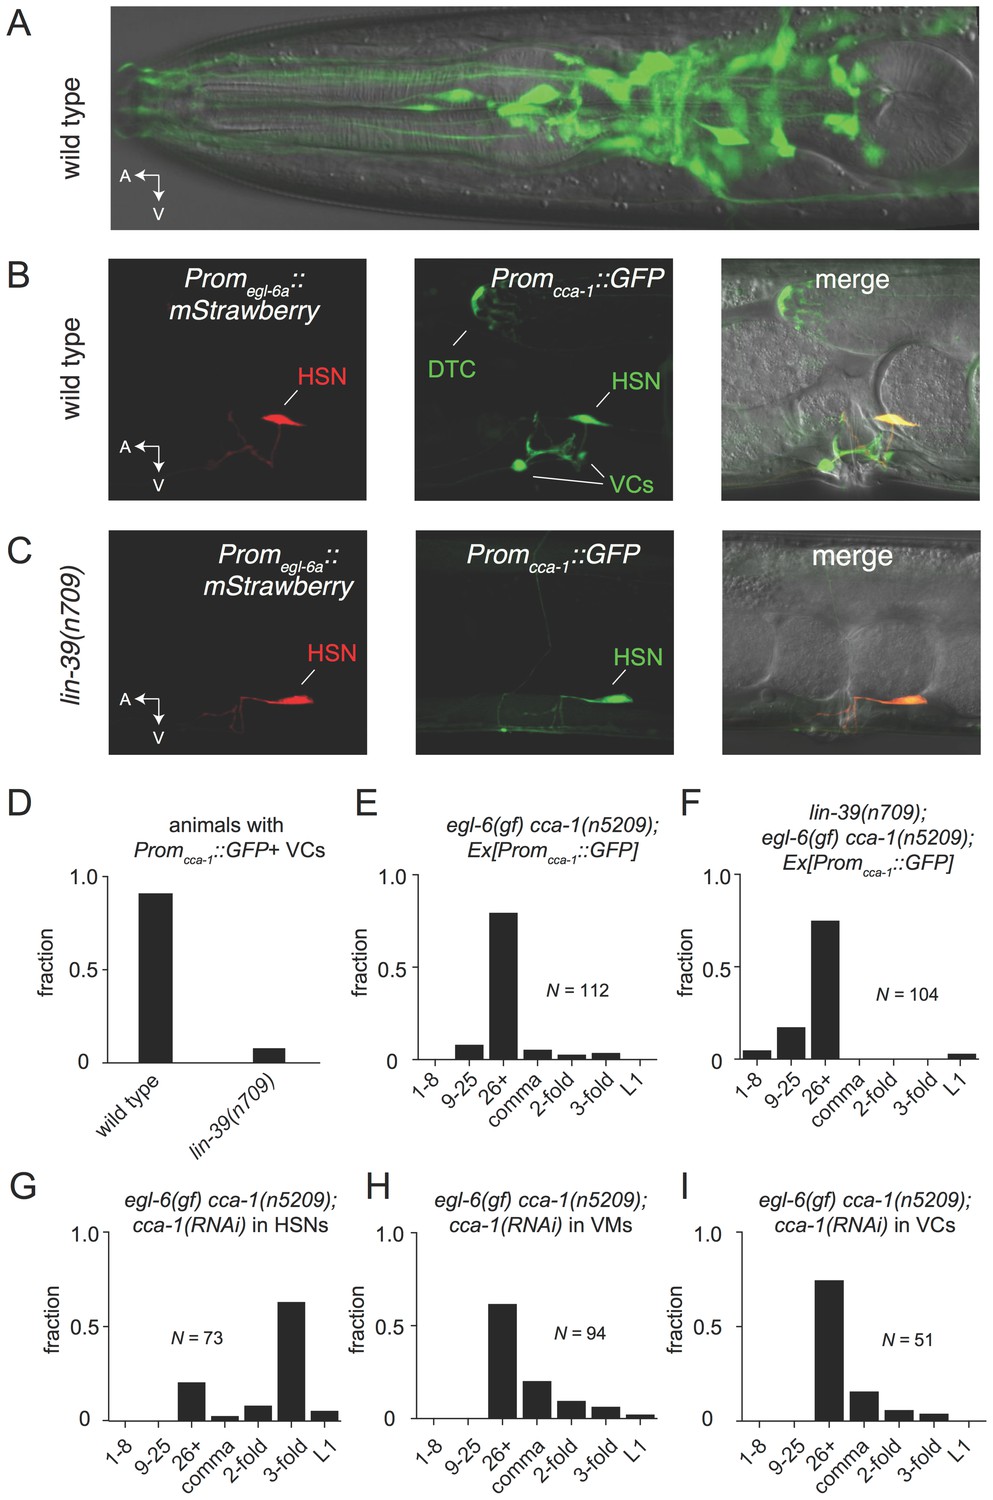
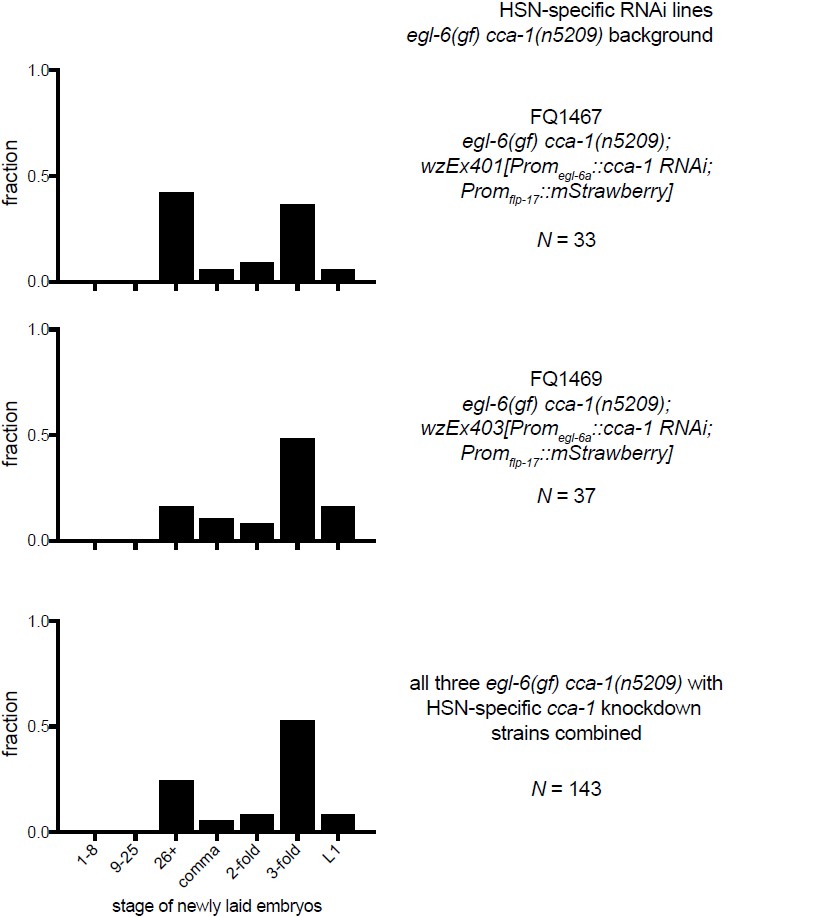
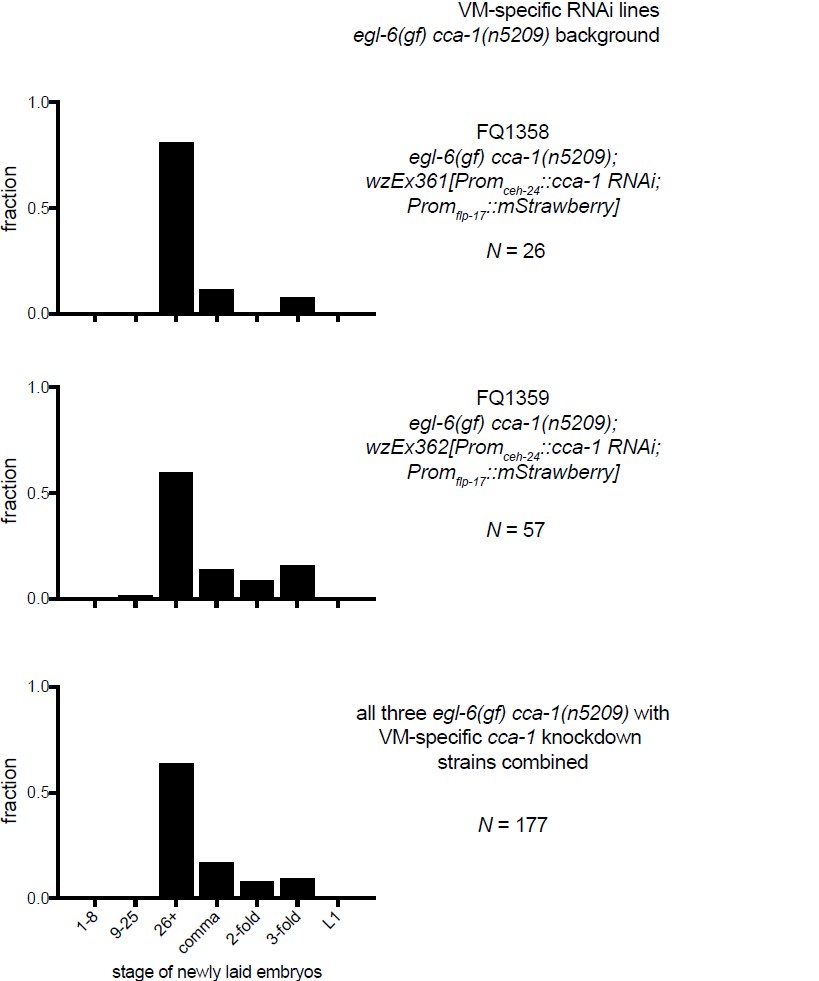
The T-type Ca2+ channel CCA-1 acts in the HSNs to suppress excess neuropeptide inhibition.
(A) A cca-1 fosmid reporter (green) is expressed in many head neurons. (B) A cca-1 fosmid reporter (green) is expressed in the egg-laying system and is co-expressed in the HSNs with an egl-6 reporter (red). (C) Expression of a cca-1 fosmid reporter in VCs but not HSNs requires the transcription factor LIN-39. (D) Fraction of animals expressing Promcca-1::GFP in VC4 and VC5. (E) Distribution of developmental stages of embyros laid by egl-6(gf) cca-1(n5209) animals carrying Promcca-1::GFP. (F) Distribution of developmental stages of embyros laid by lin-39(n709); egl-6(gf) cca-1(n5209) animals carrying Promcca-1::GFP. (G–I) Tissue-specific knockdown of CCA-1 in the egg-laying neuromusculature. Knockdown of cca-1 in HSNs of egl-6(gf) cca-1(n5209) mutants restored the egl-6(gf) Egl phenotype. All three tissue-specific constructs utilized the same seed sequence to target cca-1 (listed in Supplementary file 5). Each transgene was tested in multiple independently derived lines. Shown are representative lines. Expression of the short cca-1 promoter is shown in Figure 6—figure supplement 1. HSN-specific knockdown of CCA-1 in a wild-type background is shown in Figure 6—figure supplement 2.
-
Figure 6—source data 1
Number of GFP+ VCs with the cca-1 fosmid.
- https://doi.org/10.7554/eLife.22771.016
-
Figure 6—source data 2
Raw data of developmental stage of newly laid embryos from Figure 6.
- https://doi.org/10.7554/eLife.22771.017
Figure 6—figure supplement 1
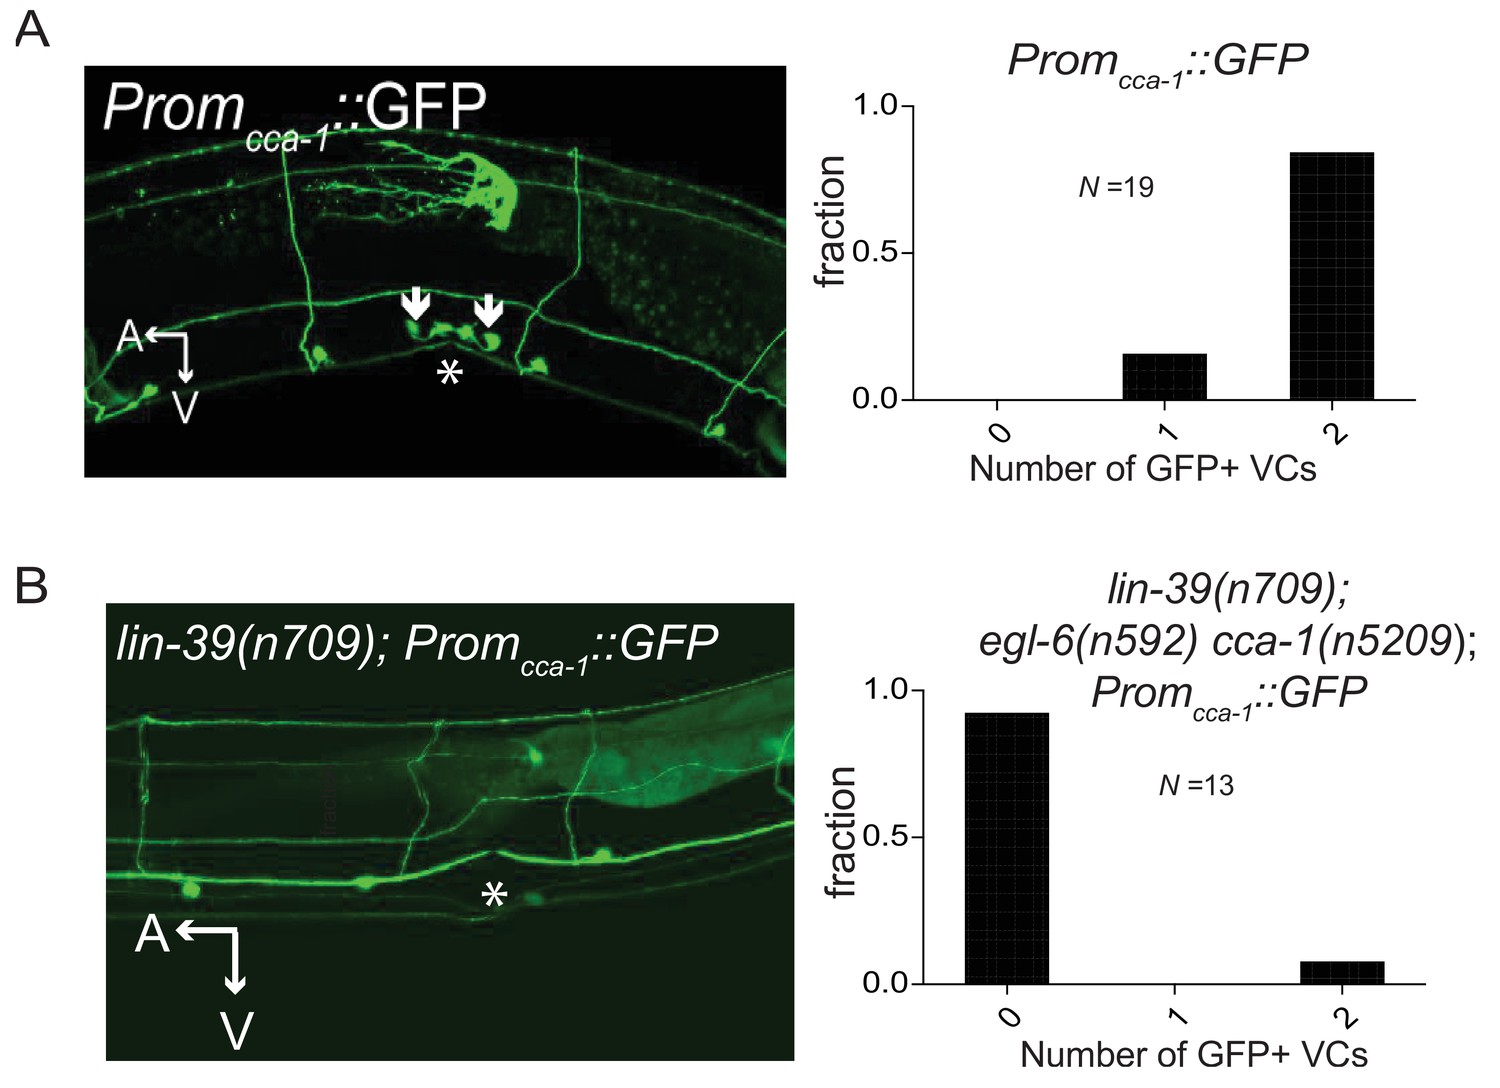
CCA-1 expression in the VCs is dependent on the homeodomain-containing transcription factor lin-39.
(A) Wild-type animals expressing a 3 kb cca-1 promoter driving GFP. Most animals expressed Promcca-1::GFP in both VC4 and VC5. No animals expressed Promcca-1::GFP in HSNs. Asterisk denotes vulva. (B) lin-39(n709) animals expressing the same 3 kb Promcca-1::GFP. Expression of Promcca-1::GFP in the VCs is abolished in almost all animals. Like the longer promoter in Figure 6, the short cca-1 promoter depends on lin-39.
-
Figure 6—figure supplement 1—source data 1
Number of GFP+ VCs with the short cca-1 promoter.
- https://doi.org/10.7554/eLife.22771.019
Figure 6—figure supplement 2
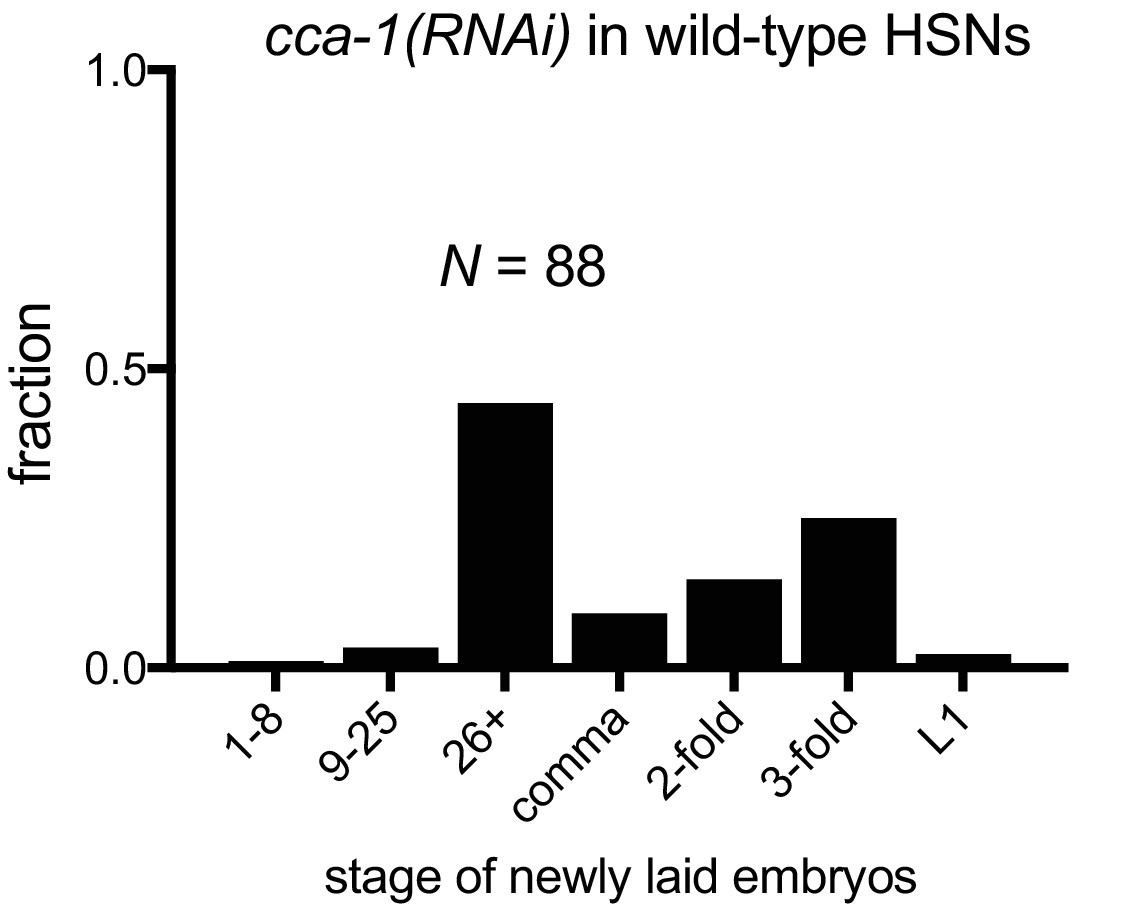
Knockdown of CCA-1 in wild-type HSNs weakly affects egg-laying.
HSN-specific knockdown of CCA-1 in HSNs in wild-type animals. Shown are pooled data from two strains outcrossed in parallel from egl-6(gf) cca-1(n5209); cca-1(RNAi) in HSNs.
Figure 7 with 1 supplement
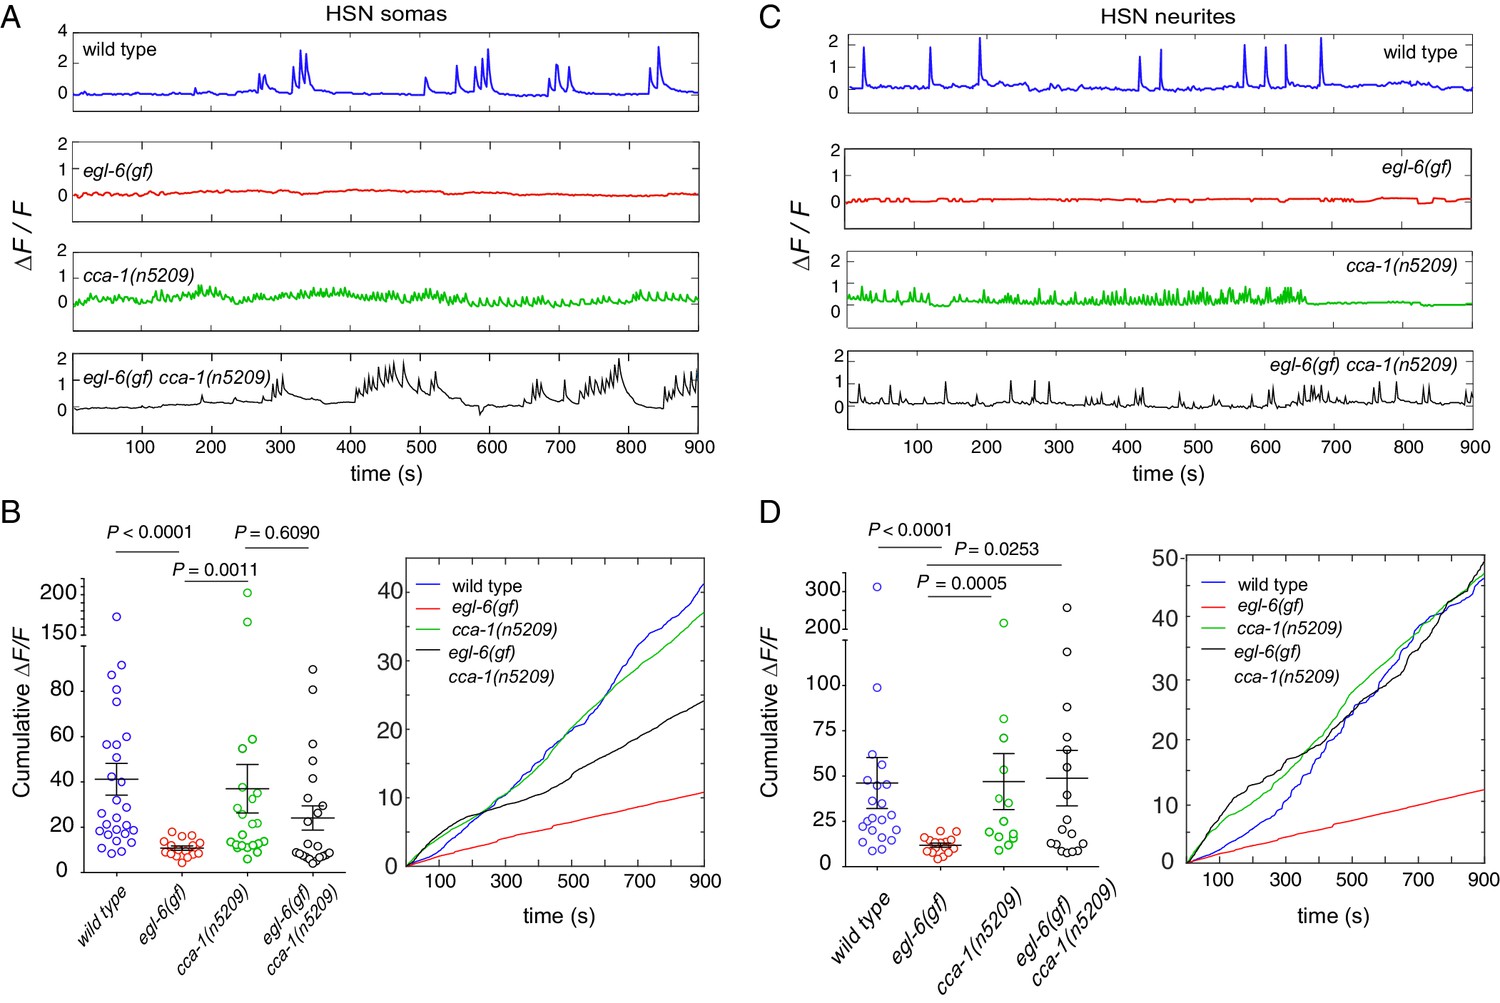
Re-tuned channels restore neural activity to inhibited serotonin neurons.
(A) Representative △F/F traces of spontaneous somatic calcium transients in HSNs of partially restrained adult hermaphrodites. (B) Cumulative △F/F of wild-type and mutant HSN somas. Values for individual animals are displayed on the left; mean values for each genotype are displayed on the right. (C) Representative △F/F traces of spontaneous neurite calcium transients in the HSNs of partially restrained adult hermaphrodites. (D) Cumulative △F/F of wild-type and mutant HSN neurites. Values for individual animals on left; mean values for each genotype on right. 16–22 animals were imaged for all genotypes. Soma: N = 16–27. Neurite: N = 13–22. Calcium imaging of vulval muscles in these strains is shown in Figure 7—figure supplement 1.
-
Figure 7—source code 1
- https://doi.org/10.7554/eLife.22771.022
Figure 7—figure supplement 1
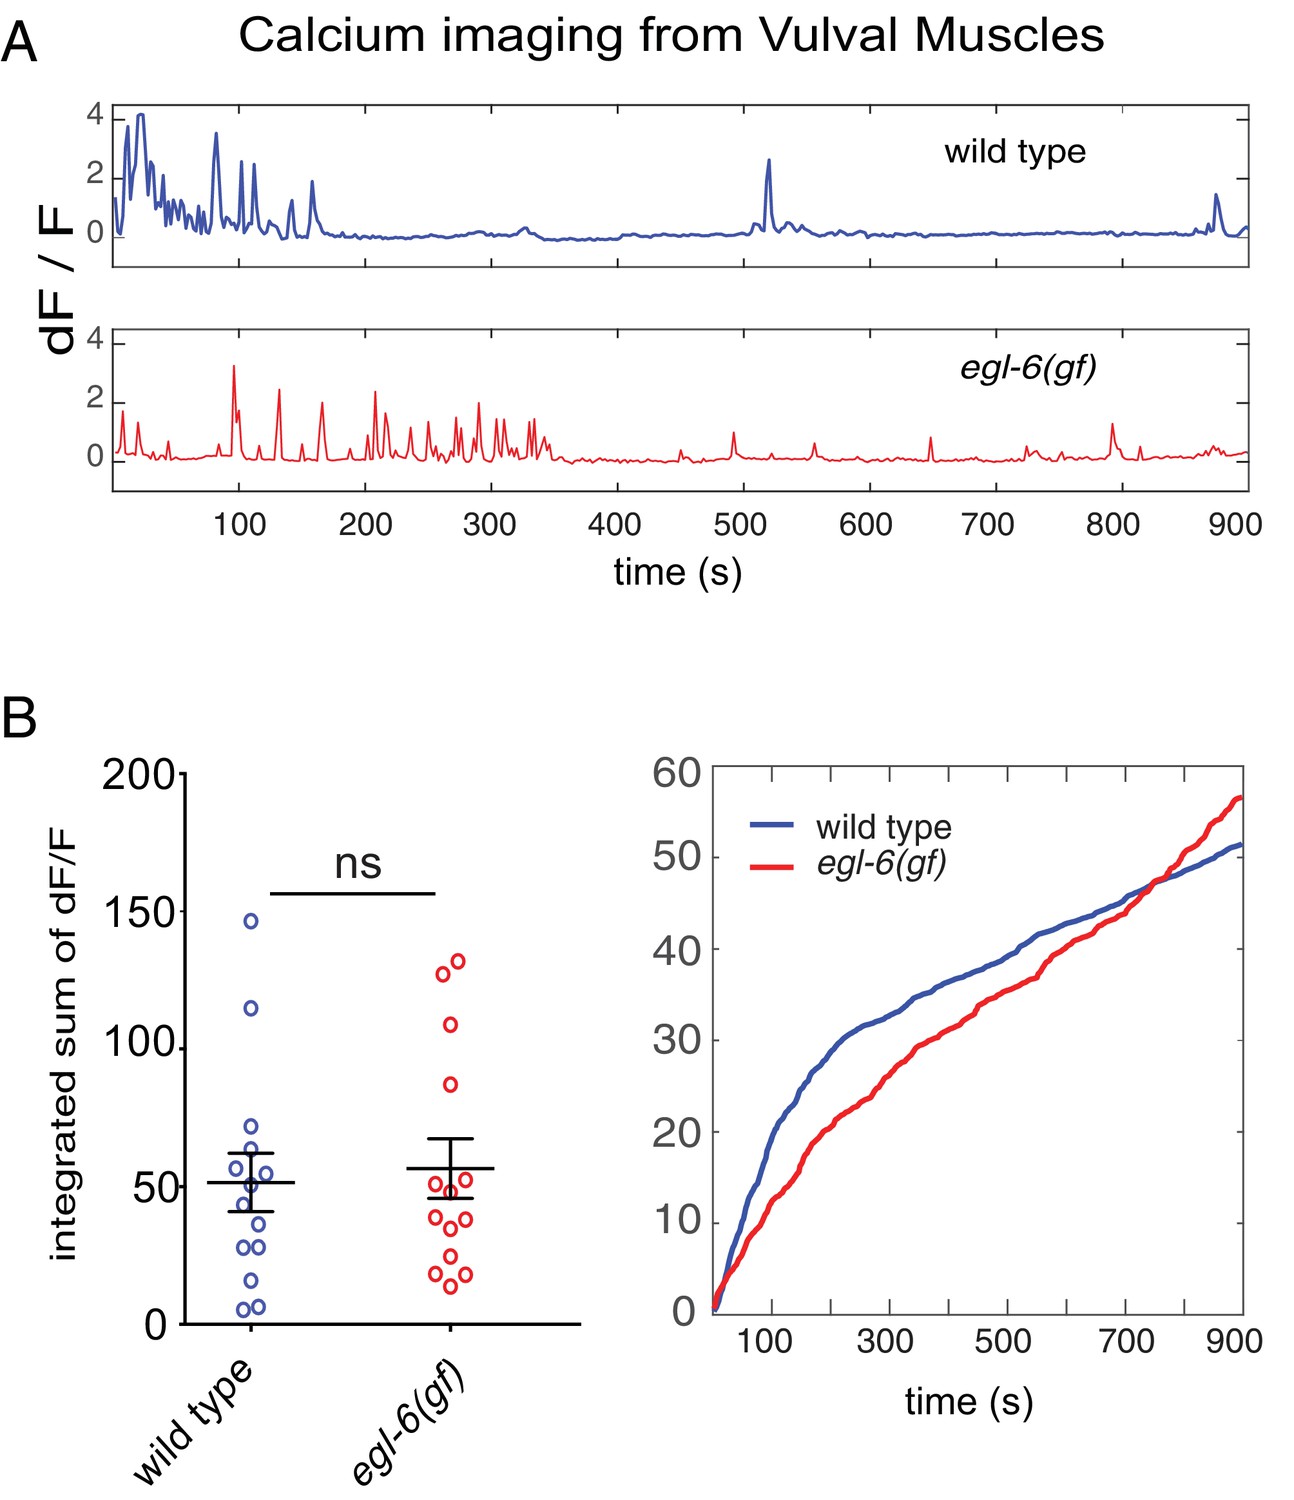
Excess peptidergic inhibition onto HSNs does not significantly alter spontaneous vulval muscle activity.
(A) Representative ΔF/F traces of spontaneous vulval muscle calcium transients in live, partially restrained adult hermaphrodites. (B) Cumulative ΔF/F from wild-type and mutant vulval muscle calcium traces. Values for individual animals are displayed on the left; mean values for each genotype are displayed on the right.
Author response image 1

Author response image 2
Author response image 3
Author response image 4

Additional files
-
Supplementary file 1
List of all p-values.
- https://doi.org/10.7554/eLife.22771.024
-
Supplementary file 2
Plasmid sequences.
- https://doi.org/10.7554/eLife.22771.025
-
Supplementary file 3
List of strains used in this study.
- https://doi.org/10.7554/eLife.22771.026
-
Supplementary file 4
List of primers and plasmids used in this study.
- https://doi.org/10.7554/eLife.22771.027
-
Supplementary file 5
Sequence of RNAi seed.
- https://doi.org/10.7554/eLife.22771.028
Download links
A two-part list of links to download the article, or parts of the article, in various formats.
Downloads (link to download the article as PDF)
Open citations (links to open the citations from this article in various online reference manager services)
Cite this article (links to download the citations from this article in formats compatible with various reference manager tools)
Inhibitory peptidergic modulation of C. elegans serotonin neurons is gated by T-type calcium channels
eLife 6:e22771.
https://doi.org/10.7554/eLife.22771


