Node of Ranvier length as a potential regulator of myelinated axon conduction speed
- University College London, United Kingdom
- Iwate Medical University, Japan
Figures
Figure 1 with 1 supplement

Heterogeneity of Ranvier node lengths in the optic nerve and cerebral cortex.
(A) Confocal image of a single optic nerve node of Ranvier showing the node labelled with antibody to NaV1.6 (green) and paranodes labelled for Caspr (red). (B) Intensity profile of Caspr staining for the node in A. Node length was measured as the distance between the half maximum intensity for each paranode. (C, D) Confocal images of nodes in the optic nerve (C) and layer V of the cortex (D) highlighting the different range of node of Ranvier sizes in these areas. (E) Mean ± s.e.m. of the node lengths measured in optic nerve (ON, red) and layer V of the cortex (blue). (F, G) Distribution of node lengths from data in E for optic nerve (F) and cortex (G). (H) Node diameter as a function of node length in the optic nerve (red) and in grey matter of the cerebral cortex (blue). Slope of regression lines in H are not significantly different from zero (p=0.14 (optic nerve) and p=0.42 (cortex)). (I) NaV1.6 immunolabel intensity (summed over each node) as a function of node length in cerebral cortex (each point is one node). NaV1.6 labelling is correlated with node length (slope of regression line is significantly greater than zero, p=1.2×10⁻¹⁵).
Figure 1—figure supplement 1
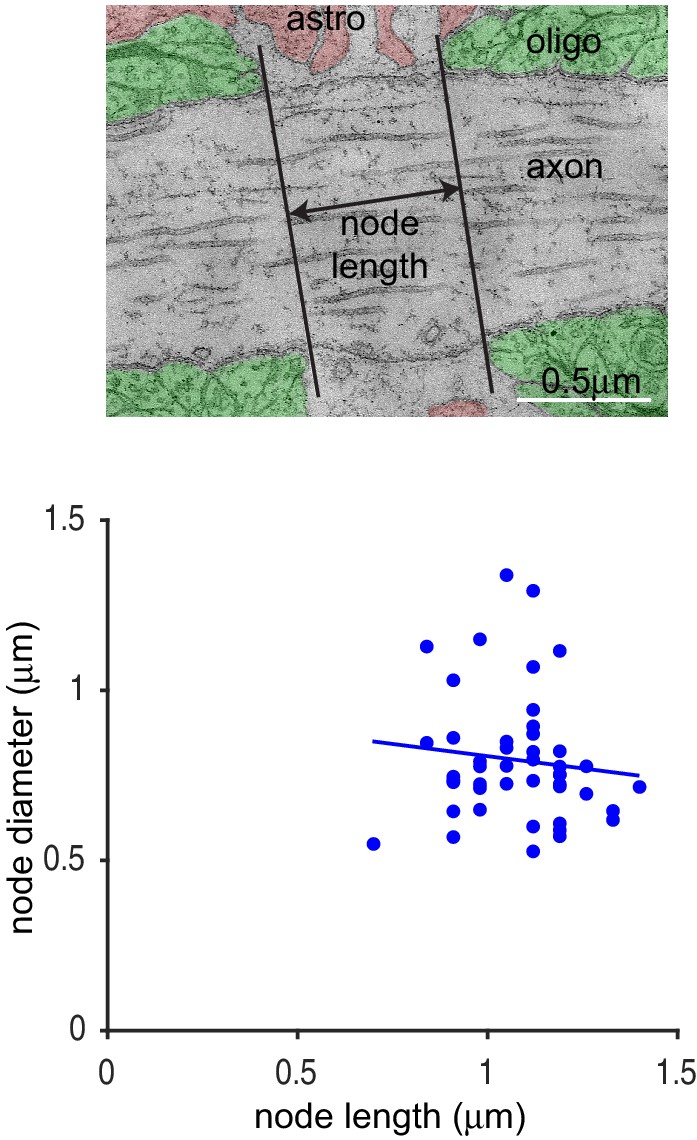
Heterogeneity of Ranvier node lengths in the optic nerve.
Top: EM picture of node of Ranvier in the adult optic nerve, showing surrounding oligodendrocytes (paranodal loops false-coloured green), an astrocyte (pink) and the node length. In practice node length was measured from the total thickness of the transverse sections across the nerve that were between the surrounding oligodendrocytes. Bottom: Node length as a function of node diameter in the optic nerve for 46 nodes measured by EM. Slope of regression line is not significantly different from zero (p=0.46).
Figure 2
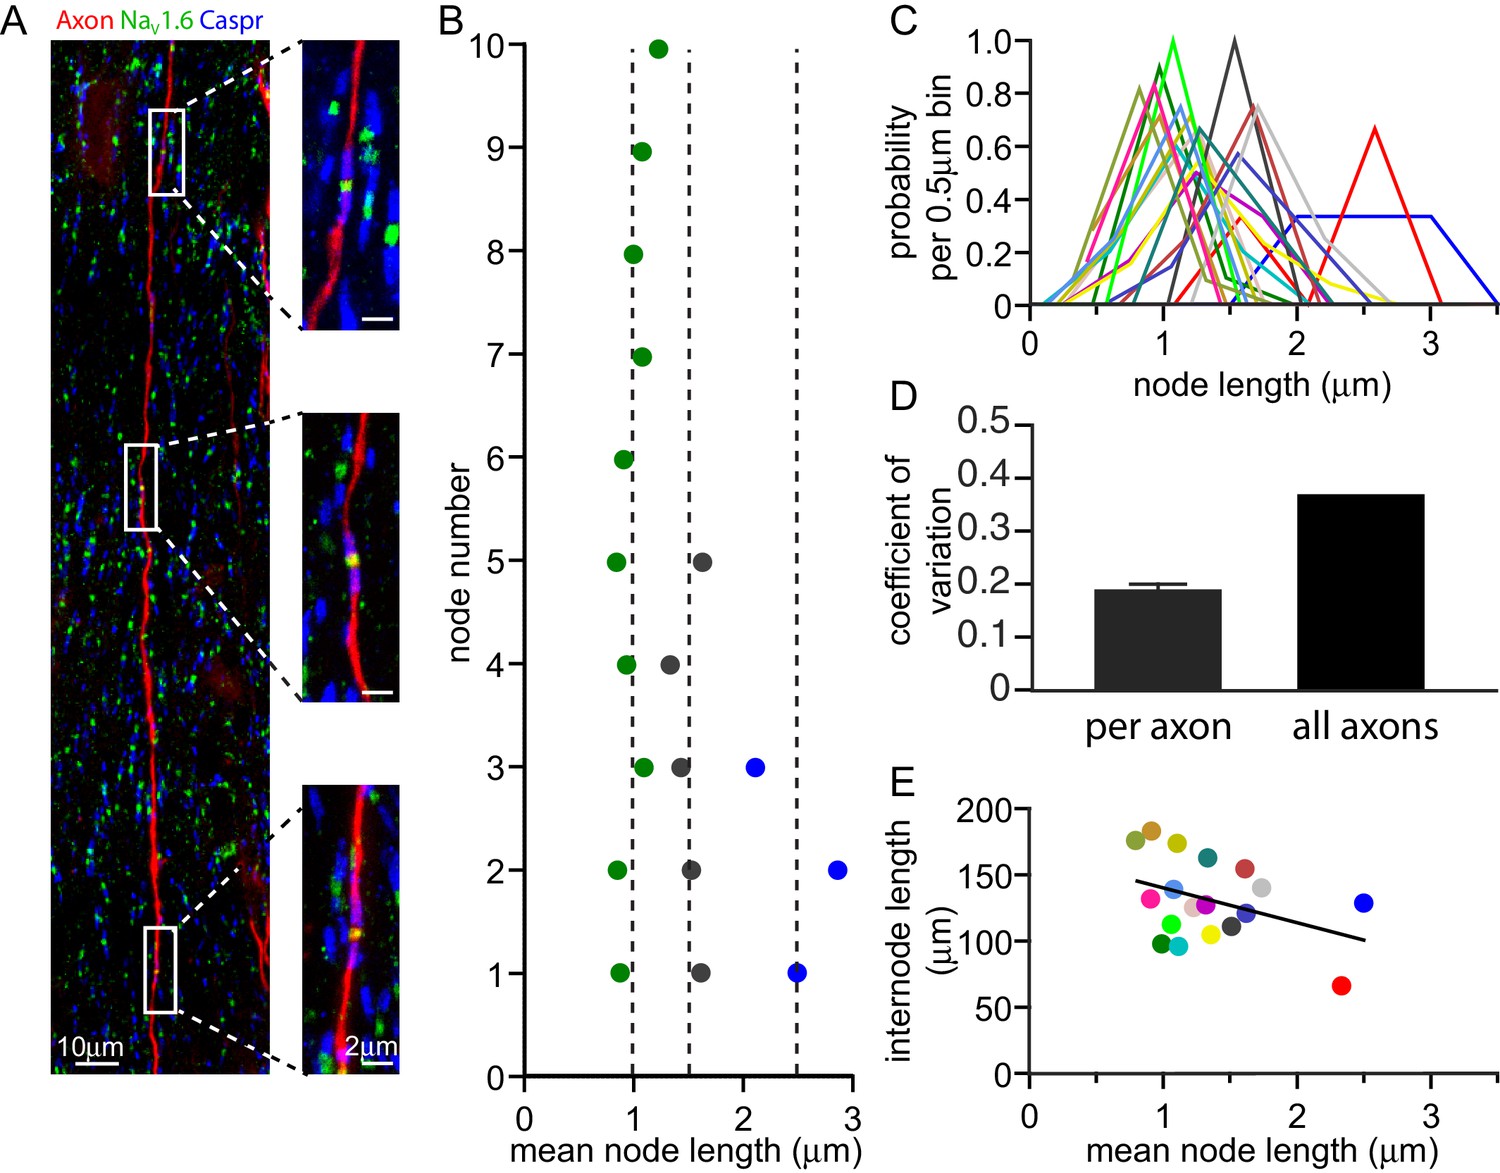
Node of Ranvier lengths are correlated along an axon.
(A) Composite confocal image of a single axon in the corpus callosum iontophoretically labelled with tetramethylrhodamine dextran (red). Three consecutive nodes of Ranvier are highlighted and shown in high resolution images. Nodes of Ranvier are identified as NaV1.6 positive clusters (green) flanked by Caspr positive paranodes (blue). (B) Successive node lengths along three example axons with different mean node lengths. The mean node length for each axon is plotted as a dashed line. (C) Distributions of node lengths of 18 individual axons (in 0.5 µm bins, centered on the median node length for each axon) show that the variability along each axon is much less than the variability between axons. (D) Mean coefficient of variation for node lengths along 18 individual axons and the overall coefficient of variation for all axons examined. (E) Mean internode length for each axon plotted against the mean node length for that axon. Each axon is represented by a different colour, and that colour is maintained for panels B, C and E. Regression line slope is not significantly different from zero (p=0.1).
Figure 3
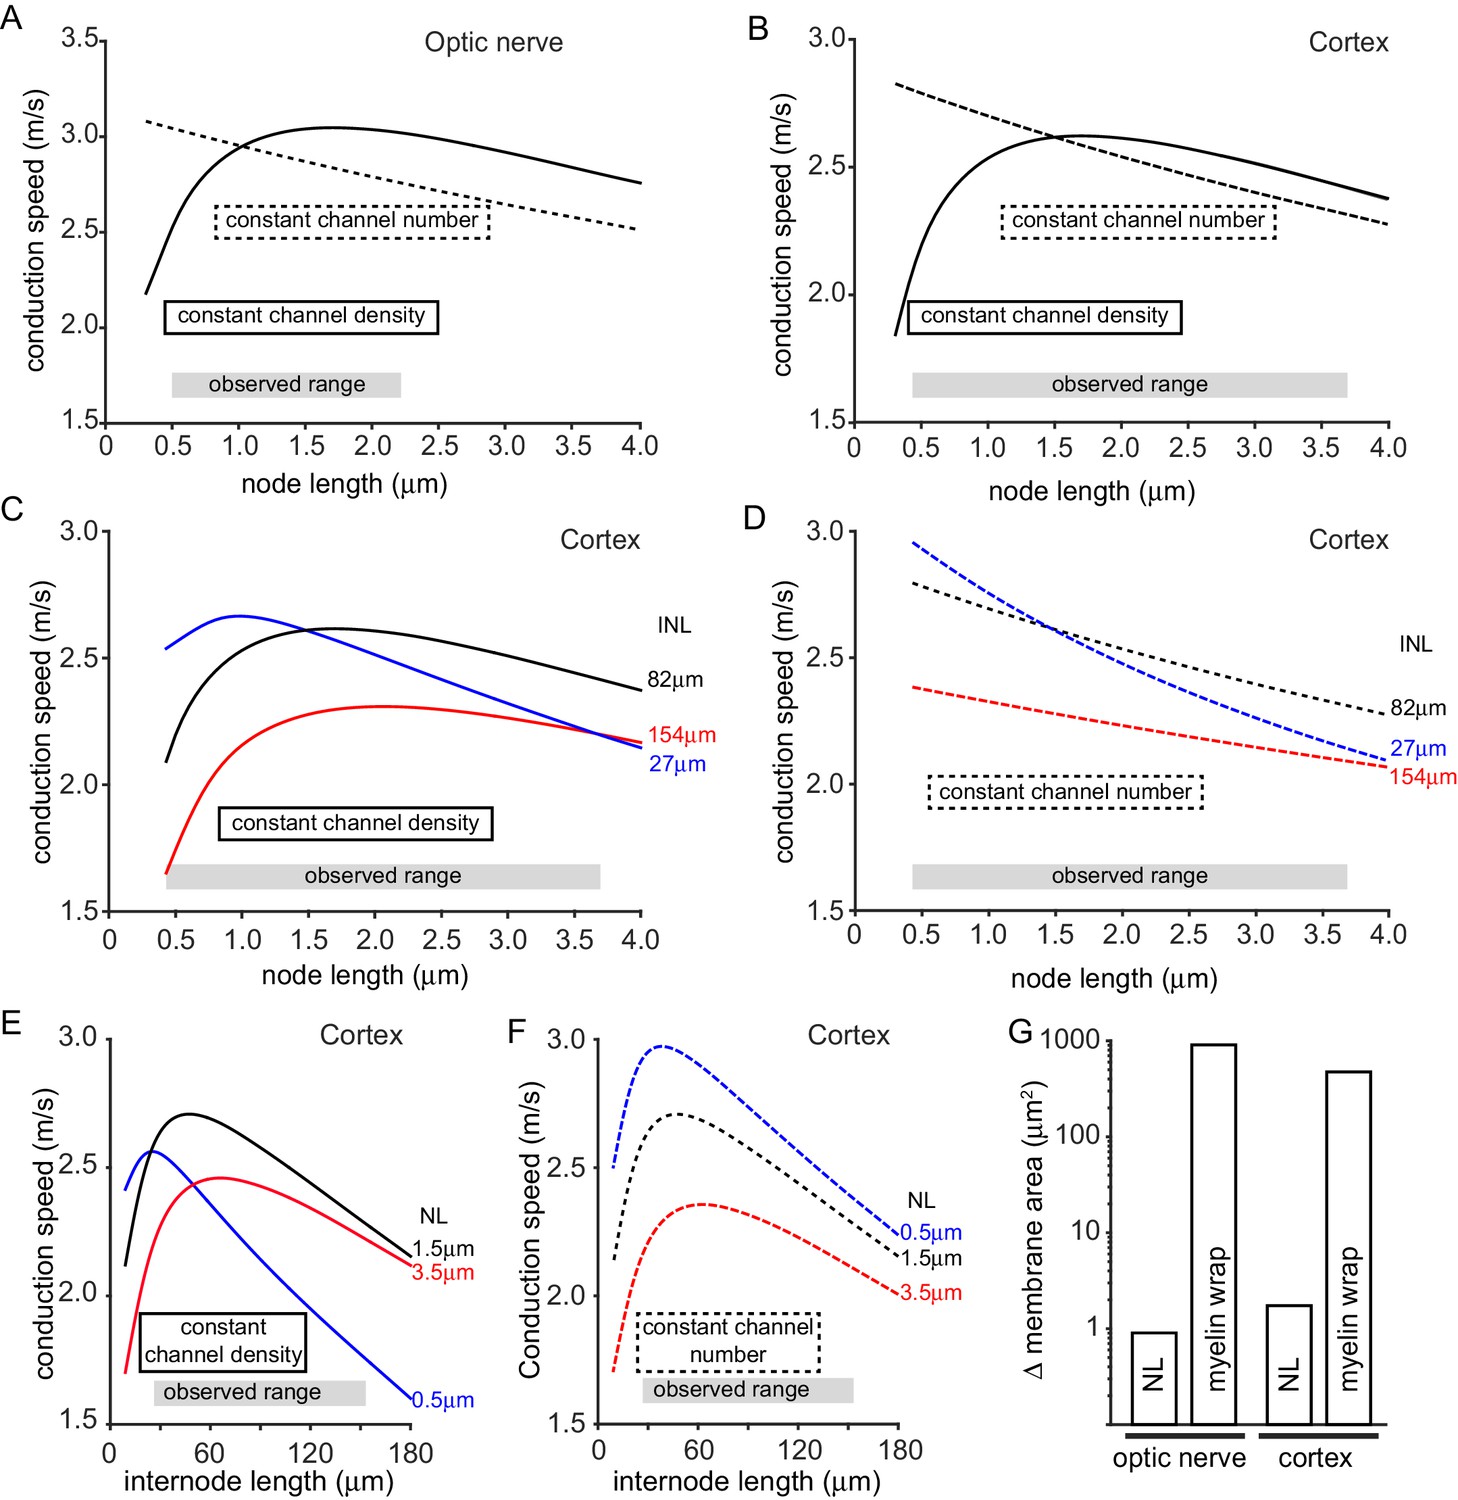
Predicted effect on conduction speed of different node lengths.
(A–F) Calculated conduction speed as a function of node length for axons in (A) the optic nerve and (B–F) the cortical grey matter. For panels A–F, simulations were carried out assuming either that the density of ion channels at the node is constant as the node length is changed (solid lines), or that the number of ion channels is kept constant (dashed lines) at the value assumed for the mean node length. (C–D) Simulations for cortex as in B but examining the effect of altering internode length (INL, given by each curve). (E–F) Calculated dependence of conduction speed of cortical axons on internode length for different assumed node lengths (NL). The observed range of each abscissa parameter is indicated on the graphs. (G). Change in membrane area needed, in the myelin sheath (myelin wrap) or node of Ranvier (node length, NL), to change the conduction speed by 8.6% in optic nerve or 10.5% in cortical axons, when nodal ion channel density is held constant (note logarithmic scale).
Tables
Table 1
Electrical and geometrical parameters of the models.
Parameter | Symbol | Value | Units |
|---|---|---|---|
Nodal Na+ conductance* | gNa | 3000 | mS/cm2 |
Nodal K+ conductance* | gKs | 80 | mS/cm2 |
Nodal persistent Na+ conductance* | gNap | 5 | mS/cm2 |
Leakage conductance Node* Internode | gL
|
80 0.1 |
mS/cm2 mS/cm2 |
Myelin membrane conductance | gmy | 1.0 | mS/cm2 |
Axon membrane capacitance† Node Internode |
cax
|
0.9 0.9 |
μF/cm2 μF/cm2 |
Myelin membrane capacitance†,‡ | cmy | 0.9 | μF/cm2 |
Axoplasmic resistivity | ρax | 70 | Ω.cm |
Periaxonal resistivity | ρp | 70 | Ω.cm |
Resting potential | Er | −82 | mV |
Leakage potential | ELk | −83.38 | mV |
Na+ reversal potential | ENa | 50 | mV |
K+ reversal potential | EK | −84 | mV |
Node diameter Optic nerve Cortex |
|
0.73 0.64 |
μm μm |
Node length Optic nerve Cortex |
|
1.02 1.50 |
μm μm |
Paranode length Optic nerve Cortex |
|
2.11 1.90 |
μm μm |
Paranodal effective periaxonal space Optic nerve Cortex |
|
0.0077 0.0123 |
nm nm |
Internodal axon diameter Optic nerve Cortex |
|
0.82 0.73 |
μm μm |
Internodal periaxonal space |
| 15 | nm |
G ratio Optic nerve Cortex |
|
0.78 0.81 |
|
Number of myelin wraps Optic nerve Cortex |
|
7 5 |
|
Internode length Optic nerve Cortex |
|
139.26 81.7 |
μm μm |
-
*Values for standard node length: 1.02 µm in optic nerve, 1.50 µm in cortex; these are constant for simulations with fixed nodal conductance density, but scaled inversely with node length for simulations where number of nodal channels is kept constant.
-
†Membrane capacitance values are from Gentet et al. (2000).
-
‡Figures are per myelin membrane. There are two membranes per myelin lamella.
Download links
A two-part list of links to download the article, or parts of the article, in various formats.
Downloads (link to download the article as PDF)
Open citations (links to open the citations from this article in various online reference manager services)
Cite this article (links to download the citations from this article in formats compatible with various reference manager tools)
Node of Ranvier length as a potential regulator of myelinated axon conduction speed
eLife 6:e23329.
https://doi.org/10.7554/eLife.23329


