Quantitative proteomics reveal proteins enriched in tubular endoplasmic reticulum of Saccharomyces cerevisiae
- College of Life Sciences, Nankai University, China
- ShanghaiTech University, China
- Huazhong University of Science and Technology, China
- Institue of Biophysics, Chinese Academy of Sciences, China
Figures
Figure 1 with 1 supplement
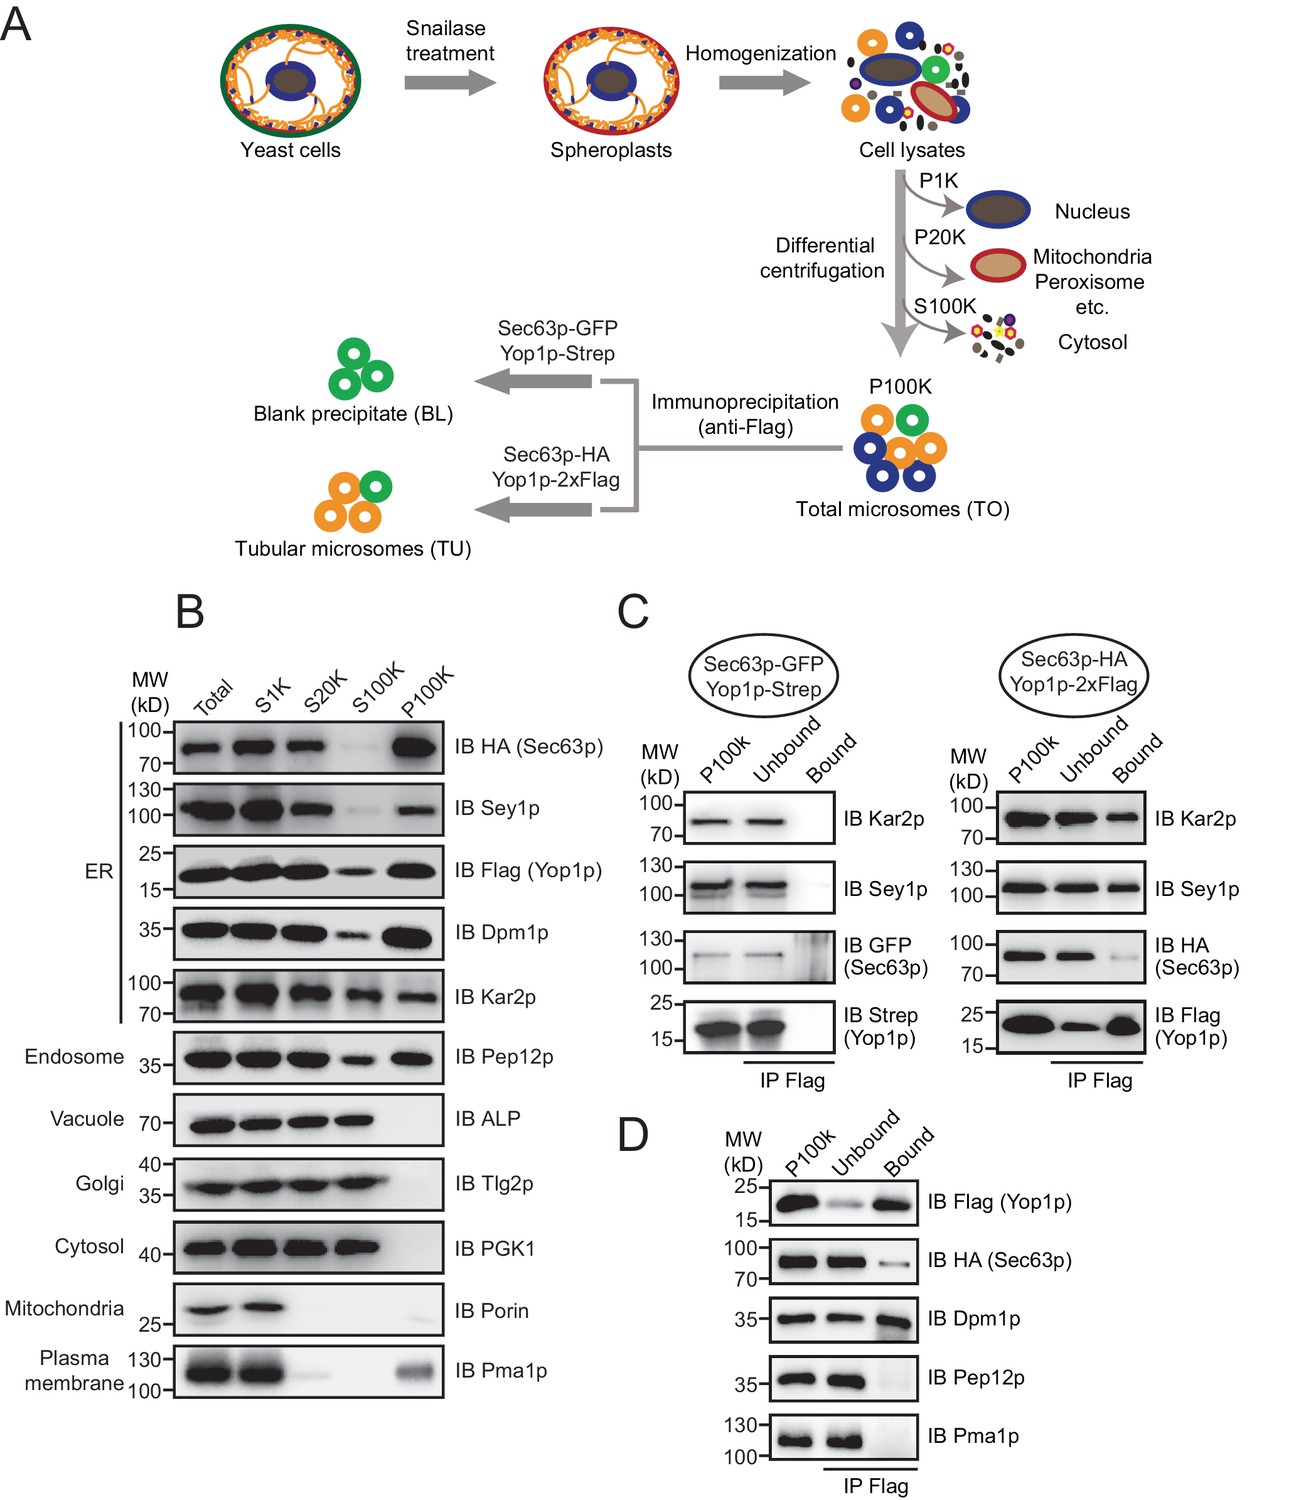
Immunoisolation of Yop1p-containing microsomes.
(A) Schematic diagram of tubular ER isolation. P1K, P20K, and P100K represent the pellets of solutions centrifuged at 1000 x g, 20,000 x g, and 100,000 x g, respectively. S100K is the supernatant of the solution centrifuged at 100,000 x g. (B) Microsome preparation by step centrifugation. Samples from each step were immunoblotted using the indicated antibodies. Total, total cell lysates; S1K, S20K, S100K, and P100K are defined as in (A). (C) Sec63p-GFP/Yop1p-Strep or Sec63p-HA/Yop1p-2xFlag was co-transformed into yeast cells. Microsomes were prepared and subsequent immunoprecipitation (IP) performed using anti-Flag agarose beads. The samples were analyzed by SDS/PAGE and immunoblotting (IB). (D) As in (C), but with the addition of other organelle makers. The data shown in B-D are representative of at least three repetitions.
Figure 1—figure supplement 1
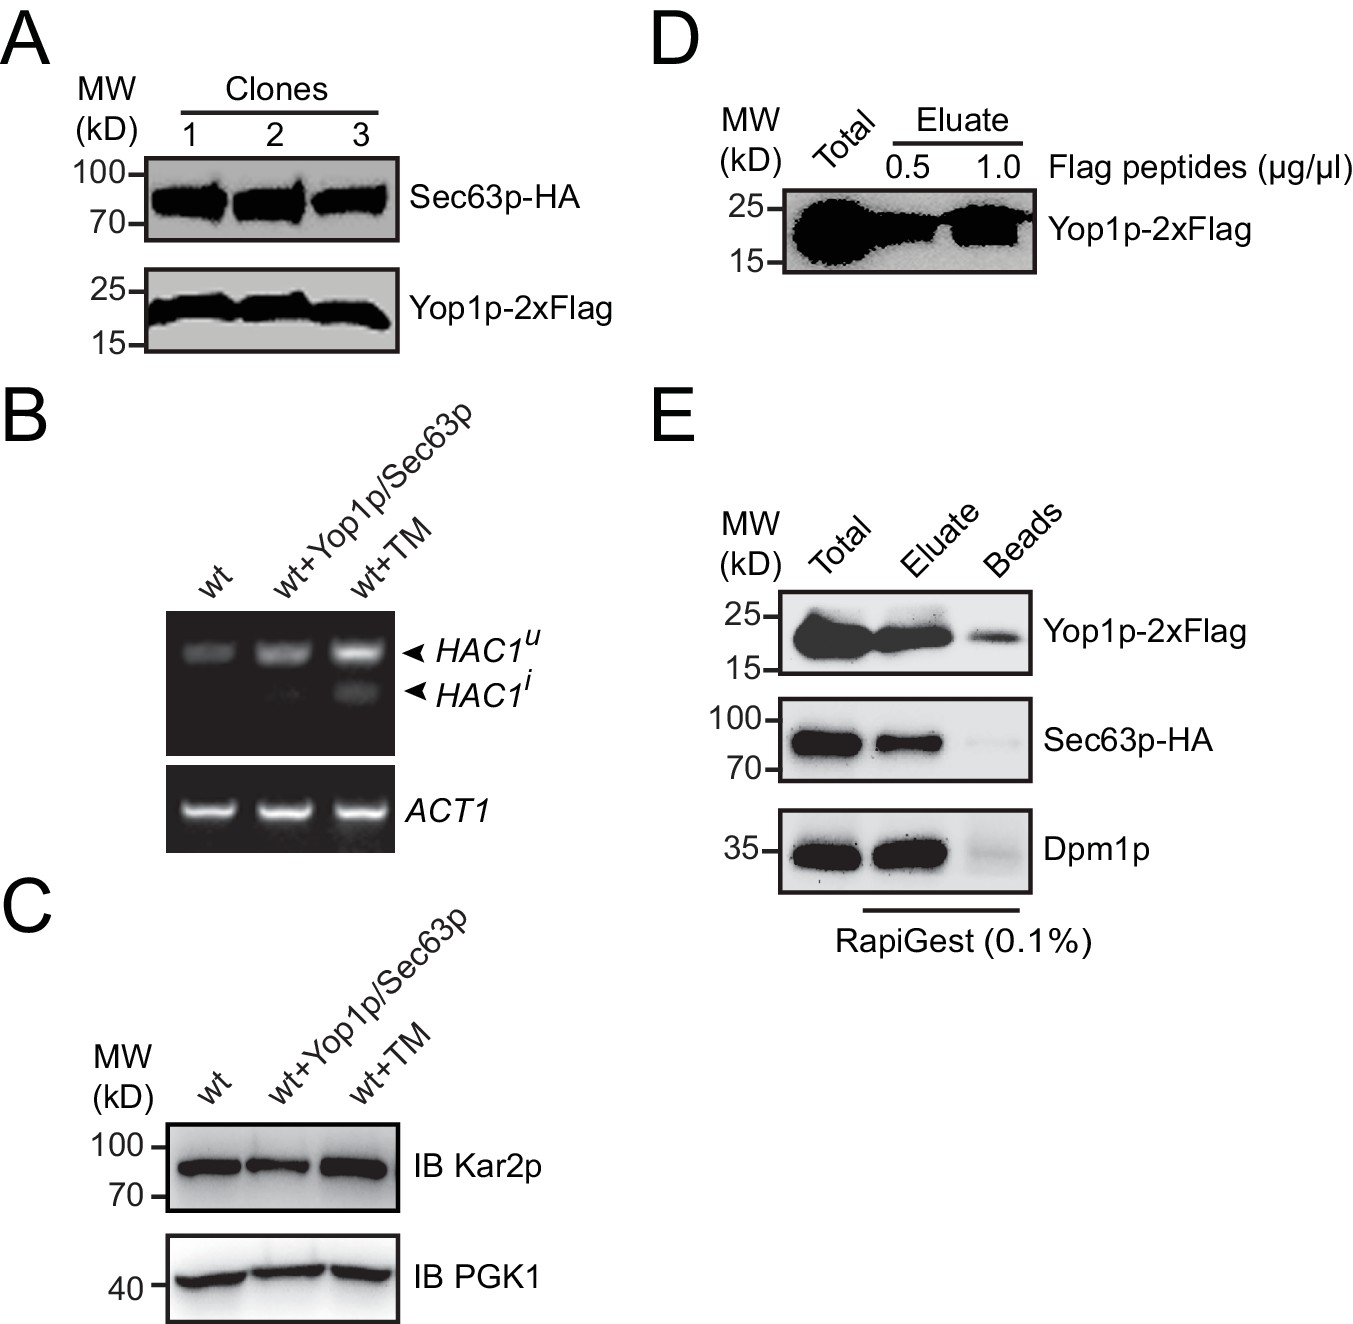
Protein expression and immunoprecipitated sample elution.
(A) HA-tagged Sec63p and Flag-tagged Yop1p were transformed into yeast cells with their endogenous promoter. Sec63p-HA and Yop1p-2xFlag levels were analyzed in three different clones by immunoblotting. (B) In cells with or without ectopic Yop1p and Sec63p expression, HAC1 mRNA was reverse transcribed and amplified by PCR. When indicated, tunicamycin (Tm) was added at 4 μg/mL for 1 hr. HAC1u, uninduced HAC1; HAC1i, induced HAC1. ACT1 was analyzed as an internal RNA control. (C) Kar2p levels were analyzed by immunoblotting cells tested in (B). PGK1 was used as a loading control. (D) Immunoprecipitated samples were eluted by Flag peptides and analyzed by Western blotting. The data are representative of three repetitions. (E) As in (D), but eluted by 0.1% RapiGest SF.
Figure 2 with 1 supplement
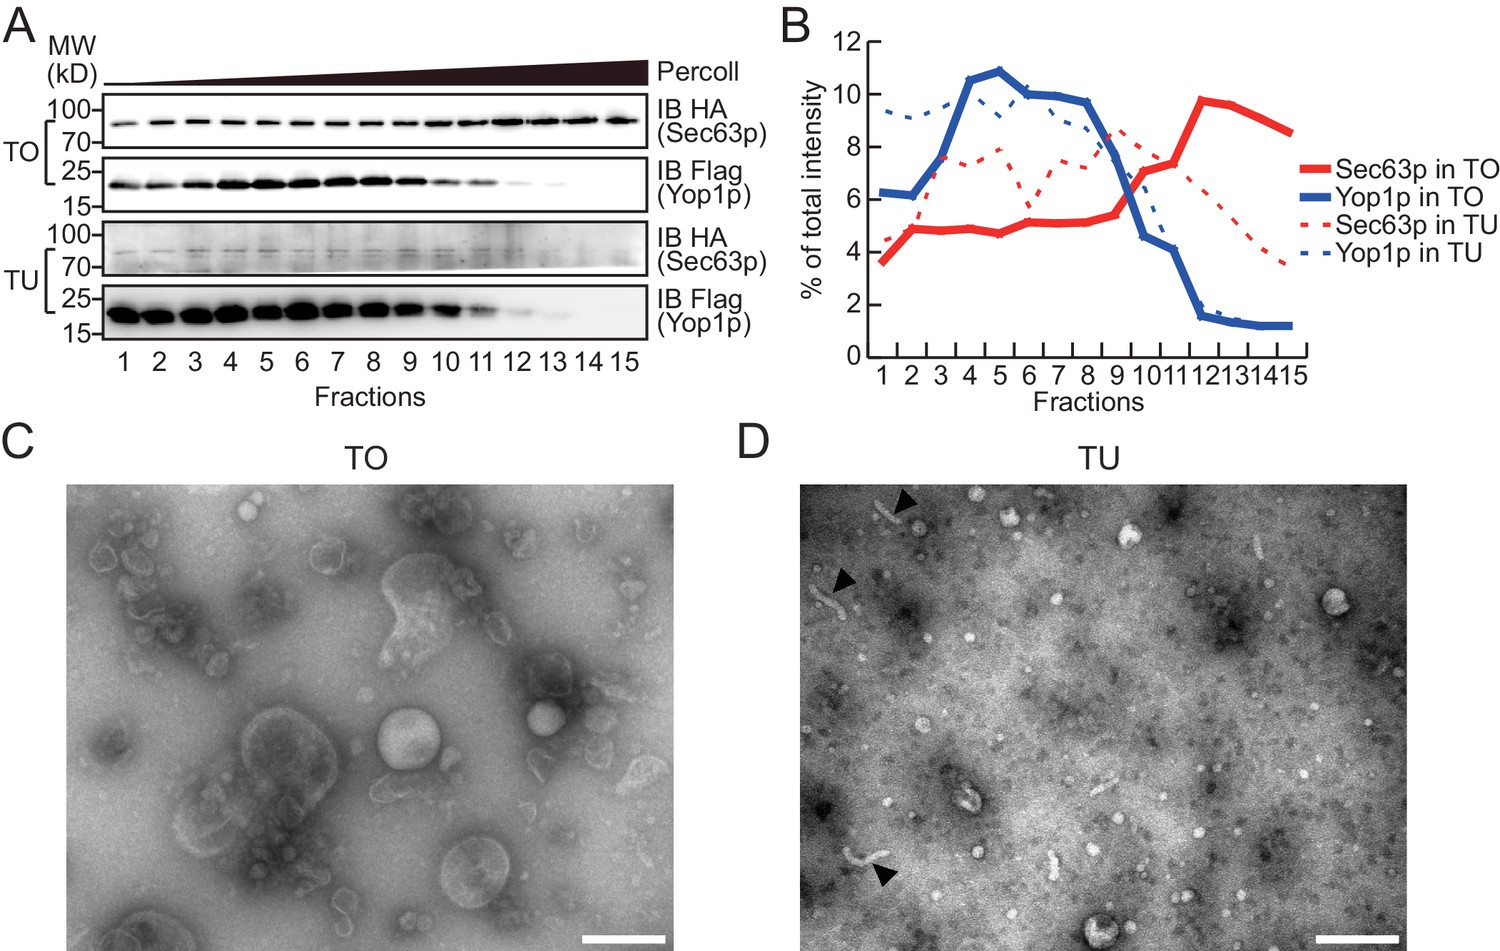
Density gradient of isolated microsomes.
(A) Total microsomes (TO) or tubular microsomes (TU) were layered on 30% Percoll solution. After centrifugation for 40 min, the fractions were analyzed by SDS/PAGE and immunoblotting performed with HA or Flag antibodies. (B) Quantification of the Western blot data from (A). The data are representative of three repetitions. (C) A TO sample was analyzed by negative-stain EM. Scale bar = 200 nm. (D) A TU sample was analyzed by negative-stain EM. Arrowheads indicate tubule-like structures. Scale bar = 200 nm.
Figure 2—figure supplement 1

Analysis of TO and TU samples by density gradients and EM.
(A and B) A repetition of experiments shown in Figure 2. (C) Silver staining of total proteins on the Percoll gradients shown in (A). Proteins distributed in the top (1), middle (2), and bottom (3) fractions of the gradient or uniformly across the gradient (4) are indicated.
Figure 3 with 1 supplement
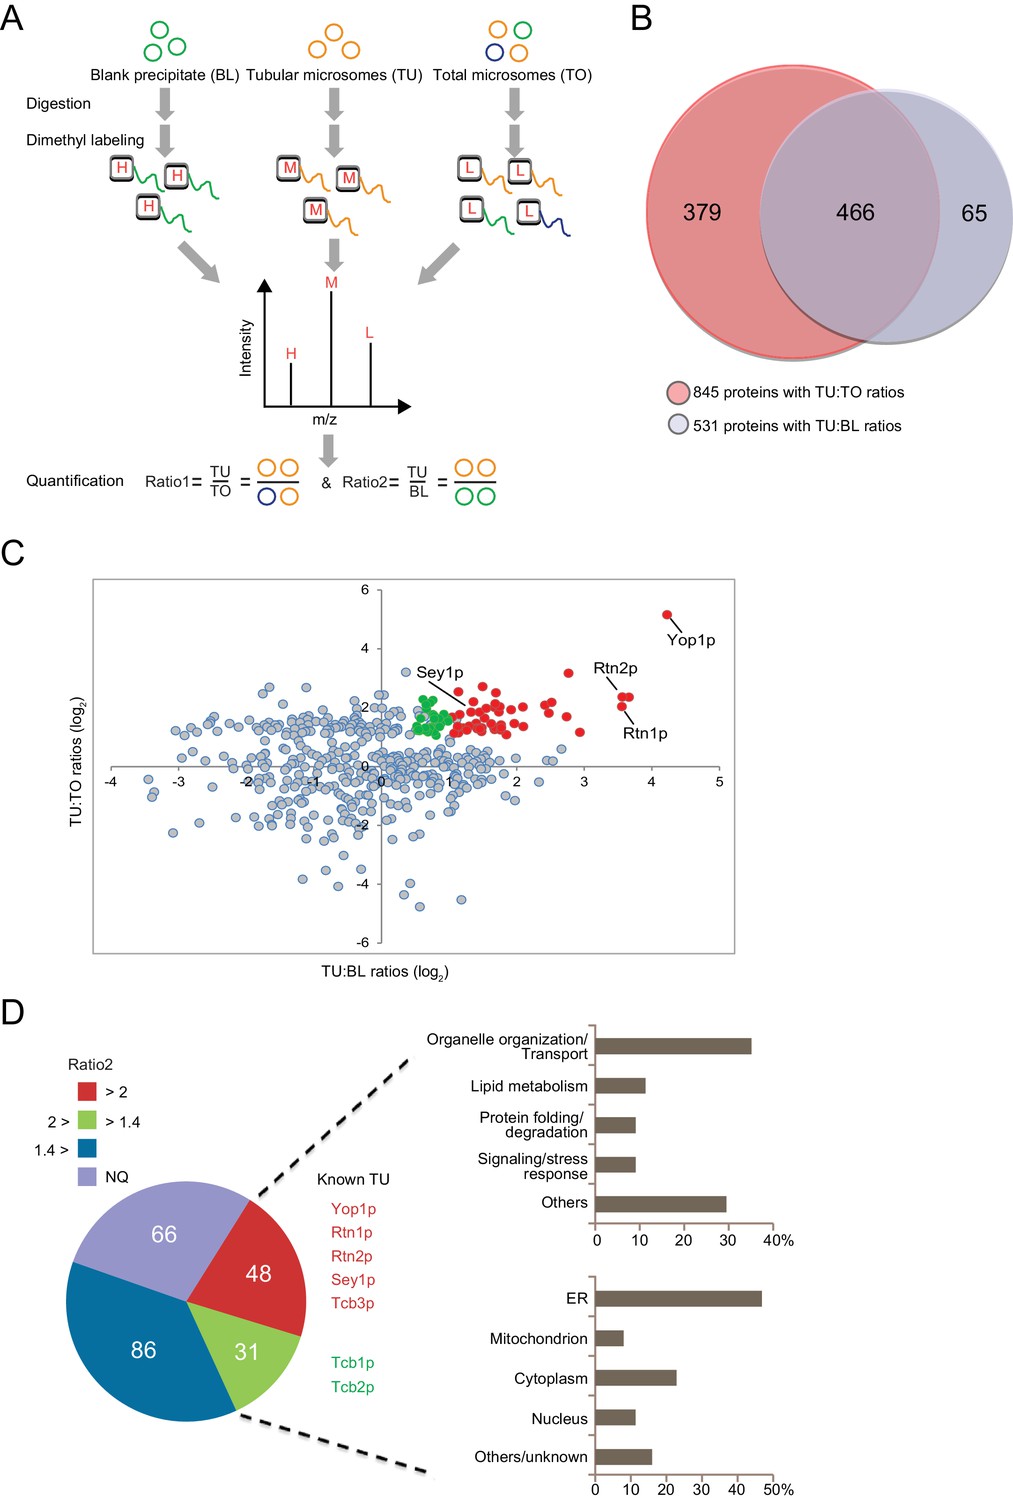
Proteomic analysis of ER tubule-enriched proteins.
(A) Workflow of the quantitative proteomic analysis using the dimethyl isotope labeling technique. H, M, and L represent different isotope labels. (B) Overlap of proteins with TU:TO ratios (red) and TU:BL ratios (blue). (C) Relative ratio distribution of 466 proteins shown in (B). Proteins with TU:TO > 2.0 (p<0.05) and TU:BL > 2.0 (p<0.05) are shown in red, proteins with TU:TO > 2.0 (p<0.05) and 2.0>TU:BL >1.4 (p<0.1) are in green, and the rest are in grey. Several known ER tubule proteins are labeled. (D) Classification of putative tubular ER proteins. The pie chart includes all proteins with TU:TO > 2.0 (p<0.05) according to the range and p-values of their TU:BL ratios. The red fraction includes proteins with TU:BL > 2.0 (p<0.05), the green fraction includes proteins with 1.4< TU:BL < 2.0 (p<0.1), the blue fraction includes proteins with TU:BL < 1.4 or p-values over the thresholds for the previous two fractions. NQ, not quantifiable from the isotope-labeling MS data. For 79 putative tubular ER proteins (in the red and green regions), categorization of their major biological processes and cellular localization is shown in the upper and lower right, respectively.
-
Figure 3—source data 1
Protein and peptide identification.
- https://doi.org/10.7554/eLife.23816.007
-
Figure 3—source data 2
Data summary for TU:TO and TU:BL measurements.
- https://doi.org/10.7554/eLife.23816.008
-
Figure 3—source data 3
GO classification of putative tubular ER proteins.
- https://doi.org/10.7554/eLife.23816.009
-
Figure 3—source data 4
List of proteins with TU:TO > 2 (p<0.05) but TU:BL not quantifiable (NQ).
- https://doi.org/10.7554/eLife.23816.010
Figure 3—figure supplement 1
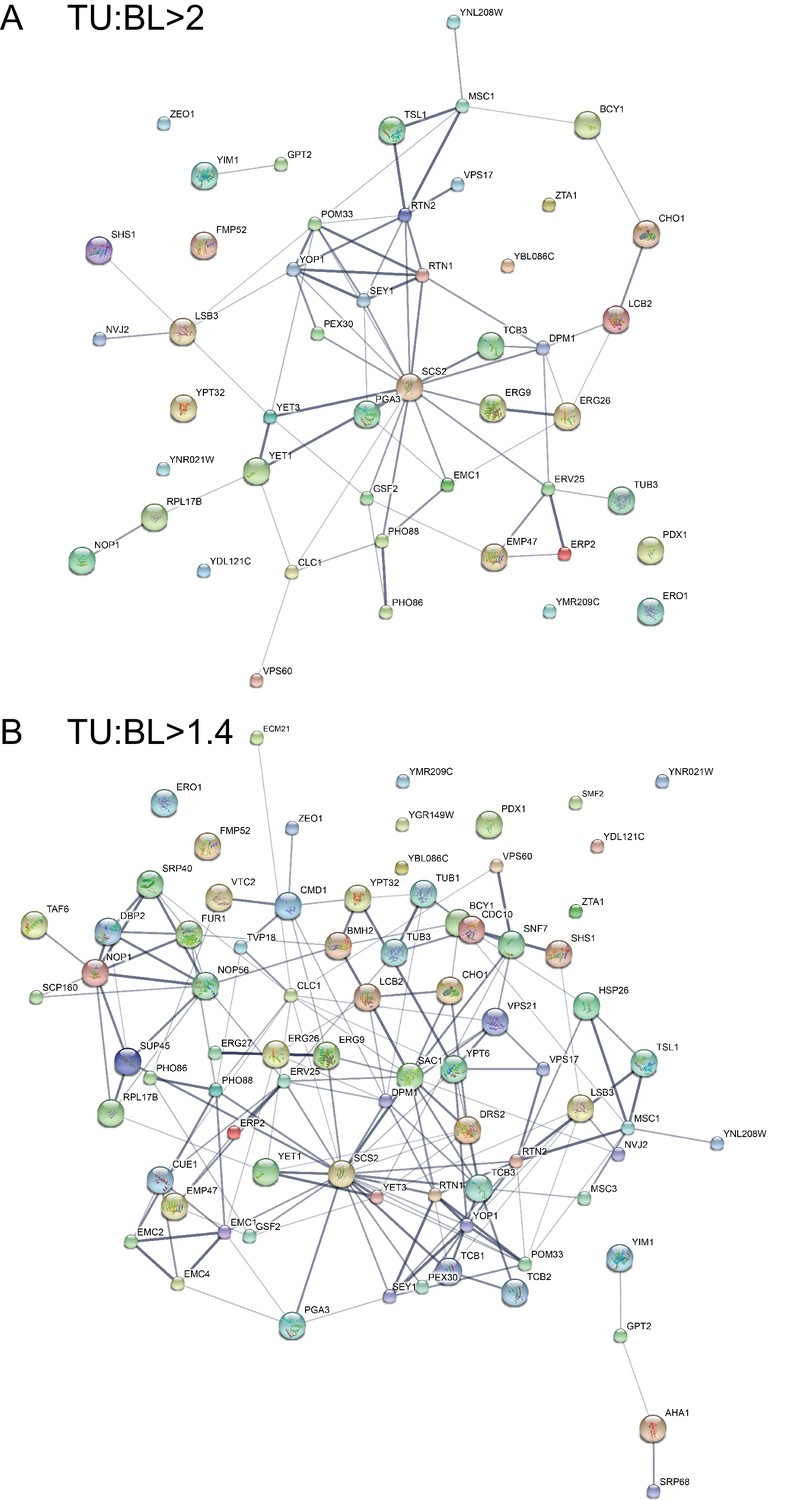
Protein-protein interaction map for the putative tubular ER components using the STRING database.
https://doi.org/10.7554/eLife.23816.011
Figure 4 with 4 supplements
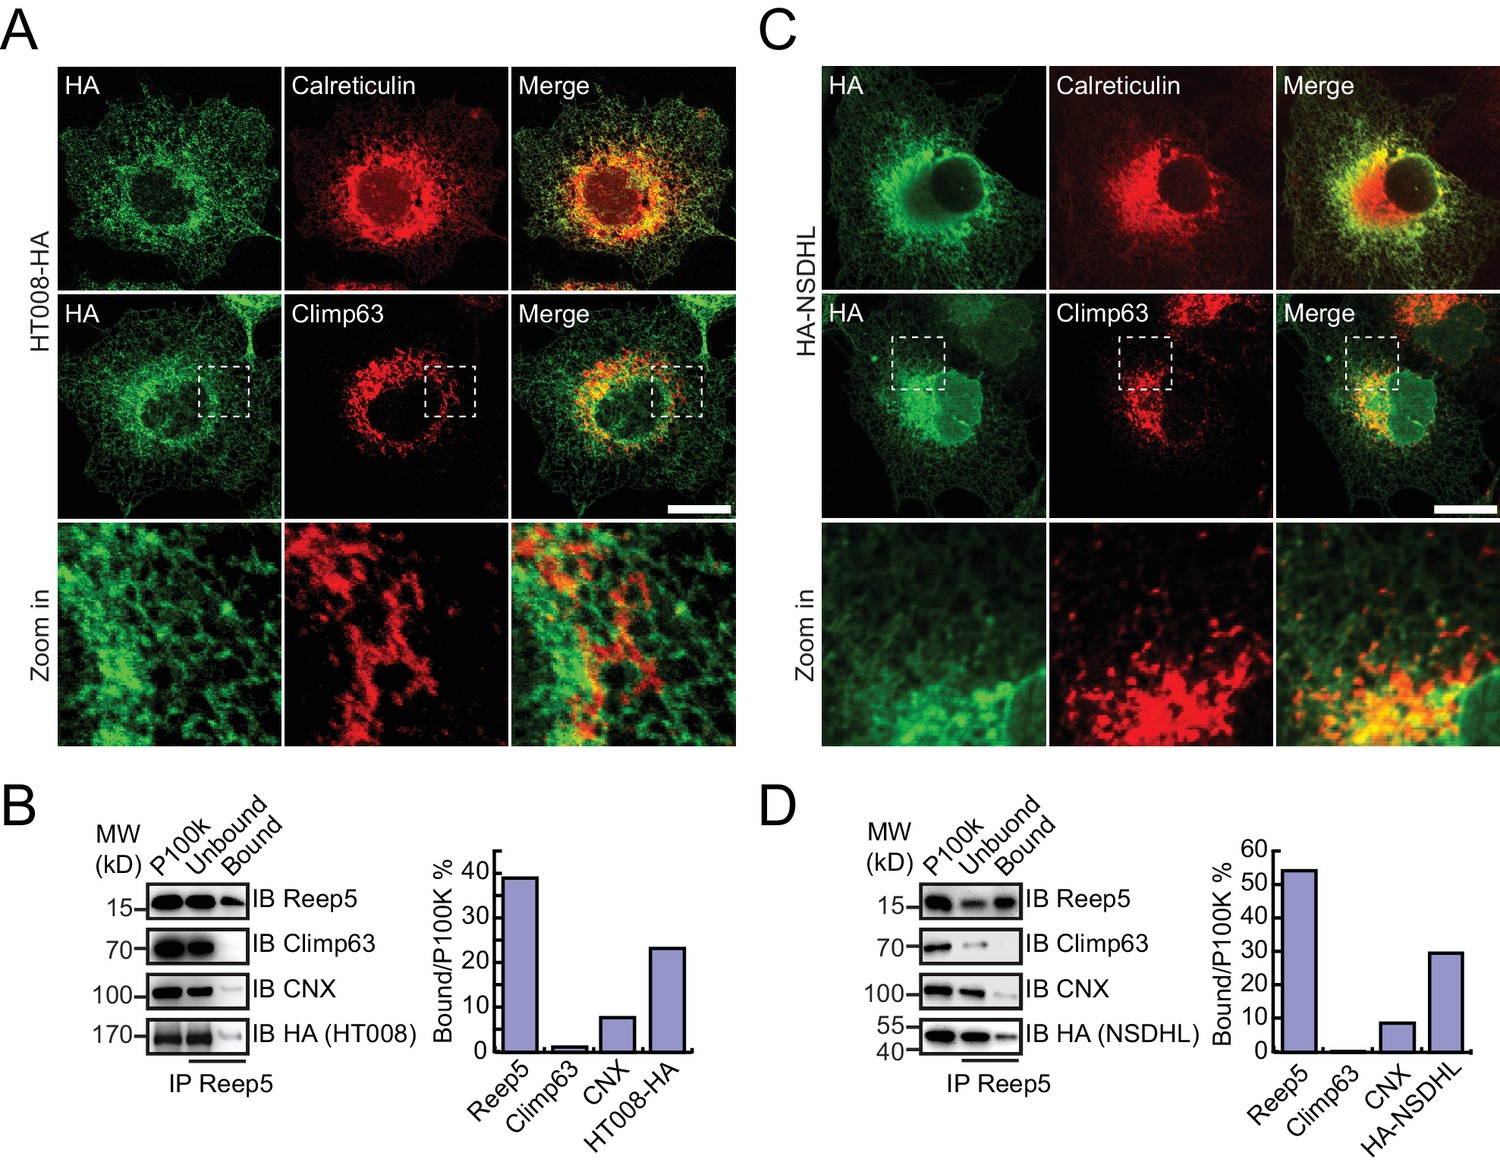
Verification of tubular ER candidates in mammalian cells.
(A) HA-tagged HT008 was transfected into COS-7 cells. Localization was investigated using anti-HA antibodies (green) and compared to total ER protein (calreticulin, red) or ER protein sheets (climp63, red) by indirect immunofluorescence and confocal microscopy. Bottom: enlargements of the boxed regions. Scale bars = 20 μm. (B) HA-tagged HT008 was transfected into HeLa cells. Microsomes were isolated and immunoprecipitation performed with anti-REEP5 antibodies. The samples were analyzed by SDS/PAGE and immunoblotting (left). Quantitative results (right) were obtained based on the Western blot results and analyzed by Image J. The data are representative of at least three repetitions. CNX, calnexin. (C) As in (A), but with HA-NSDHL. (D) As in (B), but with HA-NSDHL.
Figure 4—figure supplement 1
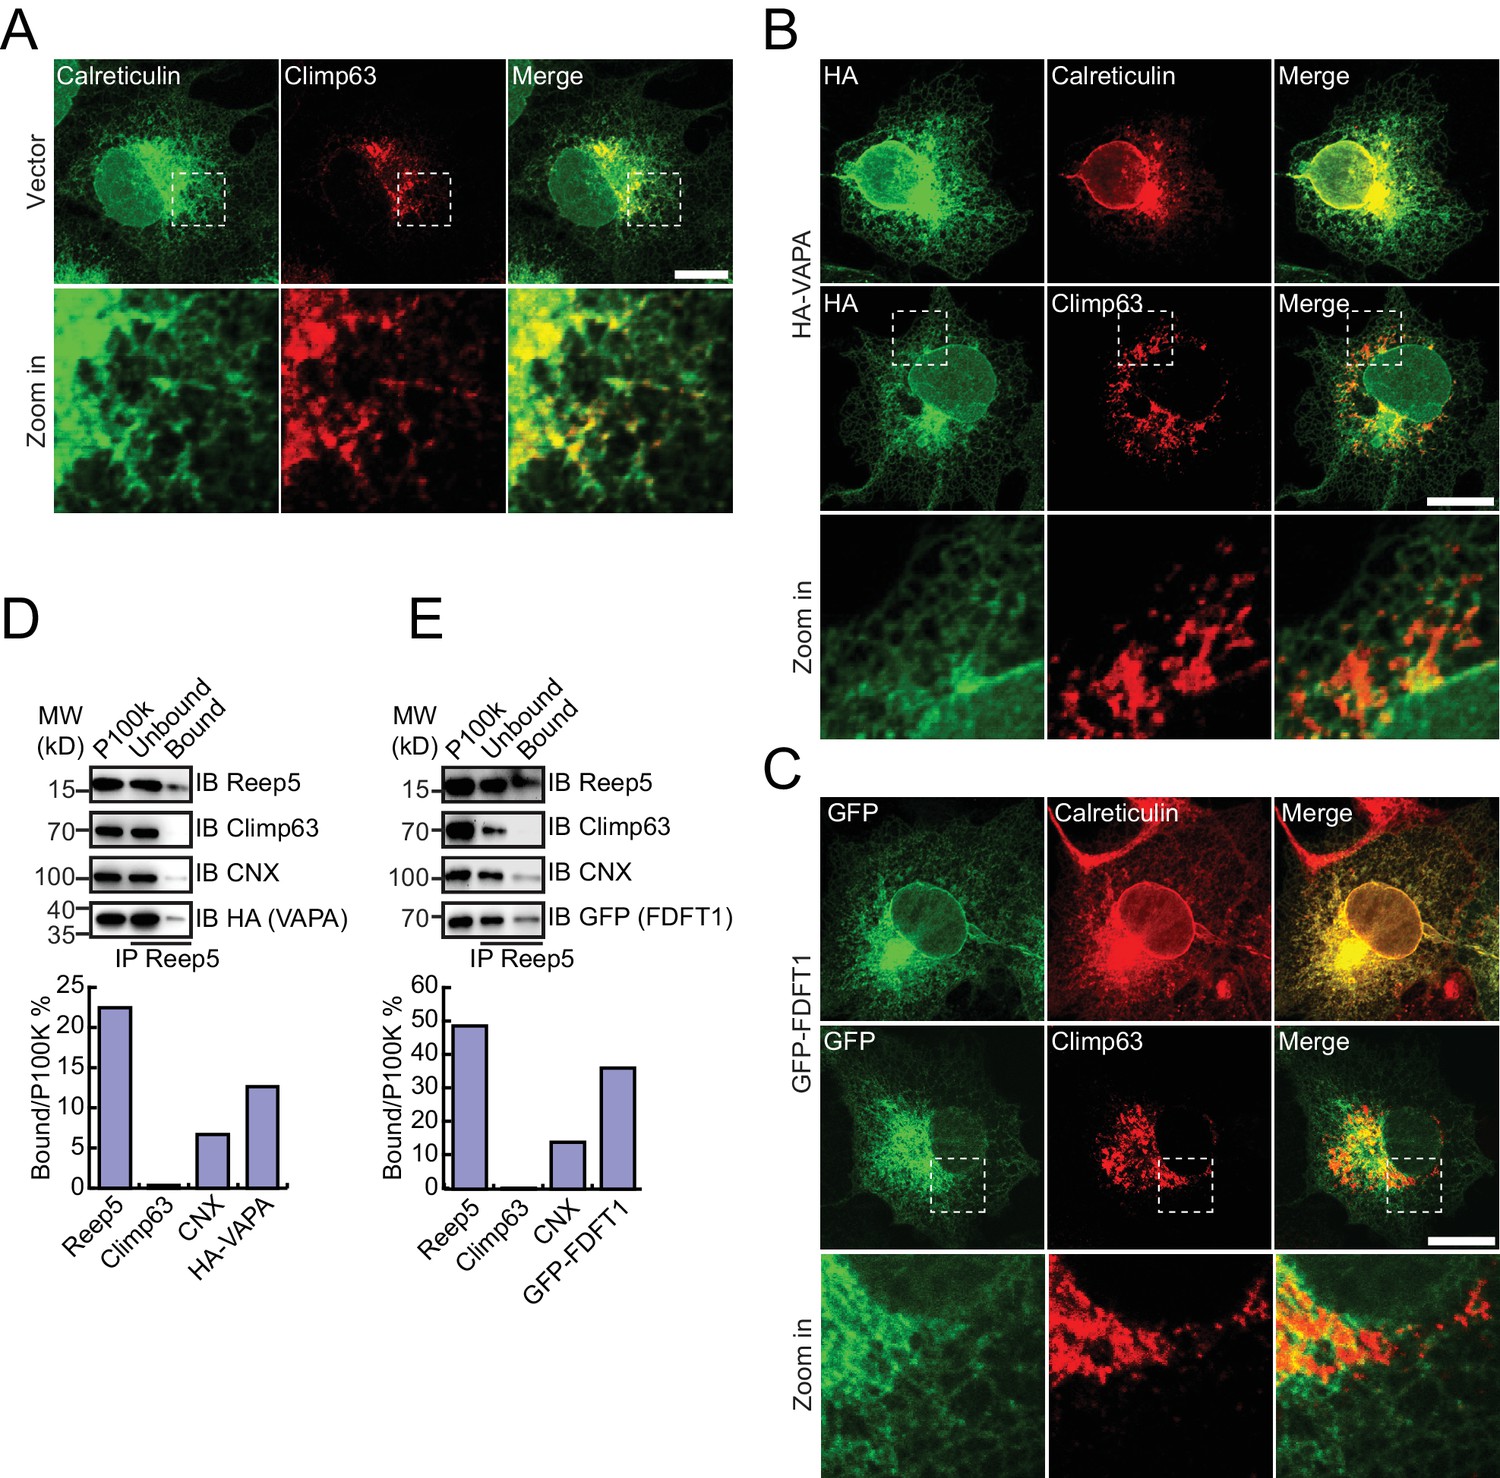
Verification of tubular ER candidates.
(A) Localization of endogenous total ER protein (calreticulin, green) and ER protein sheets (climp63, red) was determined by indirect immunofluorescence and confocal microscopy. Bottom: enlargements of the boxed regions. (B and C) HA-tagged proteins were expressed in COS-7 cells. Localization was measured using anti-HA antibodies (green) and compared to calreticulin (red) or climp63 (red). Scale bars = 20 μm. (D and E) Immunoprecipitated tubular ER fractions were analyzed by immunoblotting (top) and the signal intensity quantified (bottom). The data are representative of three repetitions. CNX, calnexin.
Figure 4—figure supplement 2
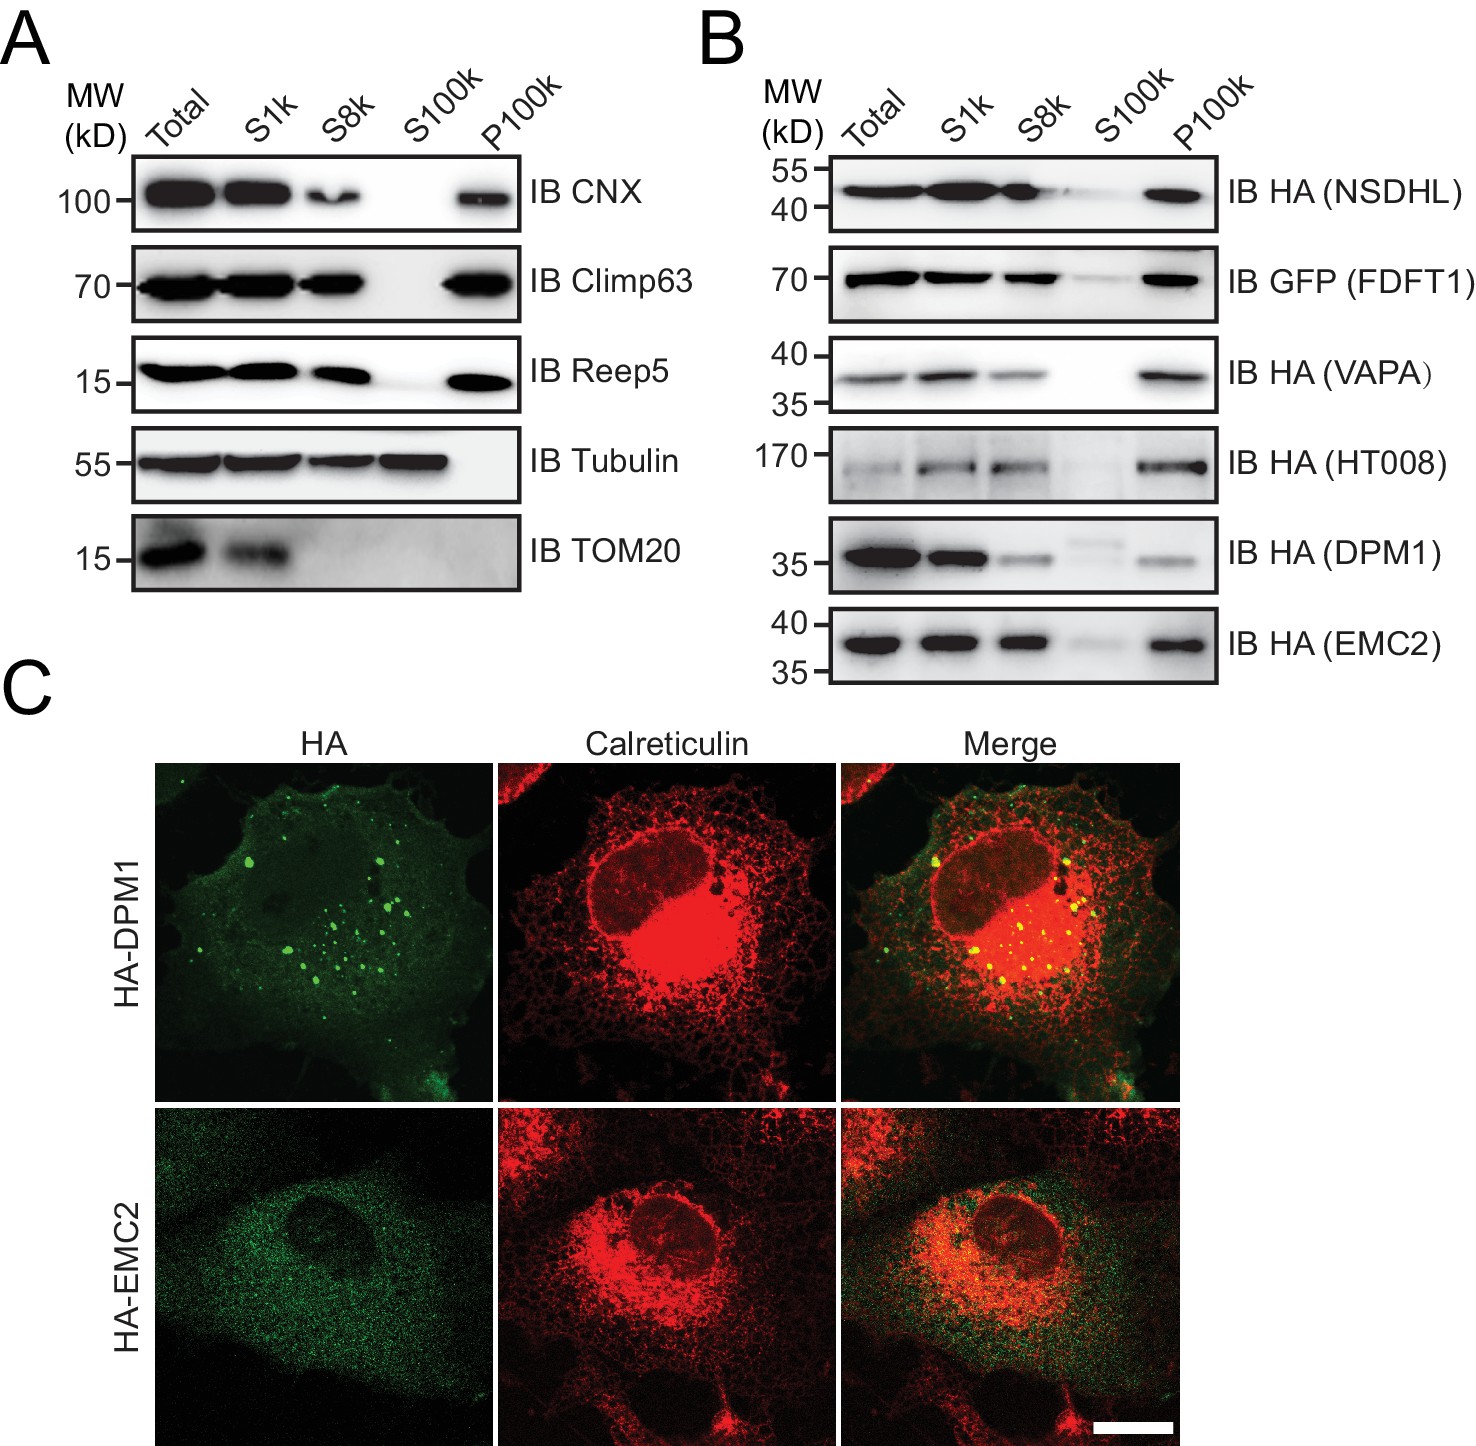
Cytosolic proteins associated with the ER.
(A and B) Microsome preparation by step centrifugation. Wild-type (A) or candidate-transfected (B) HeLa cells were collected and processed to yield microsomes. The data are representative of at least three repetitions. CNX, calnexin, total ER protein; TOM20, mitochondrial membrane protein; HA or GFP, tested proteins. (C) HA-tagged proteins were expressed in COS-7 cells. Localization was investigated using anti-HA antibodies (green) and compared to total ER protein (calreticulin, red) by indirect immunofluorescence. Scale bars = 20 μm.
Figure 4—figure supplement 3
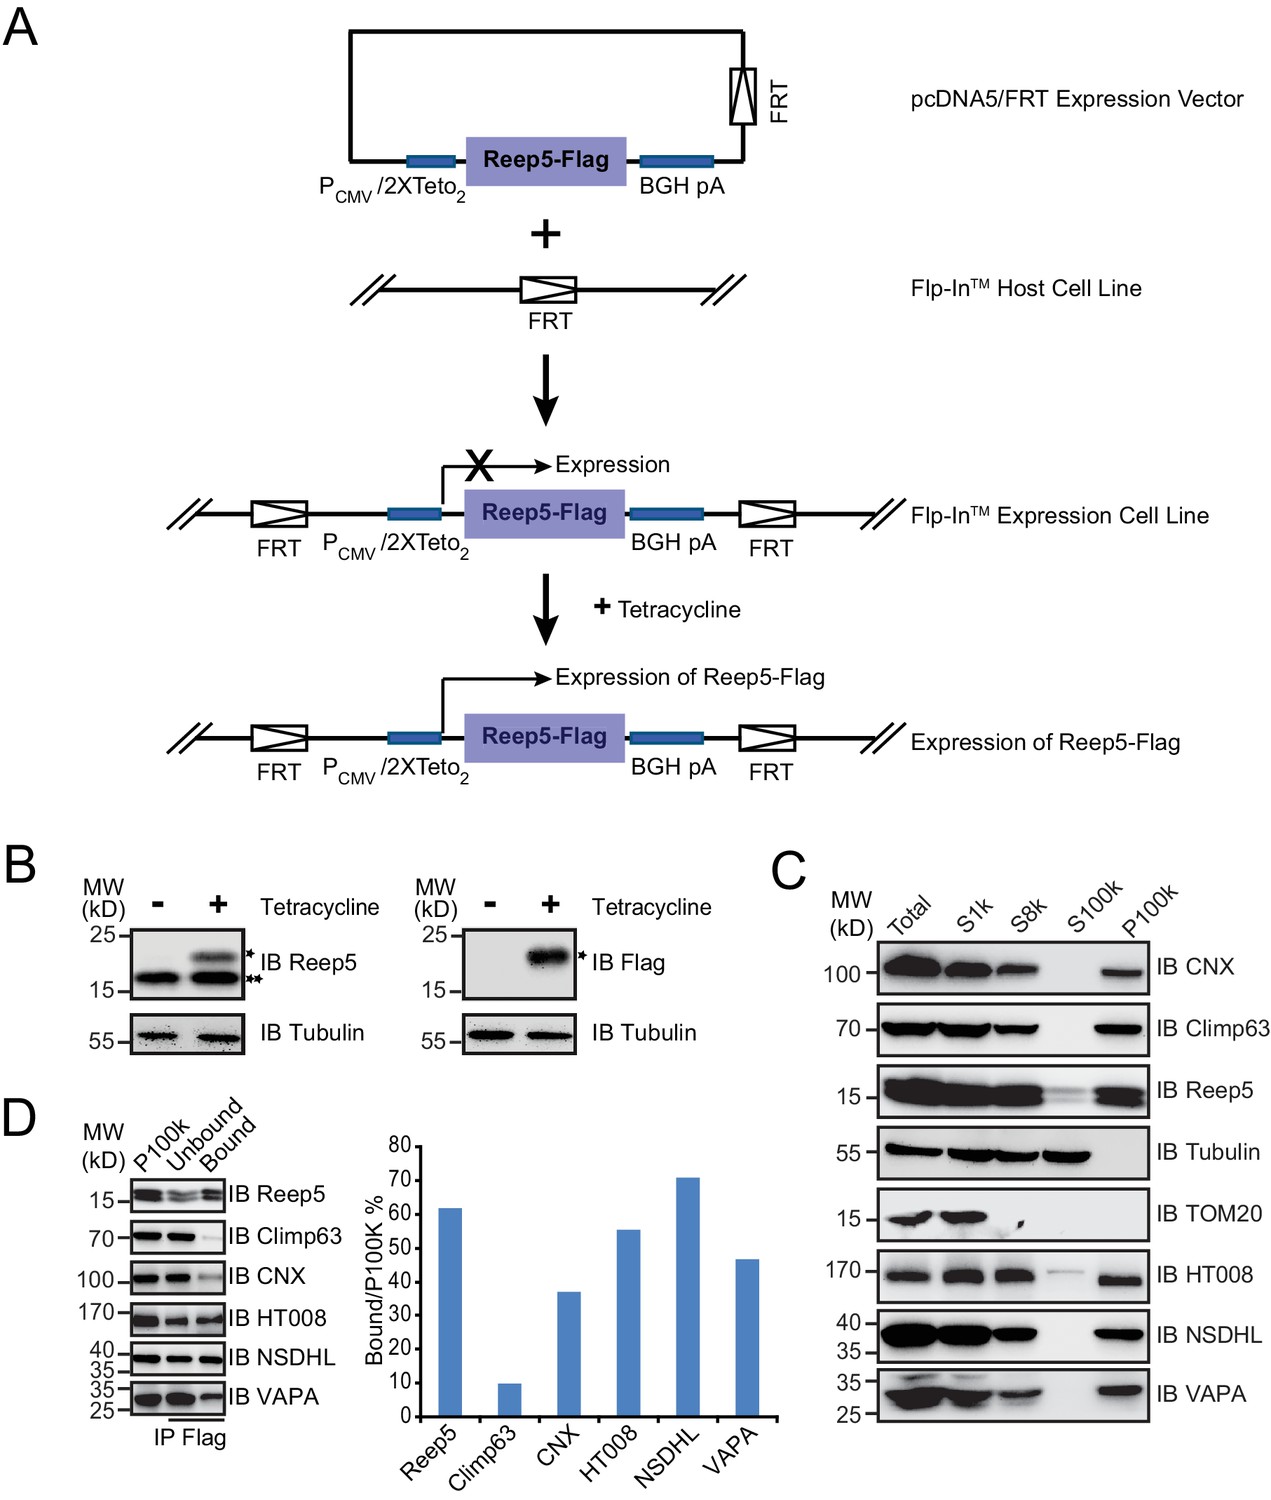
Verification of endogenous tubular ER candidates using Flp-In cell lines.
(A) Schematic diagram of the generation of a stable cell line with inducible REEP5-Flag expression. (B) The Flp-In cell line was treated with or without 0.1 µg/mL tetracycline for 24 hr. The expression of total REEP5 or induced REEP5-Flag was verified by immunoblotting (IB) using anti-REEP5 or anti-Flag antibodies. *REEP5-Flag, **endogenous REEP5. (C) Mammalian microsome preparation using cells expressing REEP5 was performed by step centrifugation. Samples from each step were immunoblotted using the indicated antibodies. The data are representative of at least three repetitions. (D) Immunoprecipitated tubular ER fractions were analyzed by immunoblotting (left) and the signal intensity quantified (right). The data are representative of three repetitions.
Figure 4—figure supplement 4
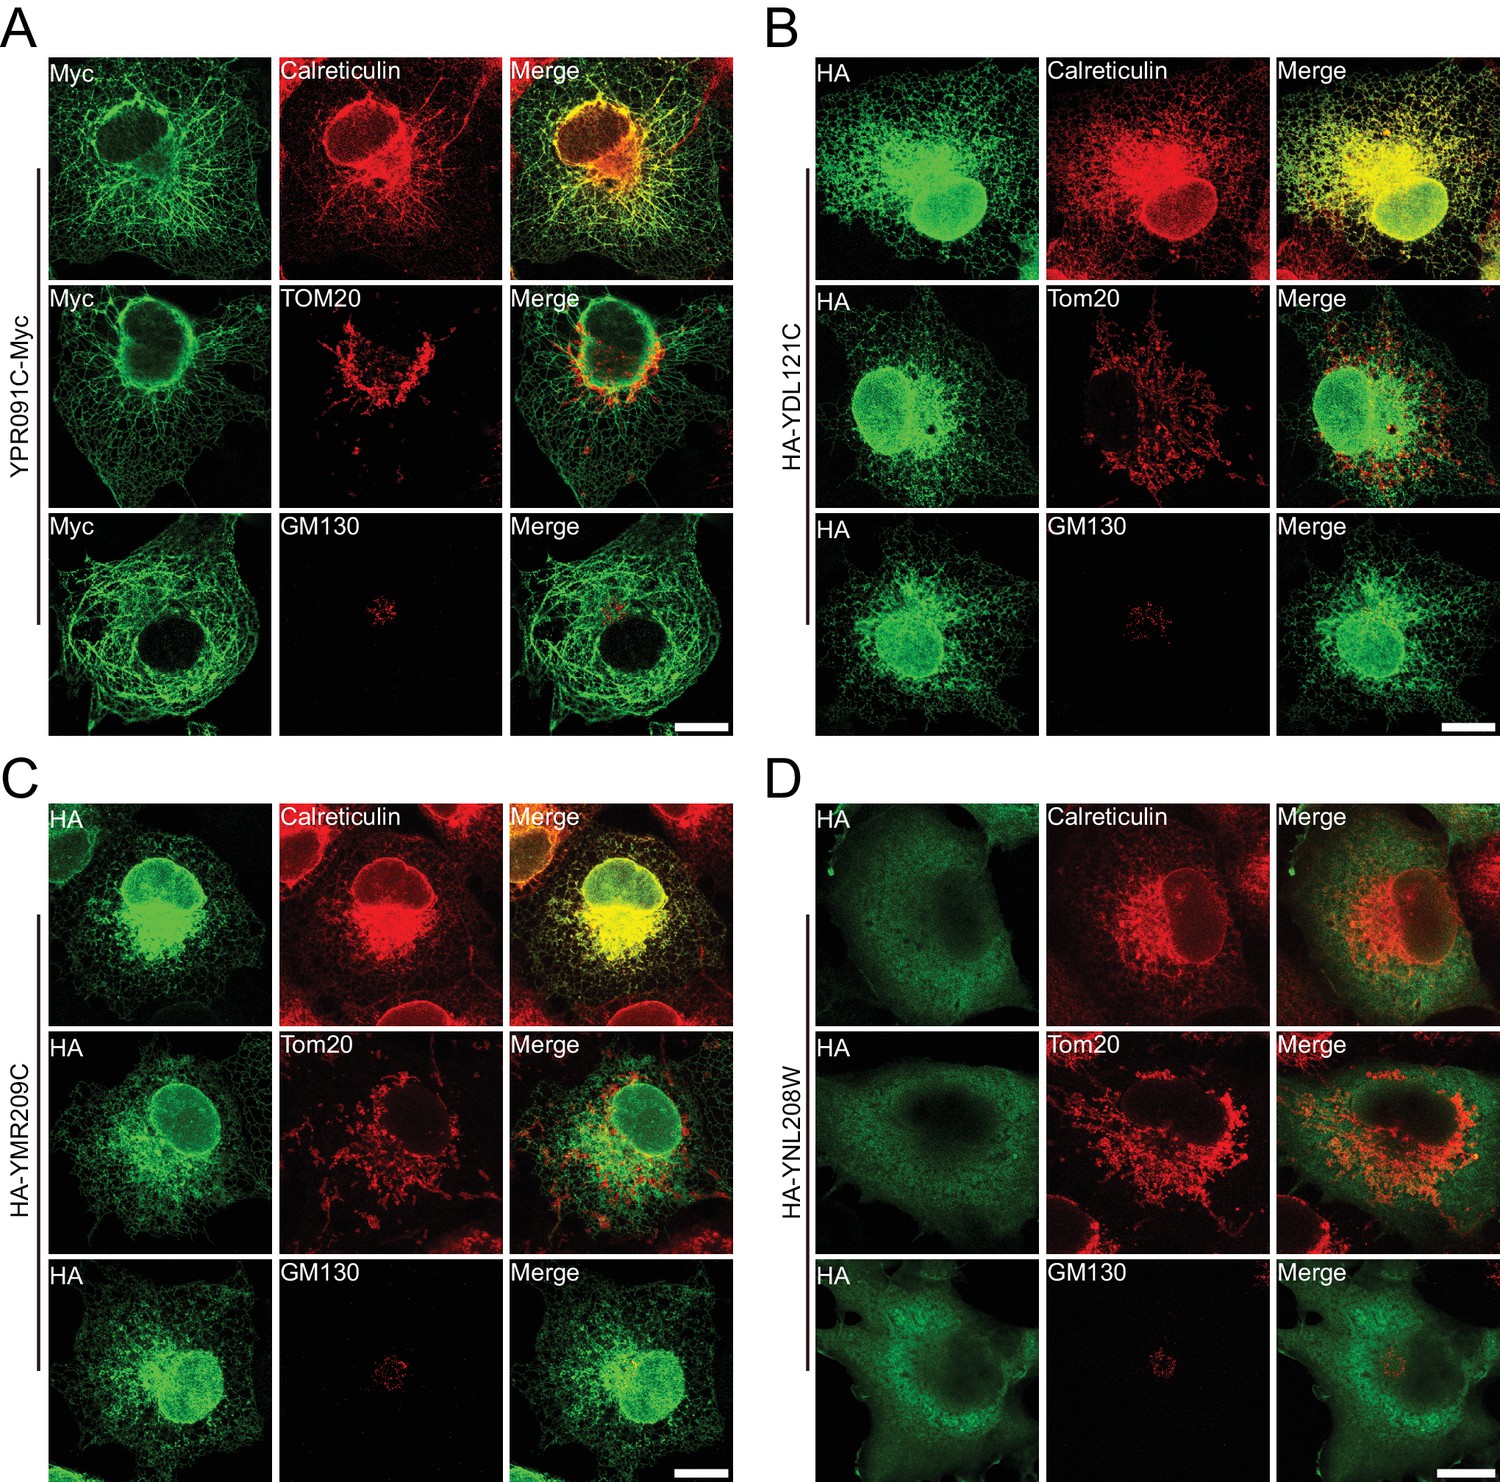
Verification of uncharacterized proteins in mammalian cells.
Uncharacterized yeast proteins were heterogeneously expressed in COS-7 cells and investigated by indirect immunofluorescence. (A) YPR091C, (B) YDL121C, and (C) YMR209C are ER proteins; (D) YNL208W is cytosolic. Calreticulin, total ER protein; TOM20, mitochondrial membrane protein; GM130, Golgi protein. Scale bars = 20 μm.
Tables
Table 1
Candidates selected for verification in mammalian cells.
| Yeast | Human | Description* |
|---|---|---|
| NVJ2 (YPR091C) | HT008 | Lipid-binding ER protein, enriched at nucleus-vacuolar junctions; may be involved in sterol metabolism or signaling. |
| ERG26 | NSDHL | ERGosterol biosynthesis, catalyzes the second of three steps required to remove two C-4 methyl groups from an intermediate in ergosterol biosynthesis. |
| ERG9 | FDFT1 | ERGosterol biosynthesis, squalene synthase; joins two farnesyl pyrophosphate moieties to form squalene in the sterol biosynthesis pathway. |
| SCS2 | VAPA | Integral ER membrane protein, regulates phospholipid metabolism; one of 6 proteins (Ist2p, Scs2p, Scs22p, Tcb1p, Tcb2p, Tcb3p) that connect ER to plasma membrane (PM) and regulate PI4P levels. |
| DPM1 | DPM1 | Dolichol phosphate mannose synthase of ER membrane; required for biosynthesis of glycosyl phosphatidylinositol (GPI) membrane anchor, as well as O-mannosylation and protein N- and O-linked glycosylation. |
| EMC2 | EMC2 | Member of conserved ER transmembrane complex; required for efficient folding of proteins in the ER. |
-
*From the Saccharomyces Genome Database (SGD).
Download links
A two-part list of links to download the article, or parts of the article, in various formats.
Downloads (link to download the article as PDF)
Open citations (links to open the citations from this article in various online reference manager services)
Cite this article (links to download the citations from this article in formats compatible with various reference manager tools)
Quantitative proteomics reveal proteins enriched in tubular endoplasmic reticulum of Saccharomyces cerevisiae
eLife 6:e23816.
https://doi.org/10.7554/eLife.23816


