Fail-safe control of translation initiation by dissociation of eIF2α phosphorylated ternary complexes
- The University of Manchester, United Kingdom
Figures
Figure 1
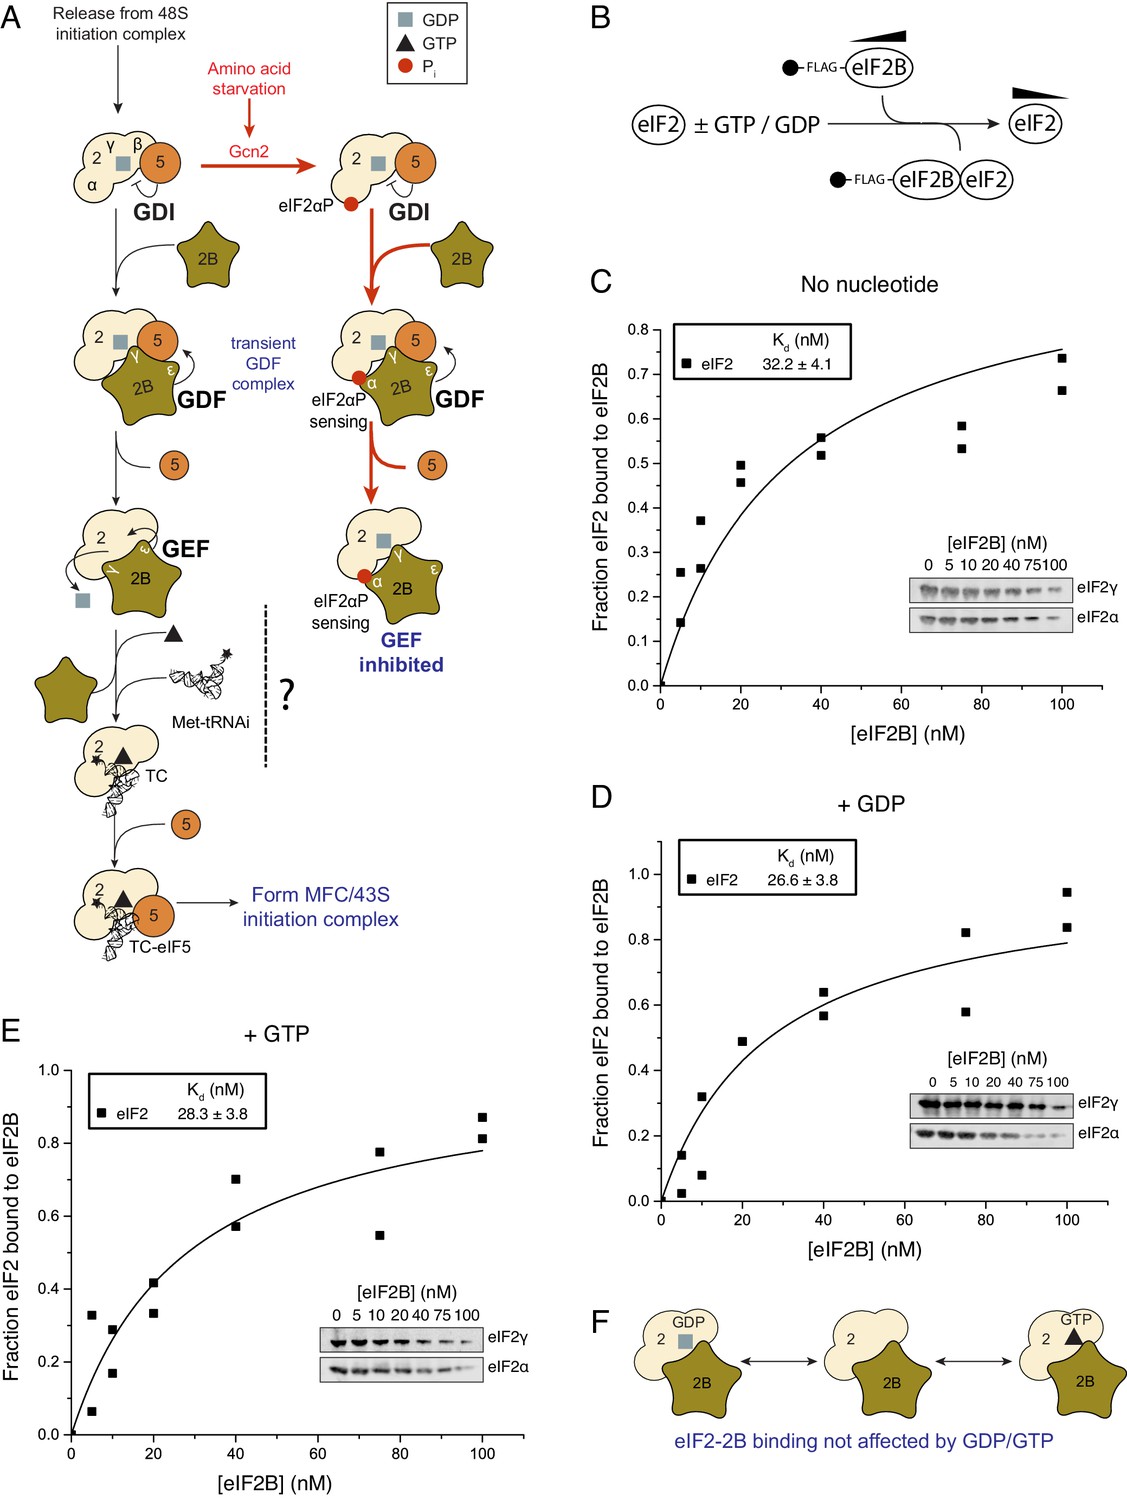
eIF2 affinity for eIF2B is unaffected by guanine nucleotides.
(A) Current model for eIF2 activation and inhibition by phosphorylated eIF2. Interactions and activities are explained in the introduction. (B). Overview of eIF2/eIF2B equilibrium binding assay. (C–E). Affinity determined by mixing 2 nM eIF2 with increasing concentrations of eIF2B immobilised on anti-Flag resin. Flag resin was pelleted and the eIF2 remaining in each supernatant fraction was resolved by SDS-PAGE and immunoblotted with two eIF2 subunit antibodies (inset, eIF2α and eIF2γ). Fraction bound at equilibrium was determined by quantification: total (lane 0 nM eIF2B) minus fraction remaining in the supernatant (graphs) and used calculate the dissociation constants (nM ± standard error (SE)) indicated. Assays were done either without nucleotide (C) or in the presence of either 1 mM GDP (D) or 1 mM GTP (E). (F). Cartoon of figure conclusion.
Figure 2 with 2 supplements
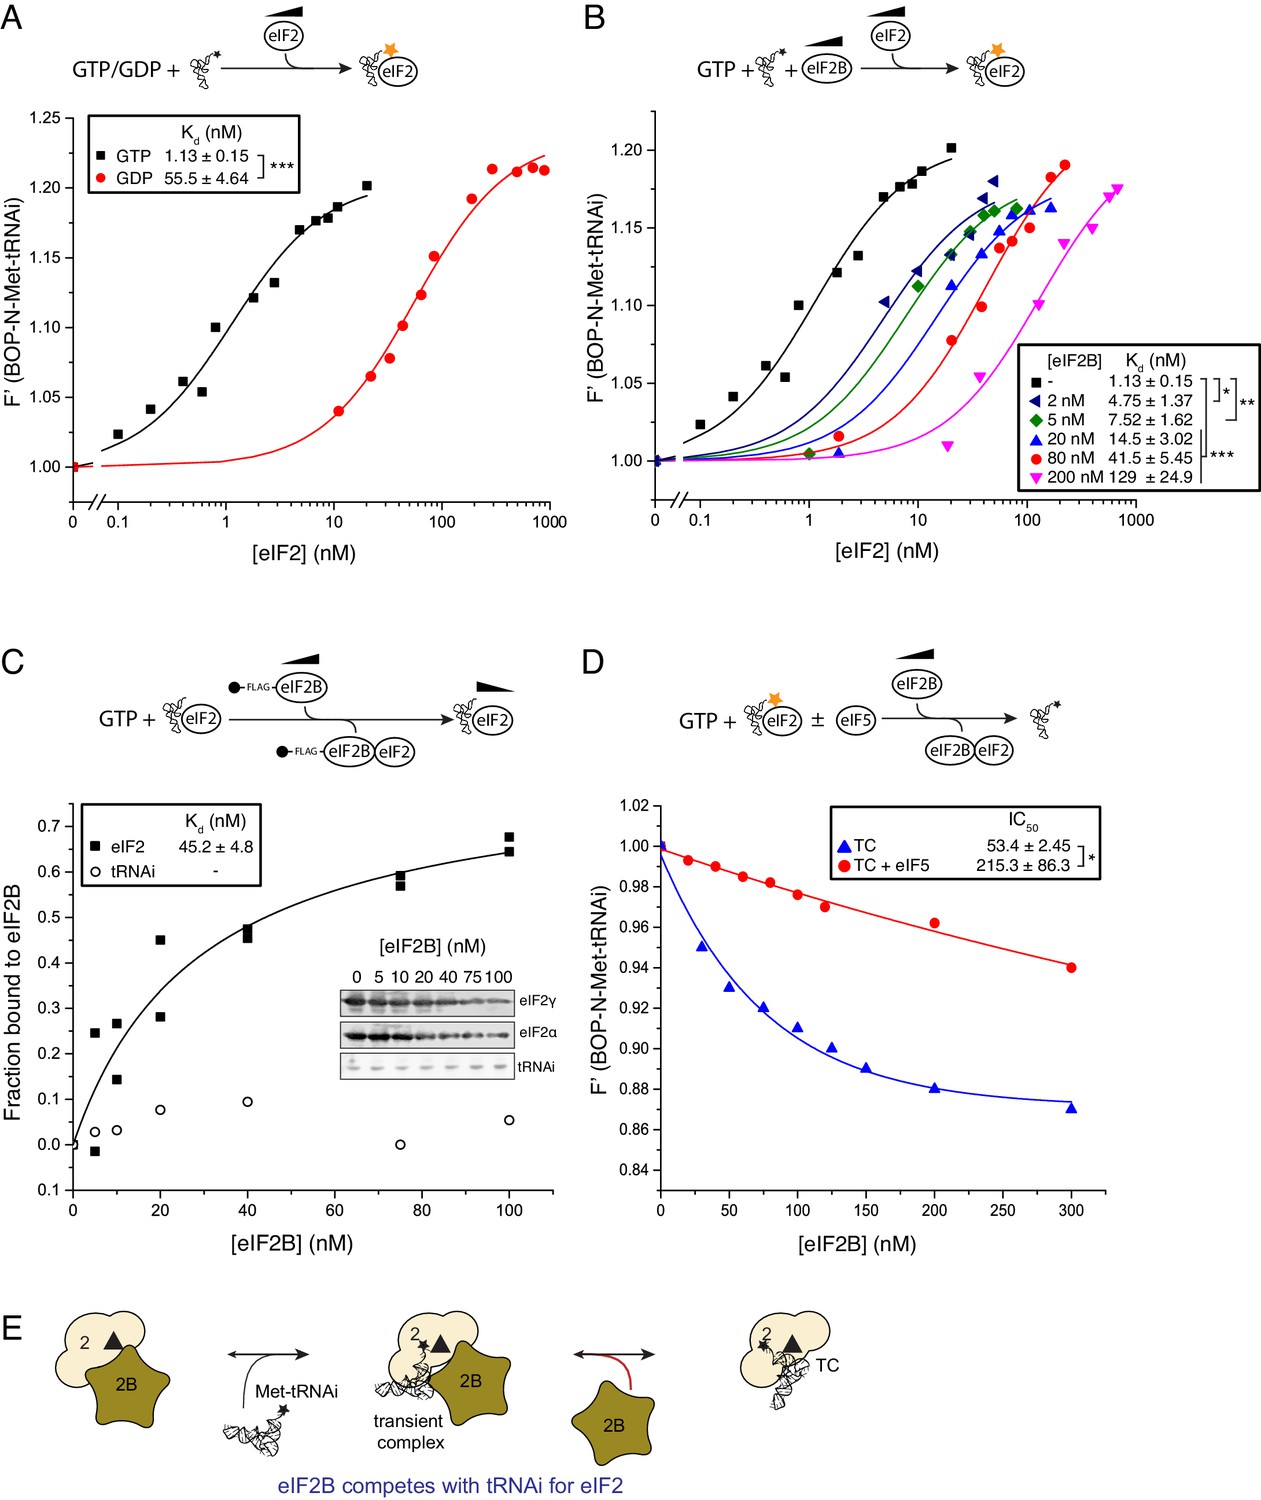
eIF2B competes with Met-tRNAi for binding to eIF2-GTP.
(A) Binding curves titrating 20 nM BOP-N-Met-tRNAi with eIF2 in the presence of 1 mM GTP or GDP. Dissociation constants (nM) ± SE are indicated (inset). ***p<0.001 two-tailed T-test. (B). As in A only in the presence of 1 mM GTP ± increasing concentrations of eIF2B (0–200 nM). *p<0.05, **p<0.01, ***p<0.001 two-tailed T-test C). Supernatant depletion affinity capture as done in Figure 1 with 1 mM GTP +2 nM Met-tRNAi with calculated affinity constants ± SE D). Dissociation curves for 20 nM BOP-N-Met-tRNAi pre-bound to eIF2 (20 nM) and saturating GTP (1 mM) upon titration of eIF2B (0–300 nM) (blue triangles). eIF5 (20 nM) was added to some reactions (red circles). Calculated IC50 values ± SE for dissociation of TC are shown in inset box (nM). *p<0.05 two-tailed T-test. (E). Model for eIF2B competition with tRNA.
Figure 2—figure supplement 1
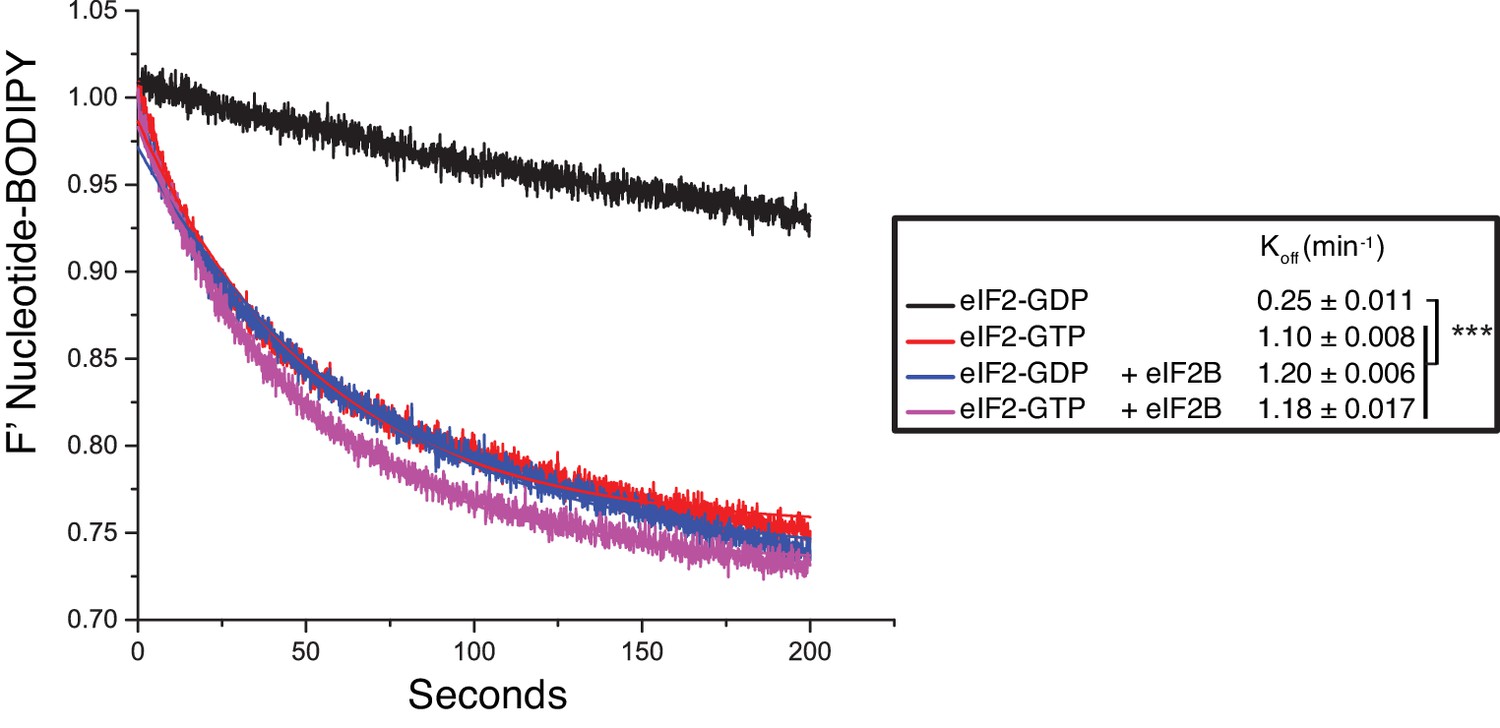
Guanine nucleotide release from eIF2.
Fluorescent-BODIPY labelled GDP or GTP release from eIF2 (20 nM) in the presence of 1 mM ‘dark’ nucleotide ± eIF2B (5 nM). Calculated Koff ± SE is shown in the box. ***p<0.001, two-tailed T-test.
Figure 2—figure supplement 2
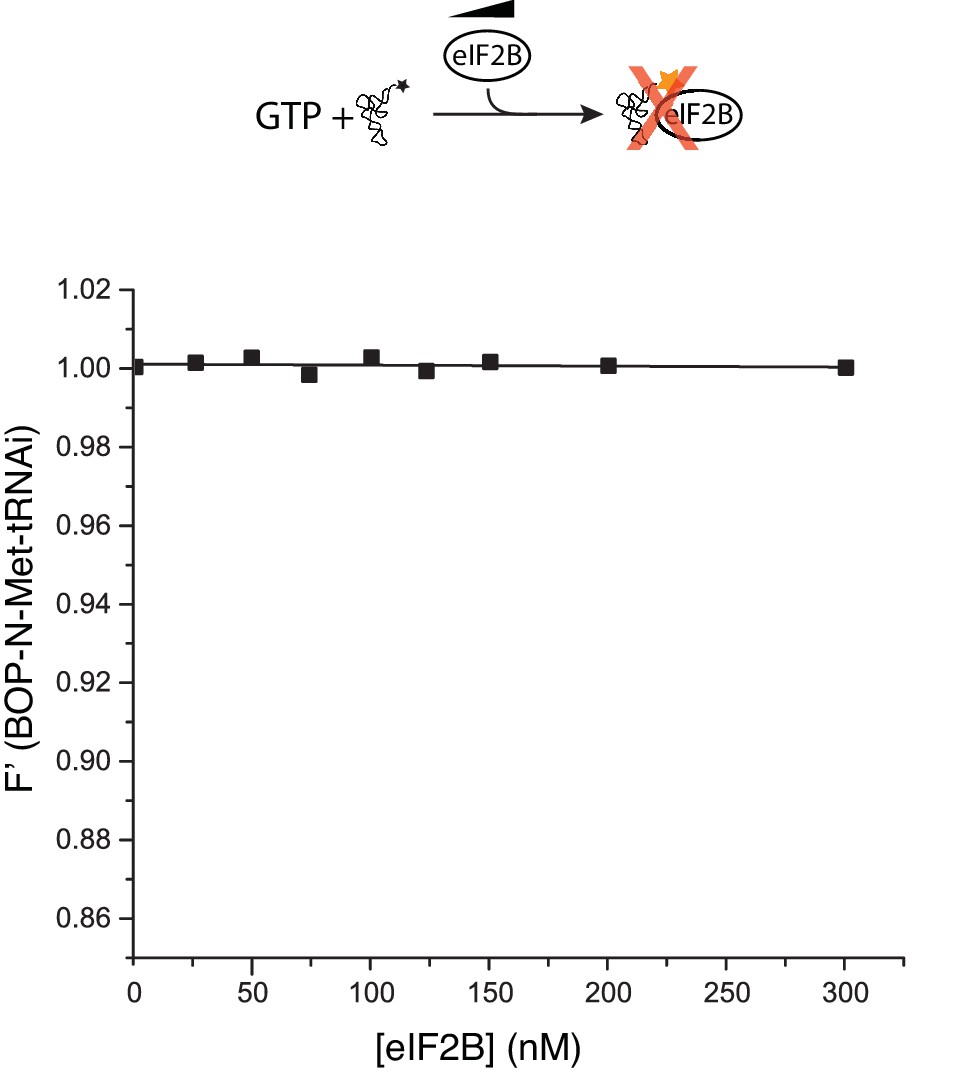
eIF2B does not bind Met-tRNAi.
Fluorescence binding assay in the absence of eIF2, showing eIF2B does not bind to or alter fluorescence of BOP-N-Met-tRNAi.
Figure 3
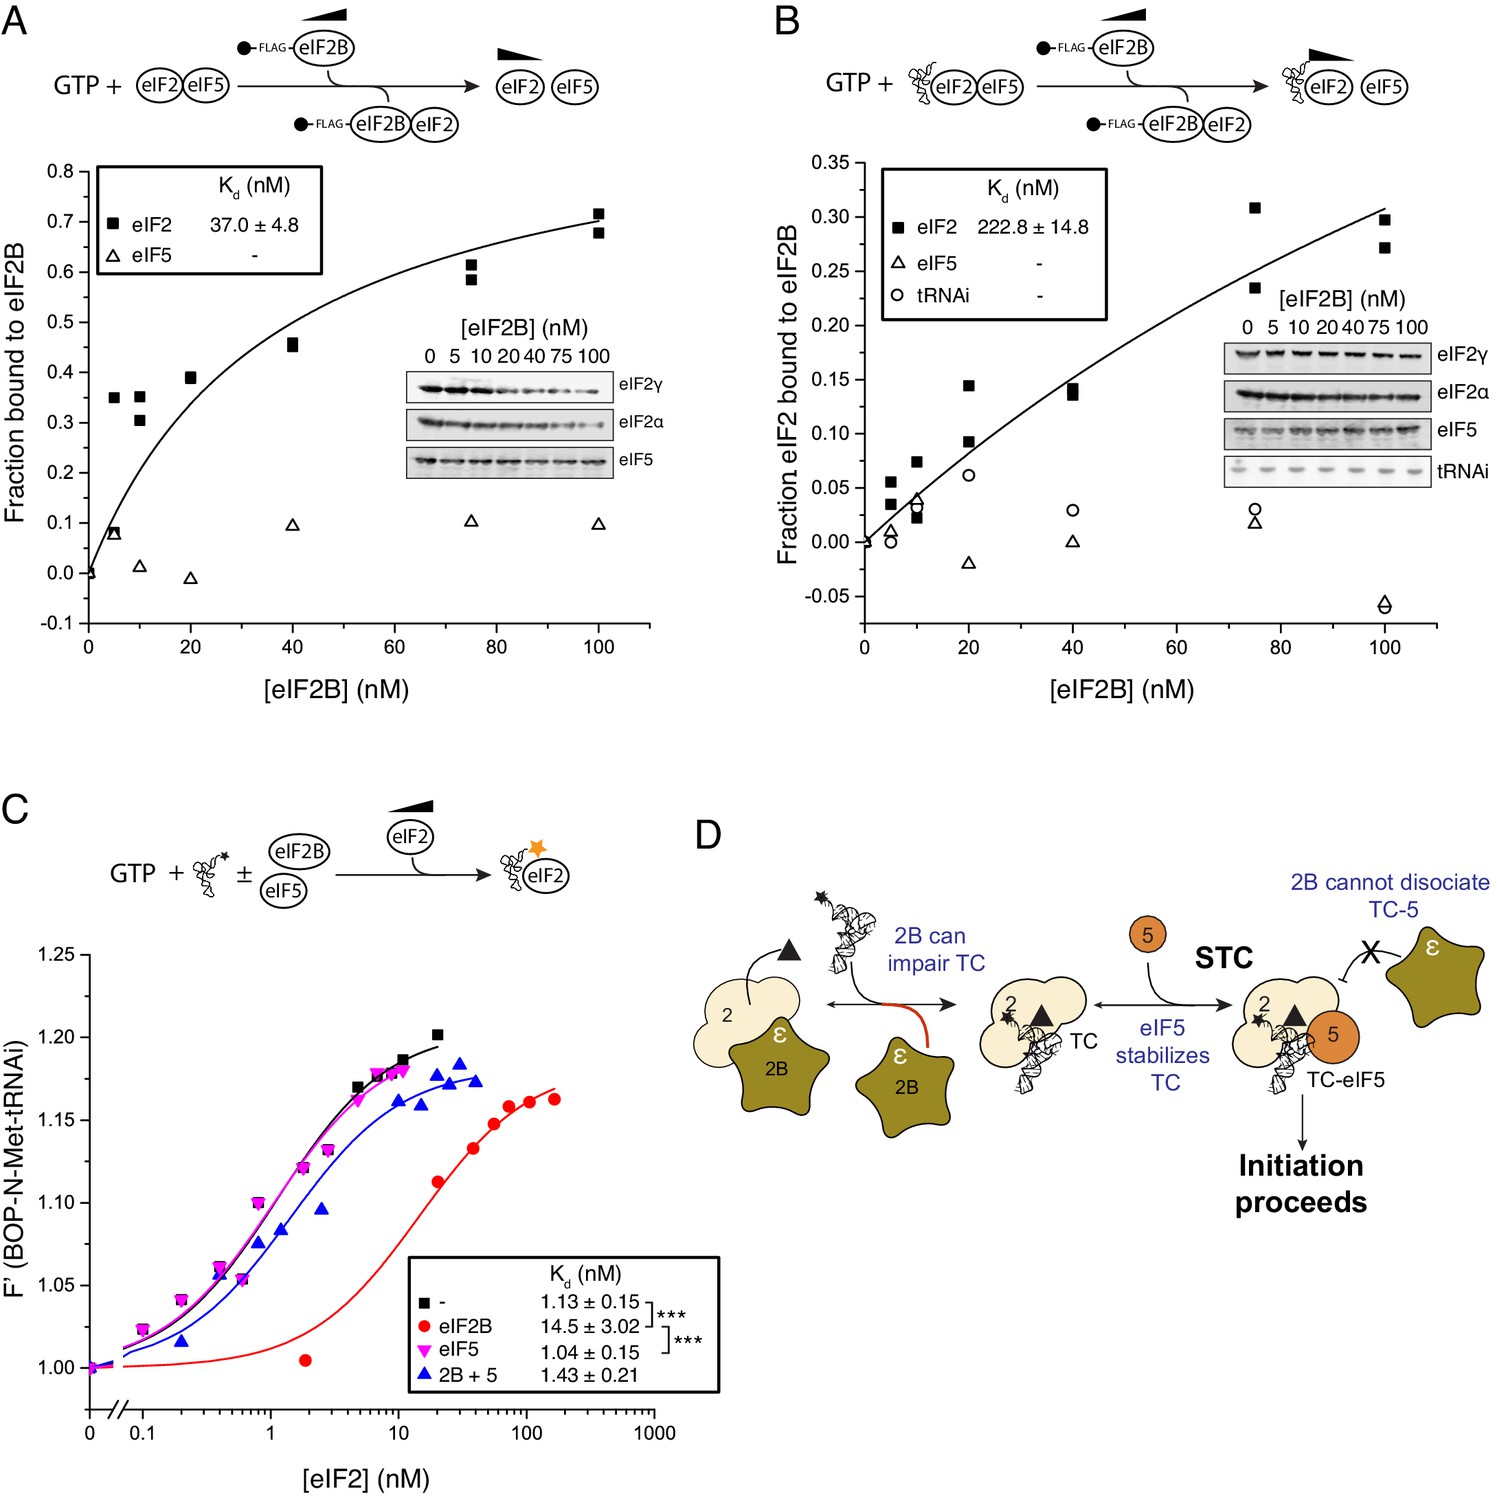
eIF5 stabilizes Met-tRNAi binding to TC.
(A) eIF2/eIF2B equilibrium binding assay in the presence of eIF5 as described in legend to Figure 1. eIF2 (2 nM) was pre-bound (prior to mixing with eIF2B) with eIF5 (20 nM) and GTP (1 mM) then mixed with increasing concentrations of eIF2B immobilised on anti-Flag resin. (B). As in A, but with Met-tRNAi (20 nM) also added prior to eIF2B. (C). Binding curves titrating BOP-N-Met-tRNAi (20 nM) with eIF2 in the presence of GTP (1 mM) as in Figure 2A, but with eIF5 (20 nM), eIF2B (20 nM) or both eIF5 and eIF2B (20 nM each). Dissociation constants (nM) are indicated. ***p<0.001, two-tailed T-test. (D). Model for eIF5 stabilization of TC.
Figure 4
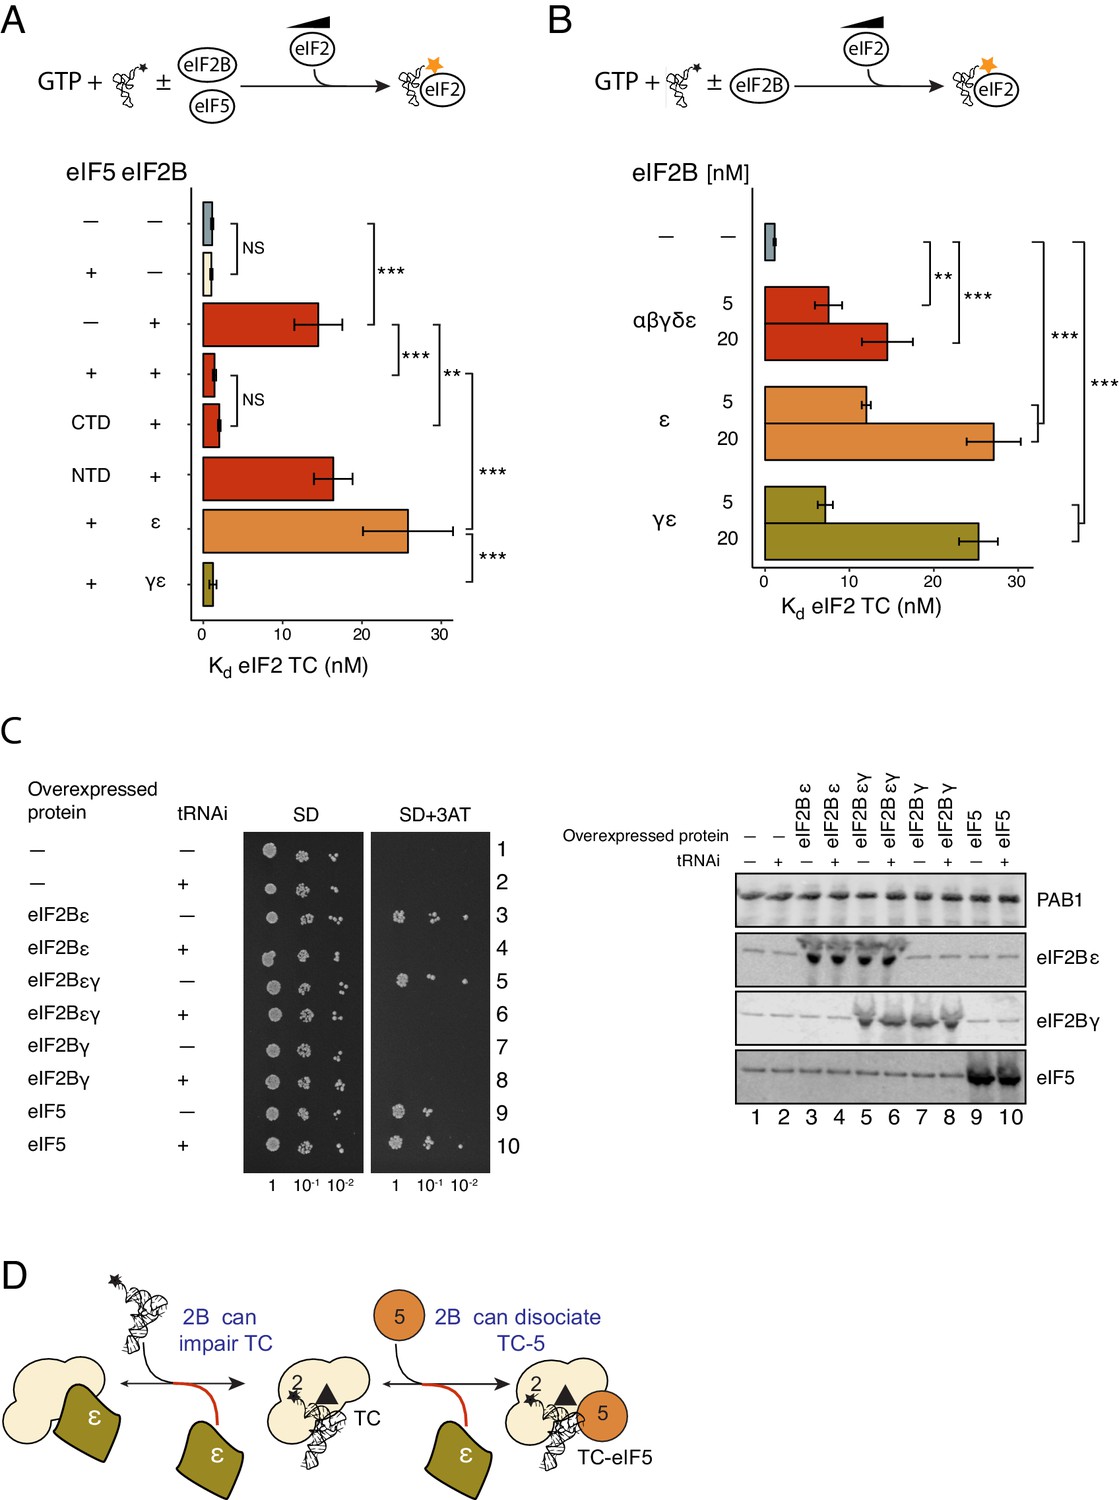
eIF2Bε antagonises eIF5 STC function.
(A) Kd measurements from eIF2-TC formation assays shown in Figure 4—source data 1. Experiments were performed as in Figure 2A.±20 nM eIF2B ±20 nM eIF5, eIF5-NTD or eIF5-CTD. (B). As panel A except ±5 nM or 20 nM of full eIF2B complex, eIF2Bγε subcomplexes or eIF2B epsilon alone. (C). Left, Serial dilution growth assay of gcn2∆ yeast cells bearing multi-copy plasmids overexpressing the indicated combination of tRNAi (IMT4) and eIF2Bε (GCD6), eIF2Bγ (GCD1), eIF5 (TIF5) or eIF2Bεγ (GCD6 + GCD1) grown on minimal and 3AT medium. Right, Western blot of strains used confirming overexpression of indicated proteins. (D). Model showing eIF2Bε antagonism of TC/eIF5 and TC. **p<0.01, ***p<0.001, NS non-significant (p≥0.05), two-tailed T-test.
-
Figure 4—source data 1
Destabilisation of TC requires eIF2Bε and stabilisation of TC requires eIF5-CTD.
(A) Source data for Figure 4A, Top: cartoon summary of assay. Left panel: eIF2B competition with eIF2-TC is overcome by eIF5-CTD. Right panel: eIF2Bε antagonises eIF5 stabilization of eIF2-TC. Binding curves titrating 20 nM BOP-N-Met-tRNAi with eIF2 in the presence of 1 mM GTP ±20 nM eIF2B (left) or indicated eIF2B subunit combinations (right). Dissociation constants (nM) ± SE are shown in insert boxes. (B). Source data for Figure 4B. Top: cartoon summary of assay. Destabilization of eIF2-TC requires eIF2Bε. Binding curves as in panel A ± 5 nM or 20 nM of eIF2B subunit combinations shown.
- https://doi.org/10.7554/eLife.24542.009
Figure 5 with 2 supplements
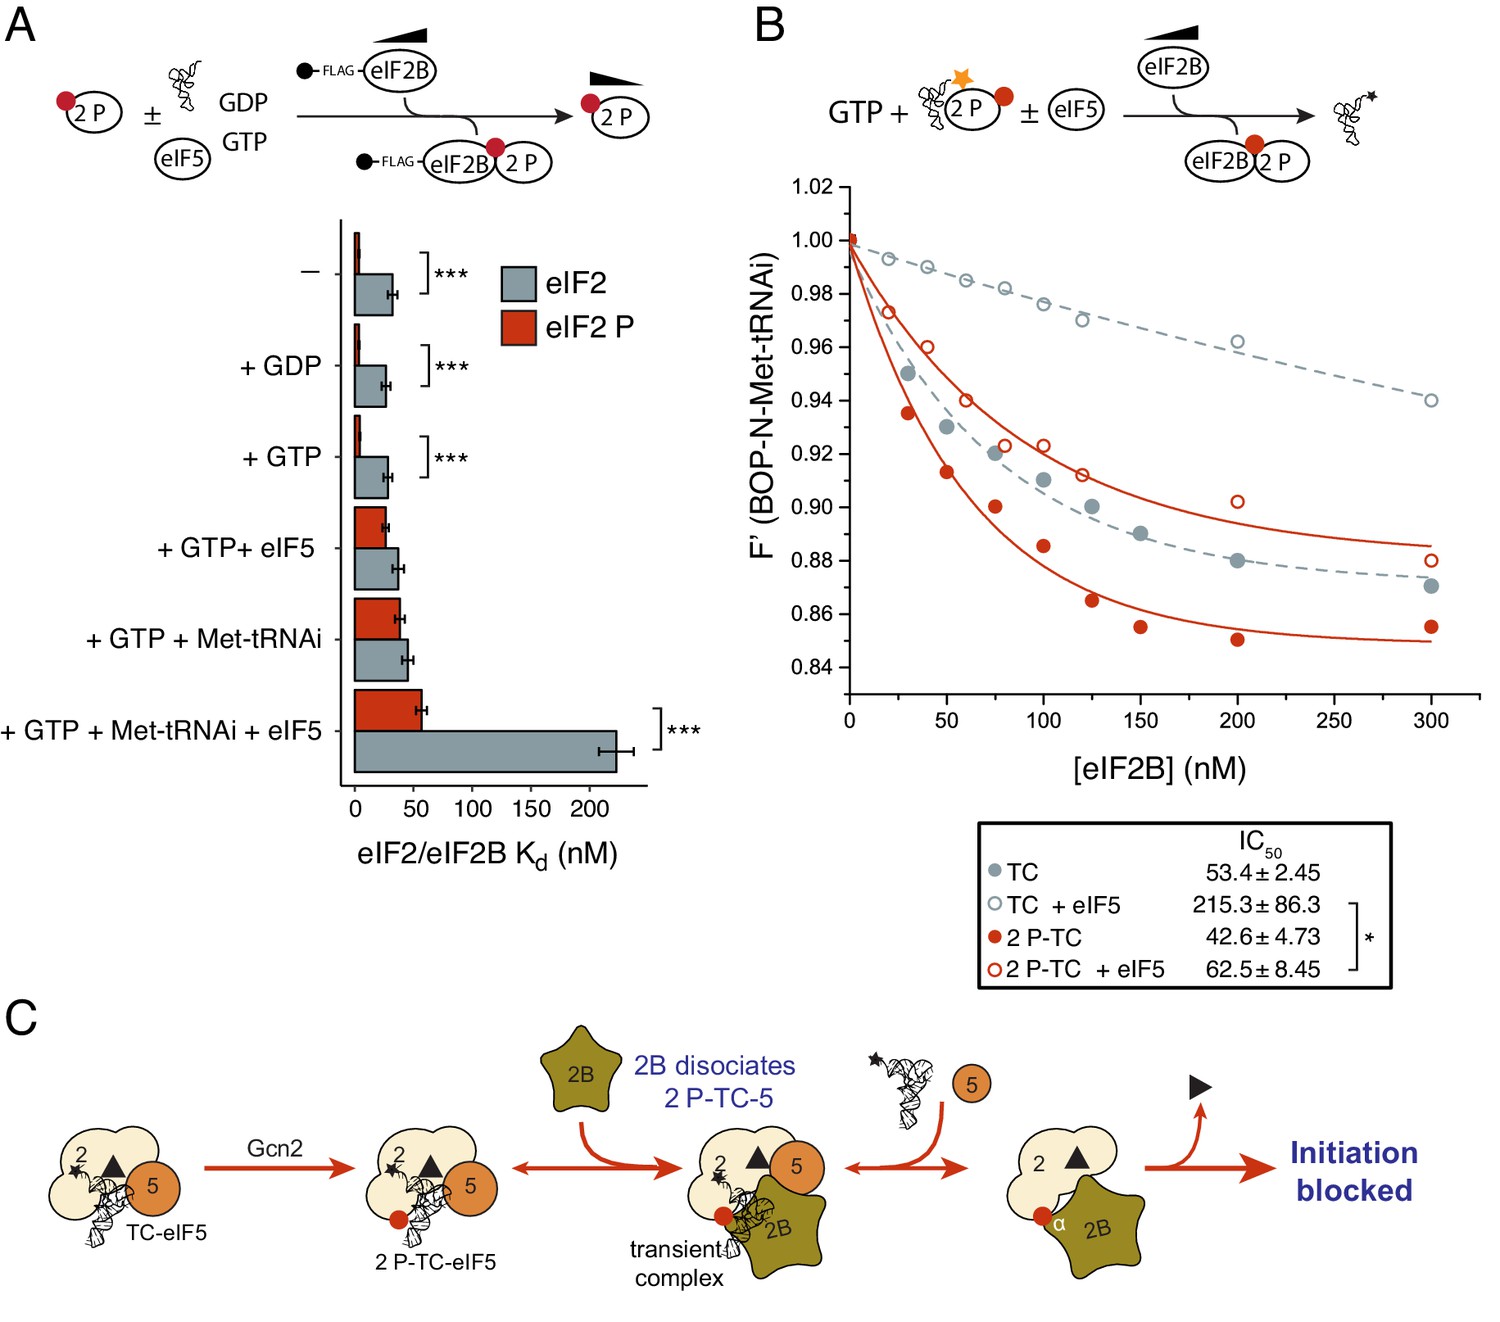
eIF2B antagonizes eIF2(αP)-TC/eIF5 complexes.
(A) Kd measurements ± SE from eIF2(αP)/eIF2B complex formation assays shown in Figure 5—source data 1 and compared with measurements made with non-phosphorylated eIF2 shown in previous figures. (B). Dissociation curves for 20 nM BOP-N-Met-tRNAi pre-bound to eIF2(αP) (20 nM) and saturating GTP (1 mM) upon titration of eIF2B (0–300 nM) (red circles). eIF5 (20 nM) was added to some reactions (open circles). Data shown in Figure 2D is reproduced for comparison in gray symbols. Calculated IC50 values ± SE are shown in the box. (C). Model for eIF2B inhibition of eIF2(αP)-TC/eIF5 complexes. *p<0.05, ***p<0.001, two-tailed T-test.
-
Figure 5—source data 1
Binding between eIF2(αP) and eIF2B in the presence of different ligands.
Top cartoon depicting assay. (A–F). eIF2/eIF2B interaction assay equivalent to that shown in Figures 1C–E, 2C, 3A and B, only with eIF2 phosphorylated by PKR prior to assay. Calculated Kds ± SE and example western blot images are shown as insets. Kds ± SE are plotted in the histogram in Figure 5A.
- https://doi.org/10.7554/eLife.24542.011
Figure 5—figure supplement 1
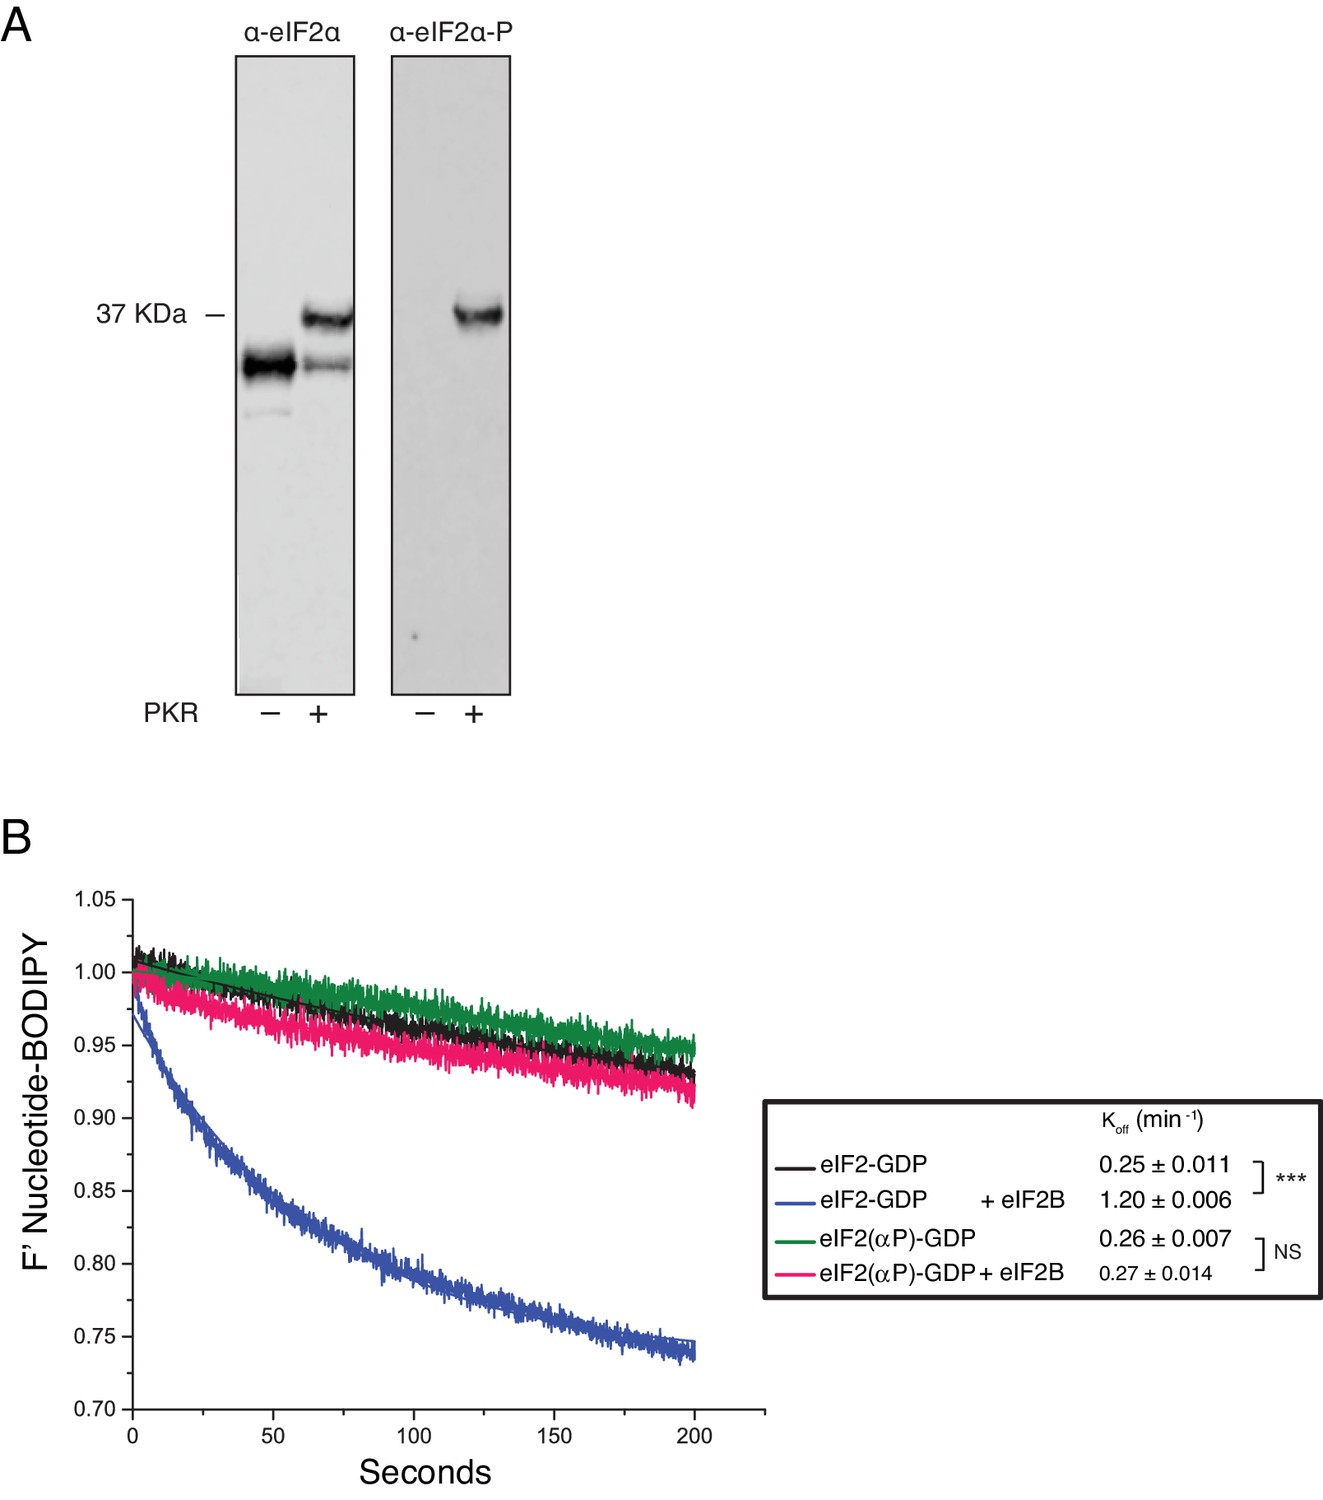
Phosphorylation of eIF2α and its impact on eIF2B activity.
(A) Phos-Tag gel western blots of eIF2 ± PKR with total eIF2α (left) and ser-51 phospho-specific (right) antibodies. (B). Fluorescent-BODIPY labelled GDP release from eIF2 or eIF2(αP) (20 nM) in the presence of 1 mM ‘dark’ nucleotide ±5 nM eIF2B. Calculated Koff ± SE shown. ***p<0.001, NS non-significant (p≥0.05), two-tailed T-test.
Figure 5—figure supplement 2

eIF2(αP) affinity for Met-tRNAi.
Top, Cartoon descripting assay. Bottom: Fluorescence of 20 nM BOP-N-Met-tRNAi binding to 2 nM eIF2(αP) in the presence of 1 mM GDP or GTP. Calculated Kds ± SE shown in inset box. ***p<0.001, two-tailed T-test.
Figure 6

Model summary of new activities of eIF2 and eIF5.
A summary model of interactions between eIF2, eIF2B, eIF5 and Met-tRNAi to generate eIF2-TC/eIF5 complexes and their inhibition by eIF2(αP). See text for details.
Download links
A two-part list of links to download the article, or parts of the article, in various formats.
Downloads (link to download the article as PDF)
Open citations (links to open the citations from this article in various online reference manager services)
Cite this article (links to download the citations from this article in formats compatible with various reference manager tools)
Fail-safe control of translation initiation by dissociation of eIF2α phosphorylated ternary complexes
eLife 6:e24542.
https://doi.org/10.7554/eLife.24542


