Structural basis of transcription arrest by coliphage HK022 Nun in an Escherichia coli RNA polymerase elongation complex
- The Rockefeller University, United States
- Public Health Research Institute, United States
- Rutgers Biomedical and Health Sciences, United States
- Columbia University Medical Center, United States
Figures
Figure 1 with 7 supplements
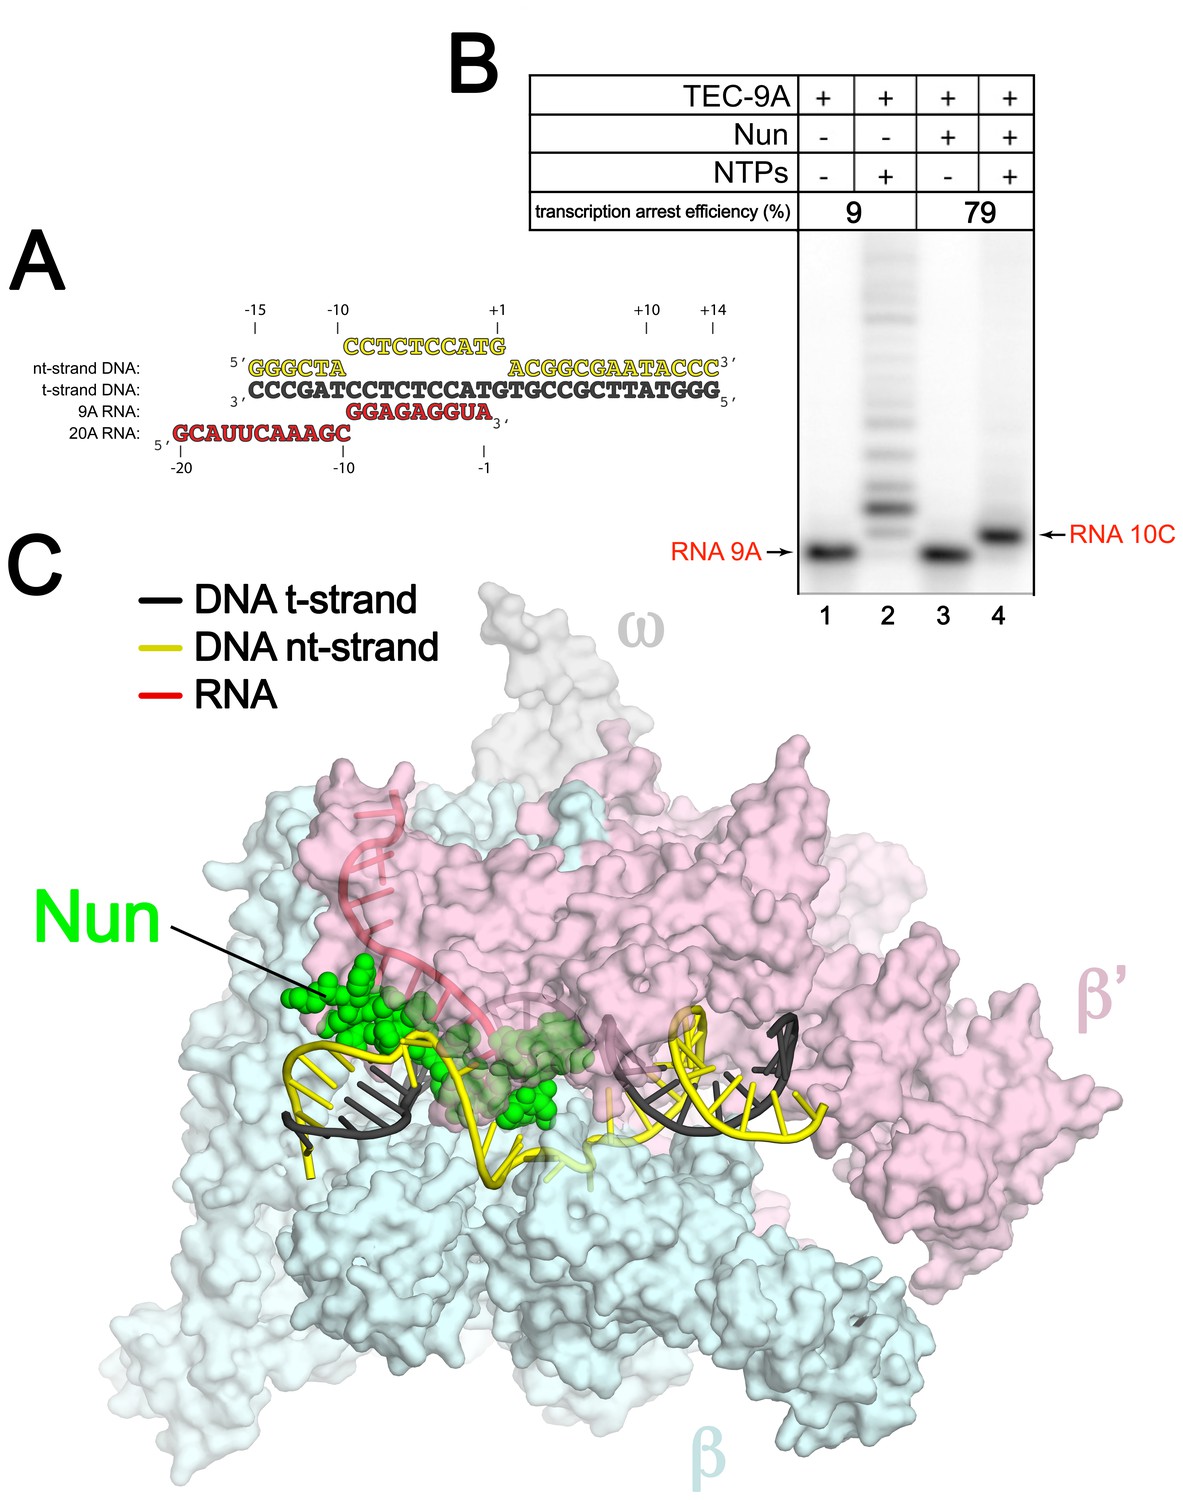
An Eco TEC with HK022 Nun.
(A) Na-scaffold – Synthetic oligonucleotides used for Eco TEC reconstitution and the numbering scheme used throughout this manuscript. The DNA sequence, a shortened version of the na-scaffold used by (Vitiello et al., 2014), is derived from the T7 A1 transcription unit. The nt-strand DNA (colored yellow) contains an engineered non-complementary transcription bubble from −9 to +1. TEC-9A was reconstituted using the 9A RNA (−9 to −1). TEC-20A was reconstituted using the 20A RNA (−20 to −1). (B) TEC-9A is sensitive to Nun. 32P-labeled RNAs were monitored by polyacrylamide gel electrophoresis and autoradiography. TEC-9A was assembled using 5’-32P-labeled 9A RNA (lane 1). Addition of ATP, CTP, GTP, and UTP (NTPs) resulted in elongation into longer RNAs (lane 2). Nun/TEC-9A was form by the addition of a saturating concentration of Nun (lane 3). In the presence of all four NTPs, 9A RNA was extended to 10C RNA by the addition of C, but further elongation of the RNA was blocked by Nun (lane 4). The % transcription arrest efficiency was calculated as follows. transcription arrest efficiency (%)=100 x I10C/Itotal. where I10C is the integrated intensity of the band for the 10C RNA (quantitated by phosphorimagery). Itotal is the total integrated intensity over the whole lane. (C) Overall structure of X-Nun/TEC-20A. The color-coding is denoted in the legend (for the na-scaffold) or by the labels (proteins). The na-scaffold is shown in cartoon format. Eco core RNAP is shown as a transparent molecular surface. Nun is shown as CPK atoms. The downstream duplex DNA enters the RNAP from the right, the upstream duplex DNA exits the complex to the left.
Figure 1—figure supplement 1

Native MS analysis of TEC with and without incubation of Nun.
Mass spectrum of TEC only (bottom) and TEC incubated with 3-fold molar excess of Nun (top) acquired under non-denaturing conditions. The full m/z range spectra are displayed in the inset panel. Samples were buffer-exchanged into 500 mM ammonium acetate, 0.01% Tween-20 prior to native MS characterization. The ion peak series assignments and the charge-state of the most intense peak for each peak series are indicated. For the TEC only sample, the dominant ion peak series corresponds to intact TEC, which is comprised of the core RNAP (α2ββ’ω assembly), minimal scaffold ms12, and 9A RNA transcript (see Figure 2—figure supplement 1 for the nucleotide sequences). Also observed is a low intensity peak series corresponding to the RNAP core complex that has lost the ω subunit (measured mass: 359,068 ± 14 Da). For the TEC + Nun sample, major peak series corresponding to TEC alone as well as TEC/Nun at 1:1 stoichiometry are observed. A low relative intensity ion peak series marked by (*) with an experimental mass of 409,432 Da ±7 Da and corresponds to TEC with two copies of Nun (TEC:2Nun). Native MS analysis of RNAP core complex only (no DNA or RNA bound) incubated with a 3-fold molar excess Nun also showed a similar low intensity peak series for RNAP core with one copy of Nun (data not shown), indicating that there are likely low affinity, non-specific Nun interaction site(s) on the RNAP core.
Figure 1—figure supplement 2
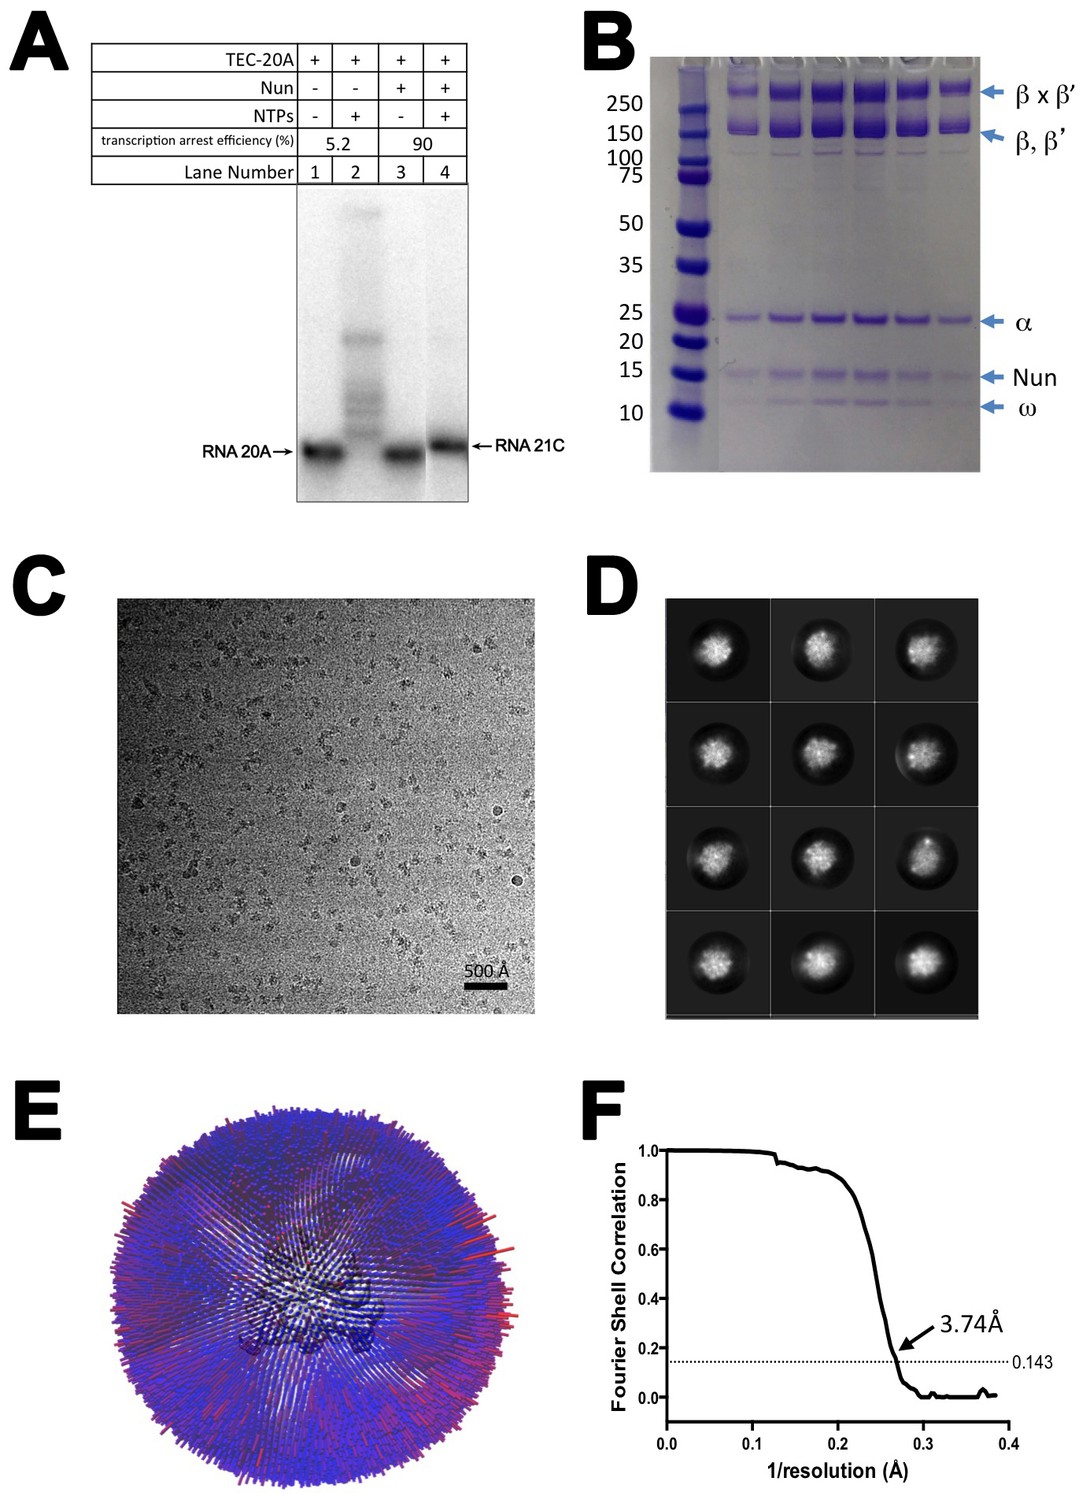
CryoEM of X-Nun/TEC-20A.
(A) TEC-20A (lane 1) is active in transcription elongation (lane 2) but the presence of 20 µM Nun stalls elongation at 21C (lane 4). (B) SDS polyacrylamide gel of glutaraldehyde crosslinked Nun/TEC-20A (after gel filtration; stained with Coomassie blue). (C) Representative micrograph of X-Nun/TEC-20A in vitreous ice. (D) The twelve highest populated classes from 2D classification. (E) Angular distribution histogram for X-Nun/TEC-20A particle projections. (F) Gold standard FSC of X-Nun/TEC-20A. The gold standard FSC was calculated by comparing the two independently determined half-maps from RELION. The dotted line indicates the 0.143 FSC cutoff which corresponds to a nominal resolution of 3.7 Å.
Figure 1—figure supplement 3
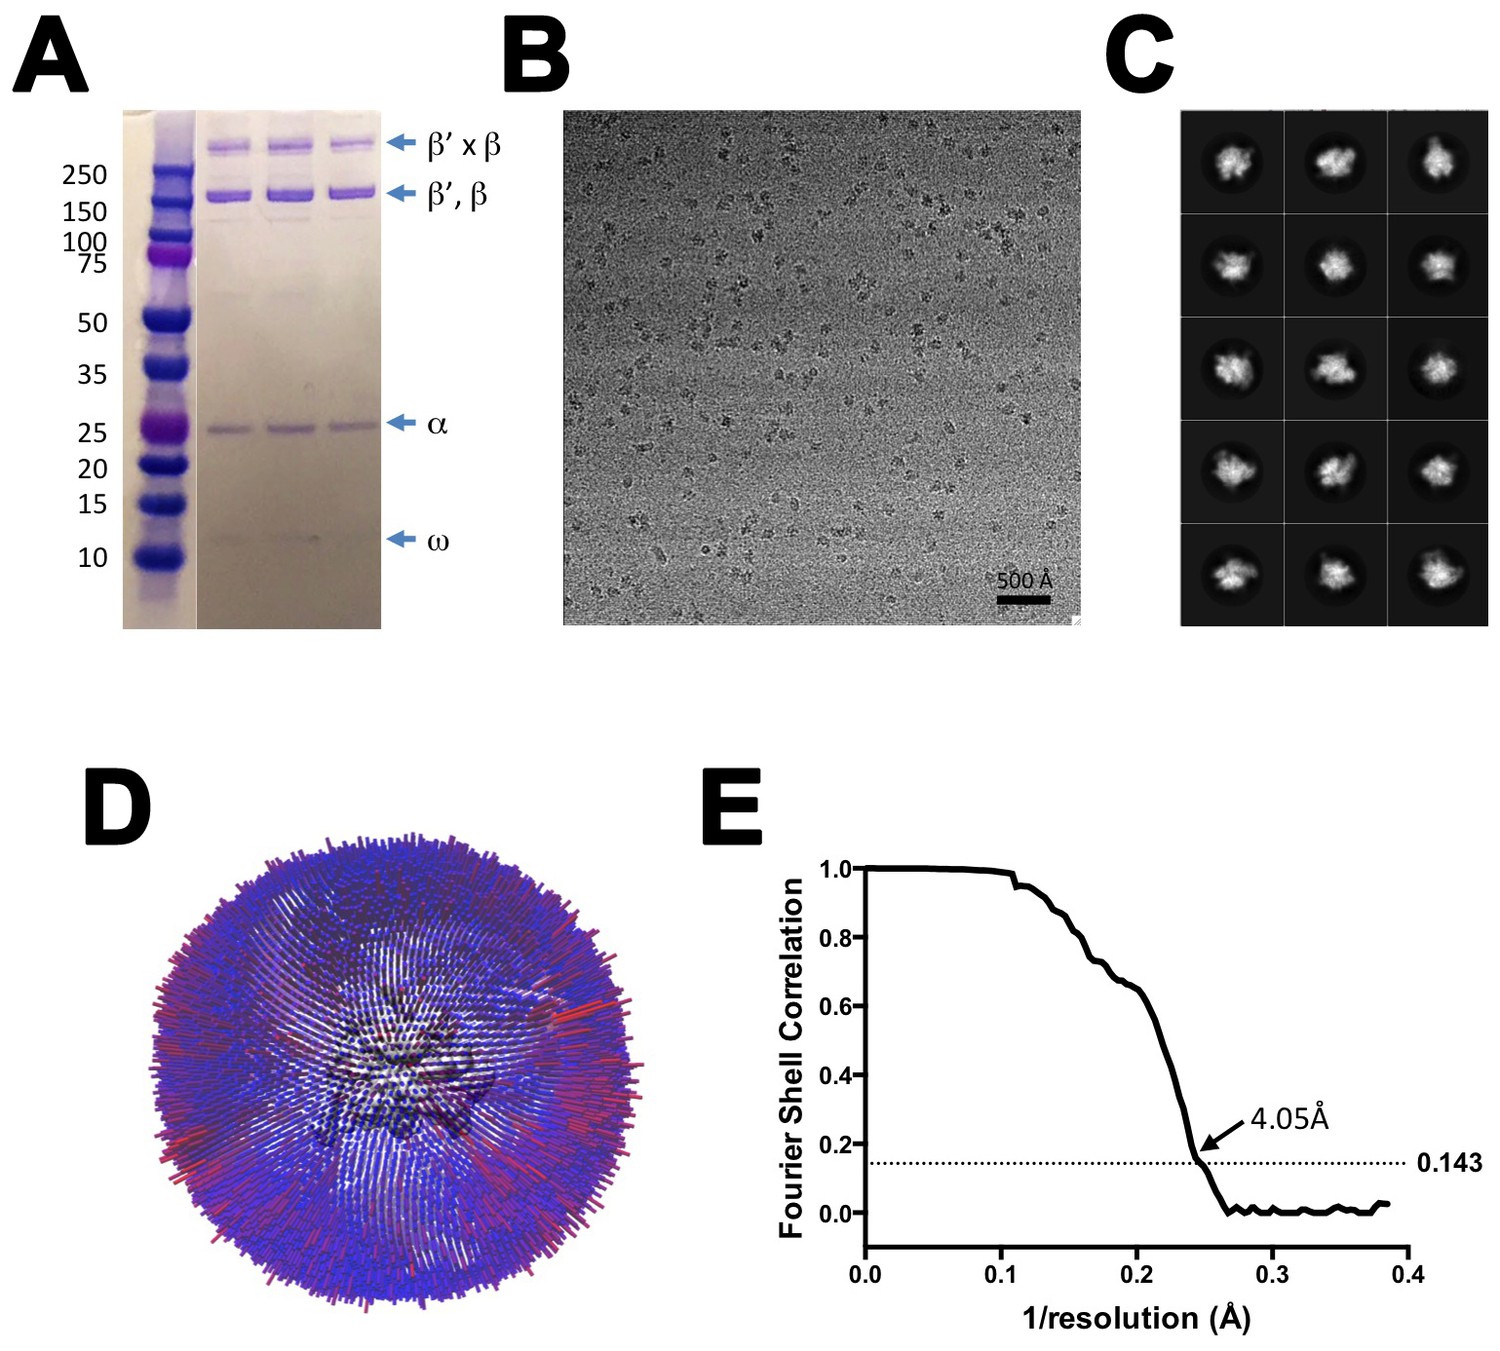
CryoEM of X-TEC-20A.
(A) SDS polyacrylamide gel of gluteraldehyde crosslinked Nun/TEC-20A (after gel filtration; stained with Coomassie blue). (B) Representative micrograph of X-TEC-20A in vitreous ice. (C) The fifteen highest populated classes from 2D classification. (D) Angular distribution histogram for X-TEC-20A particle projections. (E) Gold standard FSC of X-TEC-20A. The gold standard FSC was calculated by comparing the two independently determined half-maps from RELION. The dotted line indicates the 0.143 FSC cutoff which corresponds to a nominal resolution of 4.1 Å.
Figure 1—figure supplement 4

CryoEM of TEC-20A.
(A) Representative micrograph of TEC-20A in vitreous ice. (B) The fifteen highest populated classes from 2D classification. (C) Angular distribution histogram for TEC-20A particle projections. (D) Gold standard FSC of TEC-20A. The gold standard FSC was calculated by comparing the two independently determined half-maps from RELION. The dotted line indicates the 0.143 FSC cutoff which corresponds to a nominal resolution of 4.4 Å.
Figure 1—figure supplement 5
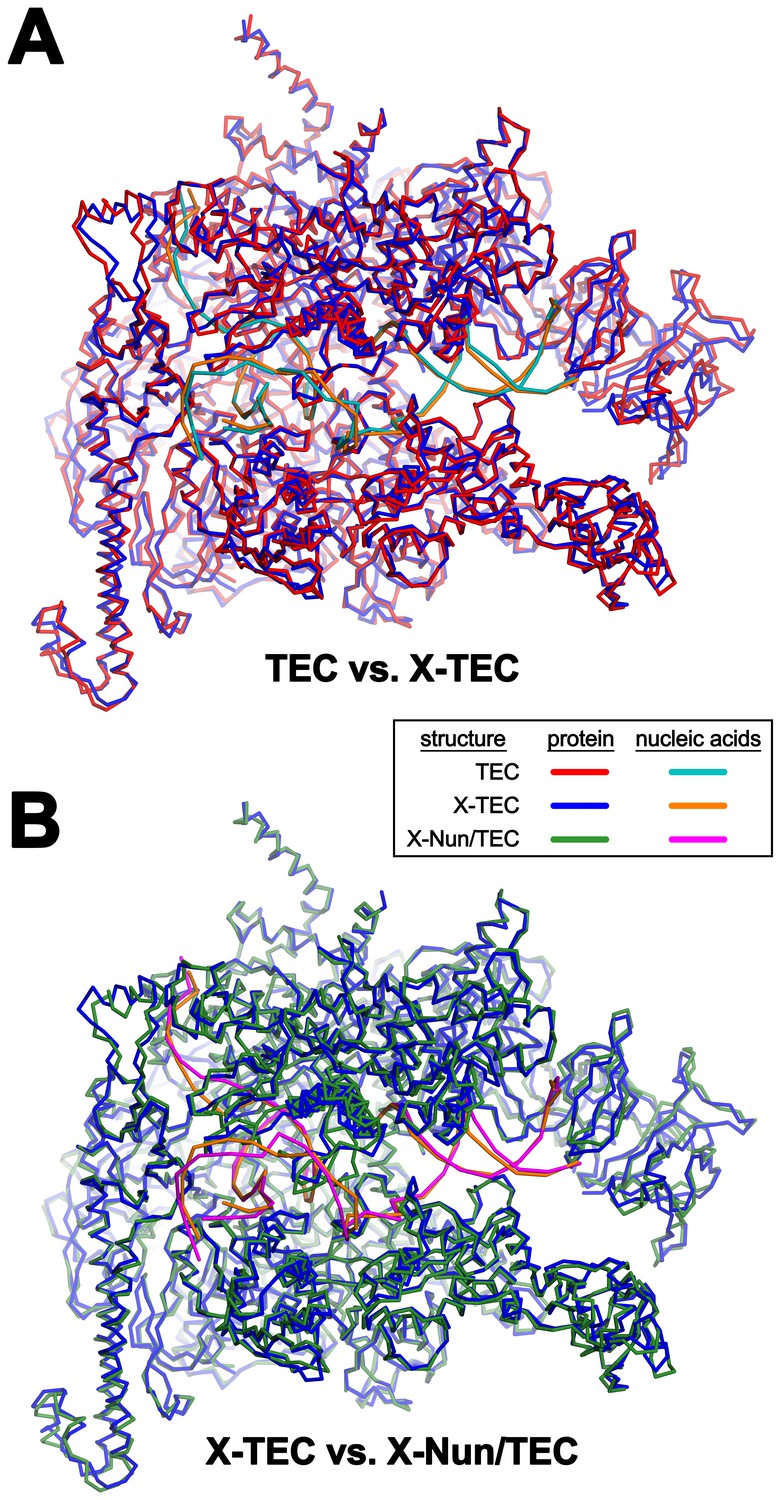
Comparison of TEC-20A, X-TEC-20A, and X-Nun-TEC-20A structures (also see Supplementary file 2).
(A) TEC-20A vs. X-TEC-20A (0.646 Å rmsd over 2750 Cα coordinates). (B) X-TEC-20A vs. X-Nun/TEC-20A (0.698 Å rmsd over 2806 Cα coordinates).
Figure 1—figure supplement 6
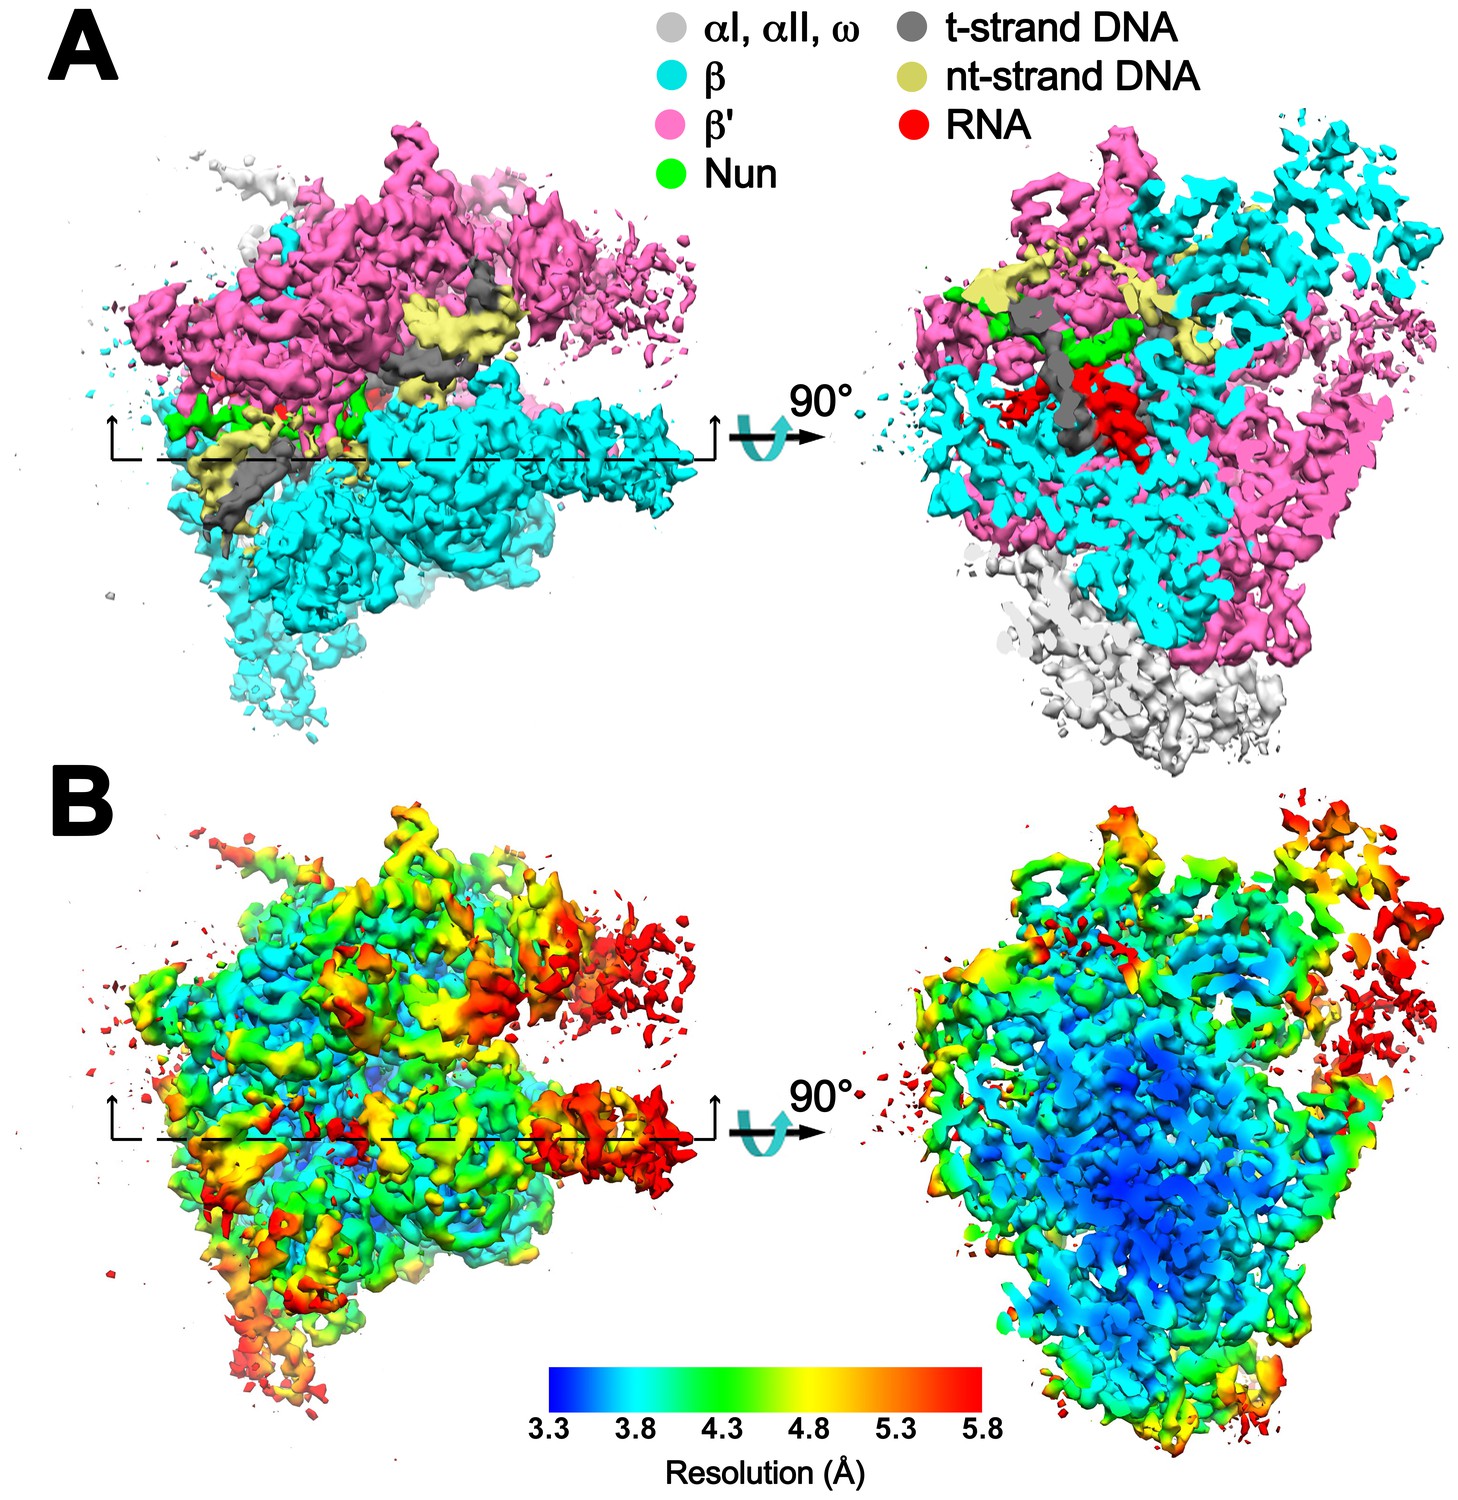
Overall cryoEM map and local resolution of X-Nun/TEC-20A.
(A) The 3.74 Å resolution cryoEM density map of X-Nun/TEC-20A colored according to the legend at the top. The view on the right shows a cross section as indicated on the left. (B) Same views of the cryoEM density map but colored by local resolution (Cardone et al., 2013).
Figure 1—figure supplement 7
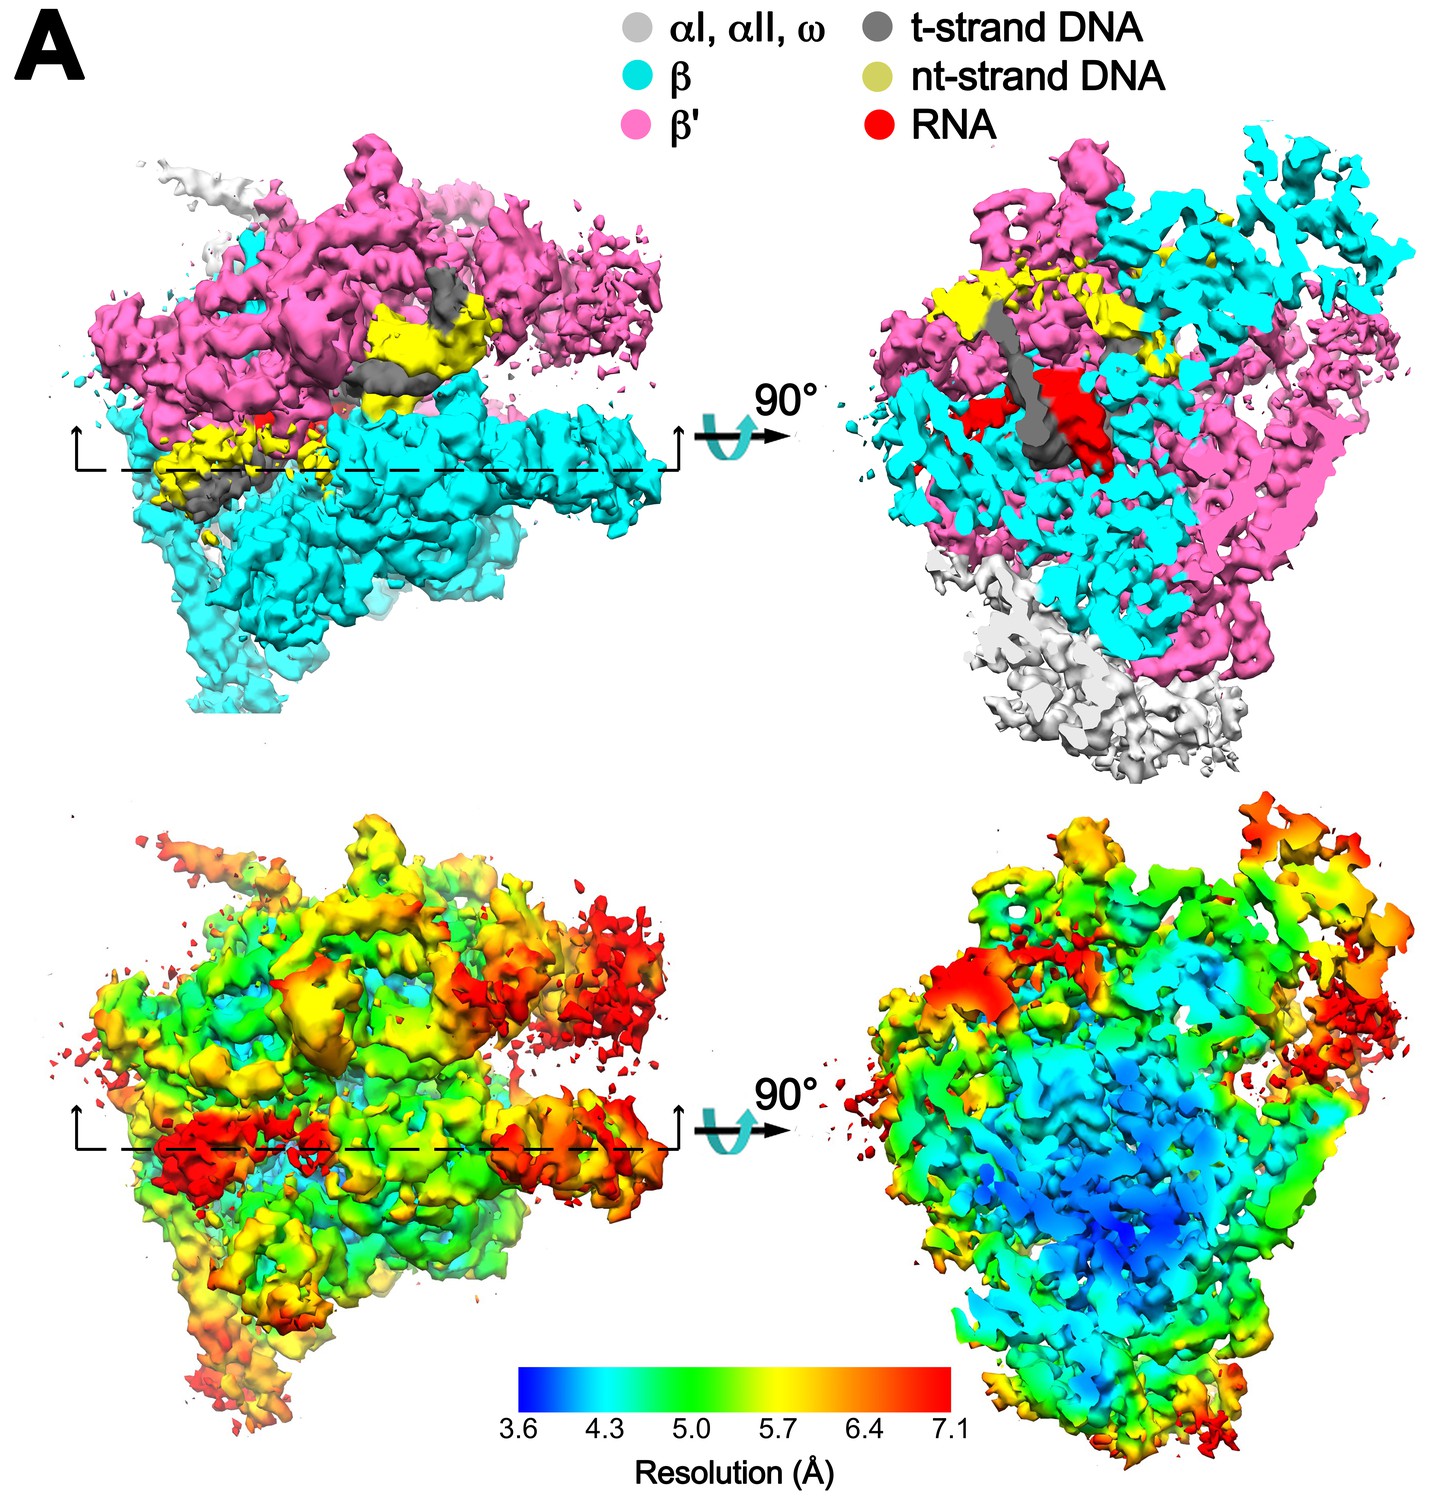
Overall cryoEM map and local resolution of X-TEC-20A.
(A) The 4.05 Å resolution cryoEM density map of X-TEC-20A colored according to the legend at the top. The view on the right shows a cross section as indicated on the left. (B) Same views of the cryoEM density map but colored by local resolution (Cardone et al., 2013).
Figure 2 with 2 supplements

Comparison of X-TEC-20A and X-Nun/TEC-20A structures.
(A) (top) Overall view of the X-TEC-20A structure. The RNAP is shown as a transparent molecular surface, revealing the na-scaffold inside (shown in cartoon format). The boxed region is magnified below. (bottom) Magnified view of boxed region from overall view above. Most of the β subunit has been removed to reveal the inside of the RNAP active site cleft. Most of the RNAP is shown as a molecular surface, with β colored light cyan but with switch3 (βsw3) colored light blue, β’ colored light pink but with the β’zipper, β’lid, and β’rudder colored light magenta. The Bridge-Helix (BH) is also labeled. The βflap, which covers the RNA exit channel, is shown as a backbone worm. The na-scaffold is shown in stick format, color-coded as shown in the legend. The RNAP active-site Mg2+-ion is shown as a yellow sphere. (B) (top) Overall view of the X-Nun/TEC-20A structure. Nun is shown as a green molecular surface (bottom). Same as A (bottom) except Nun is shown as a transparent green molecular surface with an α-carbon backbone worm.
Figure 2—figure supplement 1
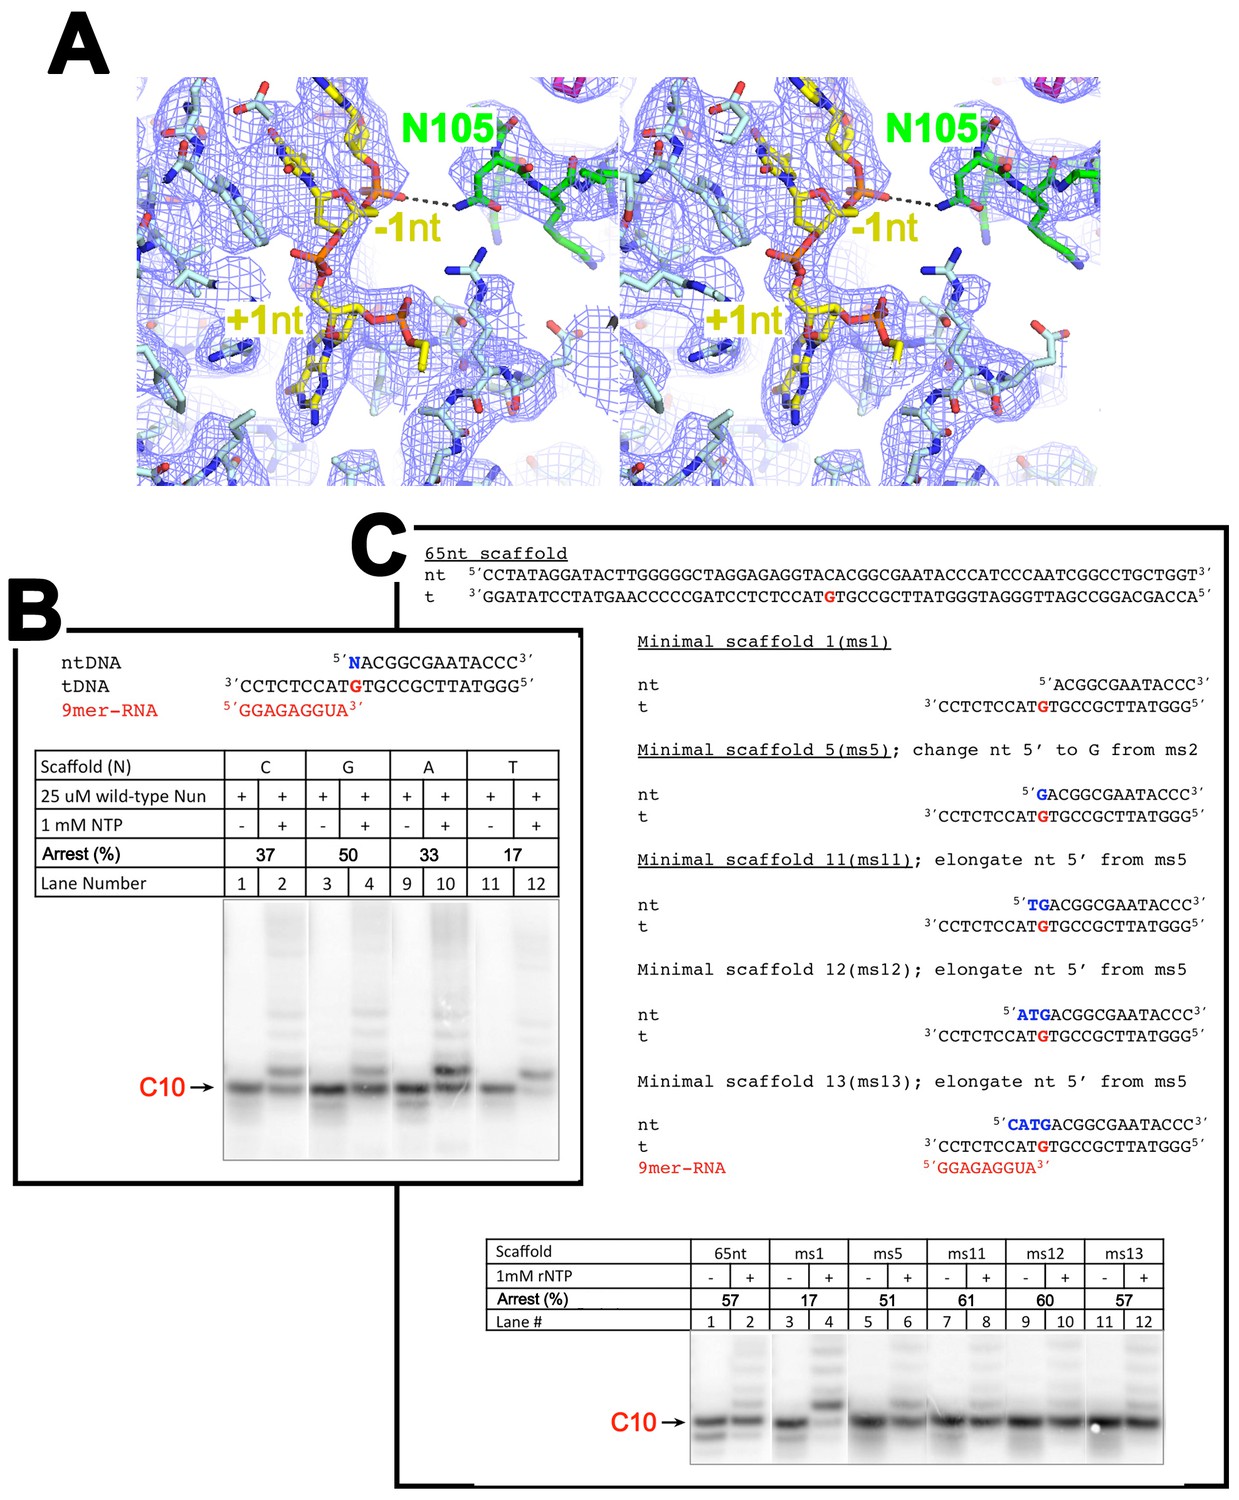
The nt-strand ssDNA and Nun.
(A) Stereo view of the X-Nun/TEC-20A cryo-EM map (blue mesh) with the refined model superimposed (RNAP β subunit, light cyan; Nun, green; nt-strand DNA, yellow). The view shows the binding pocket for +1 nt-strand G and the interaction between Nun N105 and the phosphate backbone of −1 nt-strand. (B) C10 extension assays showing a + 1 nt-strand 5’ overhang of G facilitates Nun function. (C) C10 extension assays showing a 2-nucleotide 5’ nt-strand overhang facilitates Nun function.
Figure 2—figure supplement 2
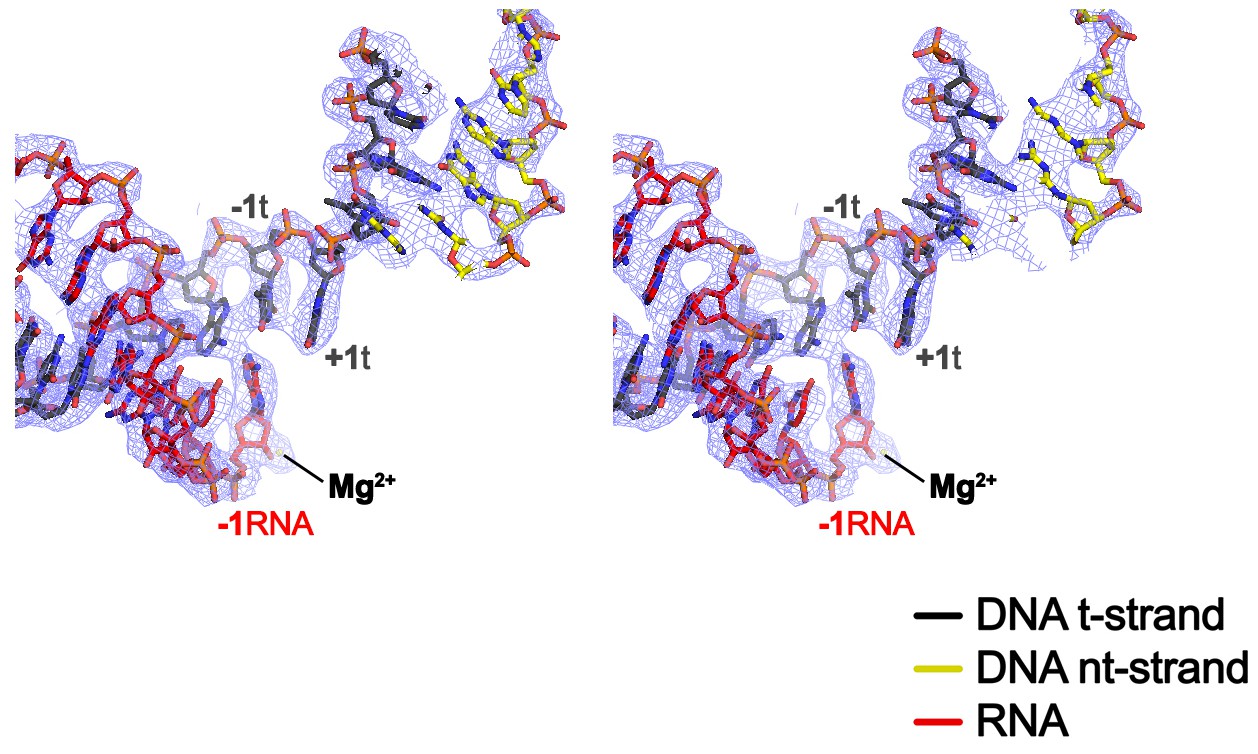
CryoEM density map at the active site.
Stereo view of the X-Nun/TEC-20A cryoEM map (blue mesh) around the RNAP active site showing the post-translocated na-scaffold.
Figure 3 with 3 supplements
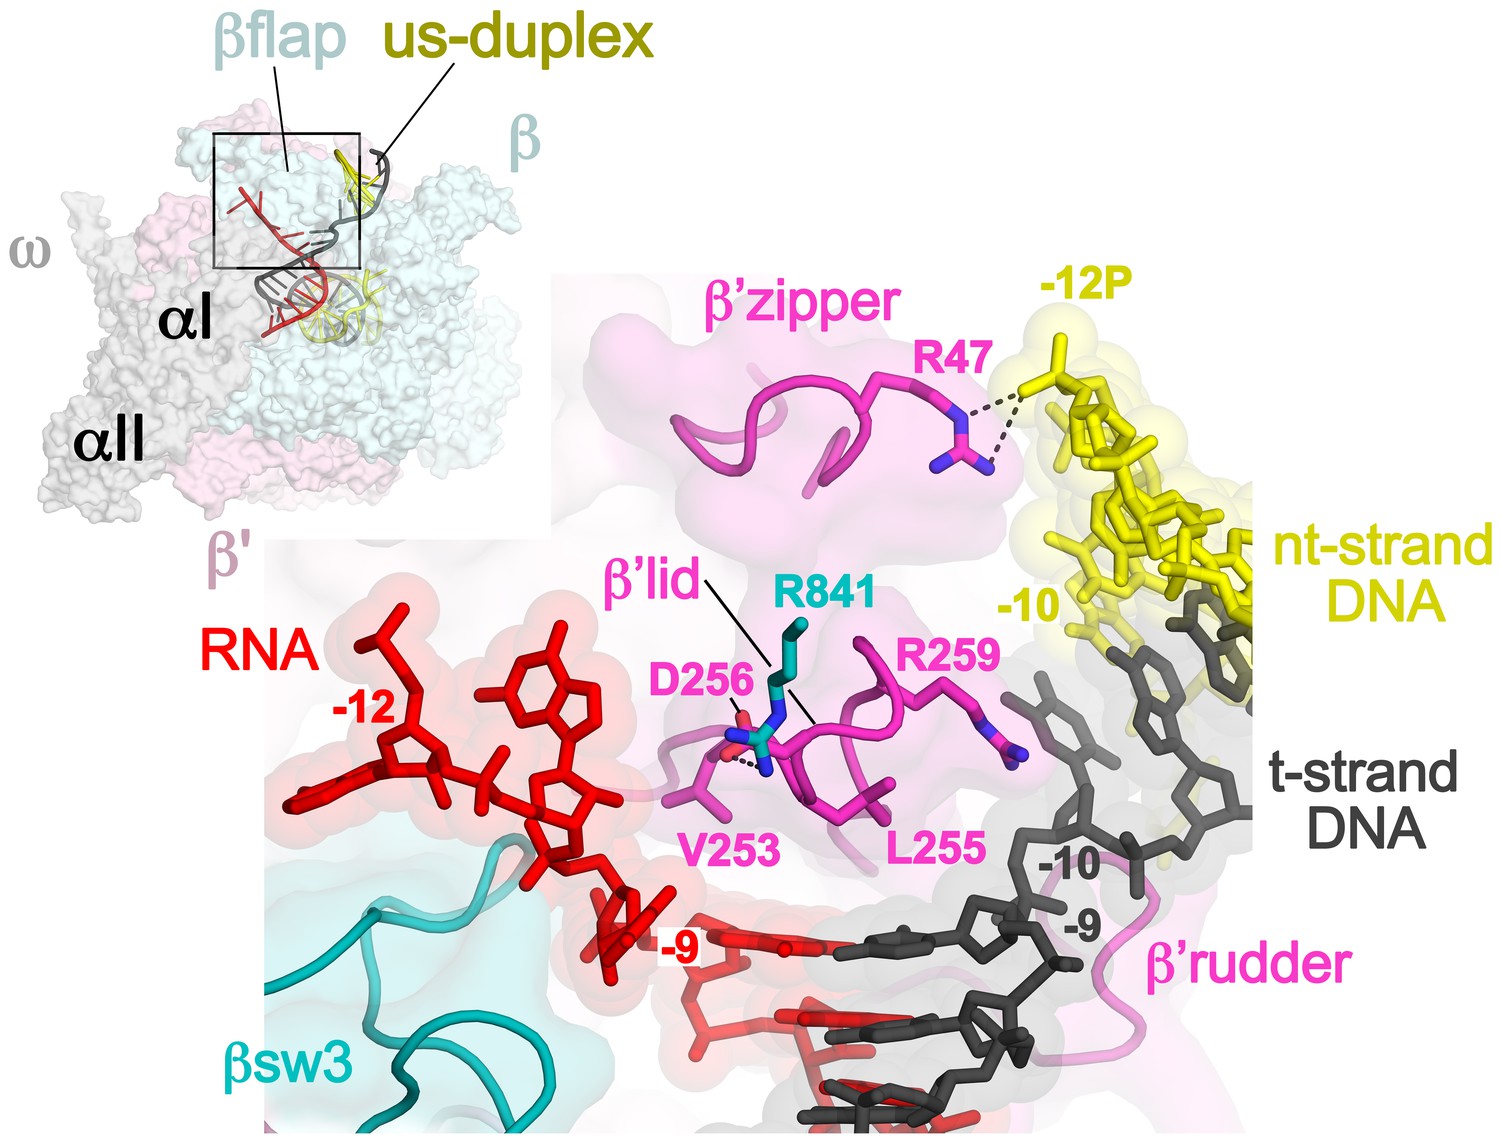
Disruption of the RNA/DNA hybrid and formation of the upstream duplex DNA in the TEC.
(top left) Overall view of the X-TEC-20A structure. The RNAP is shown as a transparent molecular surface, revealing the na-scaffold inside (shown in cartoon format). The boxed region is magnified below. (bottom right) Conserved structural elements of the RNAP (βsw3, light blue; β’zipper, β’lid, β’rudder, light magenta) disrupt the RNA/DNA hybrid, direct the upstream ssRNA into the RNA exit channel, and direct the upstream t-strand DNA to form the upstream duplex DNA.
Figure 3—figure supplement 1

Sequence logos showing sequence conservation in RNAP structural elements.
Bacterial – from an alignment of 814 bacterial RNAP sequences (Lane and Darst, 2010b). All – from an alignment of 1089 RNAP sequences (bacterial, plastid, archaeabacterial, eukaryotic RNAPs I, II, and III, and nuclear-cytoplasmic large double-stranded DNA virus RNAPs (Lane and Darst, 2010b).
Figure 3—figure supplement 2
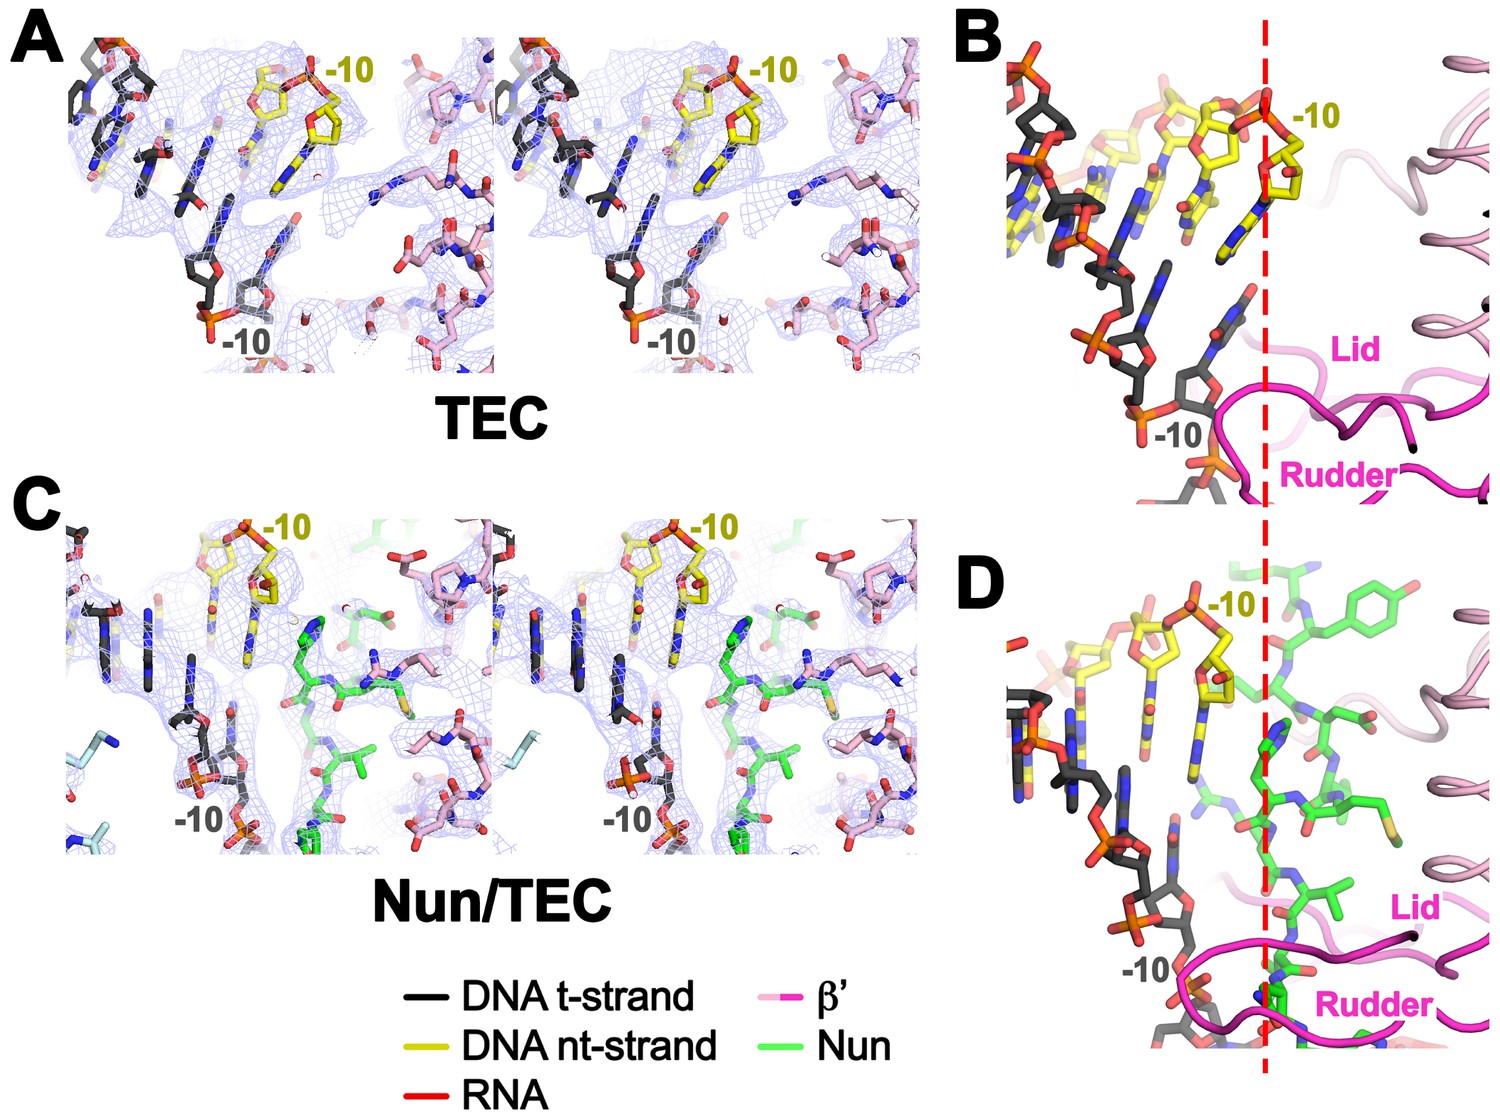
Upstream duplex DNA in the TEC and Nun/TEC.
(A) Stereo view showing the 4.05 Å resolution X-TEC-20A cryoEM density map (blue mesh) with the superimposed refined model (β’ subunit, pink; t-strand DNA, grey; nt-strand DNA, yellow) showing the upstream duplex DNA. (B) View of the X-TEC-20A upstream duplex DNA. (C) Stereo view showing the 3.74 Å resolution X-Nun/TEC-20A cryoEM density map (blue mesh) with the superimposed refined model (β’ subunit, pink; β subunit, light cyan; Nun, green; t-strand DNA, grey; nt-strand DNA, yellow) showing the upstream duplex DNA. (D) View of the X-Nun/TEC-20A upstream duplex DNA.
Figure 3—figure supplement 3
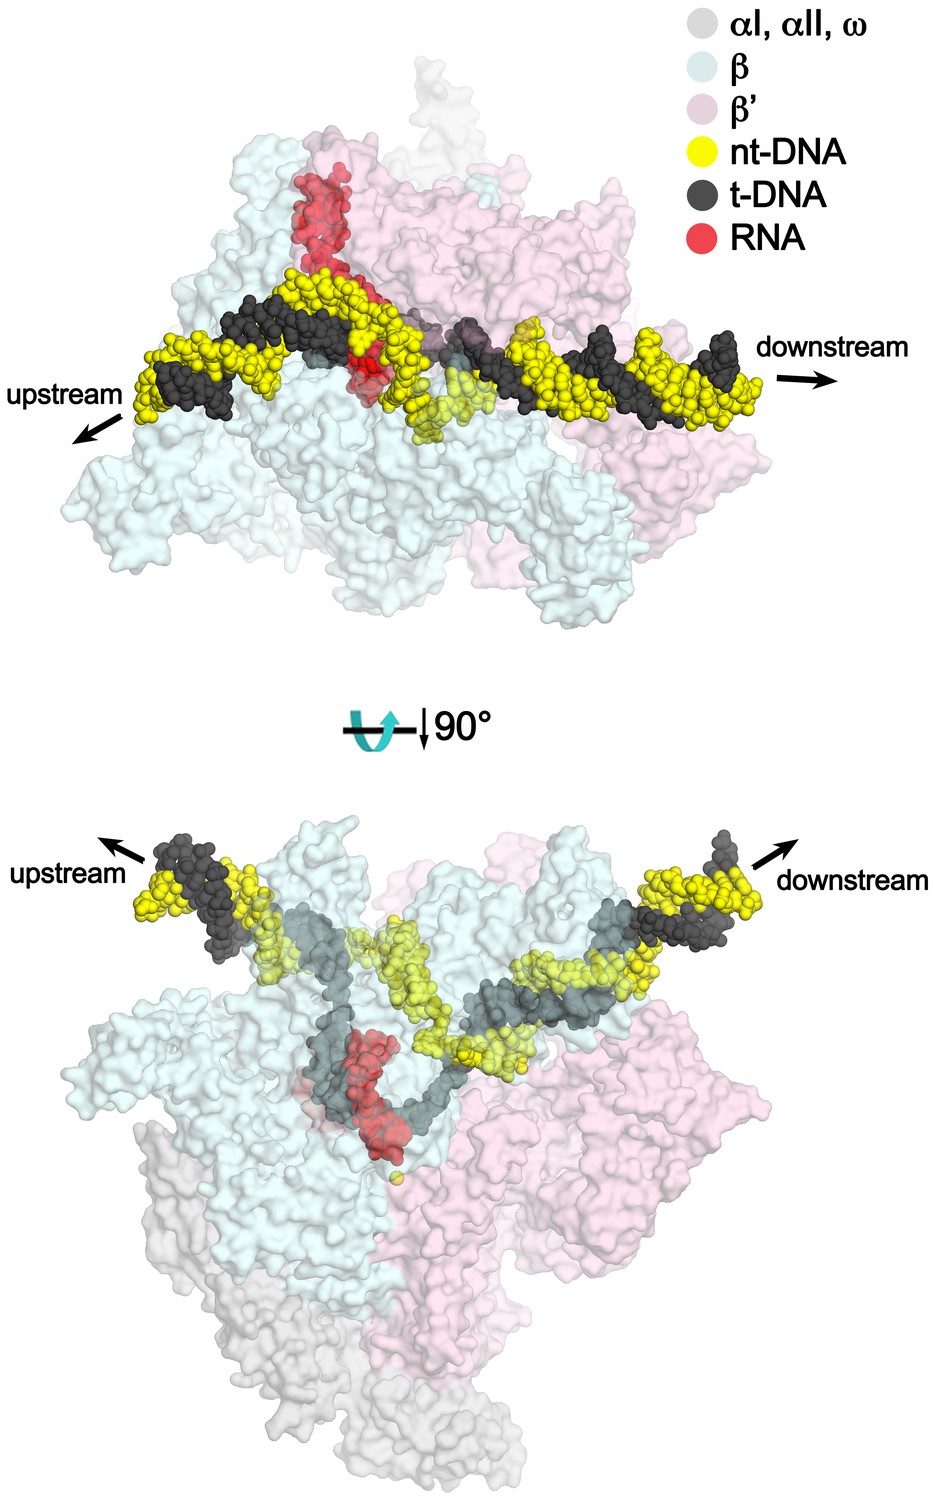
TEC model with extended upstream and downstream duplex DNA.
Two views of a model of the TEC containing extended upstream and downstream duplex DNA. Nun cryoEM density and Nun/TEC interactions. (A) The cryoEM density for Nun is shown (blue mesh) with the Nun molecular model (green) superimposed. Nun makes extensive interactions with the β’zipper, lid, and rudder of the RNAP (extent of interactions shown schematically by pink ovals). Specific polar interactions (H-bonds and salt bridges) with RNAP residues and with the na-scaffold are denoted (dashed black lines), including the intramolecular Nun interaction between the Nun C-terminus (S109) and Nun R102. (B) Close-up view of interactions between Nun H93 and R94 with the upstream DNA duplex −10 bp. (C) Close-up view of interactions between Nun N97, H98, and H100 with residues of the β’rudder, the RNA, and the t-strand DNA. Amino acid substitutions of the β’ residues colored yellow (R322H or D264G) yield Nun-resistant RNAP in vivo (Robledo et al., 1991). (D) Close-up view of interactions between Nun Q101-S109 with residues of the RNAP β subunit, the RNA, the nt-strand ssDNA, and the downstream duplex DNA. Amino acid substitutions of the β’ residues colored yellow (D329G) yields Nun-resistant RNAP in vivo (Robledo et al., 1991).
Figure 4 with 1 supplement
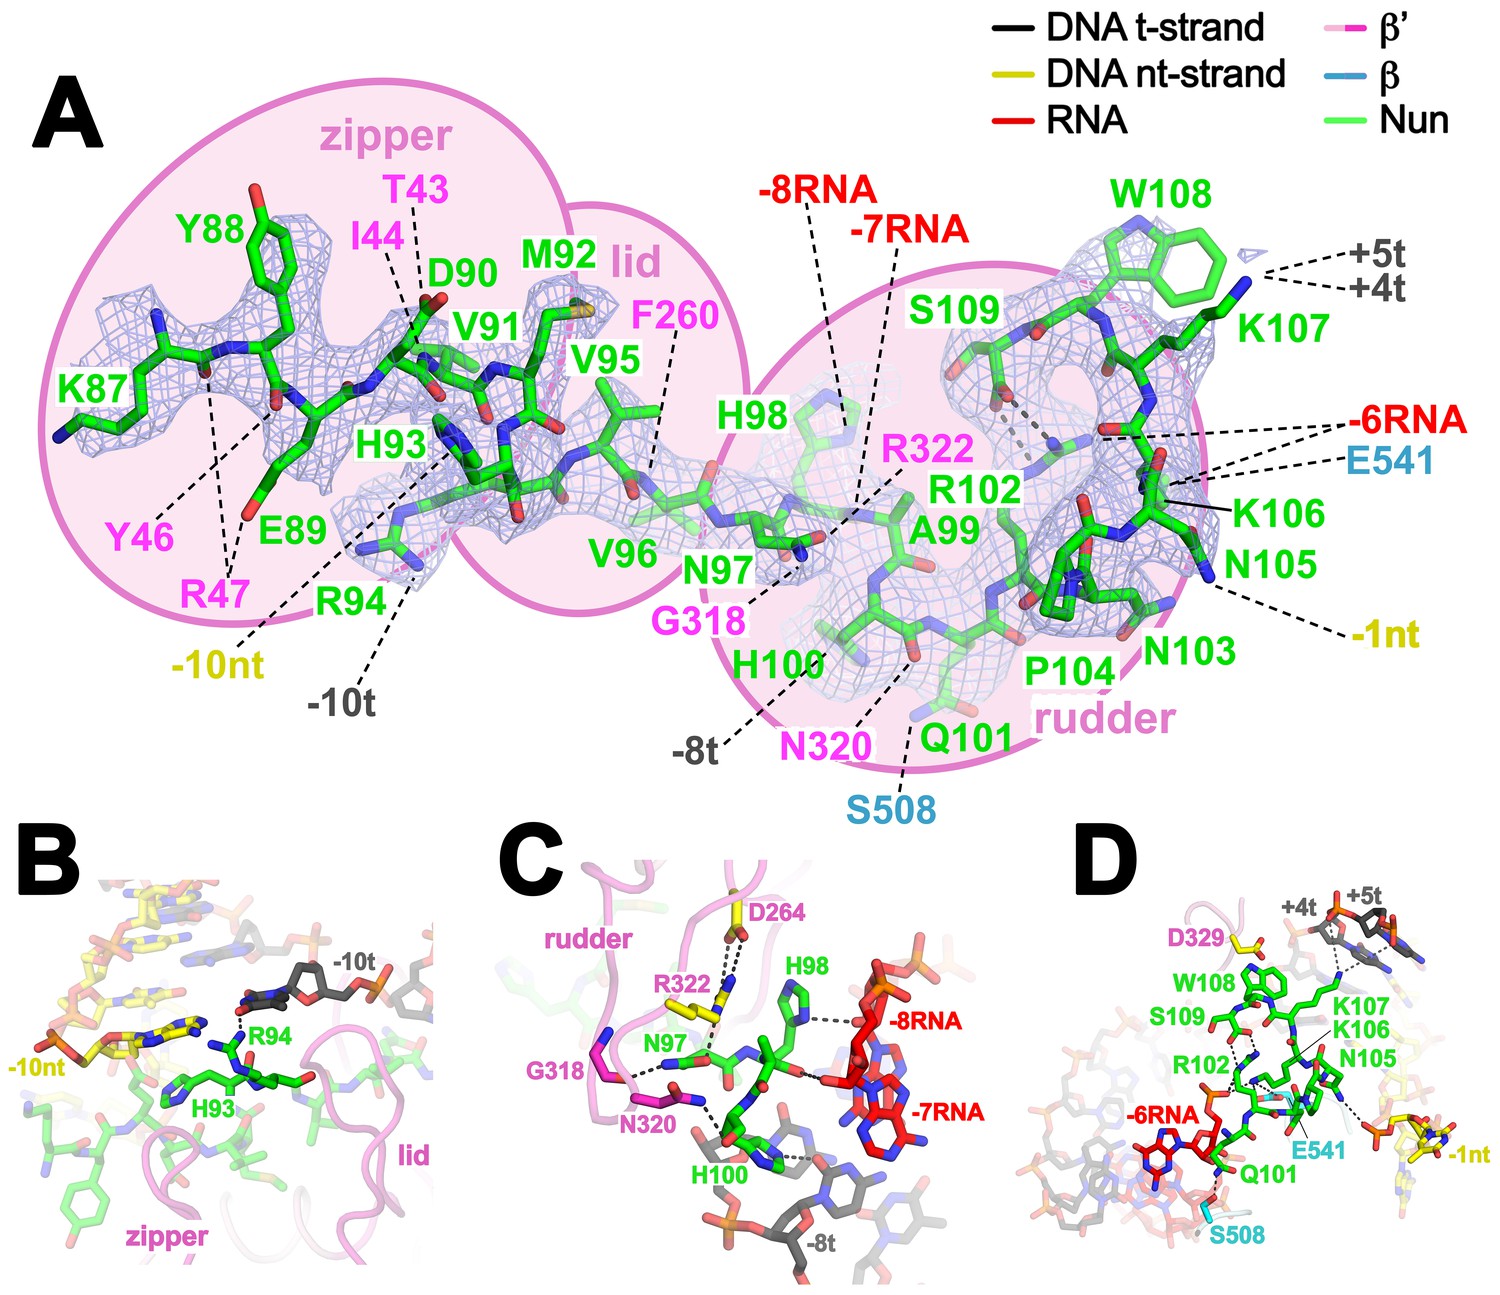
Nun cryoEM density and Nun/TEC interactions.
(A) The cryoEM density for Nun is shown (blue mesh) with the Nun molecular model (green) superimposed. Nun makes extensive interactions with the β’zipper, lid, and rudder of the RNAP (extent of interactions shown schematically by pink ovals). Specific polar interactions (H-bonds and salt bridges) with RNAP residues and with the na-scaffold are denoted (dashed black lines), including the intramolecular Nun interaction between the Nun C-terminus (S109) and Nun R102. (B) Close-up view of interactions between Nun H93 and R94 with the upstream DNA duplex -10 bp. (C) Close-up view of interactions between Nun N97, H98, and H100 with residues of the β’rudder, the RNA, and the t-strand DNA. Amino acid substitutions of the β’ residues colored yellow (R322H or D264G) yield Nun-resistant RNAP in vivo (Robledo et al., 1991). (D) Close-up view of interactions between Nun Q101-S109 with residues of the RNAP β' subunit, the RNA, the nt-strand ssDNA, and the downstream duplex DNA. Amino acid substitutions of the β' residues colored yellow (D329G) yields Nun-resistant RNAP in vivo (Robledo et al., 1991).
Figure 4—figure supplement 1
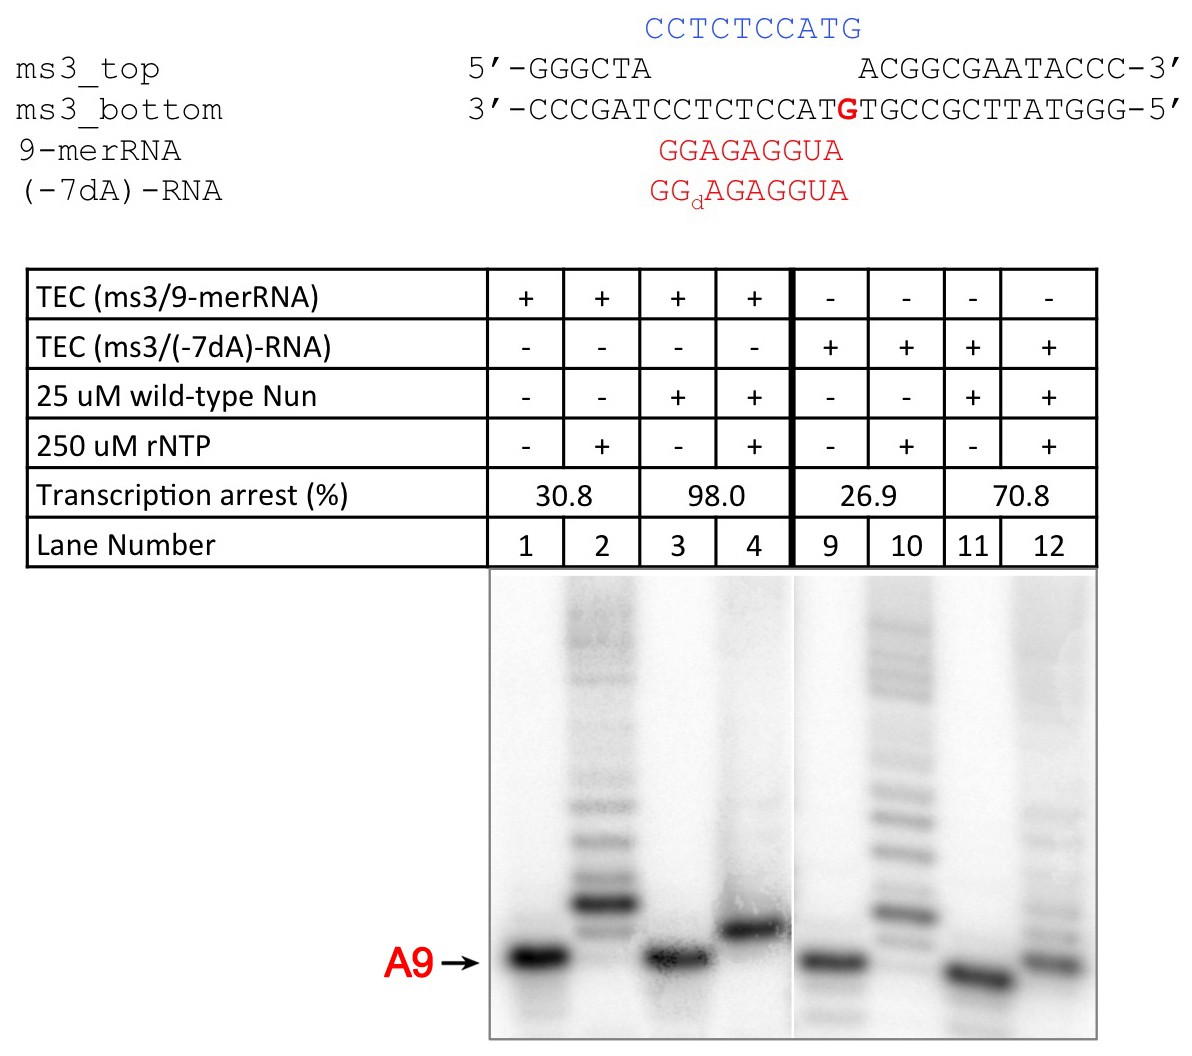
C10 extension assay showing -7 dA in RNA transcript reduces Nun function.
https://doi.org/10.7554/eLife.25478.018
Figure 5 with 1 supplement
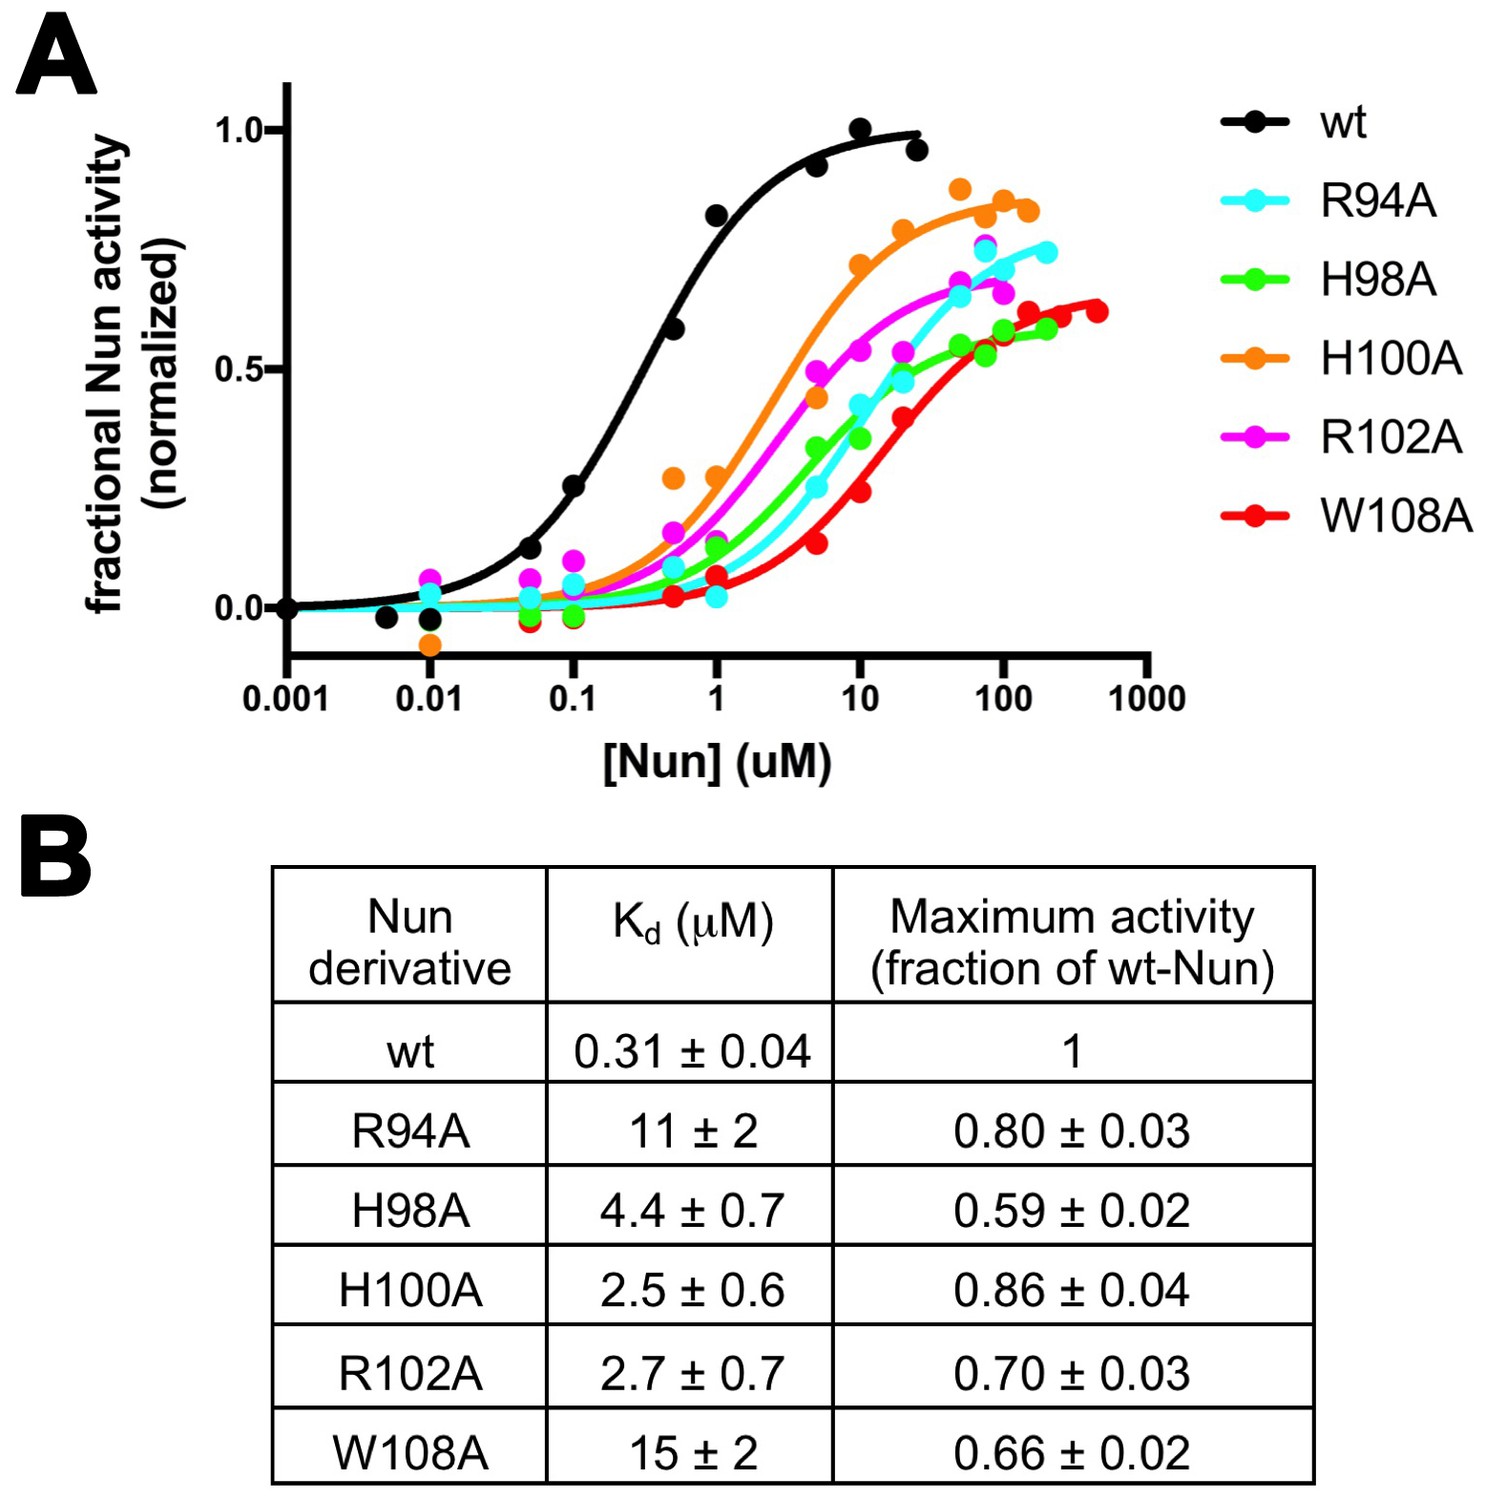
Effects of Nun substitutions on TEC binding and stalling of translocation.
(A) Semi-log plot showing fractional normalized Nun activity vs. Nun concentration for wt-Nun or Nun substitutions (color-coded as shown in the legend). (B) Table listing the apparent dissociation constant (Kd) and maximum activity (as a fraction of wt-Nun maximum activity) determined from fits of the titration curves shown in (A).
Figure 5—figure supplement 1
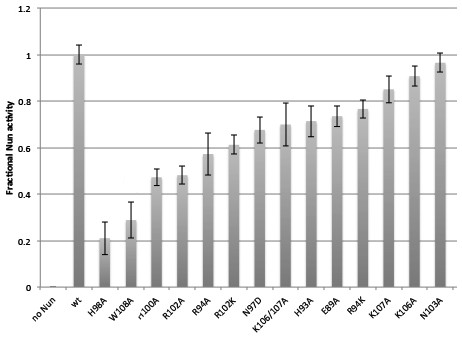
Fractional Nun activity for wt-Nun and mutants assayed at 20 µM Nun.
https://doi.org/10.7554/eLife.25478.020
Figure 6
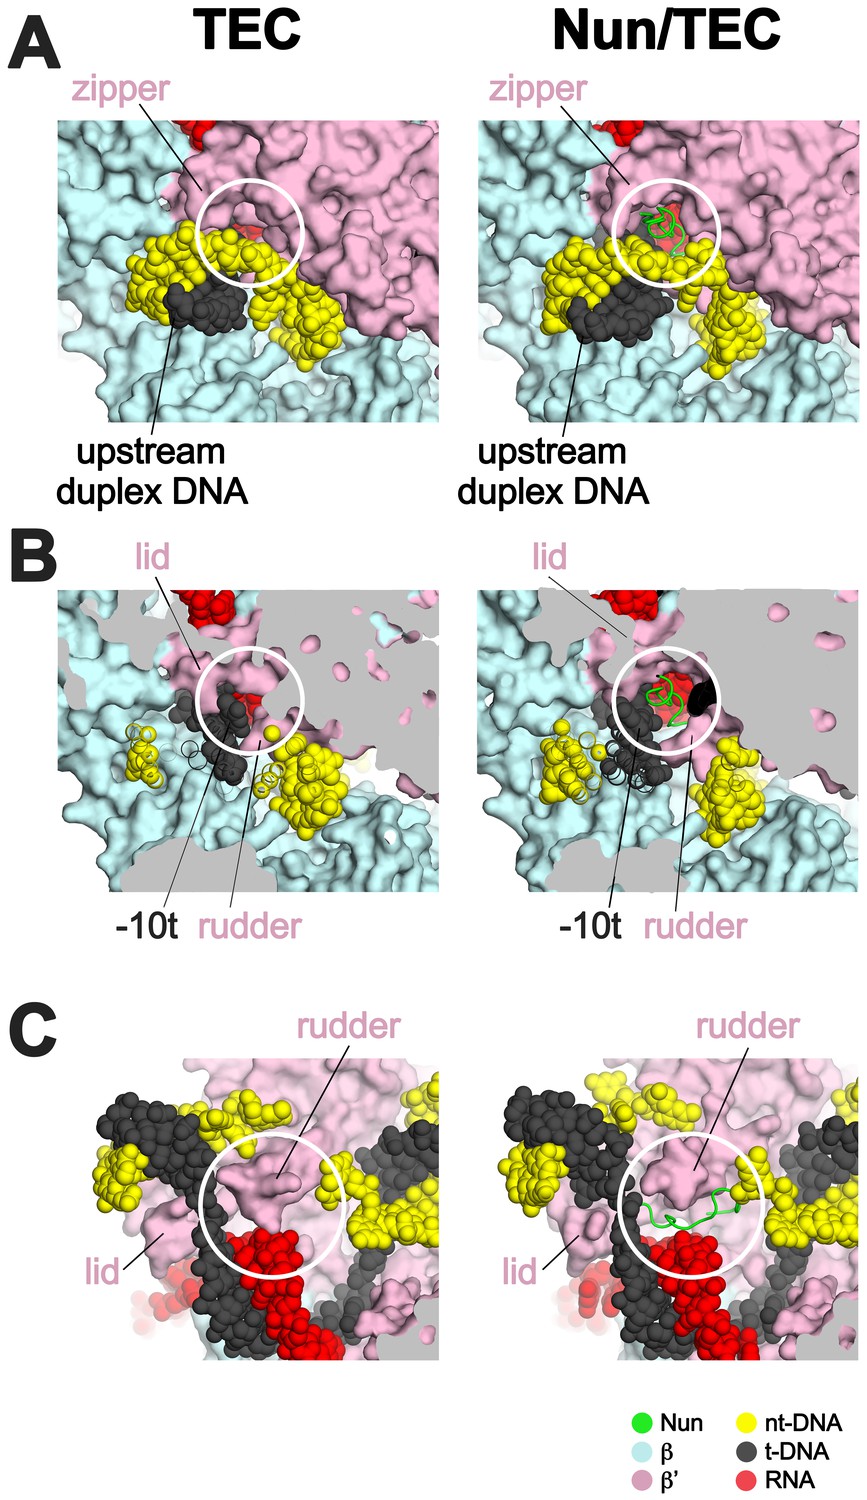
Nun takes advantage of gaps between the RNAP and the nucleic acids in the TEC.
Views of the X-TEC-20A (left column) and X-Nun/TEC-20A (right column) structures. The RNAP is shown as a molecular surface (color coding shown in the legend below). Nucleic acids are shown in CPK format. Nun is shown as a backbone worm. (A) Nun enters the complex through a gap between the zipper and the upstream duplex DNA. (B) Nun takes advantage of a gap between the lid, the rudder, and the t-strand DNA. (C) The C-terminal part of Nun binds in a pre-existing pocket next to the RNA/DNA hybrid and the rudder.
Figure 7
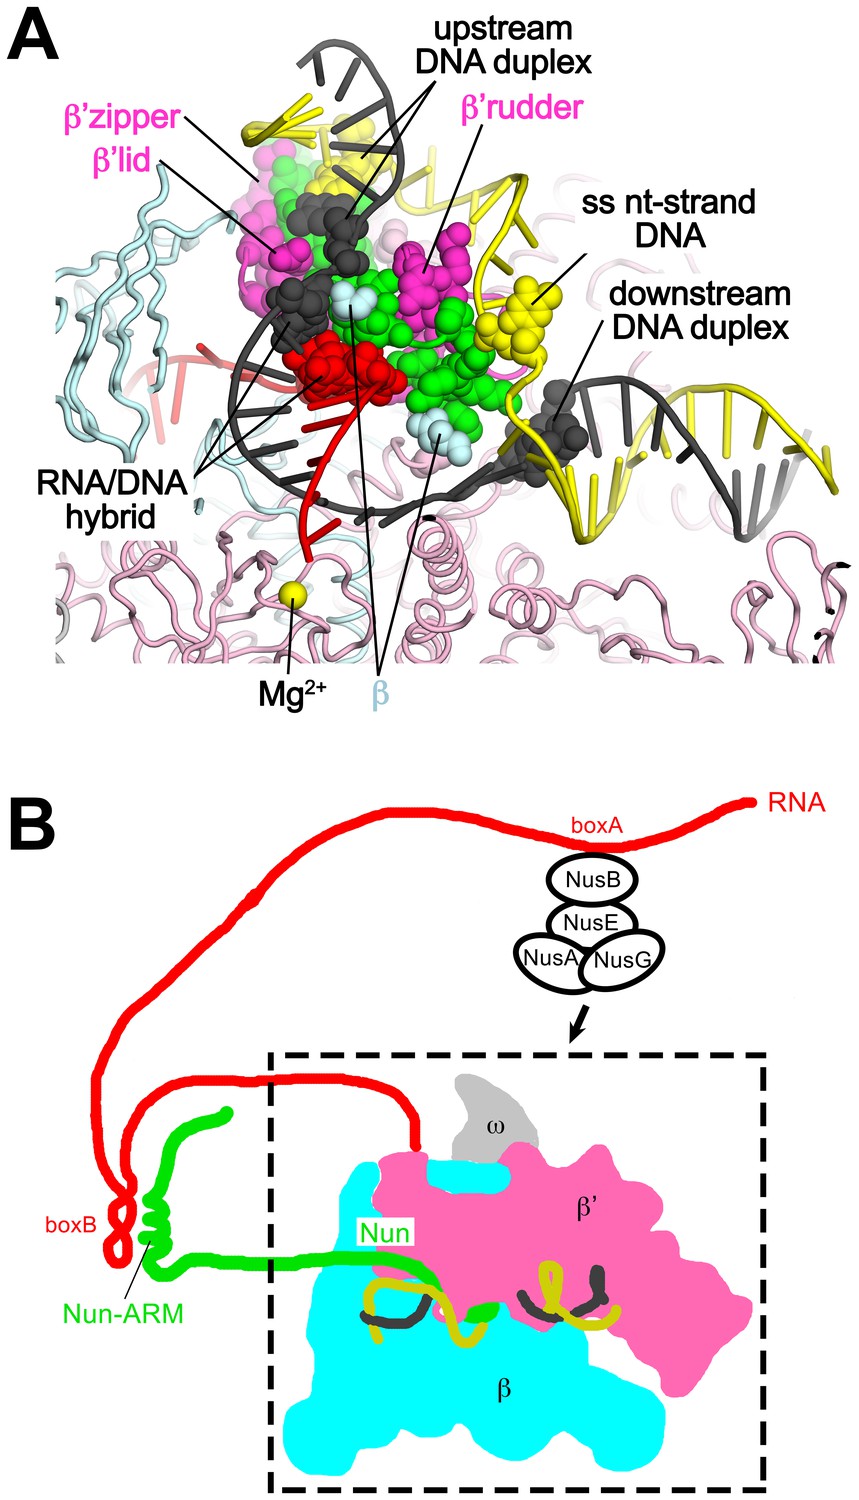
Nun mediates extensive interactions between the RNAP and the na-scaffold.
(A) View inside the RNAP active-site cleft where most of the β subunit has been removed (similar to Figure 2). The RNAP (β, light cyan; β’, light pink except the β’zipper, β’lid, and β’rudder are light magenta), Nun (green), and the na-scaffold (ntDNA, yellow; tDNA, dark grey; RNA, red) are shown in cartoon format except residues or nucleotides that interact with Nun are shown as CPK atoms. The RNAP active-site Mg2+-ion is shown as a yellow sphere. (B) Schematic illustrating in vivo action of Nun in the context of a λ nut TEC (carrying boxA and boxB RNA sequences) and Nus factors. The X-Nun/TEC structure determined here is contained within the dashed box (RNAP core, DNA template, Nun C-terminal segment). The N-terminal segment of Nun extends from the TEC, where the α-helical Nun-ARM interacts with the λ nut boxB RNA hairpin (Chattopadhyay et al., 1995; Faber et al., 2001), localizing Nun specifically to λ transcripts. Further upstream, the λ nut boxA RNA sequence interacts with NusB/E, and together with NusA/G stabilize the Nun/TEC complex and stimulate translocation arrest (Hung and Gottesman, 1995).
Additional files
-
Supplementary file 1
Model statistics from Molprobity (Chen et al., 2010).
- https://doi.org/10.7554/eLife.25478.023
-
Supplementary file 2
Results of superpositions of TEC models.
- https://doi.org/10.7554/eLife.25478.024
Download links
A two-part list of links to download the article, or parts of the article, in various formats.
Downloads (link to download the article as PDF)
Open citations (links to open the citations from this article in various online reference manager services)
Cite this article (links to download the citations from this article in formats compatible with various reference manager tools)
Structural basis of transcription arrest by coliphage HK022 Nun in an Escherichia coli RNA polymerase elongation complex
eLife 6:e25478.
https://doi.org/10.7554/eLife.25478


